
- Human Technology Research Institute, National Institute of Advanced Industrial Science and Technology, Tsukuba, Ibaraki, Japan
Using four experiments, this study investigates what amount of delay brings about maximal impairment under delayed visual feedback and whether a critical interval, such as that in audition, also exists in vision. The first experiment measured the Grooved Pegboard test performance as a function of visual feedback delays from 120 to 2120 ms in 16 steps. Performance sharply decreased until about 490 ms, then more gradually until 2120 ms, suggesting that two mechanisms were operating under delayed visual feedback. Since delayed visual feedback differs from delayed auditory feedback in that the former induces not only temporal but also spatial displacements between motor and sensory feedback, this difference could also exist in the mechanism responsible for spatial displacement. The second experiment was hence conducted to provide simultaneous haptic feedback together with delayed visual feedback to inform correct spatial position. The disruption was significantly ameliorated when information about spatial position was provided from a haptic source. The sharp decrease in performance of up to approximately 300 ms was followed by an almost flat performance. This is similar to the critical interval found in audition. Accordingly, the mechanism that caused the sharp decrease in performance in experiments 1 and 2 was probably mainly responsible for temporal disparity and is common across different modality–motor combinations, while the other mechanism that caused a rather gradual decrease in performance in experiment 1 was mainly responsible for spatial displacement. In experiments 3 and 4, the reliability of spatial information from the haptic source was reduced by wearing a glove or using a tool. When the reliability of spatial information was reduced, the data lay between those of experiments 1 and 2, and that a gradual decrease in performance partially reappeared. These results further support the notion that two mechanisms operate under delayed visual feedback.
Introduction
When a person speaking in a videoconferencing session hears his own delayed voice, his speech is usually interrupted. Such disruption in speech production due to delayed auditory feedback was first discovered by Lee (1950) and Black (1951), and has been extensively studied since then. Disruption due to delayed auditory feedback is not limited to speech production but also found in many other tasks such as musical performance (Gates et al., 1974; Pfordresher and Benitez, 2007), Morse code production (Howell et al., 1983), rhythmic handclapping (Kalmus et al., 1955), and finger tapping (Finney and Warren, 2002).
The important aspect of delayed auditory feedback is the delay of maximal impairment, or critical interval. It has been repeatedly found that speech is maximally disrupted by a delay of around 200 ms (Figure 1). The amount of disruption decreases at either lesser or greater amounts of delay (e.g., Black, 1951; Butler and Galloway, 1957; Fairbanks and Guttman, 1958; Mackay, 1968; Siegel et al., 1980). Similar critical intervals were also found for non-speech tasks. For example, Howell et al. (1983) reported that Morse code transmission was maximally impaired by a delay of nearly 200 ms, while Gates et al. (1974) reported that musical performance was maximally disrupted by a delay of around 270 ms.
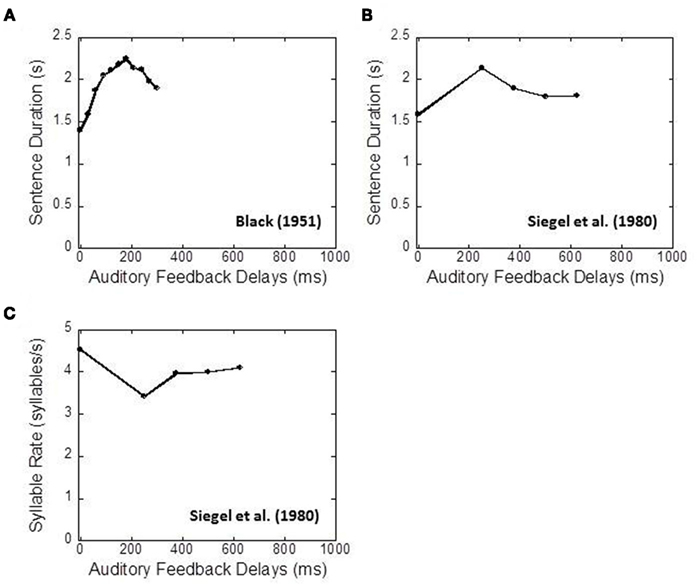
Figure 1. Examples of speech disruption under delayed auditory feedback. (A) Duration of reading five-syllable phrases. Replotted from Black (1951), Table 2. (B) Duration of reading seven-syllable phrases. Replotted from Siegel et al. (1980), Table 1. (C) Number of syllables produced per second. Replotted from Siegel et al. (1980), Table 1.
While the issue of whether the critical interval of delayed auditory feedback is determined by absolute timing or relative timing remains debatable (Mackay, 1968; Siegel et al., 1980; Finney and Warren, 2002; Pfordresher and Benitez, 2007; see Discussion for details), there is no controversy regarding the existence of critical interval itself of several hundred milliseconds in delayed auditory feedback.
Many studies have also been conducted on the delay between visual feedback and action. Smith et al. (1960) investigated the effects of delayed visual feedback on a number of simple visual–motor tasks such as writing, drawing, and star- or maze-tracing tasks, and reported that performance, especially that for non-writing tasks, was greatly impaired under delayed visual feedback. Other studies also found that delayed visual feedback impairs other tasks such as steering (e.g., Smith and Sussman, 1970) and manual tracking (e.g., Miall et al., 1985), and reduces the rate and amount of prism adaptation (Kitazawa et al., 1995; Tanaka et al., 2011).
However, although numerous studies have been conducted on visuo-motor delays, it has not yet been determined what amount of delay brings about maximal impairment under delayed visual feedback, or whether a critical interval, such as that in audition, also exists in vision.
A fundamental question about sensory–motor coordination is whether it is mediated by the mechanisms specific to each modality–motor combination or by a central universal process common to all modality–motor combinations. Several studies have reported different delay detection thresholds for different motor and sensory combinations. For instance, for haptic input and auditory response, the delay detection threshold using headphones was 24–40 ms (Adelstein et al., 2003). Meanwhile, for graphic user interfaces of computers, the delay threshold of graphical responses to mouse or typing motions was 100–200 ms (Dabrowski and Munson, 2001). Last but not least, the maximum allowable system latency for haptic displays that produce tactile stimuli in response to the hand movements of users was around 60 ms (Okamoto et al., 2009). These findings seem to support the notion that sensory–motor coordination is mediated by specific mechanisms for each sensory–motor combination.
On the other hand, studies also found evidence that sensory-motor coordination, at least in part, may be mediated by a central universal process common to all modality–motor combinations. For instance, some studies discovered that temporal lag adaptation occurs not only across multiple modalities (Fujisaki et al., 2004; Vroomen et al., 2004; Harrar and Harris, 2005, 2008; Navarra et al., 2005, 2009; Hanson et al., 2008; Keetels and Vroomen, 2008; Takahashi et al., 2008; Vatakis et al., 2008; Di Luca et al., 2009; Roseboom and Arnold, 2011) but also in sensory–motor processing (Cunningham et al., 2001; Stetson et al., 2006; Heron et al., 2009; Sugano et al., 2010). Other studies also found surprisingly similar cross-modal temporal binding limits for any combination of visual, auditory, and tactile modalities of around 2.5 Hz (Fujisaki and Nishida, 2010).
The present study aims to investigate the disruption of the delayed visual feedback as a function of visual feedback delays, focusing, in particular, on the tuning function of the disruption effect. Examining the tuning function will provide insights on how and by what mechanisms sensory and motor systems are coordinated, and whether they are mediated by mechanisms specific to each modality–motor combination or by a central universal process common to all modality–motor combinations. In this study, we parametrically varied the delay between action and visual feedback from 120 to 2120 ms in 16 steps to determine whether a critical interval similar to delayed auditory feedback can also be found in delayed visual feedback. Visuo-motor coordination is the fundamental ability to perform everyday tasks and actions; in its absence, one would be unable to carry out even the simplest actions such as moving within an environment, cooking, cleaning, drawing, writing, crafts, and playing sports, video games, and musical instruments. These daily actions may vary in numerous aspects such as their complexity, the aspects of motor function involved, the strength and precision of visual–motor coordination required, the encoding and maintenance of an action intention, and the retrieval and execution of motor plans for each action. For the present study, we have chosen a very simple task involving the Grooved Pegboard test, for investigating the tuning function of the disruption effect by delayed visual feedback. The apparatus consisted of 25 keyhole-shaped holes (five by five matrixes) with various orientations (Figures 2C–F). The participants were tasked to place as many pegs as possible into the keyhole-shaped holes, one peg at a time, within 1 min. This test requires precise visual–motor coordination since the pegs in the instrument must be rotated to match the orientations of keyhole-shaped holes. We chose this task for a number of reasons: (1) the Grooved Pegboard test is a very simple, well-defined objective measure of motor performance which can be easily understood, and whose score can be simply defined by the number of pegs correctly placed in the holes within a certain period of time; (2) it is a proven measure of upper extremity motor function which is standardized and commercially available; (3) it is widely used in research (c.f. Bryden and Roy, 2005), clinical practice, and neuropsychological assessment for adults (c.f. Metcalf et al., 2007); and (4) it is a more sensitive measure for visual–motor coordination than other standardized motor performance tests such as the Purdue Pegboard Test or the O’Connor Finger Dexterity Test.
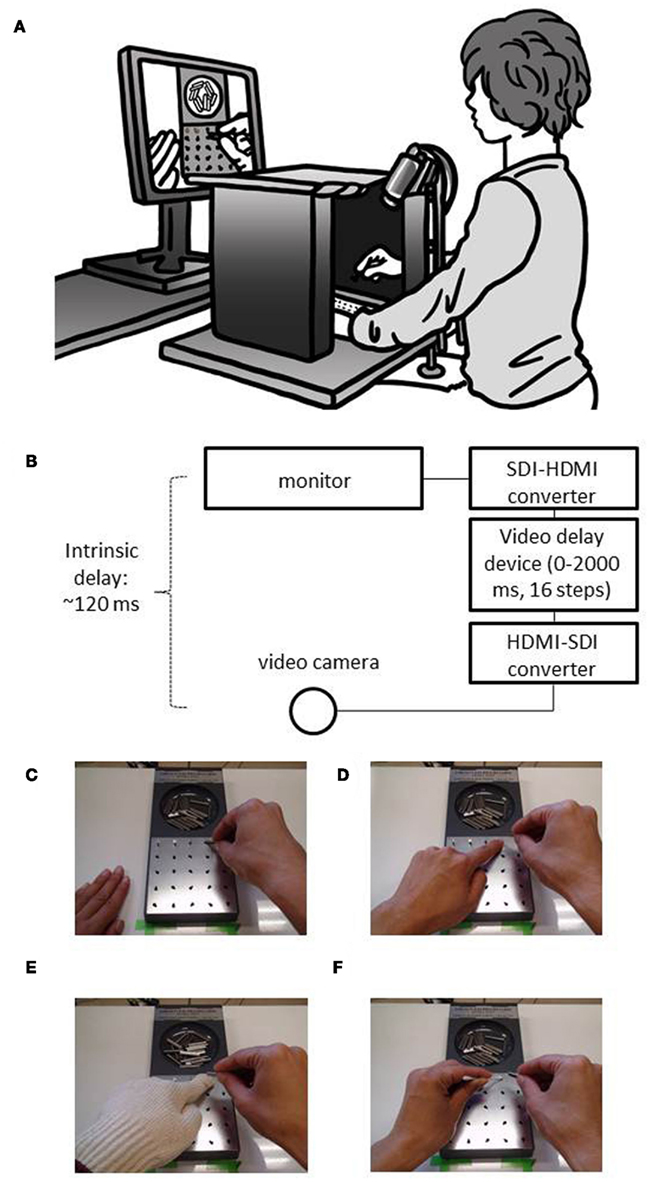
Figure 2. Experimental set up. (A,B) Illustration and diagram of the experimental set up. The participant sits at a table and puts both his hands on the table. The pegboard is placed in front of the participant. Both the participant’s hands and the pegboard apparatus were occluded by a black-cloth-covered cardboard, so that the participant could not see his own hand directly. Visual feedback delay was inserted using a hardware device. (C) Right hand only condition (experiment 1); (D) with left hand condition (experiment 2); (E) glove on the left hand condition (experiment 3); (F) cotton swab in the left hand condition (experiment 4).
In the first experiment, the pegboard test performance was measured as a function of visual feedback delays. The results showed that performance sharply decreased until about 490 ms, then more gradually until 2120 ms, suggesting two mechanisms operated under delayed visual feedback. The major difference between delayed auditory feedback and delayed visual feedback is that the latter induces not only temporal but also spatial displacements between motor and sensory feedback. Therefore, the second experiment was performed, providing simultaneous haptic feedback together with delayed visual feedback to inform correct spatial position. The results indicate that the disruption of visual delayed feedback was significantly ameliorated when information about spatial position was provided from a haptic source. In experiments 3 and 4, the reliability of spatial information from the haptic source was reduced by wearing a glove (experiment 3) or using a tool such as, in this case, a cotton swab (experiment 4). The results showed that when reliability of spatial information from the haptic source was reduced, the data lay between that of experiments 1 and 2.
Experiment 1
Method
Participants
Participants consisted of 24 paid female volunteers who were not informed of the purpose of the experiments. The participants were between 20 and 30 years old, right-handed, and had normal or corrected-to-normal vision. Informed consent was obtained before the experiment started. The experiment was approved by the Institutional Review Board of the National Institute of Advanced Industrial Science and Technology (AIST), and was performed in accordance with the declaration of Helsinki.
Experimental setup
Figures 2A,B illustrate the experimental setup. The participants were asked to sit at a table and put both their hands on it. The standard grooved pegboard apparatus (Lafayette Instruments, model 32025) was set in front of the participant, 15 cm away from the camera stand. Both the participants’ hands and the pegboard apparatus were occluded by black-cloth-covered cardboards so that the participants were not able to see their own hands directly. The participants were asked to perform the pegboard task not by seeing their own hands, but instead by watching the monitor screen placed in front of them.
The image of the hands and the pegboard was captured using a digital video camera (Sony Handycam, HDR-CX12), which was placed just below the participant’s chin, about 33 cm above the surface of the table. The recorded image was then presented on a liquid-crystal monitor (Nanao, FlexScan HD2452W-BK), which was placed 80 cm away from the participant. Systematic visual feedback delays (0–2000 ms, in 16 steps) were introduced using a hardware video delay device (Videotron, DLY-70HI/SD) connected to the video camera via a HDMI to SDI converter (Videotron, HMS-30) and to the monitor via a SDI to HDMI converter (Videotron, SHM-30).
The intrinsic delay, which includes all system delays from the digital video camera to the monitor as measured by an oscilloscope (Tektronix, TDS3014B), was about 120 ms. In addition to the initial 120 ms delay, there were additional delays ranging from 0 to 2000 ms controlled by the video delay device (Videotron, DLY-70HI/SD). In total, the resulting overall visual feedback delays ranged from 120 to 2120 ms.
The standard grooved pegboard test was used to measure the effect of visual feedback delays on manipulative dexterity. The pegboard apparatus (Lafayette instruments, model 32025) consisted of 25 keyhole-shaped holes (five by five matrixes) with various orientations (Figures 2C–F). Each peg had a small ridge running along lengthwise. Since the pegs must be rotated to match the orientations of keyhole-shaped holes, this test required complex visual–motor coordination.
Procedure
The experiment was conducted in a normally illuminated room. The participants were tasked to place as many pegs as possible into the holes using their right hand, one peg at a time, within 1 min. They were required to position pegs in a prescribed order, from left to right and from top to bottom. No participants were able to place all 25 pegs within 1 min. Their hands and the pegboard apparatus were occluded by black-cloth-covered cardboards, so that the participants were not able to see their own hands directly while performing the task. They were not allowed to use their left hand in this experiment (Figure 2C).
In the beginning of the experiment, participants performed five sessions with a 120 ms delay (= intrinsic delay) each. Each session lasted 1 min. Following the intrinsic delay sessions, 15 delayed visual feedback conditions (187, 253, 320, 387, 453, 620, 787, 953, 1120, 1287, 1453, 1620, 1787, 1953, and 2120 ms, all including an initial 120 ms delay) were conducted in a randomized order. Two sessions were conducted for each delay condition, resulting in a total of 30 sessions conducted. Delay-randomized sessions were separated into six blocks, with five sessions in each block. Each block lasted between 5 and 10 min. Participants took 5–10 min breaks between each block.
In each session, participants pressed a button when they were ready to start the session. A loud beep occurred 3 s after the button was pressed. Participants started when they heard the starting beep and stopped when they heard the ending beep, which occurred 1 min after the starting beep. Although participants used their right hand to place the pegs, they were not allowed to directly touch the board with their right hand. They were instructed to touch the pegboard only via the peg. The participants were also instructed when they drop a peg to not pick it up but instead to take anew one from the round receptacle for the pegs located at the top of the pegboard. The number of the pegs successfully placed by each participant within 1 min was recorded for each session.
Results
The purpose of the initial practice sessions was to let the participants be accustomed to the task in general, and to adapt to the baseline spatial displacement of visual feedback, since the visual feedback provided from the monitor was vertically placed apart from the workspace. Figure 3 presents the results from the initial five sessions (intrinsic delay = 120 ms condition). The horizontal axis shows the session numbers while the vertical axis shows the number of the pegs successfully placed within 1 min. The results show a rapid buildup of performance within five sessions in an intrinsic delay condition. A one-way within-participants ANOVA showed the significant main effect of session numbers [F(4,84) = 19.02, p < 0.00000000005], while a Bonferroni multiple comparison test showed that there were no significant (p = 0.05) differences between the fourth and fifth sessions, showing that the participants reached a stable performance level by the fourth session. This indicates that the participants had become accustomed to the task and had adapted to the baseline spatial displacement by the fourth session1. Based on these results, the first three sessions were considered as practice sessions, and only the data from the last two sessions were used in the analysis.
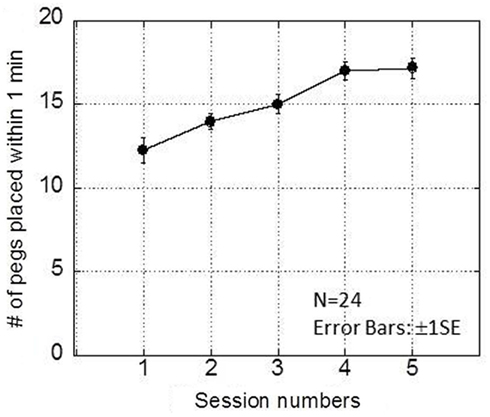
Figure 3. Results obtained in the intrinsic delay condition of experiment 1. This graph plots the number of pegs placed within 1 min as a function of session number. A rapid buildup of performance was observed within five sessions.
Figure 4A shows the performance of the pegboard task (number of pegs successfully placed within 1 min) as a function of the visual feedback delays from 120 to 2120 ms in 16 steps. A one-way repeated ANOVA showed the significant main effect of visual feedback delays [F(15,345) = 160.911, p < 0.00000000001], while a Bonferroni multiple comparison test indicated that the performance decreased as more visual feedback delays were inserted (Table 1).
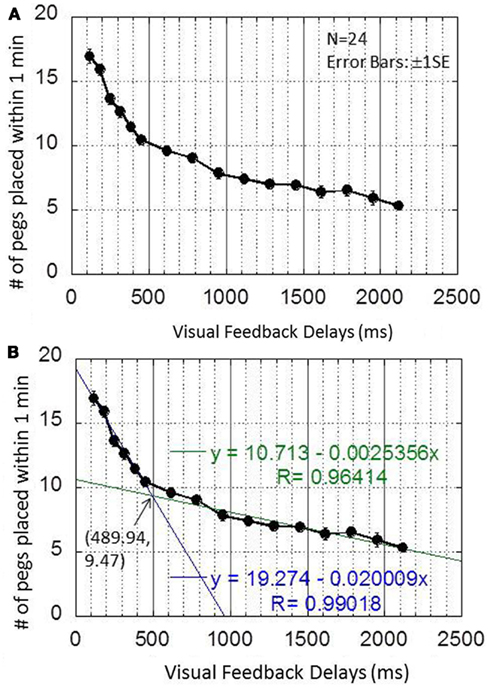
Figure 4. Results obtained in experiment 1. (A) This graph plots the pegboard task as a function of the visual feedback delays from 120 to 2120 ms in 16 steps. (B) This graph shows the two best-fit regression lines and their intersection points.
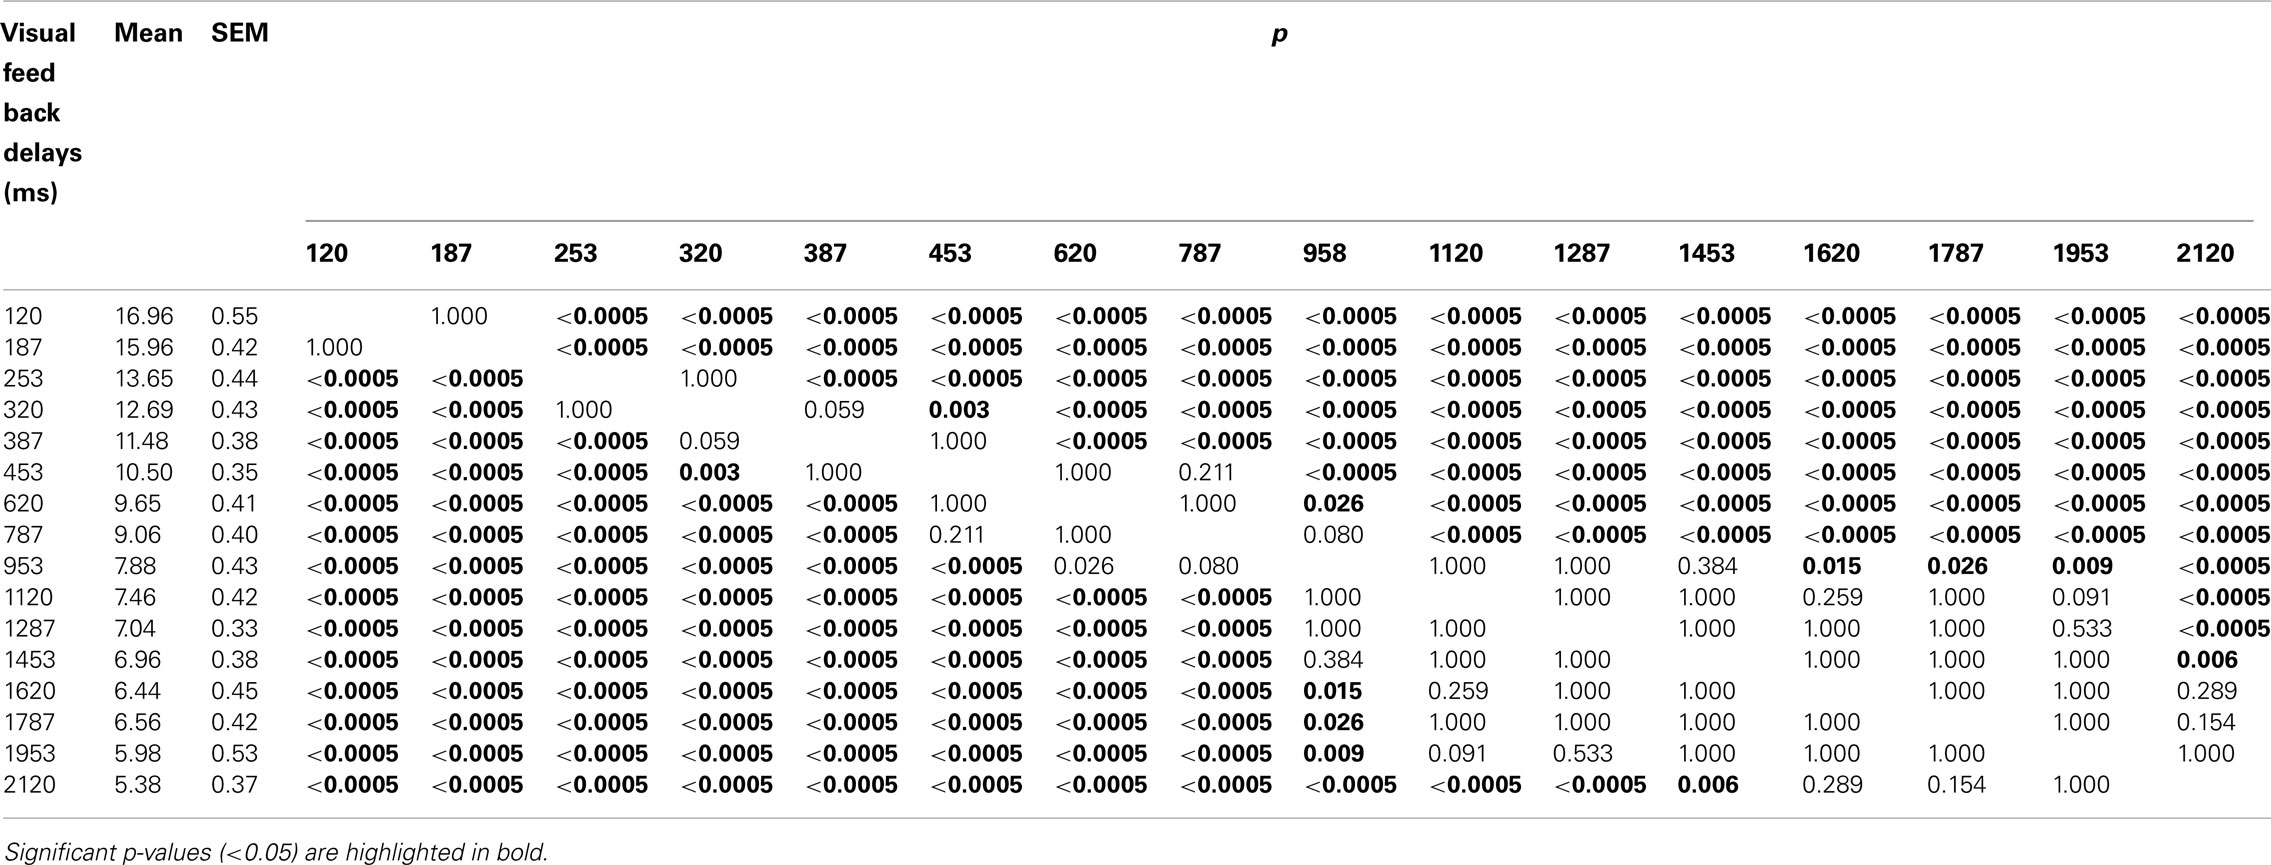
Table 1. Results of post hoc multiple comparisons (Bonferroni) of the effects of visual feedback delays on pegboard test performance.
As Figure 4B indicates, however, the decrease in performance was not always constant, and the data seemed to be characterized by two linear regressions. To find the breakpoint of the two linear regressions, the sum of the residual sum of squares were calculated for all possible combinations of the visual feedback delay condition pairs. Results show that the smallest value of the sum of residual sum of squares occurred when the breakpoint of the two regression lines lay between 453 and 620 ms. The two best-fit regression lines were then plotted from 120 to 453 ms and from 620 to 2120 ms (Figure 4B). The first line had an intercept of 19.274, a slope of −0.020009, and an R of 0.99. The second line had an intercept of 10.713, a slope of −0.0025356, and an R of 0.96. The intersection of the two lines (489.94, 9.47) was defined as the breakpoint.
These results indicate that performance sharply decreased until about 490 ms, then more gradually until 2120 ms, which is the measurement limit of the system. This suggests that at least two mechanisms operated under the delayed visual feedback. One mechanism, which only works up to several hundred milliseconds, caused a sharp decrease in performance, while another mechanism, which encompassed an entire range of delays, caused a rather gradual decrease in performance in proportion to the delay.
Experiment 2
The major difference between delayed auditory feedback and delayed visual feedback is that the latter not only induces temporal but also spatial displacements between motor and sensory feedback. If spatial displacement caused a gradual decrease in performance in experiment 1, it can be hypothesized that if correct spatial information is provided from another source, the decrease of performance will be reduced. The second experiment was therefore conducted to provide simultaneous haptic feedback together with delayed visual feedback to inform correct spatial position.
Method
Participants
Thirteen participants from experiment 1 also participated in this experiment. The method and procedures in this experiment were essentially the same as in the first experiment except for the following.
In experiment 2, the participants were allowed to use their left hand while performing the pegboard task (Figure 2D) so they could receive real-time haptic feedback together with delayed visual feedback. They could search for the position and orientation of the holes by using their left index finger.
Eight visual feedback delays (120, 187, 253, 320, 387, 453, 787, and 1120 ms, all including intrinsic delay) were introduced in this experiment.
Results
Figure 5 presents the results from experiment 2. The performance of the pegboard task is plotted as a function of the visual feedback delays from 120 to 1120 ms in 8 steps. The results obtained by the same 13 participants in experiment 1 are superimposed on the figure.
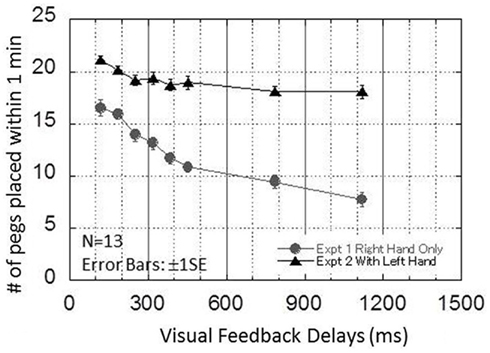
Figure 5. Results obtained in experiment 2. This graph plots the performance of the pegboard task as a function of the visual delays from 120 to 1120 ms in eight steps. The results obtained by the same 13 participants in experiment 1 are superimposed on the figure.
A one-way repeated ANOVA for the experiment 2 data showed the significant main effect of VISUAL FEEDBACK DELAYS [F(7, 84) = 9.445, p < 0.00000005]. Bonferroni multiple comparisons indicated that there were no significant differences from 387 to 1120 ms, and performance was almost flat after around 300 ms (Table 2).
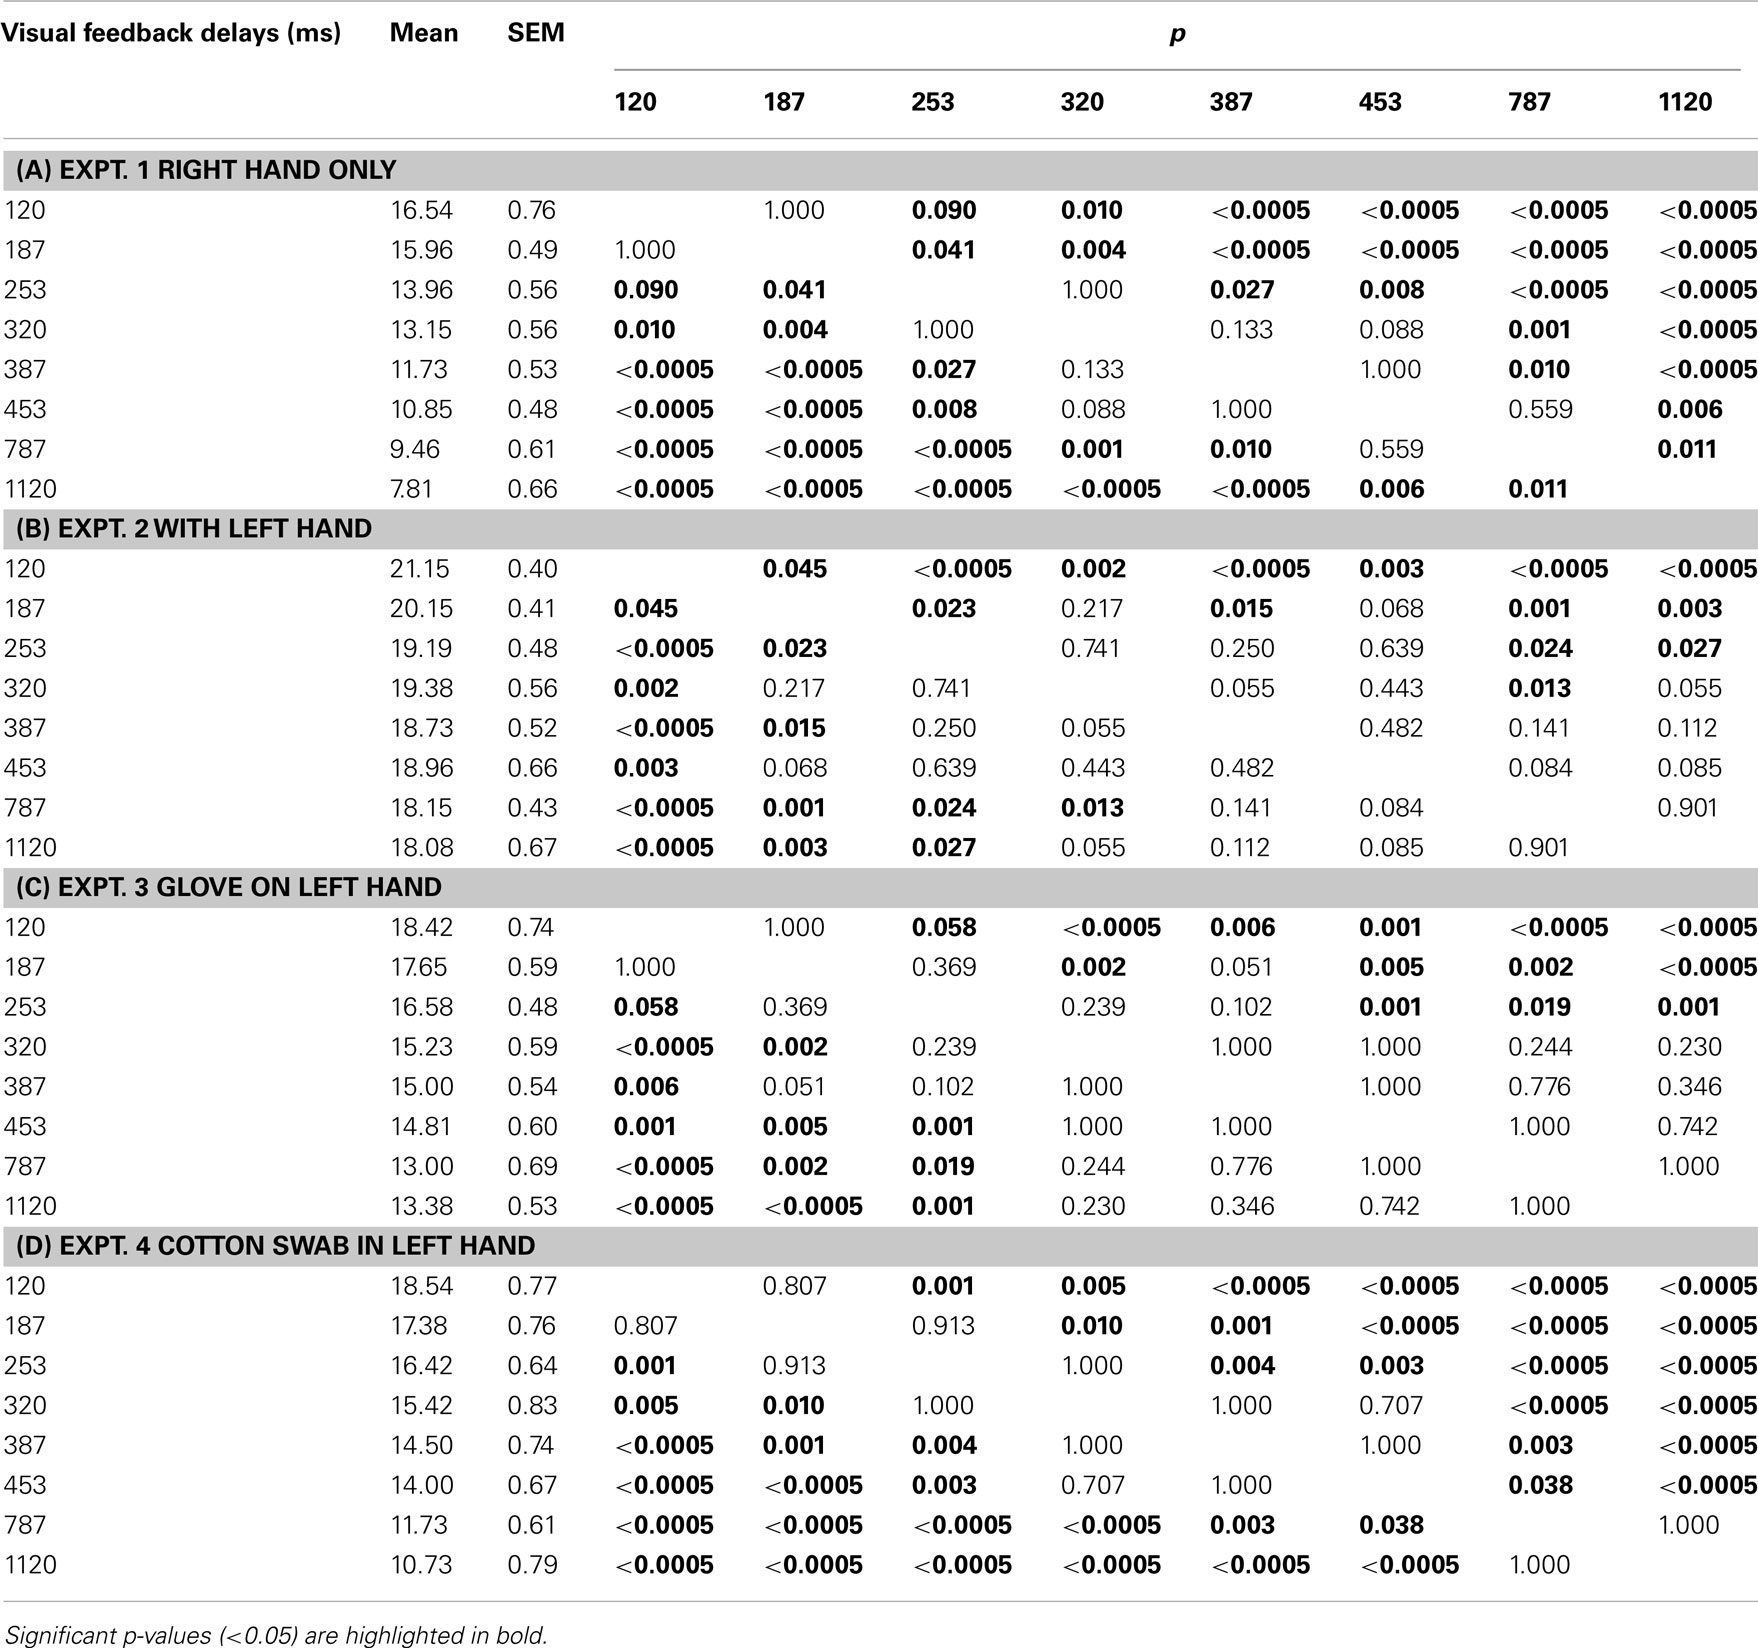
Table 2. Results of post hoc multiple comparisons (Bonferroni) of the effects of visual feedback delays on pegboard test performance in experiments 1, 2, 3, and 4 (N = 13).
To compare the results obtained from experiment 1 (right hand only) with that in experiment 2 (with left hand), a two-way repeated ANOVA was conducted using two factors: EXPERIMENT (1, 2) and VISUAL FEEDBACK DELAYS (120, 187, 253, 320, 387, 453, 787, 1120). Results showed that the interaction between EXPERIMENT and VISUAL FEEDBACK DELAYS was significant [F(7,84) = 17.665, p < 0.00000000001], confirming that the results from experiments 1 and 2 had different trends. Table 2 presents multiple comparisons of the results for the 13 participants in experiment 2. The results for the same 13 participants in experiment 1 are also shown in Table 2.
Since the interaction between EXPERIMENT and VISUAL FEEDBACK DELAYS was significant, the effect of EXPERIMENT was analyzed for each visual feedback delay condition. The results show that although different p-values were observed, the effect of EXPERIMENT was significant in all visual feedback delay conditions [120 ms: F(1,12) = 45.474, p < 0.00005; 186 ms: F(1,12) = 35.949, p < 0.0001; 253 ms: F(1,12) = 95.258, p < 0.0000005; 320 ms: F(1,12) = 95.665, p < 0.0000005; 386 ms: F(1,12) = 164.387, p < 0.00000005; 453 ms: F(1,12) = 103.698, p < 0.0000005; 786 ms: F(1,12) = 186.295, p < 0.00000005; 1120 ms: F(1,12) = 320.640, p < 0.000000001]. Overall, this indicated that the disruption of visual delayed feedback was significantly ameliorated when information about spatial position was provided from a haptic source.
In experiment 2, a sharp decrease in performance of up to approximately 300 ms was followed by an almost flat performance. This is similar to the critical interval found in other modalities, although recovery of performance for larger delays was not observed. The results suggest that the mechanism that caused the sharp decrease in performance in experiments 1 and 2 was mainly responsible for temporal disparity and is common across the different modality–motor combinations, while the other mechanism that caused a rather gradual decrease in performance in experiment 1 was mainly responsible for spatial displacement between vision and motion.
Experiment 3
If the results obtained in experiment 2 were truly caused by spatial information provided by a haptic source, then performance will be impaired if the spatial information from the haptic source was degraded. To test this hypothesis, a third experiment was performed which reduced the reliability of spatial information from a haptic source by making participants wear a glove.
Method
The method and participants in the experiment were the same as in experiment 2 with some exceptions. In experiment 3, the participants still used their left hand to perform the pegboard task, but were asked to wear a 100% cotton seamless knitted glove (seven-gage, ATOM, BP0850) on their left hand (Figure 2E). The participant could still receive haptic feedback together with delayed visual feedback, but in this experiment, haptic information was only received through the hand wearing the glove. This manipulation was done to reduce the reliability of spatial information provided from a haptic source.
Results
Figure 6 presents the results from experiment 3. The performance of the pegboard task (number of pegs successfully placed within 1 min) is plotted as a function of the visual feedback delays from 120 to 1120 ms in eight steps. The results by the same 13 participants in experiments 1 and 2 are superimposed on the figure. The figure indicates that the results obtained from experiment 3 lie between the results obtained from experiments 1 and 2.
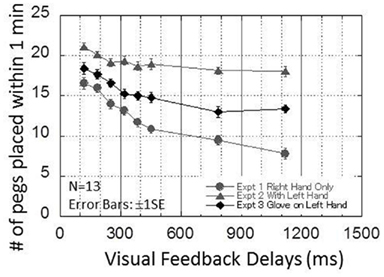
Figure 6. Results obtained in experiment 3. This graph plots the performance of the pegboard task as a function of the visual delays from 120 to 1120 ms in eight steps. The result obtained by the same 13 participants from experiments 1 and 2 are superimposed on the figure.
A one-way repeated ANOVA for the experiment 3 data showed the significant main effect of VISUAL FEEDBACK DELAYS [F(7,84) = 21.579, p < 0.00000000001]. Table 2 shows the results from a Bonferroni multiple comparison test for experiment 3. The results indicated that there were no significant differences from 320 to 1120 ms, similar to experiment 2.
To compare the results obtained in experiment 1 (right hand only) and experiment 3 (glove on the left hand), a two-way repeated ANOVA was conducted with two factors: EXPERIMENT (1, 3) and VISUAL FEEDBACK DELAYS (120, 187, 253, 320, 387, 453, 787, 1120). The results show that the interaction between EXPERIMENT and VISUAL FEEDBACK DELAYS was significant [F(7,84) = 5.030, p < 0.0001], suggesting that the results from experiments 1 and 3 had different trends.
Since the interaction between EXPERIMENT and VISUAL FEEDBACK DELAYS was significant, the effect of EXPERIMENT was analyzed for each visual feedback delay condition. The results show that although different p-values were observed, the effect of EXPERIMENT was significant in all visual feedback delay conditions [120 ms: F(1,12) = 7.964, p < 0.05; 186 ms: F(1,12) = 7.175, p < 0.05; 253 ms: F(1,12) = 17.052, p < 0.005; 320 ms: F(1,12) = 6.122, p < 0.05; 386 ms: F(1,12) = 74.741, p < 0.000005; 453 ms: F(1,12) = 47.788, p < 0.00005; 786 ms: F(1,12) = 18.830, p < 0.005; 1120 ms: F(1,12) = 54.563, p < 0.00001]. Overall, this indicated that even though the spatial information provided from the haptic source became less reliable by wearing a cotton glove, the disruption of performance by visual delayed feedback was still significantly ameliorated.
To compare the results obtained in experiment 2 (with left hand) and experiment 3 (glove on the left hand), another two-way repeated ANOVA was conducted with two factors: EXPERIMENT (2, 3) and VISUAL FEEDBACK DELAYS (120, 187, 253, 320, 387, 453, 787, 1120). The results showed that the interaction between EXPERIMENT and VISUAL FEEDBACK DELAYS was also significant [F(7,84) = 4.811, p < 0.0005], suggesting that the results from experiments 2 and 3 also had different trends.
Since the interaction between EXPERIMENT and VISUAL FEEDBACK DELAYS was significant, the effect of EXPERIMENT was analyzed for each visual feedback delay condition. The results show that although different p-values were observed, the effect of EXPERIMENT was significant in all visual feedback delay conditions [120 ms: F(1,12) = 13.026, p < 0.005; 186 ms: F(1,12) = 14.552, p < 0.005; 253 ms: F(1,12) = 15.791, p < 0.005; 320 ms: F(1,12) = 57.647, p < 0.00001; 386 ms: F(1,12) = 42.736, p < 0.00005; 453 ms: F(1,12) = 26.732, p < 0.0005; 786 ms: F(1,12) = 47.524, p < 0.00005; 1120 ms: F(1,12) = 48.535, p < 0.00005]. Overall, this indicates that the benefit of using a left hand was significantly reduced by wearing a glove in all delay conditions.
Experiment 4
A fourth experiment was performed which reduced the reliability of spatial information from a haptic source, but in a different manner from experiment 3, by using a tool (a cotton swab).
Method
The method and participants were the same as in experiments 2 and 3 with some exceptions. In experiment 4, the participants were asked to hold a cotton swab in the left hand while performing the pegboard task (Figure 2F). The rod of the cotton swab was made of paper and was about 7.5 cm long. The participant could still receive haptic feedback together with delayed visual feedback, but this time, haptic information was available only through the cotton swab. This manipulation was done to degrade the spatial information provided by the haptic source by using a tool, no tone’s hand.
Results
Figure 7 presents the results from experiment 4. The performance of the pegboard placement task is plotted as a function of the visual feedback delays from 120 to 1120 ms in 8 steps. The results of the same 13 participants in experiments 1, 2, and 3 are superimposed on the figure. The figure indicates that the results obtained in experiment 4 also lie between the results obtained in experiments 1 and 2.
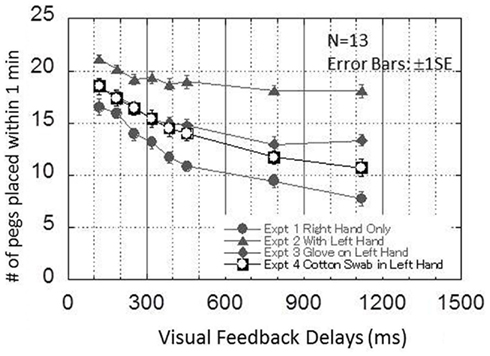
Figure 7. Results obtained in experiment 4. This graph plots the performance of the pegboard task as a function of the visual delays from 120 to 1120 ms in eight steps. The results obtained by the same 13 participants in experiments 1, 2, and 3 are superimposed on the figure.
A one-way repeated ANOVA for the experiment 4 data showed the significant main effect of visual feedback delays [F(7,84) = 57.843, p < 0.00000000001). Table 2 shows the results from a Bonferroni multiple comparison test for experiment 4. It was indicated that the performance decreased as more visual feedback delays were inserted, similar to experiment 1.
To compare the results obtained in experiment 1(right hand only) to that in experiment 4 (cotton swab in the left hand), a two-way repeated ANOVA was conducted with two factors: EXPERIMENT (1, 5) and VISUAL FEEDBACK DELAYS (120, 187, 253, 320, 387, 453, 787, 1120). Significant main effects for EXPERIMENT [F(1, 12) = 14.199, p < 0.005] and VISUAL FEEDBACK DELAYS [F(7, 84) = 107.023, p < 0.00000000001] were found. However, the interaction between the two factors was not significant [F(7,84) = 1.167, n.s.]. This lack of significant interaction between EXPERIMENT and VISUAL FEEDBACK DELAYS suggests that the results from experiments 1 and 4 had similar trends. The significant main effect for EXPERIMENT suggests that the information received through the cotton swab still ameliorated the disruption of performance by the visual feedback delays.
To compare the results obtained in experiment 2 (with left hand) to that in experiment 4 (cotton swab), another two-way repeated ANOVA was conducted with two factors: EXPERIMENT (2, 4) and VISUAL FEEDBACK DELAYS (120, 187, 253, 320, 387, 453, 787, 1120). The results show a significant interaction between EXPERIMENT and VISUAL FEEDBACK DELAYS [F(7,84) = 14.570, p < 0.000000000005] which suggests that the results from experiments 2 and 4 had different trends, while those for experiments 1 and 4 had similar trends.
Since the interaction between EXPERIMENT and VISUAL FEEDBACK DELAYS was significant, the effect of EXPERIMENT was analyzed for each visual feedback delay condition. The results show that although different p-values were observed, the effect of EXPERIMENT was significant in all visual feedback delay conditions [120 ms: F(1,12) = 11.343, p < 0.01; 186 ms: F(1,12) = 11.986, p < 0.01; 253 ms: F(1,12) = 13.781, p < 0.005; 320 ms: F(1,12) = 20.973, p < 0.005; 386 ms: F(1,12) = 18.765, p < 0.005; 453 ms: F(1,12) = 24.270, p < 0.0005; 786 ms: F(1,12) = 67.801, p < 0.000005; 1120 ms: F(1,12) = 61.364, p < 0.000005]. Overall, this indicates that the benefit of using a left hand was significantly reduced by having a cotton swab in the left hand in all delay conditions.
Finally, to compare the results obtained in experiment 3 (glove on the left hand) and experiment 4 (cotton swab in the left hand), another two-way repeated ANOVA was conducted with two factors: EXPERIMENT (3, 4) and VISUAL FEEDBACK DELAYS (120, 187, 253, 320, 387, 453, 787, 1120). The results show that the interaction between EXPERIMENT and VISUAL FEEDBACK DELAYS was significant [F(7,84) = 3.044, p < 0.01], although the main effect for EXPERIMENT was not significant [F(1,12) = 0.878, n.s.]. This significant interaction suggests that the results from experiments 3 and 4 had different trends. As mentioned above, the results from experiment 4 are more similar to experiment 1 than to the other experiments.
Discussion
Figure 8 shows a schematic representation of the possible models for delayed visual feedback, which may describe the results obtained in the present study. In experiment 1, performance sharply decreased until about 490 ms and then more gradually until 2120 ms, suggesting that two mechanisms operated under delayed visual feedback. One mechanism, which works up to several hundred milliseconds, caused a sharp decrease in performance, while another mechanism, which covers an entire range of delays (0–2120 ms), caused a rather gradual decrease in performance in proportion to the delay (Figure 8A).
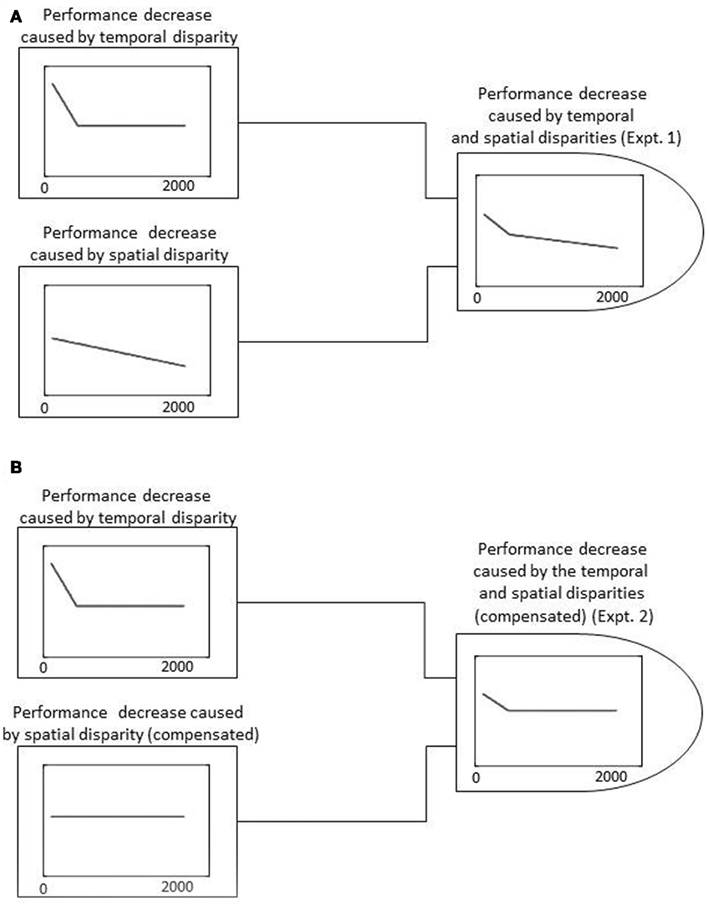
Figure 8. Schematic representation of possible models for delayed visual feedback. (A) Possible model for delayed visual feedback under the experiment 1 condition. The performance decrease caused by temporal disparity and spatial disparity are shown separately on the left, while the weighted summation of the two is shown on the right. (B) Possible model for delayed visual feedback under the experiment 2 condition. The performance decrease caused by the temporal and spatial disparities (compensated by a haptic source) are shown separately on the left, while the weighted summation of the two is shown on the right.
Since delayed visual feedback differs from delayed auditory feedback in that it induces not only temporal but also spatial displacements between motor and sensory feedback, this difference may also exist in the mechanism responsible for spatial displacement. The second experiment was therefore conducted to provide simultaneous haptic feedback together with delayed visual feedback to inform correct spatial position. The results indicated that the disruption of visual delayed feedback was significantly ameliorated when information about spatial position was provided from a haptic source. The sharp decrease in performance of up to approximately 300 ms was followed by an almost flat performance. This is similar to the critical interval found in other modalities, although the recovery of performance for larger delays was not observed. This suggests that the mechanism that caused the sharp decrease in performance in experiments 1 and 2 was mainly responsible for temporal disparity and is common across different modality–motor combinations, while the other mechanism that caused a rather gradual decrease in performance in experiment 1 was mainly responsible for spatial displacement between vision and action (model shown in Figure 8B).
Experiments 3 and 4 were conducted to reduce the reliability of spatial information from a haptic source by wearing a glove (experiment 3) or using a tool, in this case, a cotton swab (experiment 4). The results showed that when the reliability of spatial information from the haptic source was reduced, the data lay between those of experiments 1 and 2.
Although numerous studies have been conducted on visuo-motor delays, it has not yet been determined what amount of delay brings about maximal impairment under delayed visual feedback, or whether such a critical interval, like that in audition, also exists in vision. The issue of whether a critical interval exists in vision has not yet been examined in existing literature, presumably because of the complexity, difficulty, and varying dependence on spatial information of the tasks involved. This study is the first to demonstrate that when spatial displacement due to visual delayed feedback is compensated by having the correct spatial information from another modality, such as a haptic source, a similar critical interval was observed in vision. Although there was no reversal point found such as that in audition, other characteristics were found, such as steep performance decrease followed by a flat performance that were very similar to the critical interval in other modalities.
Findings by Blakemore et al. (1999) suggest that for tactile stimulations, a critical interval also exists between one’s own action and sensory feedback. In their experiment, participants’ tickly ratings for self-produced tactile stimulation progressively increased as the delay was increased between 0 and 200 ms, but no difference was found between 200 and 300 ms. In a recent study, Shimada et al. (2009) reported that to induce a strong sensation of a rubber hand illusion (Botvinick and Cohen, 1998), a temporal discrepancy of less than 300 ms between the visual stimulation of the rubber hand and the tactile stimulation of the participant’s own hand was ideal. Their results suggest that the time window of less than 300 ms is critical for multi-sensory integration process constituting the self-body image.
Although the present study was able to demonstrate that a similar critical interval was observed in vision when spatial displacement due to visual delayed feedback is compensated by correct spatial information from a haptic source, it was not able to determine why there was no reversal point found such as that in audition. The tactile studies mentioned above (Blakemore et al., 1999; Shimada et al., 2009) did not find such a reversal point either. This could be ascribed to the other differences besides spatial displacement, such as task- and temporal rate differences, found among the visual, tactile, and auditory delayed feedback experiments.
In the delayed auditory feedback, the tasks, which may include speech, playing music, Morse code production, hand clapping, and finger tapping, could be performed even when there was no auditory feedback provided. In contrast, the task of experiment 1 in the present study (right hand only) could not be performed if no visual feedback was provided at all, while the task of experiment 2 (with left hand), where simultaneous haptic feedback was provided, could be performed without visual feedback. Further studies using similar vision and audition tasks will provide more insight into the definition of critical interval and the presence and absence of reversal points.
The present study is also limited in that temporal rate was not systematically manipulated. Whether the critical interval of delayed auditory feedback is determined by absolute timing or relative timing is still debatable. For speech production, Mackay (1968) reported that the peak interference delay remained at 200 ms even when participants reduced their rate of speech. This has been considered as evidence that the critical interval was unaffected by speech rate. Siegel et al. (1980) also reported similar results, showing that a 250 ms delay was maximally disruptive for different speech rates. In contrast, Finney and Warren (2002) reported that the critical interval shifted with different tapping rates, with maximal impairment occurring when the delay approximately equaled the tapping rate. Pfordresher and Benitez (2007) also showed that the disruption for playing simple isochronous melodies on a keyboard, or tapping an isochronous beat, was best predicted by the phase location of feedback onsets. In the present study, however, it was difficult to control the temporal rates because each movement consisted of many small actions such as picking up a peg, moving it forward, rotating it, inserting it, and moving it back. Future studies where the temporal rate is controlled exactly between vision and audition will shed new light to our current knowledge of sensory–motor coordination and whether critical interval is determined in absolute or relative terms, and whether temporal rate is related to the presence and absence of a reversal point.
The present study aimed to investigate the disruption of delayed visual feedback as a function of visual feedback delays, focusing, in particular, on the tuning function of the disruption effect. In the present study, we utilized a very simple pegboard task, as a first step in investigating the tuning functions of disruption. The results strongly suggested that there were two mechanisms operating under delayed visual feedback, one for temporal and another for spatial disparities. It is still unclear whether the results can be generalized to other visuo-motor tasks, which differ from the current tasks in numerous aspects such as their complexity, the aspects of motor function involved, the strength and precision of visual–motor coordination required, the encoding and maintenance of an action intention, and the retrieval and execution of motor plans for each action. This issue requires further investigation.
It must also be noted that in the first experiment, the orientation of the target keyhole was visually provided, and subjects oriented the peg in their haptic space (a visuo-tactile process that involved cross-modal matching). However, in the following experiments (especially the second experiment), the orientation can be perceived in the haptic space (a tactile–tactile process that involved within-modal matching). Such differences in modality matching may explain the amelioration of performance in the second, third, and fourth experiments, a concern that prompted us to make a preliminary observation by using a pegboard with round-shaped holes (O’Connor Finger Dexterity Test), which does not have the orientation required in key-shaped holes. The preliminary data is shown in Figure 9. The results showed that even though it did not have any orientation, the overall tendency in the O’Connor Finger Dexterity Test was similar to that in the Grooved Pegboard test. This suggests that the tactile–tactile orientation matching may not fully explain the amelioration of performance in the second, third, and fourth experiments in the present study, although it is possible that the within-modal orientation matching additionally contributed to the amelioration of the disruption.
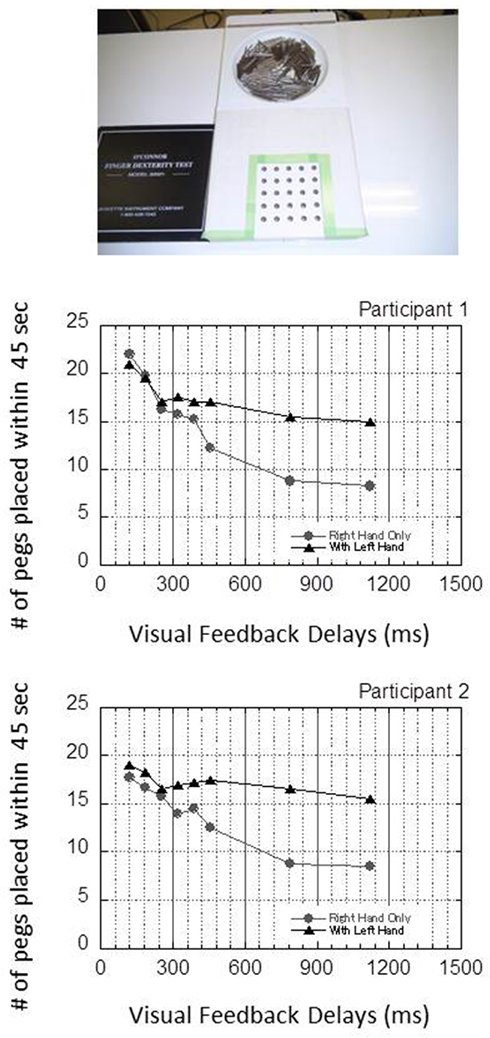
Figure 9. An additional experiment using the O’Connor Finger Dexterity Test, whose apparatus has round-shaped holes and therefore no orientation components, was performed to check whether the amelioration of disruption by using the left hand found in experiment 2 can be explained by the effect of orientation information provided from tactile–tactile, within-modal matching. In this experiment, the number of holes was restricted to 25, and the length of each trial to 45 s. The results showed that the overall tendency was similar to that in the Grooved Pegboard test even when no orientation information was provided, suggesting that the tactile–tactile orientation matching may not fully explain the amelioration of performance in the second, third, and fourth experiments.
The question of how spatial displacement in vision is compensated by touch and how additional haptic information contributed to ameliorate the disruption of visual delayed feedback remains. As this study has shown, information provided from the left hand is not limited only to spatial information, but also includes timing information. This is absolutely true for the left hand, but not for the right hand, as the right hand is unable to receive real-time haptic feedback until it reaches the pegboard.
These findings have significant implications for fields such as telesurgery, telemedicine, telesupport, e-learning, video games, and robotic control, where there are delays between vision and action. The present study showed that even when a visuo-motor task is extremely difficult under a delayed feedback condition, the impairment of performance can still be greatly ameliorated if other modalities are applied to acquire additional spatial information, even when this additional information is provided by a tool, not one’s hand. This suggests that dummies of remote environments such as in teleoperations may be used to collect information about the working space, and that information, even if less than ideal, can still help considerably.
Conflict of Interest Statement
The author declares that the research was conducted in the absence of any commercial or financial relationships that could be construed as a potential conflict of interest.
Acknowledgments
The author would like to thank Hiroyasu Ujike and Hiroshi Endo for comments and discussions during the progress of this work, and Shin’ya Nishida for comments regarding an earlier draft. This work was partially supported by a Grant-in-Aid for Young Scientists (23730720) from the Japan Society for the Promotion of Science (JSPS).
Footnote
- ^The time course of adaptation for the baseline displacements seemed quick, presumably because the participants are accustomed to the displacement between the computer mouse and the monitor screen through the daily experience of using computers. Although there is a possibility that the participants did not fully adapt to the baseline displacement between the monitor and workspace during the initial practice sessions, the experimental set up remained unchanged throughout all the experiments, and the visual feedback delays were randomly presented. Therefore, the learning effect for the baseline spatial displacement, even if it existed, would have been cancelled among the participants.
References
Adelstein, B. D., Begault, D. R., Anderson, M. R., and Wenzel, E. M. (2003). “Sensitivity to haptic-audio Asynchrony,” in The Fifth International Conference on Multimodal Interface (Vancouver: Vancouver), 73–76.
Black, J. W. (1951). The effect of delayed side-tone upon vocal rate and intensity. J. Speech Hear. Disord. 16, 56–60
Blakemore, S. J., Frith, C. D., and Wolpert, D. M. (1999). Spatio-temporal prediction modulates the perception of self-produced stimuli. J. Cogn. Neurosci. 11, 551–559
Bryden, P. J., and Roy, E. A. (2005). A new method of administering the Grooved Pegboard Test: performance as a function of handedness and sex. Brain Cogn. 58, 258–268.
Butler, R. A., and Galloway, F. T. (1957). Factoral analysis of the delayed speech feedback phenomenon. J. Acoust. Soc. Am. 29, 632–635.
Cunningham, D. W., Billock, V. A., and Tsou, B. H. (2001). Sensorimotor adaptation to violations of temporal contiguity. Psychol. Sci. 12, 532–535.
Dabrowski, J. R., and Munson, E. V. (2001). “Is 100 milliseconds too fast?” in The CHI 2001 Conference on Human Factors in Computing Systems (Seattle: Seattle), 317–318.
Di Luca, M., Machulla, T. K., and Ernst, M. O. (2009). Recalibration of multisensory simultaneity: cross-modal transfer coincides with a change in perceptual latency. J. Vis. 9(12)::7, 1–16.
Fairbanks, G., and Guttman, N. (1958). Effects of delayed auditory feedback upon articulation. J. Speech Hear. Res. 1, 12–22.
Finney, S. A., and Warren, W. H. (2002). Delayed auditory feedback and rhythmic tapping: evidence for a critical interval shift. Percept. Psychophys. 64, 896–908.
Fujisaki, W., and Nishida, S. (2010). A common perceptual temporal limit of binding synchronous inputs across different sensory attributes and modalities. Proc. R. Soc. B Biol. Sci. 277, 2281–2290.
Fujisaki, W., Shimojo, S., Kashino, M., and Nishida, S. (2004). Recalibration of audiovisual simultaneity. Nat. Neurosci. 7, 773–778.
Gates, A., Bradshaw, J. L., and Nettleto, N. C. (1974). Effect of different delayed auditory-feedback intervals on a music performance task. Percept. Psychophys. 15, 21–25.
Hanson, J. V. M., Heron, J., and Whitaker, D. (2008). Recalibration of perceived time across sensory modalities. Exp. Brain Res. 185, 347–352.
Harrar, V., and Harris, L. R. (2005). Simultaneity constancy: detecting events with touch and vision. Exp. Brain Res. 166, 465–473.
Harrar, V., and Harris, L. R. (2008). The effect of exposure to asynchronous audio, visual, and tactile stimulus combinations on the perception of simultaneity. Exp. Brain Res. 186, 517–524.
Heron, J., Hanson, J. V., and Whitaker, D. (2009). Effect before cause: supramodal recalibration of sensorimotor timing. PLoS ONE 4, e7681. doi:10.1371/journal.pone.0007681
Howell, P., Powell, D. J., and Khan, L. (1983). Amplitude contour of the delayed signal and interference in delayed auditory feedback tasks. J. Exp. Psychol. Hum. Percept. Perform. 9, 772–784.
Kalmus, H., Denes, P., and Fry, D. B. (1955). Effect of delayed acoustic feed-back on some non-vocal activities. Nature 175, 1078.
Keetels, M., and Vroomen, J. (2008). Temporal recalibration to tactile-visual asynchronous stimuli. Neurosci. Lett. 430, 130–134.
Kitazawa, S., Kohno, T., and Uka, T. (1995). Effects of delayed visual information on the rate and amount of prism adaptation in the human. J. Neurosci. 15, 7644–7652.
Mackay, D. G. (1968). Metamorphosis of a critical interval – age-linked changes in delay in auditory feedback that produces maximal disruption of speech. J. Acoust. Soc. Am. 43, 811.
Metcalf, C., Adams, J., Burridge, J., Yule, V., and Chappell, P. (2007). A review of clinical upper limb assessments within the framework of the WHO ICF. Musculoskeletal Care 5, 160–173.
Miall, R. C., Weir, D. J., and Stein, J. F. (1985). Visuomotor tracking with delayed visual feedback. Neuroscience 16, 511–520.
Navarra, J., Hartcher-O’Brien, J., Piazza, E., and Spence, C. (2009). Adaptation to audiovisual asynchrony modulates the speeded detection of sound. Proc. Natl. Acad. Sci. U.S.A. 106, 9169–9173.
Navarra, J., Vatakis, A., Zampini, M., Soto-Faraco, S., Humphreys, W., and Spence, C. (2005). Exposure to asynchronous audiovisual speech extends the temporal window for audiovisual integration. Cogn. Brain Res. 25, 499–507.
Okamoto, S., Konyo, M., Saga, S., and Tadokoro, S. (2009). Detectability and perceptual consequences of delayed feedback in a vibrotactile texture display. IEEE Trans. Haptics 2, 73–84.
Pfordresher, P. Q., and Benitez, B. (2007). Temporal coordination between actions and sound during sequence production. Hum. Mov. Sci. 26, 742–756.
Roseboom, W., and Arnold, D. H. (2011). Twice upon a time: multiple concurrent temporal recalibrations of audiovisual speech. Psychol. Sci. 22, 872–877.
Shimada, S., Fukuda, K., and Hiraki, K. (2009). Rubber hand illusion under delayed visual feedback. PLoS ONE 4, e6185. doi:10.1371/journal.pone.0006185
Siegel, G. M., Fehst, C. A., Garber, S. R., and Pick, H. L. Jr. (1980). Delayed auditory feedback with children. J. Speech Hear. Res. 23, 802–813.
Smith, K. U., and Sussman, H. M. (1970). Delayed feedback in steering during learning and transfer of learning. J. Appl. Psychol. 54, 334–342.
Smith, W. M., McCrary, J. W., and Smith, K. U. (1960). Delayed visual feedback and behavior. Science 132, 1013–1014.
Stetson, C., Cui, X., Montague, P. R., and Eagleman, D. M. (2006). Motor-sensory recalibration leads to an illusory reversal of action and sensation. Neuron 51, 651–659.
Sugano, Y., Keetels, M., and Vroomen, J. (2010). Adaptation to motor-visual and motor-auditory temporal lags transfer across modalities. Exp. Brain Res. 201, 393–399.
Takahashi, K., Saiki, J., and Watanabe, K. (2008). Realignment of temporal simultaneity between vision and touch. Neuroreport 19, 319–322.
Tanaka, H., Homma, K., and Imamizu, H. (2011). Physical delay but not subjective delay determines learning rate in prism adaptation. Exp. Brain Res. 208, 257–268.
Vatakis, A., Navarra, J., Soto-Faraco, S., and Spence, C. (2008). Audiovisual temporal adaptation of speech: temporal order versus simultaneity judgments. Exp. Brain Res. 185, 521–529.
Keywords: delayed visual feedback, delayed auditory feedback, critical interval, temporal disparity, spatial disparity, haptic information, Grooved Pegboard test
Citation: Fujisaki W (2012) Effects of delayed visual feedback on Grooved Pegboard test performance. Front. Psychology 3:61. doi: 10.3389/fpsyg.2012.00061
Received: 25 November 2011; Accepted: 15 February 2012;
Published online: 08 March 2012.
Edited by:
Hiroshi Imamizu, Advanced Telecommunication Research Institute International, JapanReviewed by:
Sergei Gepshtein, Salk Institute, USAHiroshi Imamizu, Advanced Telecommunication Research Institute International, Japan
Copyright: © 2012 Fujisaki. This is an open-access article distributed under the terms of the Creative Commons Attribution Non Commercial License, which permits non-commercial use, distribution, and reproduction in other forums, provided the original authors and source are credited.
*Correspondence: Waka Fujisaki, Human Technology Research Institute, National Institute of Advanced Industrial Science and Technology, Tsukuba Central 6, 1-1-1, Higashi, Tsukuba, Ibaraki 305-8566, Japan. e-mail: w-fujisaki@aist.go.jp