
- 1 Departamento de Metodología, Facultad de Psicología, Universidad Complutense, Madrid, Spain
- 2 The Schepens Eye Research Institute, Harvard Medical School, Boston, MA, USA
Saccadic suppression refers to a reduction in visual sensitivity during saccadic eye movements. This reduction is conventionally regarded as mediated by either of two sources. One is a simple passive process of motion smear during saccades also accompanied by visual masking exerted by high-contrast pre- and post-saccadic images. The other is an active process exerted by a neural mechanism that significantly reduces visual processing so that the perception of a stable visual environment is not disrupted during saccades. Some studies have actually shown that contrast sensitivity is significantly lower during saccades than under fixation, but these experiments were not designed in a way that could weigh the differential contribution of active and passive sources of saccadic suppression. We report the results of measurements of psychometric functions for contrast detection using stimuli that are only visible during saccades, thus effectively isolating any visual processing that actually takes place during the saccades and also preventing any pre- and post-saccadic visual masking. We also report measurements of psychometric functions for detection under fixation for stimuli that are comparable in duration and spatio-temporal characteristics to the intrasaccadic retinal stimulus. Whether during saccades or under fixation, the psychometric functions for detection turned out to be very similar, leaving room only for a small amount of sensitivity reduction during saccades. This suggests that contrast processing is largely unaltered during saccades and, thus, that no neural mechanism seems to be actively involved in saccadic suppression.
Introduction
Saccadic suppression is traditionally regarded as the result of an active neural mechanism that significantly reduces visual processing during saccades with the goal of achieving visual stability (Bridgeman et al., 1994). The ultimate source of saccadic suppression has not been elucidated, but two sources have been considered over the past few decades: An active process related to corollary discharge (a copy of the command to move the eyes that reaches other visual areas to suppress visual processing) and a passive process of motion smear and visual masking caused by the joint effect of fast retinal-image motion during the saccade and the high-contrast images preceding and following the saccade. Wurtz (2008) extensively reviewed evidence bearing on the contribution of these two sources and concluded that “visual masking is likely to be the major factor producing saccadic suppression” (p. 2086). Indeed, although neurophysiological correlates of saccades are observed in the colliculo-cortical pathway and the motion areas MT and MST, their role in actually producing saccadic suppression is unclear given that the evidence of saccadic suppression in the geniculo-striate pathway is very limited (Wurtz, 2008) and also because it is unclear whether the reduced neural activity during saccades is caused by an active mechanism or is a mere consequence of retinal-image motion. At the same time, the hypothesis that passive masking produces the observed reduction in sensitivity during saccades has received empirical support (Campbell and Wurtz, 1978; García-Pérez and Peli, 2001a; Castet et al., 2002).
The absence of an active neural mechanism of saccadic suppression is also consistent with psychophysical reports to the effect that sinusoidal gratings drifting at velocities that make them invisible under fixation become visible during saccades (Kelly, 1972, 1990; Deubel et al., 1987; Castet and Masson, 2000; García-Pérez and Peli, 2001a). Eye motion during saccades brings those stimuli into the window of visibility (Watson et al., 1986) by lowering their retinal velocity, and the fact that these otherwise invisible stimuli become visible during saccades suggests a lack of active saccadic suppression mediated by a neural mechanism. Further reasons to doubt the existence of an active neural mechanism for saccadic suppression come from the hypothesis put forth by Castet et al., 2001; see also Castet, 2010) according to which the acceleration at saccade onset tilts photoreceptors and transiently impairs the capture of light, something that reduces sensitivity in a way that is consistent with a number of characteristics of empirical data bearing on saccadic suppression (see also Ibbotson et al., 2008; for a countering view, see Tatler and Troscianko, 2002).
A number of psychophysical studies have reported saccadic suppression in the form of a significantly lower contrast sensitivity during saccades, particularly at low spatial and high temporal frequencies (see, e.g., Volkmann, 1962; Volkmann et al., 1978; Burr et al., 1982, 1994; for a review, see Burr and Morrone, 2003). These experiments, however, were designed in a way that active (neural) and passive (motion blur and visual masking) contributions to saccadic suppression were confounded. For instance, by using visible stimuli, visual masking may have helped to reduce contrast sensitivity during saccades in most of these studies. These experiments may also have unfairly biased the comparison of visual sensitivity during saccades and under fixation in favor of fixation conditions: The target stimulus was the same without and with saccades, thus impinging on a fixed retinal locus in the former case but being broadly spread across the retina in the latter. Several local retinal areas thus received weaker stimulation for a shorter time during saccades, and lower sensitivity is expected in these circumstances as a result of retinal inhomogeneity (García-Pérez and Sierra-Vázquez, 1996), Bloch’s law (Gorea and Tyler, 1986), limited exposure duration (Tulunay-Keesey and Jones, 1976), or local temporal integration (Burr, 1981). In sum, previous research allowed neither the isolation of intrasaccadic processing nor a fair comparison with visual processing under fixation.
A notable exception to the use of grossly different retinal stimuli under fixation and during saccades in research on saccadic suppression is the strategy of Diamond et al. (2000). They compared sensitivity under real saccades with sensitivity under simulated saccades during which the eyes were static and a mirror moved the stimulus across the retina. The stimulus could be flashed briefly at arbitrary times from before the saccade was initiated to after it was completed. Their study is generally cited for the finding that contrast sensitivity to stimuli flashed against a uniform background dropped under real saccades but not under simulated saccades, which was taken as evidence that passive processes (the only intervening factor in simulated saccades) cannot explain reduced sensitivity during saccades. However, the results of a second experiment offer a conflicting view: When stimuli were instead flashed against a highly patterned background, real and simulated saccades produced nearly identical drops in intrasaccadic sensitivity. Clearly, these latter results argue against active suppression taking place during real saccades, which would have necessarily produced a larger drop with real saccades than with simulated saccades. Further commentary on these discrepant results will be deferred to the discussion.
A fair comparison of visual sensitivity under fixation and during saccades requires comparable stimuli in both conditions but it also requires that visual processing during saccades is isolated. The latter is easy to achieve through stimuli that are invisible under fixation and become visible only during saccades. Thus, we assessed intrasaccadic sensitivity to stimuli that are visible only during saccades, which eliminates the masking component of passive saccadic suppression and ensures that only intrasaccadic processing is involved (potentially affected by any active neural mechanism of suppression). We also assessed sensitivity to comparable stimuli under fixation, which serves as an external criterion to assess the magnitude (if any) by which sensitivity is depressed by a neural mechanism of suppression during saccades. How these comparable stimuli were created is explained next.
Creating stimuli that are exactly matched on the retina across fixation and intrasaccadic conditions is impossible. Figure 1 illustrates our general approach to seeking comparable stimuli by showing space–time and spectral plots of retinal stimuli under fixation and during saccades (see The Retinal Stimulus During Saccades in Appendix for mathematical details). A stimulus flickering beyond the fusion frequency is invisible under fixation (Figure 1A), but saccades spread energy into the window of visibility (Figures 1B–D) and, since the stimulus is invisible before and after the saccade, only intrasaccadic processing can mediate detection. Readers can easily experience intrasaccadic processing by switching between executing and not executing saccades while a high-frequency flickering grating is being displayed on a monitor (Illustrative Matlab Script in Appendix includes a Matlab script to help illustrate this). Intrasaccadic processing is isolated in these conditions and if contrast processing were altered during saccades, detection performance would be considerably worse than it is under fixation for a stimulus with the same exact distribution of energy within the window of visibility.
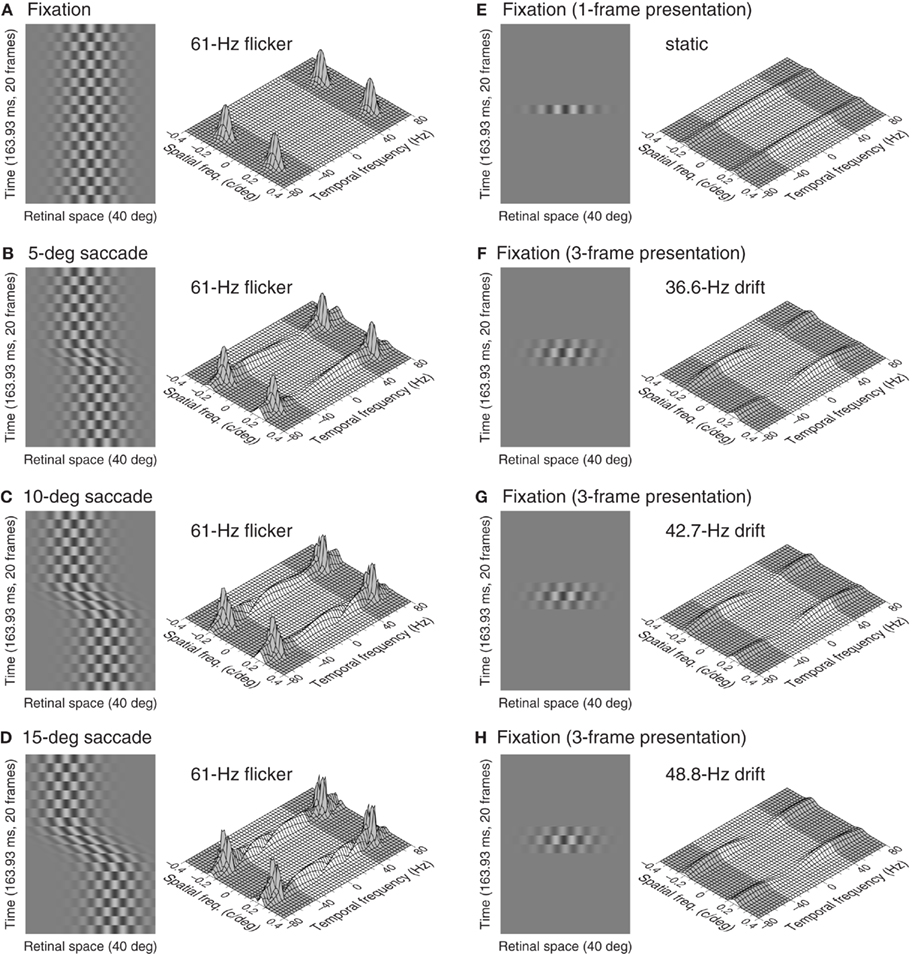
Figure 1. The retinal stimulus and its amplitude spectrum under fixation and during saccades. The distal stimulus is a 0.2-c/deg grating flickering at 61 Hz on a sampled display driven at a frame rate of 122 Hz. A sustained presentation is viewed under fixation (A) or while rightward saccades are executed with amplitudes of 5° (B), 10° (C), or 15° (D). The space–time plots on the left sides show the retinal stimulus (the fovea is at the center of the 40° horizontal span, and rightward saccades produce retinal displacement of the stimulus in the opposite direction) over a brief interval containing the saccade when executed (time increases upward). Saccade trajectory is given by Eq. A5in Section “The Retinal Stimulus During Saccades” in Appendix, with δ = 0.039 s for 5° saccades, δ = 0.053 s for 10° saccades, and δ = 0.067 s for 15° saccades. The meshes on the right sides – with the shaded parts indicating the region beyond the window of visibility – show log[1 + Fr(ρx, 0, ω)], where Fr is the amplitude spectrum given by Eq. A12in Section “The Retinal Stimulus During Saccades” in Appendix. This transformation tends to enhance very low amplitudes and, thus, hampers a direct visual comparison of the relative energy in fixation and intrasaccadic stimuli. Saccades spread energy into the window of visibility with a distribution that varies with saccade amplitude. Some stimuli viewed under fixation and presented for a short time have the same subjective appearance as intrasaccadic stimuli and also have a similar distribution of energy within the window of visibility: a one-frame presentation of the same 0.2-c/deg grating (E) or contrast-vignetted, three-frame presentations of 0.2-c/deg gratings nominally drifting to the right at 36.6 Hz (F), 42.7 Hz (G), or 48.8 Hz (H); other briefly presented stimuli also share these characteristics.
However, no such exact match can be produced with a time-sampled display. The alternative is to seek reasonably comparable stimuli that also have a very short temporal duration (similar to that of the intrasaccadic percept that readers can experience with the help of the Matlab script in Illustrative Matlab Script in Appendix) and also with a similar spectral distribution of energy. Note in Figures 1B–D that this distribution varies across 5°, 10°, and 15° saccades and, hence, comparable stimuli under fixation should cover a similar range of variation. Figures 1E–H show four such stimuli, namely, a one-frame presentation of a spatially identical grating (Figure 1E), or contrast-vignetted three-frame presentations of similar gratings nominally drifting at 36.6, 42.7, or 48.8 Hz (Figures 1F–H). Clearly, the spectra are not identical for particular pairs of intrasaccadic stimuli and fixation stimuli, but our selected set of fixation stimuli have spectra that cover the range shown in Figures 1B–D for our set of intrasaccadic stimuli in terms of region of support and net energy. And recall that fixation stimuli were selected to have a similar duration to the intrasaccadic percept, which excluded two-frame static stimuli and motion stimuli comprising more than three frames, whose subjective duration is perceived to be noticeably longer. Our particular choice of nominal drift rates was mainly based on the requirement that the spectral distribution of energy within the window of visibility be similar to that of intrasaccadic stimuli, provided that the amount of energy also varied similarly across variations in nominal saccadic amplitude (for intrasaccadic stimuli) and nominal drift rate (for fixation stimuli).
Detection thresholds are mere points on a psychometric function whose overall shape is now recognized to carry relevant information about visual processing (García-Pérez et al., 2005, 2011; Shani and Sagi, 2006; García-Pérez and Alcalá-Quintana, 2007, 2009). Therefore, and in contrast to previous studies, we measured detection performance by estimating entire psychometric functions. Our results show that intrasaccadic detection performance is virtually identical to detection performance for comparable stimuli under fixation. Thus, contrast processing seems unaltered during saccades as if no active neural mechanism were involved, in agreement with Diamond et al.’s (2000) results with highly patterned backgrounds.
Materials and methods
Viewing was binocular with natural pupils and accommodation. All experiments were self-paced. One of the authors and two experienced but naïve observers with corrected-to-normal vision participated in the experiments.
Apparatus
An EIZO FlexScan FX·E7 monitor was used at a frame rate of 122 Hz. The monitor was linearized and had a mean luminance of 31 cd/m2. To prevent luminance artifacts (García-Pérez and Peli, 2001b), the monitor was allowed to warm up for at least an hour before any session started. All experimental events were controlled by VisionWorks (Swift et al., 1997). Viewing distance was 65 cm, secured with a chin and forehead rest.
Sensitivity Under Fixation
Stimuli were Gabor patches with a vertical carrier and a static Gaussian aperture with space constants of 1° vertically and 6° horizontally. The carrier spatial frequency was 0.2 c/deg and, in separate sessions, it was either stationary or drifted rightward at temporal frequencies of 36.6, 42.7, 48.8, or 54.9 Hz. The stationary stimulus was presented for 8.2 ms (one video frame; Figure 1E); drifting stimuli were presented for 24.6 ms (three frames) and, thus, their broad temporal-frequency bandwidth allowed them to be perceived (García-Pérez and Peli, 1999). The first and last frame had half the nominal contrast of the patch, which was presented at full nominal contrast during the middle frame (Figures 1F–H). The presentation interval was indicated by a beep. A dot (luminance: 0.7 cd/m2; radius: 0.1°) at the center of the screen served as a fixation aid. A spatial two-alternative forced-choice (2AFC) detection task was used with locations that were horizontally centered on the screen and symmetrically placed 2.62° above and below the fixation point. Data were collected with an adaptive method of constant stimuli governed by eight interwoven one-down/one-up staircases consisting of 50 trials each and using steps up of 0.3 log units and steps down of 0.1 log units. Half of the staircases ran on a lattice shifted 0.05 log units relative to that of the other half, which provides a suitable sampling plan for fitting psychometric functions (García-Pérez and Alcalá-Quintana, 2005). Half of the staircases displayed the stimulus in the upper location and the other half displayed it in the lower location. Observers indicated whether the stimulus had been presented in the upper or the lower location, but they could also indicate that they did not see a stimulus in any location (the “don’t know” response; in these cases, computer-generated random responses allowed the staircases to proceed). If the observers missed the trial for whatever reason, they could hit a fourth key to have the trial discarded and repeated.
Sensitivity during Saccades
Stimuli were spatially identical to those described above, but the carrier flickered in counterphase at 61 Hz (Figures 1B–D). This high temporal frequency is above the flicker fusion limit reported in all sources but we actually checked the more important fact that none of our observers could actually detect the flicker under fixation: in a preliminary check before the experiment started, none of the observers reported seeing any pattern or flicker under fixation, not even at full contrast. Stimuli were presented for 1500 ms (183 frames) with onsets and offsets that were linearly ramped for 32.8 ms (four frames). Data were collected with a spatial 2AFC paradigm identical to that described above, with the only difference that observers executed saccades during the presentation interval (which thus allowed the flickering stimulus to be visible, because it was indeed invisible during fixation). Two dots were horizontally aligned and centered on the image area 5°, 10°, or 15° apart from one another (in separate sessions). Each trial (and, thus, the 1500-ms stimulus presentation period) started while the subject was fixating on the left dot; 500 ms later, this dot was removed and the dot on the right presented, directing the observer to execute a saccade; 1000 ms later this dot disappeared and the dot on the left reappeared, directing the subject back to the initial position for the next trial. All observers were pre-trained in this task for at least 800 trials. Because the stimuli were presented above or below the saccade path on an otherwise uniform luminance field, no visual masking could take place during these measurements.
Data Analysis
“Don’t know” responses were subjected to denoising (García-Pérez, 2010; see also Fitting Psychometric Functions and Obtaining Bootstrap Confidence Intervals in Appendix) before data were binned by contrast level to fit logistic psychometric functions by maximum-likelihood methods. To prevent contamination from retinal inhomogeneity (García-Pérez and Sierra-Vázquez, 1996) or from a spatially non-uniform luminance rendition on the monitor (García-Pérez and Peli, 2001b), trials in which the stimulus had been presented in the upper and lower locations were separated and psychometric functions were fitted independently to data from each subset of trials.
Control of Eye Movements
Observers were tested for accurate fixation and appropriate saccades by recording their eye movements with an infrared corneal-reflection eye-tracker (ISCAN Inc., Burlington, MA, USA). This equipment easily allows checking the amplitude of the saccades but its sampling rate does not allow measurements of the peak (or average) velocity of saccades with the precision that is required for obtaining an accurate picture of retinal velocity during saccades, although its accuracy for other purposes has been documented (see, e.g., Luo et al., 2008). Analyses of these recordings indicated that observers were capable of maintaining fixation when required, and also that they executed saccades of accurate amplitude whose duration and velocity seemed variable (a ubiquitous characteristic of saccades also reported by Jürgens et al., 1981; Schlag and Schlag-Rey, 1995; Quaia et al., 2000). On-line analysis of eye movements while observers performed the experiments proved unfeasible, but these would have been of little use given that saccades have a varying speed profile over their trajectory and we cannot know exactly over what speeds the stimulus became visible. Note, however, that the characteristics of the actual saccades carried out by the observers are immaterial for our purposes because the stimulus is invisible during fixation and also because we are not interested in relating the characteristics of intrasaccadic visual processing to the particular parameters of the saccades. Thus, failing to execute a saccade brings no benefit to the observer and, if anything, saccades of sub-optimal velocity or amplitude would only have made intrasaccadic processing look worse than it could have been under optimally executed saccades.
Results
Psychometric functions for intrasaccadic detection are shown in Figure 2. These functions are analogous to those typically reported for contrast detection under fixation, revealing that intrasaccadic visual processing is also governed by principles that produce a gradual increase in probability of detection with increasing contrast. There are marked differences across observers in the way in which these psychometric functions vary with saccade amplitude: Observer #1 had lowest sensitivity with 5° saccades and highest sensitivity with 10° saccades; Observer #2 had lowest sensitivity with 15° saccades and highest sensitivity also with 10° saccades; and Observer #3 also showed this latter pattern in the upper visual field but showed no differences in the lower field. The reason for these inter-observer variations surely lies in individual differences in the average duration, peak velocity, and asymmetry of binocular saccades of given amplitude (Jürgens et al., 1981; Quaia et al., 2000; Kloke and Jaschinski, 2006), which thus produce different retinal stimuli for each observer despite the nominally identical saccade amplitudes. But, as discussed earlier, these characteristics do not interfere with our goals.
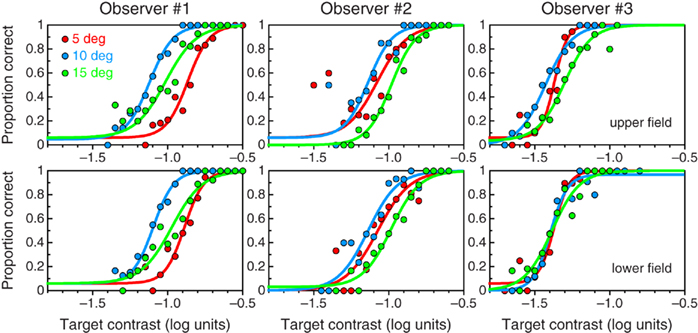
Figure 2. Denoised psychometric functions for intrasaccadic detection of a 0.2-c/deg patch flickering at 61 Hz, with saccade amplitudes of 5° (red symbols and curves), 10° (blue symbols and curves), and 15° (red symbols and curves) for each observer (columns) in the upper (top) and lower (bottom) visual fields.
Contrast sensitivity under fixation has been shown to vary with small changes in the distribution of energy within the window of visibility (Peli et al., 1993). Analogous changes in intrasaccadic detection performance shown in Figure 2 for saccades of different amplitudes reveal that intrasaccadic processing is similar in this respect, because saccades of different amplitudes also affect differentially the spectral distribution of visible energy (Figures 1B–D). As noted earlier, the different patterns of variation of sensitivity with saccade amplitude across observers suggest that they executed saccades of different characteristics despite the fixed amplitude. Also, for each observer, the duration of saccades of a fixed amplitude tends to increase (and, thus, their velocity tends to decrease) regularly along a session (Chen-Harris et al., 2008). These considerations further discouraged us from attempting to relate quantitatively the characteristics of the psychometric functions in Figure 2 to characteristics of each observer’s saccades, but this would only have been a side outcome of our research. Since observers did not produce identical saccades across trials of given amplitude, the retinal stimulus was not exactly the same throughout the session and, thus, psychometric functions for intrasaccadic detection actually reflect performance across random variations in the characteristics of the intrasaccadic retinal stimulus. The narrow psychometric functions in Figure 2 nevertheless indicate that the range of these variations was small. In any case, the question that we want to investigate is not whether and how the characteristics of saccades affect intrasaccadic detection performance, but rather whether intrasaccadic performance is meaningfully worse than performance during fixation (as the concept of an active saccadic suppression implies). Therefore, what matters for our purposes is not why the psychometric curves in each panel of Figure 2 differ from one another but how they compare with curves obtained under fixation, an issue to which we now turn.
Upon completion of each session, our naïve observers were asked about the subjective appearance of their intrasaccadic percept. They described these as glimpses – shorter than the duration of the saccade – of a pattern consisting of bright and dark regions that could appear static, wiggly, or drifting along or against the direction of the saccades. Space–time plots in Figures 1B–D show that the velocity of the retinal stimulus decreases (and may eventually reverse direction) during the first half of the saccade and then increases during the second half. (This is best appreciated by tilting the page forward and squinting at the space–time plots in Figures 1B–D.) Our observers’ reports are thus suggestive of perception of the pattern during the brief period in which its retinal velocity is lowest, although this is only a (reasonable-looking) speculation. Given the inter-trial variability of saccades, the effective duration and velocity of the visible intrasaccadic stimulus varies across trials and, hence, a matching stimulus for presentation under fixation cannot be created. Yet, the intrasaccadic percepts reported by our naïve observers suggest an intrasaccadic stimulus that is similar to the patches for which we measured sensitivity under fixation, which had been selected along the course of pilot trials carried out with one of the authors as observer.
Figure 3 shows psychometric functions for detection under fixation. These curves are similar to those that have previously been reported for a variety of patches in peripheral viewing under fixation. Bearing in mind that the nominal temporal frequency of the drifting stimuli is outside the window of visibility, these stimuli are visible only because energy spreads into that window as a result of the short presentation duration (Figures 1E–H). As nominal temporal frequency increases, the amount of such energy decreases and, hence, sensitivity decreases and psychometric functions shift rightward. The static patch, on the other hand, is not more visible than the drifting patches because its presentation duration was shorter and, thus, its energy was actually half that of drifting patches of the same nominal contrast (e.g., at threshold contrast).
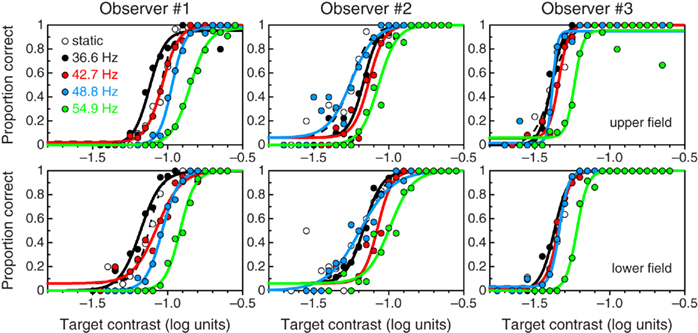
Figure 3. Denoised psychometric functions for detection under fixation of a 0.2-c/deg patch that is static (open symbols and dashed curves) or drifts at 36.6 Hz (black symbols and curves), 42.7 Hz (red symbols and curves), 48.8 Hz (blue symbols and curves), and 54.9 Hz (green symbols and curves) for each observer (columns) in the upper (top) and lower (bottom) visual fields.
Space–time plots in Figures 1B–D showed that saccades transform invisible flicker into visible stimuli with a range of velocities for a brief period around the midpoint of the saccade (although this effective duration or the magnitude of the accompanying displacement may not be sufficient for motion perception; see Peli and García-Pérez, 2003). Amplitude spectra in Figures 1B–D showed that the energy that is thus placed within the window of visibility is broadly spread along the temporal-frequency axis, as is the case for briefly presented stimuli under fixation (compare with Figures 1E–H). If the intrasaccadic retinal stimulus is similar to stimuli of the latter type and contrast processing is unaltered during saccades, then psychometric functions for intrasaccadic detection should be similar to those for detection under fixation. Indeed, the most salient characteristic of the psychometric functions in Figure 3 is their similarity to those in Figure 2.
Figure 4 makes these similarities more apparent by showing how the location (or detection threshold; top row) and support (or inverse of slope; bottom row) of psychometric functions vary with drift frequency under fixation (circles) and also how they vary with saccade amplitude during saccades (horizontal lines with triangles on their left end). Intrasaccadic data are plotted as horizontal lines across the panels because the abscissa for these data points (triangles) is unknown (i.e., as discussed earlier, the nominal temporal frequency that is responsible for detection of the intrasaccadic stimulus is unknown) although it must be within the range displayed in Figure 4. Recall, in any case, that the goal of these plots is not to relate patterns of data to the characteristics of saccades but rather to compare intrasaccadic performance with performance under fixation. Also, observers reported that intrasaccadic percepts have a very short duration, similar to that of our fixation stimuli. Thus, intrasaccadic retinal stimuli and stimuli viewed under fixation were reasonably similar in our experiments, and the top row of Figure 4 shows that intrasaccadic detection thresholds are also similar to thresholds under fixation: The ordinate of triangles and horizontal lines (intrasaccadic thresholds) cover the same range as the ordinates of circles (thresholds under fixation) for each observer. The bottom row of Figure 4 shows that the support of psychometric functions is generally larger during saccades, as expected if inter-trial variations in the characteristics of saccades made the retinal stimulus slightly different across trials, compared to a retinal stimulus that varies less across trials under fixation. Thus, despite the variability of saccades across trials and their potentially sub-optimal velocities with respect to the maximization of detection performance, intrasaccadic contrast processing does not seem inferior to processing under fixation in any meaningful respect.
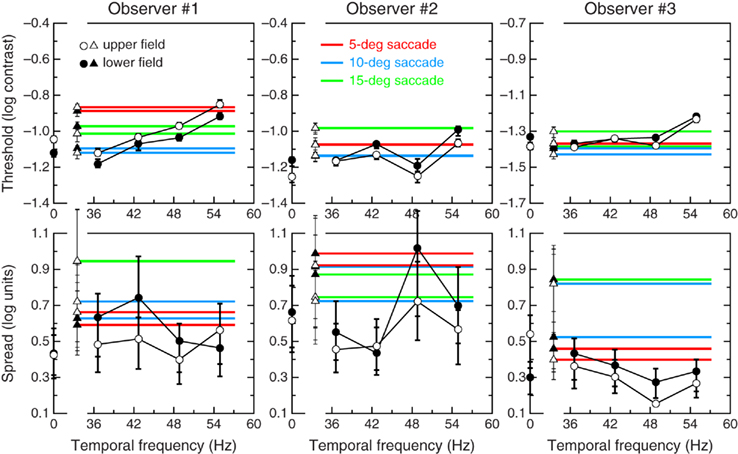
Figure 4. Threshold (top) and support (bottom) of the psychometric functions for each observer (columns). Circles indicate threshold and support under fixation as a function of drift frequency; triangles indicate threshold and support during saccades, and their values are spread across each panel with red (5° saccades), blue (10° saccades), or green (15° saccades) horizontal lines. Open symbols denote results for the upper visual field; solid symbols denote results for the lower field. Error bars (when larger than symbols) are bootstrap 95% confidence regions around the estimates.
Figure 4 also highlights differences between the upper and lower visual fields. Under fixation, the support of psychometric functions is generally larger in the lower visual field for all observers (compare solid and open circles in the bottom row); on the other hand, differences in threshold (circles in the top row) are generally small and inconsistent across observers in that thresholds in the upper field are higher (Observer #1), generally lower (Observer #2), or similar (Observer #3) to thresholds in the lower field. The differences are generally small and similar to those reported for low-frequency patches presented at near-foveal locations (Rijsdijk et al., 1980; Pointer and Hess, 1989). For intrasaccadic detection (triangles), there are only minor differences between the upper and lower visual fields in the location or support of the psychometric functions. These differences are also inconsistent across observers, which could reflect again that the trajectory of saccades varied across and within observers. There is also evidence that these trajectories are sometimes curved upward (Collewijn et al., 1988; van Leeuwen et al., 1998), with the consequence that the nominally upper location is actually foveal whereas the lower location is more peripheral than it nominally was. The differences are, nonetheless, too small to be deemed relevant.
Discussion
We have carried out a detection experiment in which intrasaccadic visual processing was isolated by using stimuli that are only visible during saccades, thus eliminating the contribution of passive visual masking to saccadic suppression and leaving only the potential contribution of active neural mechanisms. We have also carried out a detection experiment under fixation using stimuli within a range that includes the stimulus that was perceptually available during the intrasaccadic experiment. In these experiments, detection performance under fixation and during saccades had a remarkable resemblance. We cannot claim identical conditions with and without saccades because the identity of a briefly presented static or drifting patch under fixation and the intrasaccadic retinal stimulus for a flickering patch cannot be established. Also, variations in duration and velocity of saccades of given amplitude across trials preclude an exact match between the (variable) intrasaccadic stimulus and any fixed stimulus under fixation. The search for a stimulus under fixation that is identical to intrasaccadic retinal stimuli is further hampered because presentation duration must be a multiple of the display frame rate (8.2 ms here) and because motion rendering requires presentation of at least two frames. The set of stimuli chosen for our measurements under fixation nonetheless sampled the relevant range for a fair comparison. In these conditions, psychometric functions for contrast detection under fixation and during saccades were similar, in contrast to major differences reported in earlier studies that used a different method (Volkmann et al., 1978; Burr et al., 1982, 1994) and in which the retinal stimuli under fixation and during saccades were grossly different and biased in the direction of favoring fixation conditions. It is important to note that a mismatch of conditions in our experiments must also have penalized intrasaccadic processing due to sub-optimal intrasaccadic stimulation: Since the stimulus is invisible with no eye motion or with slow eye motion and becomes visible only at higher eye velocities, a gradation of visibility must occur with a maximum at some particular eye velocity and trajectory which may not have been achieved in our experiments. Yet, our results indicate that intrasaccadic processing is analogous to processing under fixation and, thus, that contrast processing is largely unaltered during saccades when masking contributions to saccadic suppression are eliminated.
One might argue that image stabilization methods could have been used to ensure that the retinal stimulus is exactly the same during saccades and under fixation, thus allowing for a more precise and fair comparison of visual sensitivity with and without saccades. But equipment that is currently available for the stabilization of retinal images does not achieve the precision that would be required in such study. The use of eye-movement-contingent stimulus presentation is also not an option because of the extremely fast and accurate equipment response that would have been necessary to actually present the stimulus after the saccade was initiated and to extinguish it before the saccade was completed.
Our claim of virtually unaltered visual processing during saccades is in contradiction with the conclusion of Diamond et al. (2000) based on results that were briefly described in the introduction. They took the results of their first experiment involving real and simulated saccades as evidence that saccadic suppression is caused by an active neural mechanism and not by passive processes. But we have also mentioned in the introduction that their second experiment suggests the opposite conclusion. Although this issue should be subject to further scrutiny, we believe that Diamond et al.’s (2000) simulated saccades might actually have been accompanied by the intrasaccadic visual processes described in this paper. Indeed, they did not monitor eye movements during the simulated saccades because the eye-tracker was in use to monitor the movement of the mirror (Diamond, 2002, p. 47). Also, the stimulus field included fixation points that also moved with the target stimulus through the mirror. Thus, in the experiment involving a uniform background, their subjects may not have been able to maintain a steady gaze, which would thus have triggered the intrasaccadic visual processing that we have illustrated in this paper. The reader can use the script provided in Section “Illustrative Matlab Script” in Appendix to realize how strong the intrasaccadic percept can be even with small saccades or with the eye movements that accompany blinks. In these conditions, Diamond et al.’s (2000) experiment with simulated saccades and stimulus presentation against a uniform background may have only shown that intrasaccadic processing is actually unaltered, in line with the results presented in this paper. At the same time, the lack of differences between the sensitivity drops caused by real or simulated saccades when stimuli were presented against a highly patterned background would simply reveal that the reduction is actually due to visual masking taking place in the absence of active suppression during real saccades.
It should also be noted that the data of Diamond et al. (2000) suggest that the drop in sensitivity begins slightly before the saccade is initiated. Whether this “pre-saccadic suppression” is a real phenomenon, is an artifact of mechanical changes in the retina due to acceleration forces at saccade onset (see Castet et al., 2001), or reflects only misestimation of saccadic onset (see Ibbotson et al., 2008) is unclear, but neither Diamond et al. (2000) nor Diamond (2002) provided graphical examples illustrating the accuracy of their syntactic pattern-recognizer (SPR) for saccades. Diamond (2002, pp. 36–40) reported the results of a test of their SPR which revealed that the absolute differences between saccade onsets and offsets judged by human observers and those estimated with the SPR had SDs ranging between 3 and 10 ms, which actually reveals potentially large errors in the identification of the onset and offset of saccades whose nominal (but not necessarily actual across saccades) duration was 60 ms, whether provided by the SPR or estimated by human judges. In any case, and until these issues are resolved in replications of Diamond et al.’s (2000) experiments, we should stress that the evidence of intrasaccadic processing revealed in our experiments is not incompatible with a potential pre-saccadic suppression. Our intrasaccadic data cannot say anything about pre-saccadic processing because our stimuli are invisible before the eyes move.
One of the reviewers of this paper pointed out that there is some evidence that suppression also occurs with afterimages and, then, that this evidence might support the notion of an active mechanism. We believe that this evidence must be weighed carefully. First, as far as we know, this evidence is based only on self-reports and the issue does not lend itself to investigation with objective methods that could quantify the amount of suppression. Second, we are only aware of one paper on this topic (Kennard et al., 1970) and this paper reports, e.g., that suppression lasts between 2 and 4 s when eye movements are carried out between 20 and 80 s from afterimage formation, which seems to point to a mechanism quite different from that under discussion here. Third, the existence of a causal relationship between eye movements and the disappearance and reappearance of afterimages is far from clear (see Wade, 1978). And, finally, measuring how afterimages move with saccades is a standard paradigm in research on visual stability (see, e.g., Bridgeman, 2007) and note that this technique would be impossible to use if saccades actually suppressed afterimages. In sum, how much suppression of afterimages (if any) there is during saccades has only been subjectively judged and has never been definitely established with objective methods.
Saccadic suppression has been a working hypothesis for 50 years, indirectly supported by psychophysical results indicating lower sensitivity during saccades than under fixation (Volkmann, 1962; Volkmann et al., 1978; Burr et al., 1982, 1994) or under simulated saccades (Diamond et al., 2000). The neural mechanism responsible for saccadic suppression has never been elucidated, but it has been assumed that a copy (the corollary discharge) of the neural signals sent to the eye muscles is also sent to other brain areas so as to stop visual processing during the saccade and thus prevent retinal motion smear and image blur from disrupting vision. A mechanism operating on these principles requires dedicated neural machinery, but the pathways responsible for its implementation have never been identified and their activity has never been measured directly. Neurophysiological recordings have shown no substantial suppression in the geniculo-striate pathway, and only some suppression in the colliculo-cortical pathway and the motion areas MT and MST (Wurtz, 2008), but there is no direct proof that this latter suppression actually contributes to visual perception or that it is not just the consequence of retinal-image motion during saccades. In retrospect, it seems untenable that evolution would have entertained the development of an active mechanism of saccadic suppression when the purely passive masking exerted by pre- and post-saccadic stimulation in the natural environment effectively produces the same outcome (namely, suppression of intrasaccadic image blur and motion smear).
Conclusion
In the light of our results, earlier reports of deterioration of visual processing during saccades seem to reflect the use of non-comparable and grossly different stimuli under fixation and during saccades, and they also reflect contamination from masking of the intrasaccadic percept. Our study circumvented both problems, and our use of a low spatial frequency (0.2 c/deg) proves that the magnocellular system is neither suppressed nor depressed during saccades. Our study also suggests that intrasaccadic percepts are unnoticed simply because they are masked by post-saccadic images, just as subliminal messages were supposedly masked away from unsuspecting movie-goers’ vision in the notorious Vicary study (Vokey, 2007). This passive masking (and not an active neural mechanism that suppresses visual processing) is perhaps what prevents the problems that retinal-image motion during saccades might bring around. Lack of post-saccadic stimulation exerting this masking also occurs in the dark and its effects (revealing again intrasaccadic processing and a lack of active saccadic suppression) are vividly apparent when saccades are executed in the dark with only flickering LEDs present in the visual field (Schlag and Schlag-Rey, 1995; Peli and García-Pérez, 2003).
Our results do not conclusively rule out saccadic suppression in the form of some reduction in sensitivity (as opposed to a total lack of visual processing) during saccades, although the origin of this reduction is still unclear. In laboratory conditions this reduction in sensitivity is relatively weak compared to the much larger effects that motion smear and visual masking have on the suppression of effective vision during saccades. And it is also important to note that the effects of motion smear and visual masking are huge under the highly patterned conditions of the natural environments in which visual systems evolved, which suggests that there was never any evolutionary pressure to develop a dedicated neural mechanism that prevents vision during saccades.
Conflict of Interest Statement
The authors declare that the research was conducted in the absence of any commercial or financial relationships that could be construed as a potential conflict of interest.
Acknowledgments
This work was supported by grant PSI2009–08800 (Ministerio de Ciencia e Innovación, Spain) to Miguel A. García-Pérez and by NIH grants EY05957 and EY12890 to Eli Peli. We thank Andrew Haun for creating the Matlab script included in Section “Illustrative Matlab Script” in Appendix.
References
Bridgeman, B., Van der Heijden, A. H. C., and Velichkovsky, B. M. (1994). A theory of visual stability across saccadic eye movements. Behav. Brain Sci. 17, 247–292.
Burr, D. C. (1981). Temporal summation of moving images by the human visual system. Proc. R. Soc. Lond. B Biol. Sci. 211, 321–339.
Burr, D. C., Holt, J., Johnstone, J. R., and Ross, J. (1982). Selective depression of motion sensitivity during saccades. J. Physiol. 333, 1–15.
Burr, D. C., and Morrone, M. C. (2003). “Visual perception during saccades,” in The Visual Neurosciences, eds L. M. Chalupa and J. S. Werner (Cambridge, MA: MIT Press), 1391–1401.
Burr, D. C., Morrone, M. C., and Ross, J. (1994). Selective suppression of the magnocellular visual pathway during saccadic eye movements. Nature 371, 511–513.
Campbell, F. W., and Wurtz, R. H. (1978). Saccadic omission: why we do not see a grey-out during a saccadic eye movement. Vision Res. 18, 1297–1303.
Castet, E. (2010). “Perception of intra-saccadic motion,” in Dynamics of Visual Motion Processing: Neural, Behavioral, and Computational Approaches, eds U. J. Ilg and G. S. Masson (Berlin: Springer), 213–238.
Castet, E., Jeanjean, S., and Masson, G. S. (2001). ‘Saccadic suppression’ – no need for an active extra-retinal mechanism. Trends Neurosci. 24, 316–317.
Castet, E., Jeanjean, S., and Masson, G. S. (2002). Motion perception of saccade-induced retinal translation. Proc. Natl. Acad. Sci. U.S.A. 99, 15159–15163.
Castet, E., and Masson, G. S. (2000). Motion perception during saccadic eye movements. Nat. Neurosci. 3, 177–183.
Chen-Harris, H., Joiner, W. M., Ethier, V., Zee, D. S., and Shadmehr, R. (2008). Adaptive control of saccades via internal feedback. J. Neurosci. 28, 2804–2813.
Collewijn, H., Erkelens, C. J., and Steinman, R. M. (1988). Binocular co-ordination of human horizontal saccadic eye movements. J. Physiol. (Lond.) 404, 157–182.
Deubel, H., Elsner, T., and Hauske, G. (1987). Saccadic eye movements and the detection of fast-moving gratings. Biol. Cybern. 57, 37–45.
Diamond, M. R. (2002). The Effect of Saccades on Visual Sensitivity and Time Perception. Ph.D. thesis, University of Western Australia, Crawley.
Diamond, M. R., Ross, J., and Morrone, M. C. (2000). Extraretinal control of saccadic suppression. J. Neurosci. 20, 3449–3455.
García-Pérez, M. A. (2010). Denoising forced-choice detection data. Br. J. Math. Stat. Psychol. 63, 75–100.
García-Pérez, M. A., and Alcalá-Quintana, R. (2005). Sampling plans for fitting the psychometric function. Span. J. Psychol. 8, 256–289.
García-Pérez, M. A., and Alcalá-Quintana, R. (2007). The transducer model for contrast detection and discrimination: formal relations, implications, and an empirical test. Spat. Vis. 20, 5–43.
García-Pérez, M. A., and Alcalá-Quintana, R. (2009). Fixed vs. variable noise in 2AFC contrast discrimination: lessons from psychometric functions. Spat. Vis. 22, 273–300.
García-Pérez, M. A., Alcalá-Quintana, R., Woods, R. L., and Peli, E. (2011). Psychometric functions for detection and discrimination with and without flankers. Atten. Percept. Psychophys. 73, 829–853.
García-Pérez, M. A., Giorgi, R. G., Woods, R. L., and Peli, E. (2005). Thresholds vary between spatial and temporal forced-choice paradigms: the case of lateral interactions in peripheral vision. Spat. Vis. 18, 99–127.
García-Pérez, M. A., and Peli, E. (1999). Imputation of direction of motion in one dimension. J. Opt. Soc. Am. A 16, 1531–1540.
García-Pérez, M. A., and Peli, E. (2001b). Luminance artifacts of cathode-ray tube displays for vision research. Spat. Vis. 14, 201–215.
García-Pérez, M. A., and Sierra-Vázquez, V. (1996). Do channels shift their tuning towards lower spatial frequencies in the periphery? Vision Res. 36, 3339–3372.
Gorea, A., and Tyler, C. W. (1986). New look at Bloch’s law for contrast. J. Opt. Soc. Am. A 3, 52–61.
Harwood, M. R., Mezey, L. E., and Harris, C. M. (1999). The spectral main sequence of human saccades. J. Neurosci. 19, 9098–9106.
Ibbotson, M. R., Crowder, N. A., Cloherty, S. L., Price, N. S. C., and Mustari, M. J. (2008). Saccadic modulation of neural responses: possible roles in saccadic suppression, enhancement, and time compression. J. Neurosci. 28, 10952–10960.
Jürgens, R., Becker, W., and Kornhuber, H. H. (1981). Natural and drug-induced variations of velocity and duration of human saccadic eye movements: evidence for a control of the neural pulse generator by local feedback. Biol. Cybern. 39, 87–96.
Kelly, D. H. (1972). Adaptation effects on spatio-temporal sine-wave thresholds. Vision Res. 12, 89–101.
Kennard, D. W., Hartmann, R. W., Kraft, D. P., and Boshes, B. (1970). Perceptual suppression of afterimages. Vision Res. 10, 575–585.
Kloke, W. B., and Jaschinski, W. (2006). Individual differences in the asymmetry of binocular saccades, analysed with mixed-effects models. Biol. Psychol. 73, 220–226.
Luo, G., Vargas-Martin, F., and Peli, E. (2008). The role of peripheral vision in saccade planning: learning from people with tunnel vision. J. Vis. 8, 25.
Peli, E., Arend, L. E., Young, G. M., and Goldstein, R. B. (1993). Contrast sensitivity to patch stimuli: effects of spatial bandwidth and temporal presentation. Spat. Vis. 7, 1–14.
Peli, E., and García-Pérez, M. A. (2003). Motion perception during involuntary eye vibration. Exp. Brain Res. 149, 431–438.
Pointer, J. S., and Hess, R. F. (1989). The contrast sensitivity gradient across the human visual field: With emphasis on the low spatial frequency range. Vision Res. 29, 1135–1151.
Quaia, C., Paré, M., Wurtz, R. H., and Optican, L. M. (2000). Extent of compensation for variations in monkey saccadic eye movements. Exp. Brain Res. 132, 39–51.
Rijsdijk, J. P., Kroon, J. N., and van der Wildt, G. J. (1980). Contrast sensitivity as a function of position on the retina. Vision Res. 20, 235–241.
Schlag, J., and Schlag-Rey, M. (1995). Illusory localization of stimuli flashed in the dark before saccades. Vision Res. 35, 2347–2357.
Shani, R., and Sagi, D. (2006). Psychometric curves of lateral facilitation. Spat. Vis. 19, 413–426.
Swift, D., Panish, S., and Hippensteel, B. (1997). The use of VisionWorks™ in visual psychophysics research. Spat. Vis. 10, 471–477.
Tatler, B. W., and Troscianko, T. (2002). A rare glimpse of the eye in motion. Perception 31, 1403–1406.
Tulunay-Keesey, U., and Jones, R. M. (1976). The effect of micromovements of the eye and exposure duration on contrast sensitivity. Vision Res. 16, 481–488.
van Leeuwen, A. F., Collewijn, H., and Erkelens, C. J. (1998). Dynamics of horizontal vergence movements: interaction with horizontal and vertical saccades and relation with monocular preferences. Vision Res. 38, 3943–3954.
Vokey, J. R. (2007). “Subliminal messages,” in Psychological Sketches, 8th Edn, eds J. R. Vokey and S. W. Allen (Lethbridge, AB: Psyence Ink), 287–300.
Volkmann, F. C. (1962). Vision during voluntary saccadic eye movements. J. Opt. Soc. Am. 52, 571–578.
Volkmann, F. C., Riggs, L. A., White, K. D., and Moore, R. K. (1978). Contrast sensitivity during saccadic eye movements. Vision Res. 18, 1193–1199.
Watson, A. B., Ahumada, A. J. Jr., and Farrell, J. E. (1986). Window of visibility: a psychophysical theory of fidelity in time-sampled visual motion displays. J. Opt. Soc. Am. A 3, 300–307.
Wichmann, F. A., and Hill, N. J. (2001). The psychometric function: I. Fitting, sampling, and goodness of fit. Percept. Psychophys. 63, 1293–1313.
Appendix A: The retinal stimulus during saccades
Parts of this material were presented as Appendix A in García-Pérez and Peli (2001a). During a saccade, the distal stimulus sweeps the retina according to the path of the eye movement. Let f be the distal stimulus, a Gabor function whose gaussian aperture has space constants of σx and σy deg respectively in the horizontal and vertical dimensions, whose carrier has a spatial frequency of ρ0 c/deg and a velocity of v0 deg/s, and which is further windowed with a temporal contrast envelope that spans t0 second and whose onset and offset are linearly ramped for τ0 second (τ0 ≤ t0/2). Assuming foveal presentation and foveal spatial coordinates, and setting the arbitrary origin of time at stimulus onset, the nominal distal stimulus is

where L0 is mean luminance and
is the temporal contrast envelope, with maximal contrast mmax.
When displayed on a CRT at a frame rate of ω0 Hz, the actual distal stimulus fa consists of a discrete sequence of n static frames, where n = (t0ω0) (i.e., the least integer value greater than or equal to t0ω0). Apparent motion occurs because the carrier shifts in space across frames, although it remains static over the entire duration of a frame. Disregarding the mean luminance pedestal, the actual stimulus is then

where mi = m((i − 1)/ω0) is the contrast of the Gabor function displayed on the i-th frame, xi = v0(i − 1)/ω0 is the spatial shift of the carrier at the i-th frame, and

is the temporal window that describes the duration of the i-th frame. We will assume that the stimuli are displayed in conditions that minimize artifacts caused by interactions along raster lines, by phosphor decay over the duration of a frame, and by phosphor persistence across frames (García-Pérez and Peli, 2001b).
When a saccade occurs whose midpoint is at time ts (ts < t0), the stimulus changes retinal position continuously over time as a result of the saccadic trajectory, and the retinal stimulus fr is given by fr(x, y, t) = fa(x−x′(t−ts), y−y′(t−ts), t), where x′ and y′ are parametric functions respectively describing the trajectory of the saccade in the horizontal and vertical directions. Here we will assume y′(t) = 0 and will thus only consider horizontal saccades whose trajectory is given by
where B − A (in deg) is the amplitude of a saccade that changes the retinal location of the stimulus from A to B (A < B for rightward saccades; A > B for leftward saccades) and δ (in seconds) is its duration. This sigmoidal trajectory corresponds to a minimum-snap model (Harwood et al., 1999), and it is easy to show that the velocity of such saccade is given by

yielding a peak velocity vp = 35(B − A)/16δ deg/s at the midpoint of the saccade. Saccade duration δ is a linear function of its amplitude (Harwood et al., 1999) given by

so that instantaneous retinal temporal frequency of drift (in Hz) at the midpoint of the saccade is

It is also useful to look at this retinal stimulus in the spatio-temporal-frequency domain, since it gives some insight as to the effect of saccades on the spectral content of the retinal stimulus. The functional form of x′ does not permit obtaining the Fourier transform of fr in closed form, but an analytical approximation can be obtained to the desired precision by noting that x′ can be approximated through a stepwise linear function with constant-velocity segments of appropriate durations. Thus, consider that the duration of a display frame is partitioned into k adjacent epochs each lasting δ0 = 1/kω0 s, with k sufficiently large so that the velocity of the eye over each epoch can be considered constant. The retinal stimulus can then be formally represented as
where

with tij = (i − 1)/ω0 + (j − 1)δ0, defines the j-th epoch of the i-th frame,  is the location of the stimulus at the beginning of that epoch, and

is the (constant) velocity of the stimulus over that epoch. The Fourier transform Fr of the latter expression for fr can easily be shown to be
where I2 = − 1.
The space–time plot (Eq. A9) and amplitude spectrum (modulus of Eq. A12) of some stimuli during saccades are shown in Figure 1 of the paper. In space–time, saccades have the effect of introducing continuous motion into the stimulus: what otherwise would be static within-frame stimulation gets swept across the retina continuously, and it is this additional motion introduced by the saccade itself that is responsible for the temporal-frequency spread of energy. This within-frame motion also contributes to strengthening a local temporal signal caused by the abrupt phase shifts across frames.
Appendix B: Illustrative Matlab script
The following Matlab script runs under the Psychophysics Toolbox (http://psychtoolbox.org) and creates a flickering Gabor patch that is not visible with static eyes but becomes visible when horizontal saccades are executed. This script thus provides an illustration of the intrasaccadic percept whose visibility is only mediated by intrasaccadic visual processing.
To reproduce the conditions of our experiments, users must be aware of the following:
(1) The script should be used on a system configured so that the image is created on a CRT monitor, as was done in our actual experiments. We have tested the script on various LCD monitors, but their peculiar image forming characteristics and the additional processing done within the displays themselves seem to prevent the effect.
(2) The frame rate of the monitor should be high (at or above 100 Hz) so that the actual flicker of the image is beyond the fusion rate and, thus, nothing but a uniform luminance field is seen with static eyes.
(3) The contrast of the patch (currently set at 20%) may have to be reduced if luminance artifacts occur. These are clearly apparent at high contrasts and manifest as a uniform region of lower luminance at the location where the patch is presented. These artifacts are the result of poor monitor bandwidth and can be circumvented by lowering the contrast of the patch.
When all these potential problems are eliminated, the monitor should appear to display a uniform gray field when viewed with static eyes, but a glimpse of the Gabor patch should be visible when horizontal saccades are executed.
Matlab script
%

% Created by Andrew Haun

%

clear

Hdeg = 12;	                         %extent of the grating window will be defined as 12°

Hsize = 512;	                                         %pixel extent of the grating window

Vsize = 256;	                                         %pixel extent of the grating window

Hcon = 6*Hsize/Hdeg;	                 %horz space constant of the gaussian envelope is 6°

Vcon = 3*Hsize/Hdeg;	                                                %vert constant is 3°

gam = 0.5;	                     %adjusting this value roughly corrects for monitor gamma

meanLum = 255*(0.5^gam);	                                                     %background

[Hgrid,Vgrid] = meshgrid(1:Hsize,1:Vsize);

gbub = exp(-((Hgrid-Hsize/2)./Hcon).^2 - ((Vgrid-Vsize/2)./Vcon).^2);

                                                               	 %the gaussian envelope

sf = .2;	                                     %spatial frequency of the cosine is .2 cpd

cosine = cos(sf*Hdeg*2*pi*(Hgrid-Hsize/2)./Hsize);                %the cosine is vertical

contrast=.2;	                                                         %Michelson contrast

grating(:,:,1) = .5+contrast*.5*gbub.*cosine;

                                              %create counterphase versions of the grating

grating(:,:,2) = 1-grating(:,:,1);

whichScreen = max(screen(’screens’));

hz = Screen(’FrameRate’,whichScreen);

[W H] = Screen(’WindowSize’,whichScreen);

try

  KbName(’UnifyKeyNames’);

  space = KbName(’space’);

  esc = KbName(’ESCAPE’);

  Screen(’Preference’,’VisualDebugLevel’, 1);	                     %psych toolbox startup

  [window winRect]=Screen(’OpenWindow’,whichScreen, meanLum);

  Screen(window,’FillRect’,meanLum);

  Screen(’Flip’,window);

  offScreenRect = SetRect(1,1,Hsize,Vsize);	                    % set up rects for stimuli

  onScreenRect = centerRect(offScreenRect,winRect);

  for x = 1:2	                                    %assign the gratings to the video stream

   gtex(x) = Screen(’MakeTexture’,window,255*(grating(:,:,x).^gam));

  end;

  oldPriority=Priority([2]);

  %while cont is 0, present gratings 1 and 2 on alternate frames

  %(i.e. counterphase at display refresh rate)

  cont = 0;

  counter = 0;

  while(cont)

   counter = counter+1;

   Screen(’DrawTexture’, window, gtex(mod(counter-1,2)+1),offScreenRect,onScreenRect);

   Screen(’Flip’,window);

   [d1 d2 keycode]=KbCheck;

   if(d1)

      if(keycode(esc)), cont = 1; end;

   end;

  end;

  screen(’closeall’);

catch

  screen(’closeall’);

  rethrow(lasterror)

end;
Appendix C: Fitting psychometric functions and obtaining bootstrap confidence intervals
Denoising 2AFC data as described by García-Pérez (2010) amounts to considering all the observer’s “uncertain” responses under the three-category response format as if they had been wrong responses under the typical two-category 2AFC response format. The actual proportion of “uncertain” responses varied across observers between 27 and 47%, in agreement with expectations based on model simulations and with empirical data reported in García-Pérez (2010). A denoised logistic psychometric function for 2AFC tasks is then given by fitting the function

to the resultant data, where γ is the lower asymptote determined by the observer’s tendency to guess (see García-Pérez, 2010), λ is a finger-error parameter that yields an upper asymptote at 1 − λ, θ is a threshold parameter satisfying Ψ(θ) = (1 − λ + γ)/2 (thus representing the stimulus level at which probability correct is midway between the upper and lower asymptotes), and β is a slope parameter that determines the steepness of the function. The function was fitted to the applicable data by seeking maximum-likelihood estimates for its parameters with NAG subroutine E04JYF (Numerical Algorithms Group, 1999), which allows constrained optimization. We imposed the natural constraints  > 0 and
  < 0 and, following the recommendations of Wichmann and Hill (2001) regarding the asymptotes, we also constrained 0 ≤
  ≤ 0.1 and 0 ≤
  ≤ 0.1. The support of the psychometric function (see García-Pérez and Alcalá-Quintana, 2005) was then computed as

which thus represents the width of the psychometric function defined as the extent of its central 98% range.
Once the parameters of Eq. C1had been estimated for a given condition, a 95% confidence interval for each parameter was obtained with bootstrap methods. Specifically, 5000 replicates were simulated using the fitted psychometric function and an experimental setup involving the same staircases that gave rise to the actual data, and parameter estimates for Eq. C1were obtained from each replicate. Then, the 2.5-th and the 97.5-th quantiles of the resultant distribution of estimates for each parameter were taken as the limits of the 95% confidence region for that parameter.
Keywords: saccades, saccadic suppression, intrasaccadic perception, magnocellular system, psychometric function, contrast detection
Citation: García-Pérez MA and Peli E (2011) Visual contrast processing is largely unaltered during saccades. Front. Psychology 2:247. doi: 10.3389/fpsyg.2011.00247
Received: 23 February 2011; Accepted: 07 September 2011;
Published online: 26 September 2011.
Edited by:
Frans Verstraten, Universiteit Utrecht, NetherlandsCopyright: © 2011 García-Pérez and Peli. This is an open-access article subject to a non-exclusive license between the authors and Frontiers Media SA, which permits use, distribution and reproduction in other forums, provided the original authors and source are credited and other Frontiers conditions are complied with.
*Correspondence: Miguel A. García-Pérez, Departamento de Metodología, Facultad de Psicología, Universidad Complutense, Campus de Somosaguas, 28223 Madrid, Spain. e-mail: miguel@psi.ucm.es