 Pradeep Ruperao1*
 Prasad Gandham2
 Damaris A. Odeny1Sean Mayes1
 Sivasubramani Selvanayagam3
 Nepolean Thirunavukkarasu4Roma R. Das5Manasa Srikanda6Harish Gandhi7Ephrem Habyarimana5Eric Manyasa8
 Baloua Nebie9Santosh P. Deshpande10
 Abhishek Rathore11*
- 1Center of Excellence in Genomics and Systems Biology, International Crops Research Institute for the Semi-Arid Tropics (ICRISAT), Hyderabad, India
- 2School of Plant, Environmental and Soil Sciences, Louisiana State University Agricultural Center, LA, United States
- 3Wageningen University and Research, Wageningen, Netherlands
- 4Genomics and Molecular Breeding Lab, Indian Council of Agricultural Research (ICAR) - Indian Institute of Millets Research, Hyderabad, India
- 5International Crops Research Institute for the Semi-Arid Tropics, Hyderabad, India
- 6Department of Statistics, Osmania University, Hyderabad, India
- 7International Maize and Wheat Improvement Center (CIMMYT), Nairobi, Kenya
- 8Sorghum Breeding Program, International Crops Research Institute for the Semi-Arid Tropics, Nairobi, Kenya
- 9International Maize and Wheat Improvement Center (CIMMYT), Dakar, Senegal
- 10Hytech Seed India Private Limited, Hyderabad, India
- 11Excellence in Breeding, International Maize and Wheat Improvement Center (CIMMYT), Hyderabad, India
Due to evolutionary divergence, sorghum race populations exhibit significant genetic and morphological variation. A k-mer-based sorghum race sequence comparison identified the conserved k-mers of all 272 accessions from sorghum and the race-specific genetic signatures identified the gene variability in 10,321 genes (PAVs). To understand sorghum race structure, diversity and domestication, a deep learning-based variant calling approach was employed in a set of genotypic data derived from a diverse panel of 272 sorghum accessions. The data resulted in 1.7 million high-quality genome-wide SNPs and identified selective signature (both positive and negative) regions through a genome-wide scan with different (iHS and XP-EHH) statistical methods. We discovered 2,370 genes associated with selection signatures including 179 selective sweep regions distributed over 10 chromosomes. Co-localization of these regions undergoing selective pressure with previously reported QTLs and genes revealed that the signatures of selection could be related to the domestication of important agronomic traits such as biomass and plant height. The developed k-mer signatures will be useful in the future to identify the sorghum race and for trait and SNP markers for assisting in plant breeding programs.
Introduction
The process of domestication and natural selection leads to an increased frequency of favorable alleles and subsequently results in complete fixation at target genomic loci (Smýkal et al., 2018). Although the selection process targets advantageous alleles, it also inadvertently results in an increase in the frequency of alleles at neutral loci that are in linkage disequilibrium, a phenomenon referred to as selective sweep (Stephan et al., 1992). A selective sweep has the potential of enhancing the fitness of an individual at the expense of the overall genetic diversity of a population at the respective loci. As a result, modern cultivars are derived from a small fraction of genetically related varieties (Mccouch et al., 2013) in spite of the existence of the vast genetic diversity of global plant germplasm. A better understanding of and stepwise exploitation of existing natural variation in each crop is one key aspect of meeting the increasing food demand in the coming decades.
Sorghum [Sorghum bicolor (L.) Moench] is an important cereal crop grown and consumed by a large proportion of the global population. The earliest record of sorghum seeds was recorded at Nabta Playa (Egyptian-Sudanese border) and indicated early domestication (Wendorf et al., 1992). The subsequent migration and adaptation of sorghum across Africa and Asia led to the evolution of morphological and geographically diverse groups, classified into major races (Harlan and Wet, 1972; Harlan and Stemler, 2012). More recent phenotype and genotype-based classifications also support the sorghum race classification within the global diversity panel (Brown et al., 2011). However, inter-racial diversity has not been fully understood in sorghum in a way that allows exploitation of racial structure for heterotic gains. Development of such knowledge would improve overall genomic predictions in sorghum as has been done in other cereal crops (Norman et al., 2018) for the best use of the genome in crop improvement programs.
The extent of genetic diversity is measured by the number of nucleotide variants across individuals and species (Deu et al., 2006; Kebbede, 2020). Such variants range from single nucleotides to large-scale structural differences. However, most studies in the past have only used single nucleotide variation (Afolayan et al., 2019; Enyew et al., 2022) ignoring other structural variations such as insertion-deletions (indels) and presence-absence variations (PAV) (Saxena et al., 2014). PAVs are present in some individuals but absent in others, making them perfect for detecting major differences among multiple genomes. Pangenomes, therefore, can help obtain a more complete set of genomic variants for a species (Hurgobin and Edwards, 2017) since they represent irreversible changes for a given species. The availability of sorghum pangenomes (Ruperao et al., 2021; Tao et al., 2021) makes it possible to carry out a more extensive genetic variation analysis across the different races.
Despite emerging advances in sequencing technologies, distinguishing accurate genetic variants from sequencing errors remains challenging. Because a majority of the genome assembly tools are based on the de Bruijn graphs (Zerbino and Birney, 2008; Simpson et al., 2009; Bankevich et al., 2012; Peng et al., 2012), in which the sub-sequence of k-mers (substrings of length k) are used to construct the graph and output the paths as contigs (without branching). The resulting contigs can therefore be biased and fragmented as a result of sequencing errors, especially in highly repetitive genomes, leading to low confidence in variant calling. Alternative alignment-free methods of variant detection have been developed using both k-mer frequencies and information theory (Song et al., 2014; Pajuste et al., 2017; Zielezinski et al., 2017; Audano et al., 2018). These alignment-free methods have been applied in several studies including for phylogeny estimation (Haubold, 2014), identification of mutations between strains (Nordström et al., 2013) and association mapping (Sheppard et al., 2013).
More recently, deep learning methods have been introduced as a machine learning technique applicable to a range of fields including genomics. Deep learning models can be trained without prior knowledge of genomics and next-generation sequencing (NGS) data to accurately call genetic variants (Telenti et al., 2018). Learning a deep convolutional neural network-based statistical relationship between aligned reads, a genotype calling approach has been implemented in DeepVariant programs (Poplin et al., 2018). The DeepVariant approach is reported to outperform the existing variant calling tools (Poplin et al., 2018).
The objective of our study was to use deep learning (DeepVariant method) to better understand genetic variation, domestication events and selection signatures across known sorghum races. We used existing whole-genome sequence data to quantify genome-wide positive and negative selected regions to enhance our understanding of genome function and the frequency of genetic variations. In addition, we determined the putative signals of selection in sorghum that have resulted from true selective events or population bottlenecks.
Results
DeepVariant calling and annotation
The whole genome sequence (WGS) data (Table 1 and Supplementary Table 1) were mapped (Supplementary Table 2, Supplementary Figure 1) to the sorghum pangenome (Ruperao et al., 2021), and a total of 1.7 million high-quality SNPs, and 470,375 InDels (154,900 insertions, 278,951 deletions and 36,524 mixed variants) were called using the DeepVariant method. Homozygous SNPs were predominant (88.3%) over heterozygous SNPs (11.6%) (Supplementary Table 3). The overall density of SNPs was 2.5 SNP/kb, whereas the indel density was 0.6/kb. The maximum (209,429) and minimum (147,952) SNPs were reported on chromosome 2 (0.3/kbp) and chromosome 9 (0.4/kbp), respectively (Supplementary Table 4) (Figure 1), while the maximum (70,722) and minimum (34,530) number of indels were reported on chromosome 1 (0.8%) and chromosome 8 (0.5%) respectively. Most of the insertions (98%) and deletions (93%) were less than 10bp in length (Supplementary Figure 2A).
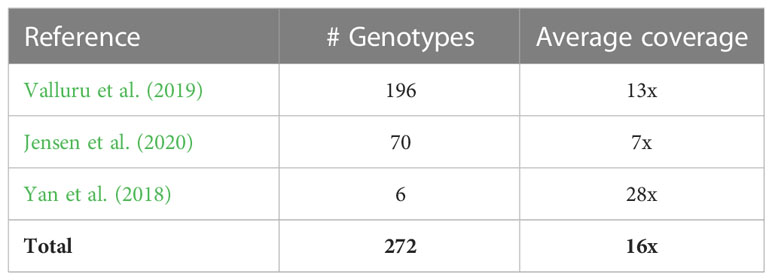
Table 1 A summary of publicly available data used in the current analysis.
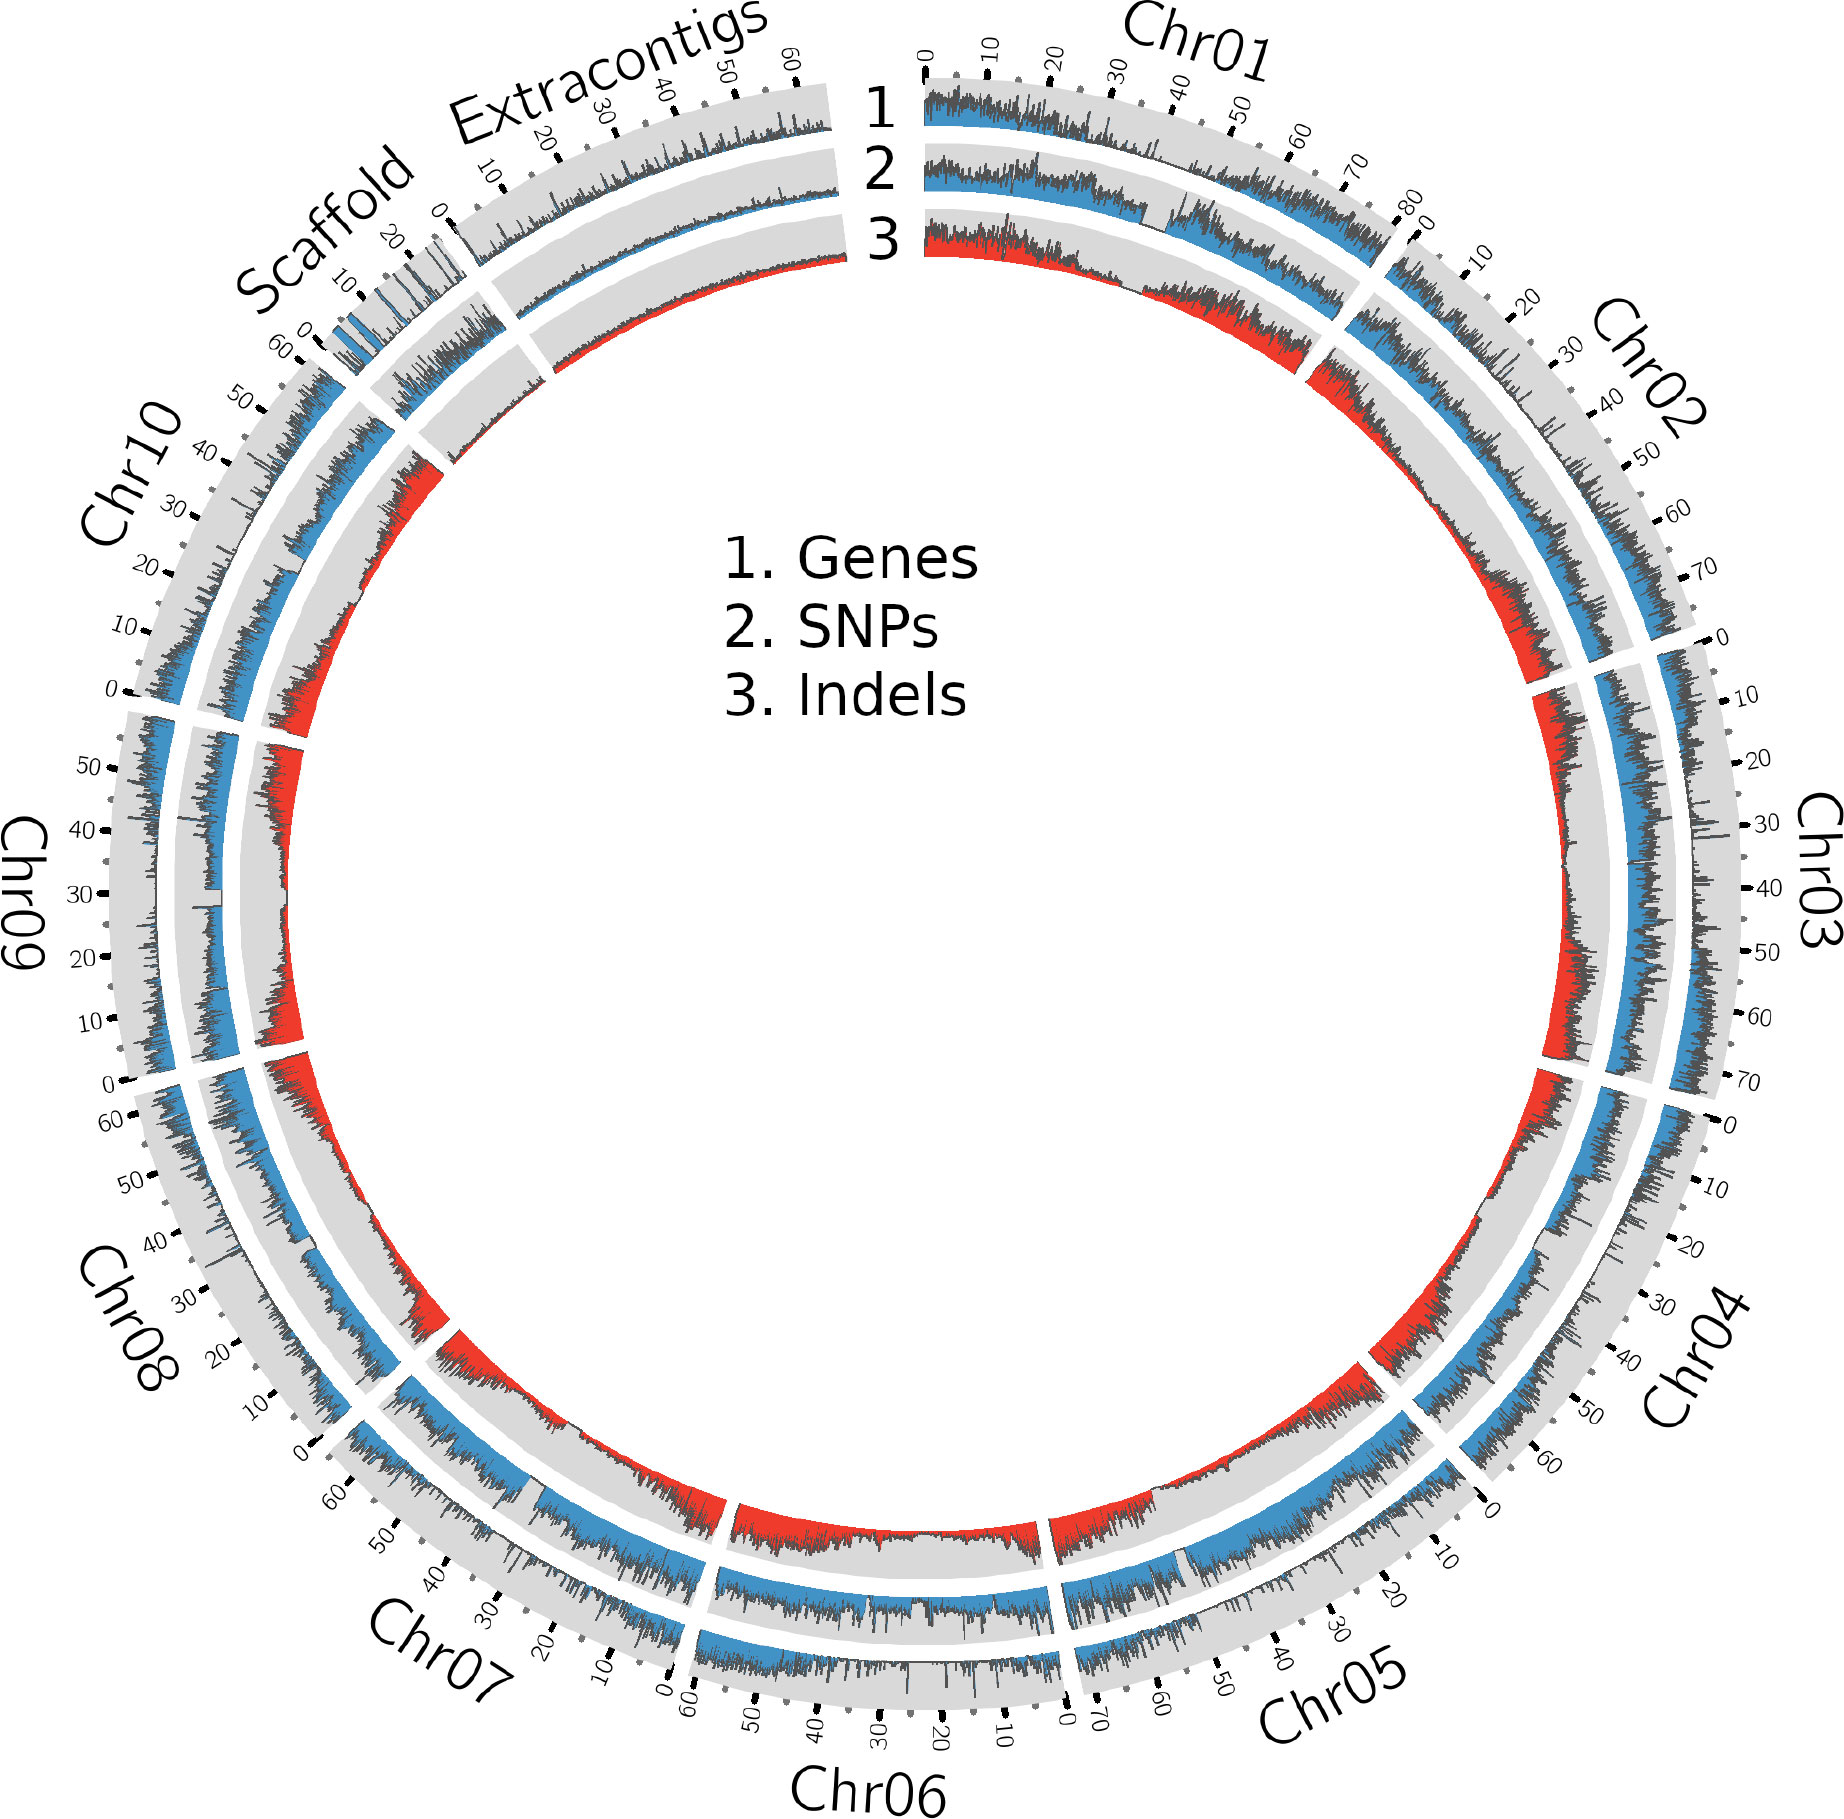
Figure 1 A Circos plot showing the density of genes, SNPs and InDels in the sorghum pangenome.
SNP annotation reported 11% SNPs of which 51,891 were synonymous and 53,159 non-synonymous, resulting in a non-synonymous-to-synonymous substitution ka/ks ratio of 1.02 (Supplementary Tables 5, 6), consistent with the previous study by Mace et al. (2013). Sorghum accessions NSL54318 (50,238 non-synonymous; 3,933 start gain; 88 start lost and 611 stop gain SNPs) and PI660645 (46520 non-synonymous; 3700 start gained and 103 stop lost) harbored the maximum and minimum effect SNPs (Supplementary Table 5). There were more transitions (C/T and A/G) than transversions (A/T, A/C, T/G and C/G) with a transition/transversion ratio ranging from 1.912 (NSL50716, IS30508) to 1.983 (PI329719). The overall tr/tv ratio was 1.960 (Supplementary Table 7).
SNPs with large effects were the least common (1,362; 0.04%) compared to SNPs with low (63,298; 1.9%), moderate (53,159; 1.6%) and modifying SNPs (96%). A total of 89.3% (1,595,340) of the SNPs were conserved across five sorghum race accessions while the remaining 10.6% (190,321) were variably detected in at least one sorghum race. Among the SNPs in the sorghum race accessions, 0.03% (590) were race-specific, the majority (60.6%; 358) of which were reported in durra and the least in the bicolor race (6.1%; 36) (Supplementary Table 8) (Supplementary Figure 2B). Most of the race-specific SNPs (57.9%) were highly confident with support from more than 10 accessions. Only 21% of the race-specific SNPs were supported by less than 5 accessions (Supplementary Figure 2C).
Sorghum races caudatum, durra, guinea and kafir had the highest proportion of SNPs with the low MAF category (0.0,0.1) compared to bicolor. Kafir had the highest proportion of SNPs with MAF category (0.1, 0.2) while the bicolor race reported the highest proportion of SNPs with MAF greater than 0.2, which is expected for a race with a long history of cultivation (Supplementary Figure 2D).
Genetic and nucleotide diversity
The SNP-based Neighbor-Joining (NJ) dendrogram of the 272 genotypes grouped them largely according to race genetic relatedness (Supplementary Figure 3). Four major clusters were observed with a number of subgroups. The phylogenetic tree contained a distinct cluster of 63 guinea race accessions (nodes in blue color) mixed with a few other race individuals, such as durra (PI221662, PI248317, PI267653 and PI148084) (nodes in brown color), kafir (PI660555 and NSL365694) (nodes in pink color), bicolor race (IS12697) (nodes in red color). The other sorghum race clusters were split with non-corresponding sorghum race accessions. For example, durra has 91 accessions split into two clusters with caudatum and kafir accessions. The bicolor accessions were placed mostly in durra and guinea clusters. Among the bicolor accessions, the China origin accessions were grouped distinctly in the durra cluster compared to other bicolor accessions.
The evaluation of nucleotide diversity across all 272 accessions showed that sorghum had low diversity (0.0000483715) compared to wheat (πA=0.0017, πB= 0.0025 and πD= 0.0002) (Zhou et al., 2020), maize (π = 0.014) (Tenaillon et al., 2001) and rice π = 0.0024 (Huang et al., 2010) (Supplementary Figures 4, 5). The diversity varies depending on the population size and the level of diversity of the accessions used in such a population. However, such low diversity was also reported in an earlier study (Sapkota et al., 2020). We observed significant differences (P < 0.05) in nucleotide diversity between three sorghum races (caudatum, durra and guinea) that were represented with more than 50 genotypes. The durra had the highest nucleotide diversity while caudatum showed the lowest (πC= 0.0000419, πG= 0.0000631 and πD= 0.0000637). The distribution of nucleotide diversity on the sorghum race genome was in the order of πD > πG > πC.
We used the Fst index to estimate the temporal genetic divergence between the race accessions and observed that the level of genetic differentiation among the sorghum race populations ranged from moderate (Fst = 0.044 for caudatum vs durra) to relatively high (Fst = 0.18 for bicolor vs guinea) (Supplementary Tables 9, 10; Supplementary Figure 6) indicating that inter-population differences were relatively low. The average Fst between the bicolor and other races was ~0.16, which was higher than in non-bicolor race comparisons suggesting that gene flow from bicolor to other races was much earlier than the gene flow between the rest (non-bicolor) of the races. The durra and guinea populations revealed the second-highest Fst of 0.1228 and were classified as the sorghum race intermediates (Supplementary Table 9). A total of 19,696 SNPs having significant high Fst were reported between bicolor-kafir race combinations, of which 910 SNPs were genic SNPs (Supplementary Table 10).
The difference between (diverse) sorghum race populations was measured with Tajima’s D (Table 2). A total of 13,070 SNPs were reported to have θπ (observed value) less than θk (expected value) (maximum 4,612 and minimum 1,869 SNPs from durra and bicolor respectively), indicating that the variants may have undergone a recent selective sweep. Another 311,045 SNPs reported greater θπ compared to θk (maximum 202,684 and minimum 76,836 SNPs from guinea and bicolor, respectively) suggesting balancing selection. Compared to non-bicolor race mutations, a lower number of mutations were linked to genes within a selection sweep than with balancing selection genes in the bicolor race (Supplementary Tables 11, 12).
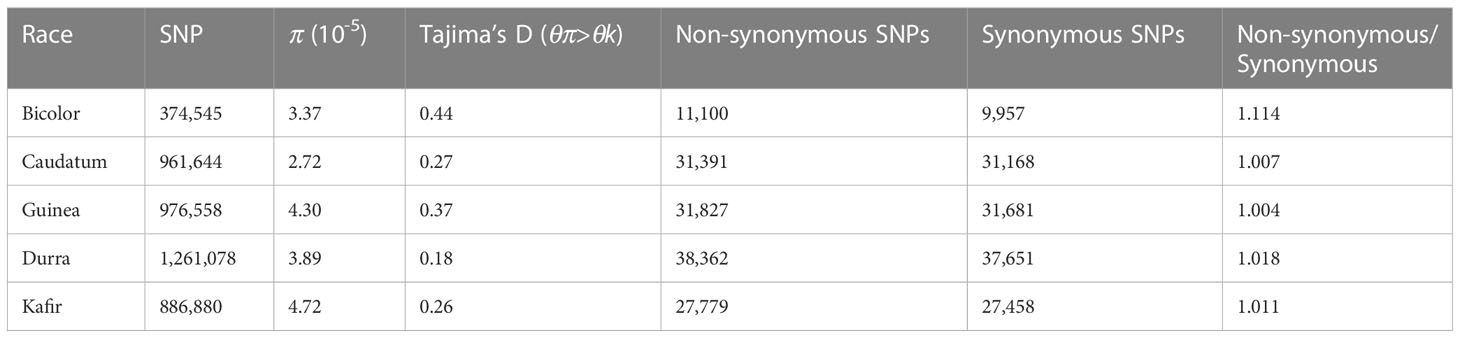
Table 2 Summary SNP statistics in Sorghum race populations.
K-mer based divergence
The k-mer genetic distance between the sorghum accessions was computed from the size-reduced sketches and distance function developed in the mash tool (Supplementary Table 13). The durra race was the most distinct from the reference pan-genome (Ruperao et al., 2021) based on the mean distance of accessions, followed by guinea (Figure 2A). The bicolor race was the most closely related race to the reference (Figure 2). Accessions from each sorghum race, SCIV4, PI285039, PI276823, PI665088 and PI665108 from bicolor, caudatum, durra, guinea and kafir, respectively were more genetically distinct from the reference (Supplementary Table 13) and representative of the specific race and therefore used for k-mer analysis. These distinct sorghum accessions were in agreement with the NJ distance between the accessions (Supplementary Figure 3).
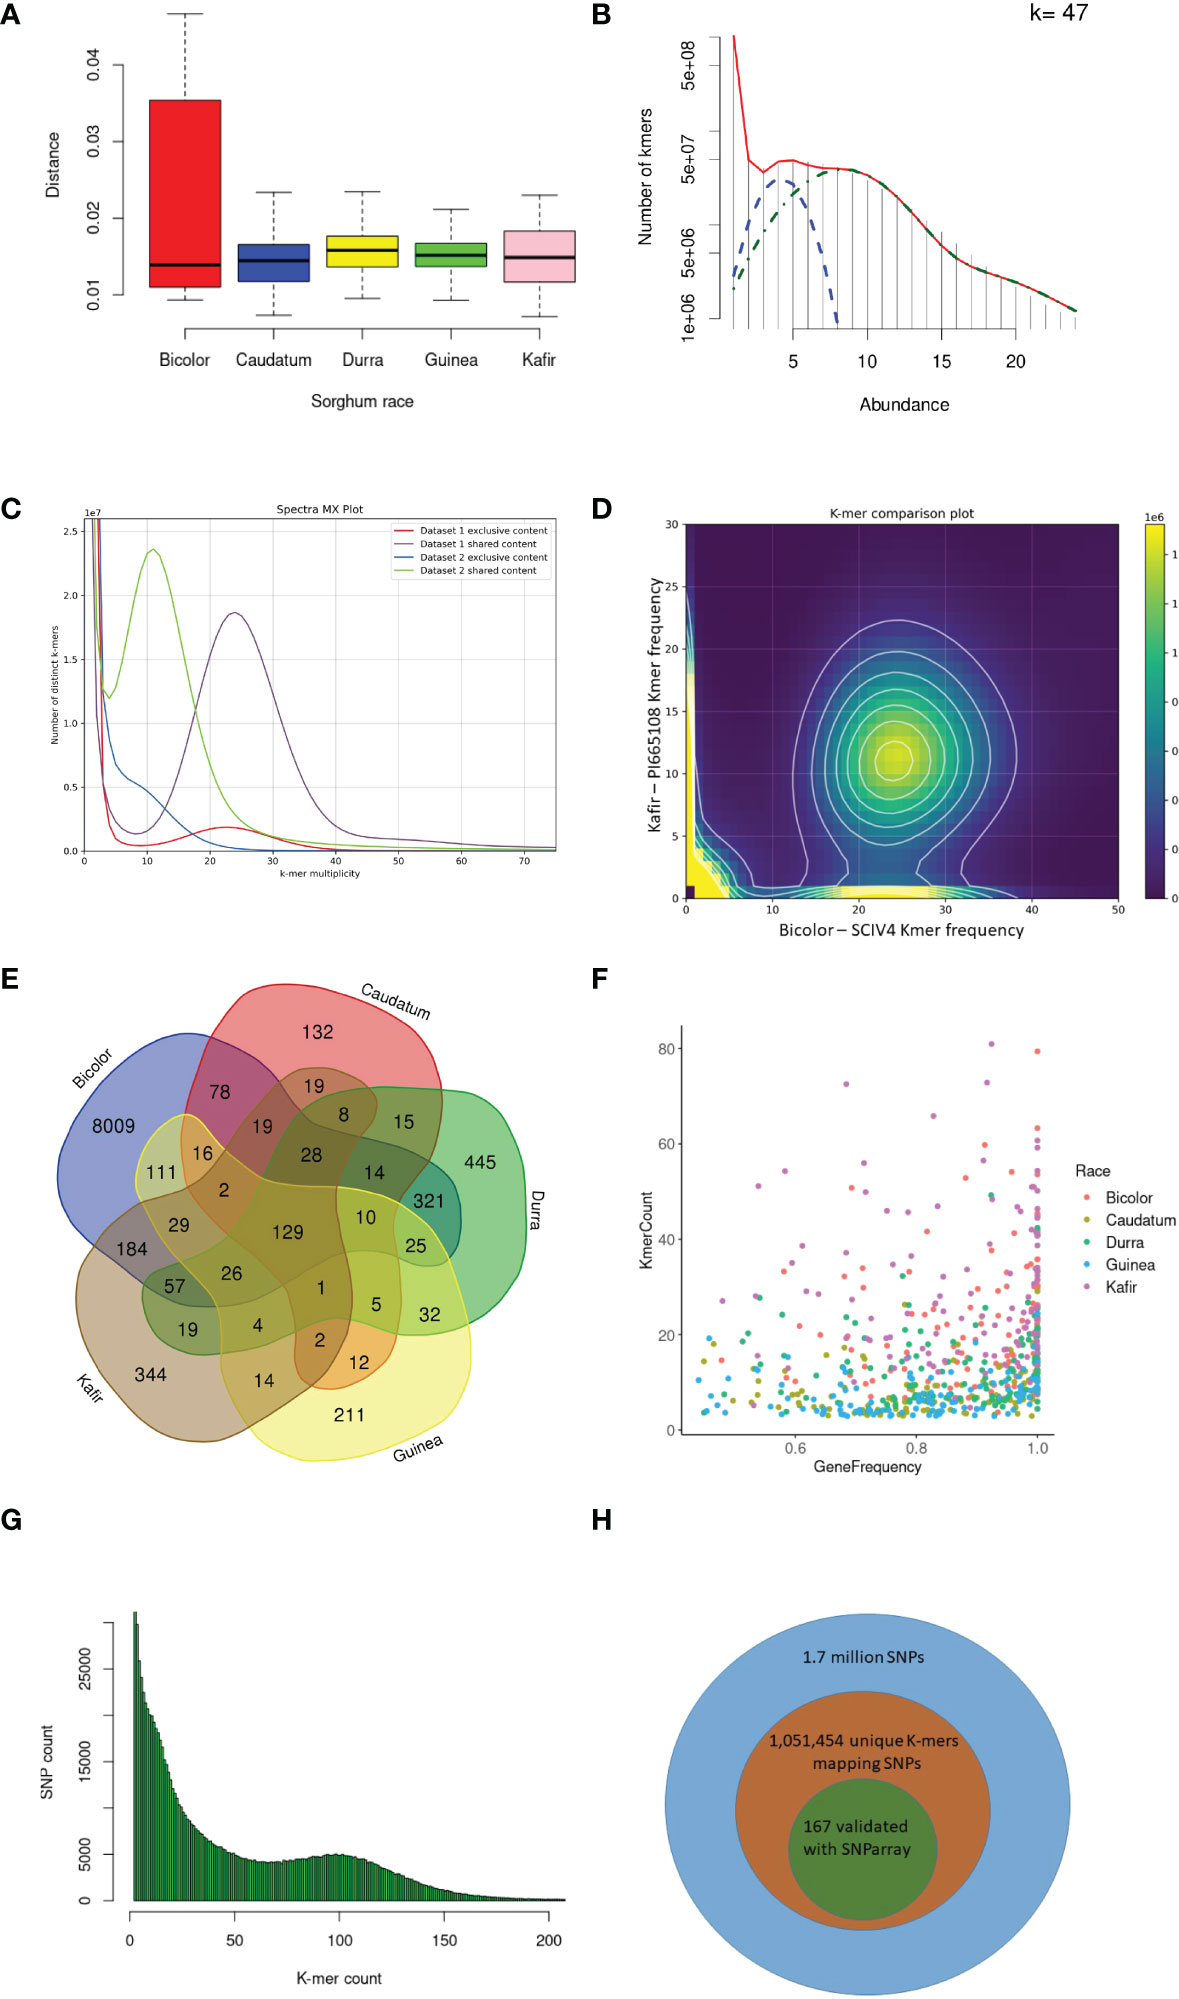
Figure 2 K-mer and read mapping overview. (A) An alignment-free method, the Jaccard index uses the hash procedure to measure the distance between sorghum race accessions. (B) Sampled histogram and fit for 47 k-mer lengths. Red is the fit of the complete statistical model of the histogram, blue is the heterozygous k-mers and green is the only homozygous k-mers (C) The k-mers share between kafir (PI665108) and bicolor (SCIV4) sorghum race accessions as dataset1 and dataset2 respectively. (D) Distinct k-mer share between kafir and sorghum race, the cloud indicates the shared k-mers and heigh density k-mers on x and y-axis are unique k-mers respectively. (E) Mapped k-mer sequence reads in the number of genes in each sorghum race accessions (F) Proportion of sorghum race common genes covered with horizontal and vertical coverage with k-mer sequence reads. (G) The unique k-mers holding the deepvariant SNPs with respective k-mer count and off these, (H) the proportion of deepvariant SNPs validated.
With the optimized 47 k-mer size (Figure 2B), the overall k-mer sequence comparison between the five race accessions (2.3 billion k-mers) showed that 35.3% (434 million unique k-mers) of common k-mers present in all five races accessions, this indicates the conserved k-mer of all sorghum race accessions. The 13.3% (314 million k-mers) were commonly seen in any four sorghum race accessions, indicating that these k-mers were absent in at least any one of the sorghum races. This variability decreased to 8.8% (108 million k-mers) and 6.3% (78 million k-mers) on measuring the common k-mers between three and two sorghum race accessions respectively. For example, SCIV4 (bicolor) and PI665108 (kafir) shared 402 million distinct k-mers, which was 45% and 23.5% of total distinct k-mers reported respectively (Figures 2C-D). From this k-mer comparison between the sorghum race accessions, 23.8% of k-mers were unique to sorghum races. These race-specific k-mers were possibly unique to genomic sequence (as a single genome sequence for each race was used for the analysis).
Overall, 10,321 gene PAVs were identified based on the k-mer sequence reads mapping to sorghum pan-genome assembly (Supplementary Table 14) (Figure 2E). The mapping of the race-specific k-mer sequence reads identified 132, 8009, 211, 445, and 344 unique genes in caudatum, bicolor, guinea, durra, and kafir sorghum accessions, respectively. One hundred and twenty-nine (129) genes were commonly present in all sorghum race accessions (Supplementary Table 15), indicating the k-mers are unique with the specific variations or k-mers partially mapping the gene length-frequency with horizontal mapping range of 0.4 to 1 (frequency) (Figure 2F). Furthermore, 1,051,453 SNP were identified supporting the k-mers sequence (Figure 2G) reads of which, 85,048 SNPs were genic, and 167 SNPs were validated with the SNParray sequences (Figure 2H) (Supplementary Table 16) used for sorghum pangenome analysis (Ruperao et al., 2021).
Selection signatures
Several sweep regions were detected with iHS (Figures 3A, B and Supplementary Figure 3), of which, 64 were significant (FDR < 0.05) (Supplementary Table 17). The majority of sweeps were reported on chromosome 7 (19 regions) followed by chromosome 4 (17 regions) and chromosome 10 (2 regions) (Supplementary Table 17). The highest number of selective sweep regions were observed in durra (54 regions), followed by caudatum (51), guinea (45), kafir (38) and bicolor (30) (Supplementary Tables 18, 19). A total of 14 selective sweep regions were common in all five sorghum races while 21 regions were uniquely absent in any one sorghum race (Supplementary Table 18). For example, 9 selective sweep regions were reported in four sorghum races but uniquely absent in the bicolor race alone (Supplementary Table 18).
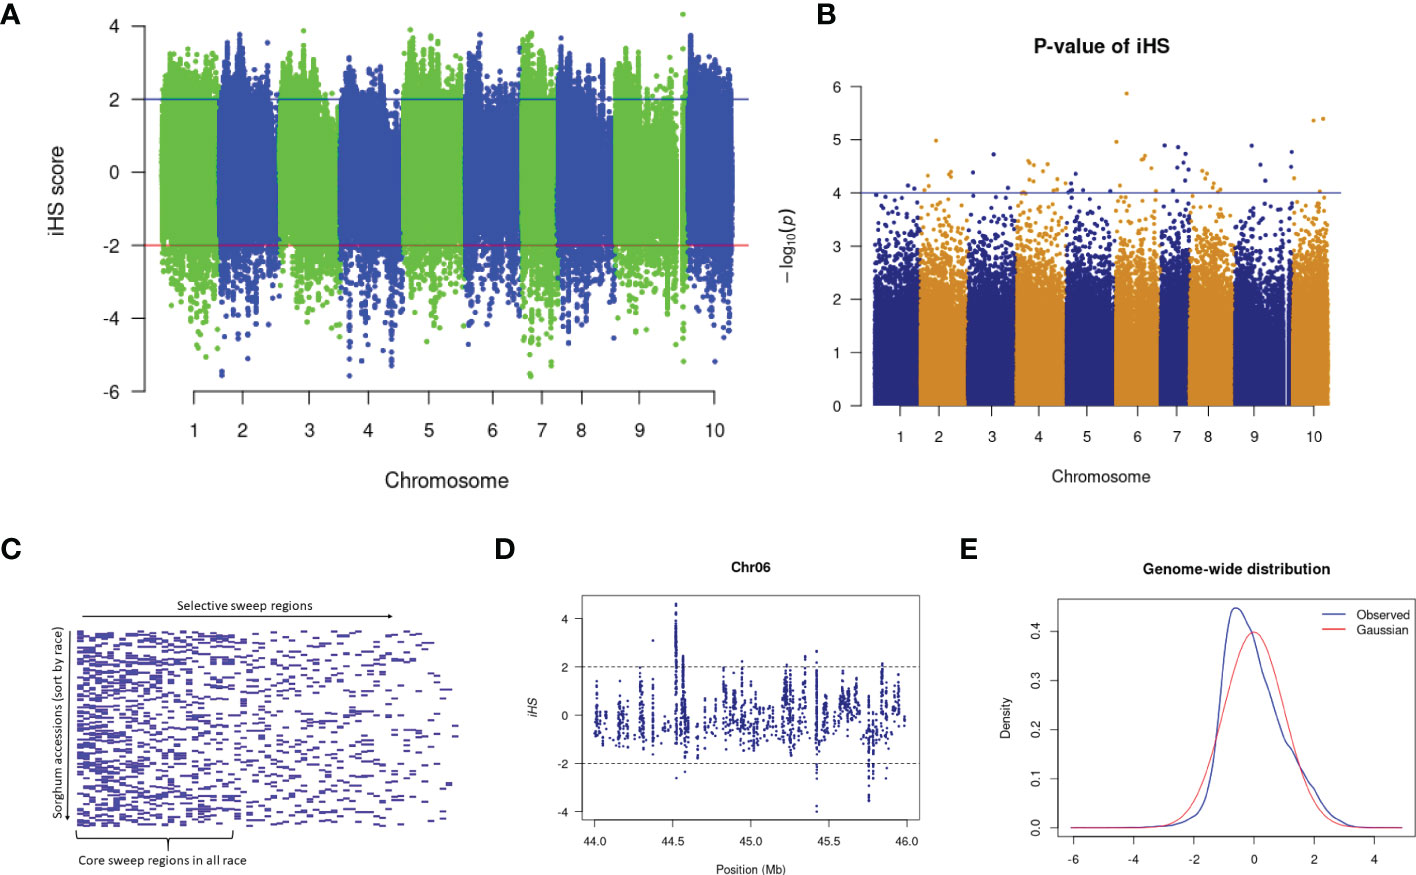
Figure 3 (A) The iHS score distribution across the genome with (B) associated p-values. (C) Selective sweep regions in sorghum accessions sorted by race. (D) A subset of iHS on chromosome 6 showing the regions having values above and below the threshold value and (E) The distributions of the standardized iHS scores and comparison with standard Gaussian distribution.
We used the cross-population extended haplotype homozygosity (XP-EHH) score and detected sweep regions from each combination of sorghum race population (Supplementary Figure 7) (Table 3). We identified 8,888 significant (FDR < 0.05) selection sweep regions, of which 3,504 regions were common between more than two sorghum race combinations (Supplementary Tables 20-S29). Out of all selective sweeps identified from the sorghum race combinations, chromosome 5 had the maximum of 1,399 regions while chromosome 9 had the least (616). The kafir population exhibited the highest (2,473) selective sweep regions in comparison with the guinea race (Supplementary Table 28). Only a few (525) sweep regions were reported in bicolor population (Supplementary Table 23).
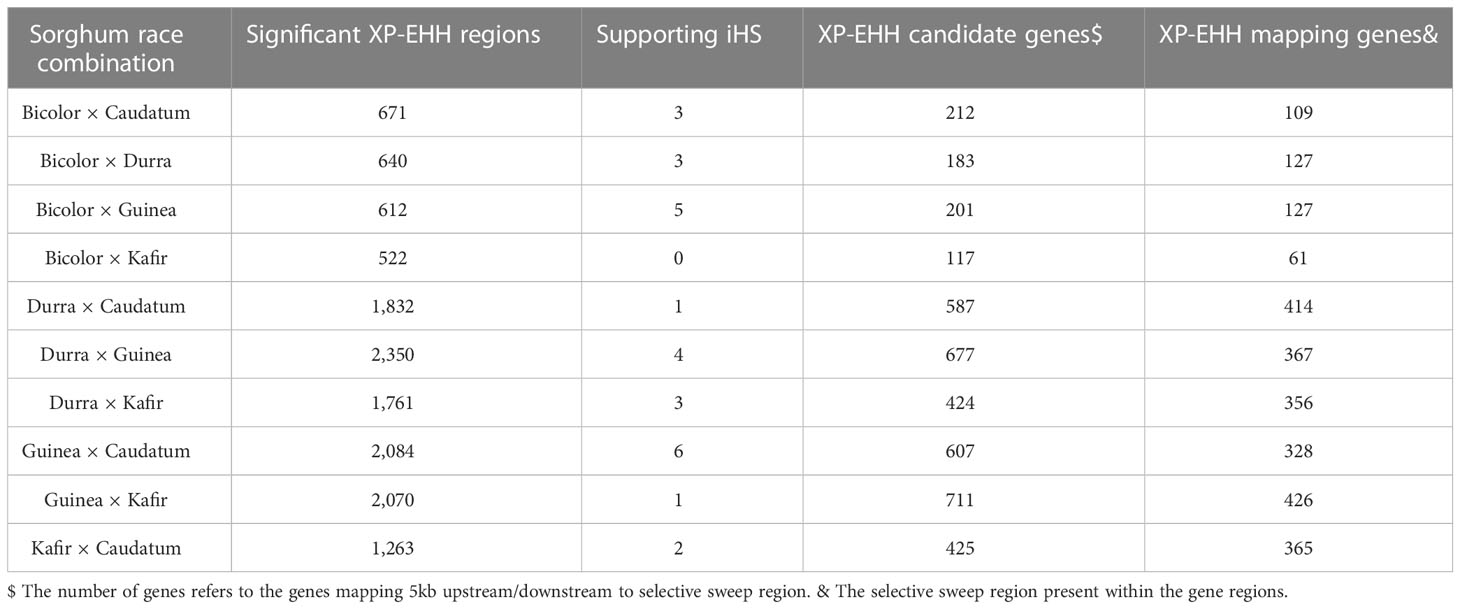
Table 3 Description of the candidate selective sweep regions detected using XP-EHH between the sorghum race populations.
Overlapping selection regions between Tajima’s D and XP-EHH
We defined the overlapping selection regions as those located beyond the thresholds and in the same chromosome sequence location. Tajima’s D statistics were obtained from each sorghum race population dataset and identified the genes which did not fit the neutral theory model at equilibrium between mutation and genetic drift. A total of 324,115 genome-wide bins were observed with non-equilibrium statistics of neutrality test, of which 311,045 (with SNPs in range of 76,836-bicolor to 202,684-guinea) were undergoing purifying selection (negative selection) and 13,070 were (with SNPs in range of 1,869-bicolor to 4,612 durra) selection maintained (balanced positive selection) (Figure 4A). Among the variants undergoing purifying selection, 43,191 bins had a significant low Fst index supporting the signature of a recent population expansion (Figure 4B), of which 14% were from genic regions (Supplementary Table 30). The purifying selection regions had low diversity (Figure 4D) with reduced allele frequency in the descendant population compared to the ancestral population.
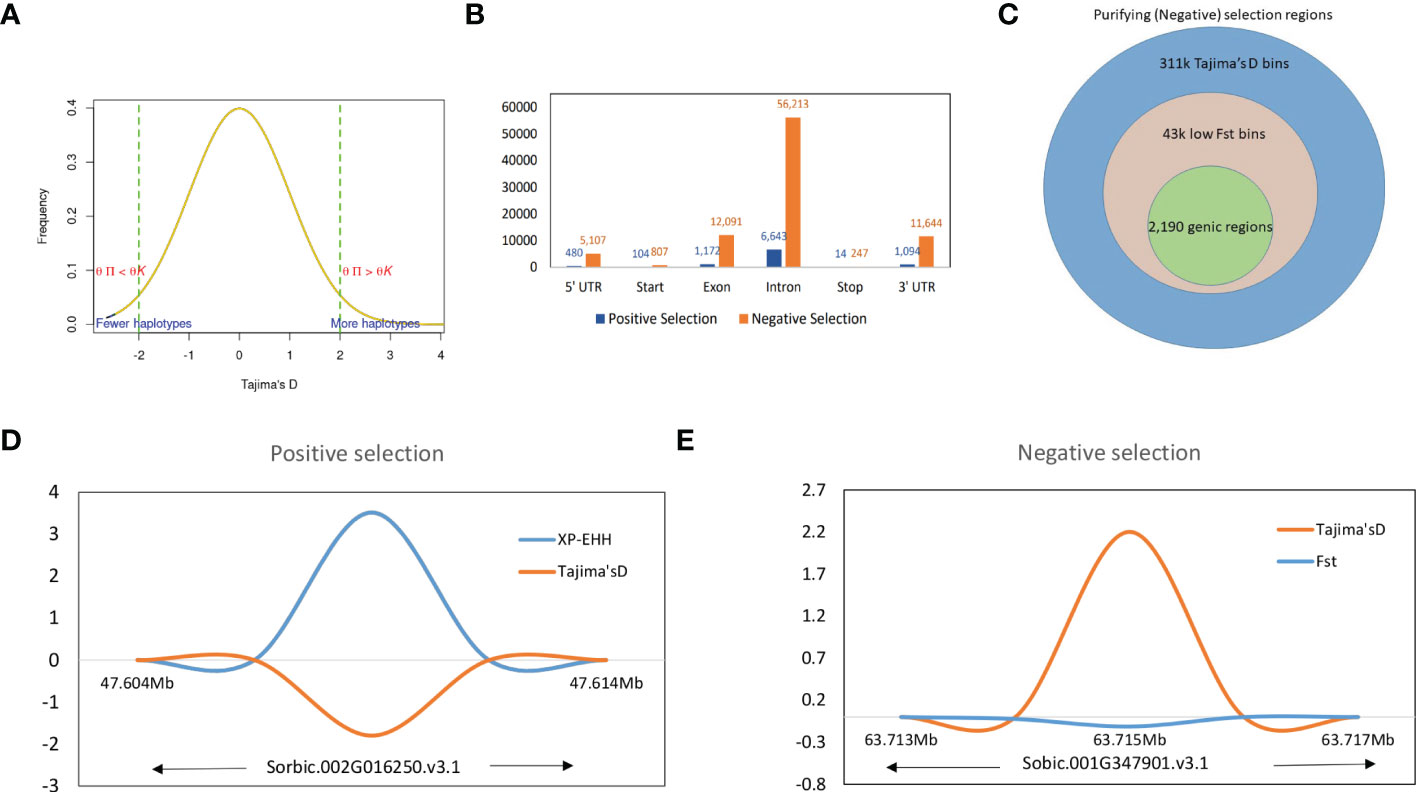
Figure 4 (A) Tajima’s D values distribution with signifying positive and negative thresholds. (B) Structural annotations of genomic regions in positive and negative thresholds. (C) The proportion of higher Tajima’s D values and lower Fst valued bins as negative selection regions and corresponding genic regions. (D) The positive selection region on Chr09 with XP-EHH score and Tajima’s D valued plot and (E) A genic negative selection region on Chr01 (specific to guinea race) with significantly higher Tajima’s D and lower Fst value regions.
The significant selection regions (FDR <0.05) detected by XP-EHH were specific to the pair-wise sorghum race combinations. Among the identified 8,888 significant XP-EHH candidate-sweep regions from overall sorghum race combinations, of which 179 regions were genic (Supplementary Table 31) and “selection-maintained variations” indicating the recent population contraction. The overall sweep regions were in the comparable range identified in other crops such as wheat, (3,105 – 16,141 sweep regions in the genome of domesticated einkorn and emmer lines; Zhou et al., 2020) and soybean (3,811 genes positioned within the selective sweep regions)(Saleem et al., 2021). Among the chromosomes, chromosome 5 and groups of 4,7,9,10 chromosomes contained the highest (33) and lowest (14) numbers of genes, respectively. A relatively low Tajima’s D was observed in selective sweep regions when compared with a significantly higher XP-EHH valued region (Figure 4D).
Enrichment of candidate genes under selection
A total of 2,370 genes genome-wide were observed to deviate significantly using equilibrium/neutrality tests, of which 179 were selection-maintained (balanced selection) while 2,191 were undergoing purifying selection (Supplementary Tables 30, 31). Durra and bicolor had the maximum (110) and minimum (39) number of genes undergoing positive selection respectively. Bicolor (409) and guinea (1,133) had the maximum and a minimum number of selection-maintained genes.
A similar trend of the fewest number of genes were reported in the bicolor race (421), with guinea having the maximum (1,166) genes under purifying selection. Among the five races, guinea and kafir shares the maximum number of common selection-maintained (26) and purifying (70) genes, suggesting potential rich gene flow between these two races (Figure 5). Additionally, guinea, kafir and durra reported maximum genes as sweep regions (guinea-kafir: 26, durra-guinea: 23 and durra-kafir: 21) (Figure 5A), with low nucleotide diversity (π) in caudatum and bicolor (Figure 3B) also indicating the traits regulated by these regions may have undergone similar histories of selection.
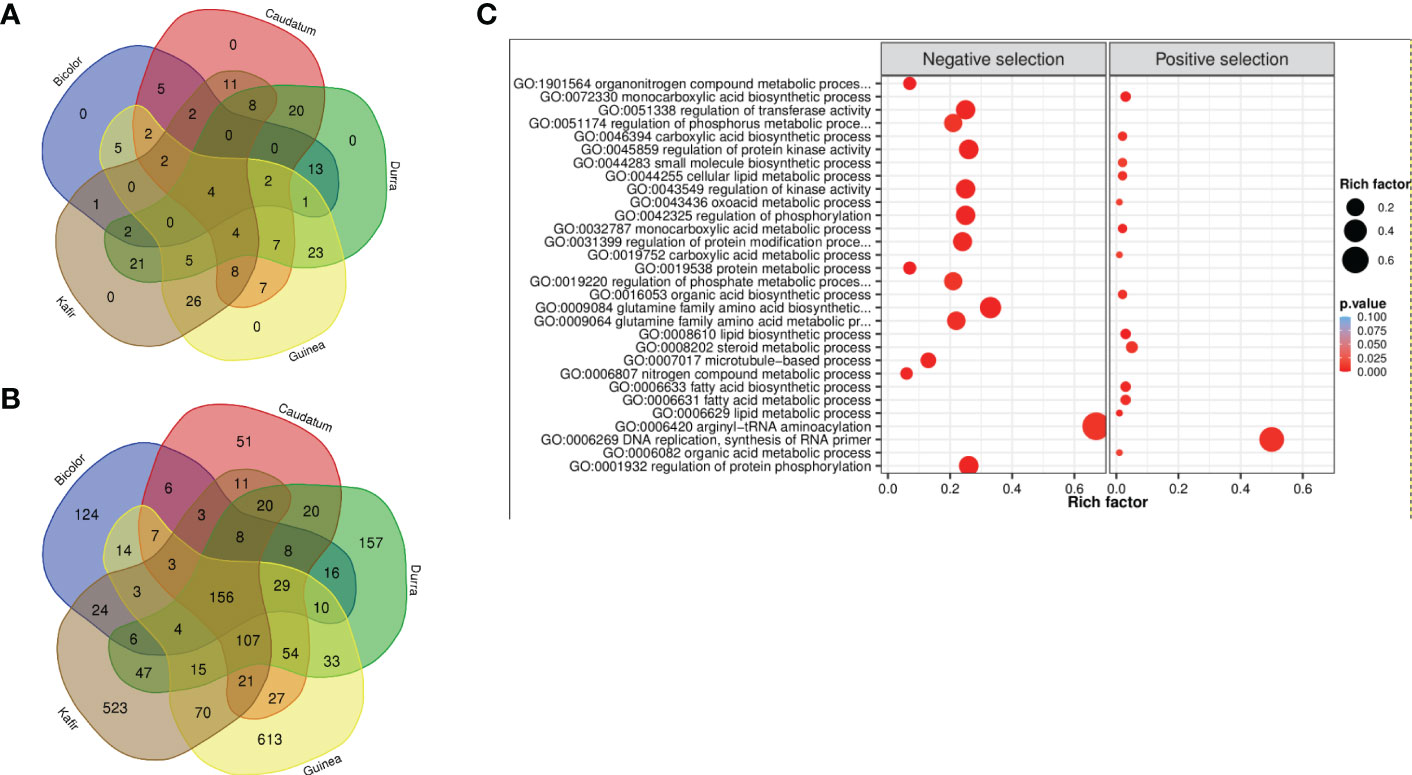
Figure 5 Venn diagram of (A) positive selection and (B) negative selection genes from five sorghum races combinations. (C) Significantly enriched GO biological terms for positive and negative selected genes (bubble color indicates the p-value range and size indicates the gene ratio).
The 2,370 genes undergoing selection pressure (both positive and negative) showed significantly enriched gene ontology (GO) term and among these genes (Figure 5C, Supplementary Figure 8), the top GO term was lipid biosynthetic process (GO:0008610) and organonitrogen compound metabolic process (GO:1901564) for genes with positive and negatively selection, respectively (Supplementary Table 32). Among the positively selected gene set, most of them were enriched with lipid biosynthetic process (GO:0008610), metabolic process (GO:0006629), carboxylic acid metabolic process (GO:0019752), oxoacid metabolic process (GO:0043436), organic acid metabolic process (GO:0006082), most of these metabolic pathways were related to plant stress resistance. Whereas the negatively selected gene was majorly enriched with nitrogen compound metabolic process (GO:0006807), organonitrogen compound metabolic process (GO:1901564) and protein metabolic process (GO:0019538) (Supplementary Table 32). The nitrogen utilization and metabolic pathway were found significantly enriched and confirmed the genes under selection throughout either domestication or during subsequent breeding with earlier selection study (Massel et al., 2016). The genes enriched with ‘DNA replication, ‘lipid metabolism’ and ‘hormone signal’ suggest that sorghum has evolved defense strategies, and enrichment of phosphorylation, kinase activity, transferase, phosphate and phosphorus metabolic process triggers many metabolic processes and plant growth activity.
Kyoto Encyclopedia of Genes and Genomes (KEGG) pathways were identified according to the selection’s signature candidate gene with a p-value <0.05 (Figure 6). A KEGG pathway enrichment analysis was performed for the selection signature gene to identify the number of significantly changed samples along the pathway that were relevant to the background number. A total of 2,370 genes were mapped onto 315 pathways, and the most enriched sequences were metabolic pathways and biosynthesis pathways. The top 14 pathways with the greatest number of annotated sequences are shown in Supplementary Table 33. Most of the significant pathways were in metabolism, biosynthesis, excision repair and secondary metabolites. The most significantly changed KEGG pathways were in sphingolipid metabolism (Figure 6B), betalain, steroid biosynthesis, phosphonate and phosphinate pathways for positive selection genes. Sphingolipids are essential components of plasma membrane providing structural integrity to plant membrane, regulating the cellular process, and also enhancing the tolerance of sorghum to biotic and abiotic stresses. Steroid hormone biosynthesis and the phosphonate and phosphinate metabolism pathways are also involved in the adaptation of sorghum to low salinity. Whereas base and nucleotide excision repair, biosynthesis of secondary metabolites, glycolysis, GPI and nitrogen metabolism were significantly enriched in negative selection genes (Supplementary Table 33). These annotations provide valuable information for studying the specific biological and metabolic processes and functions of genes under selection pressure in sorghum accessions.
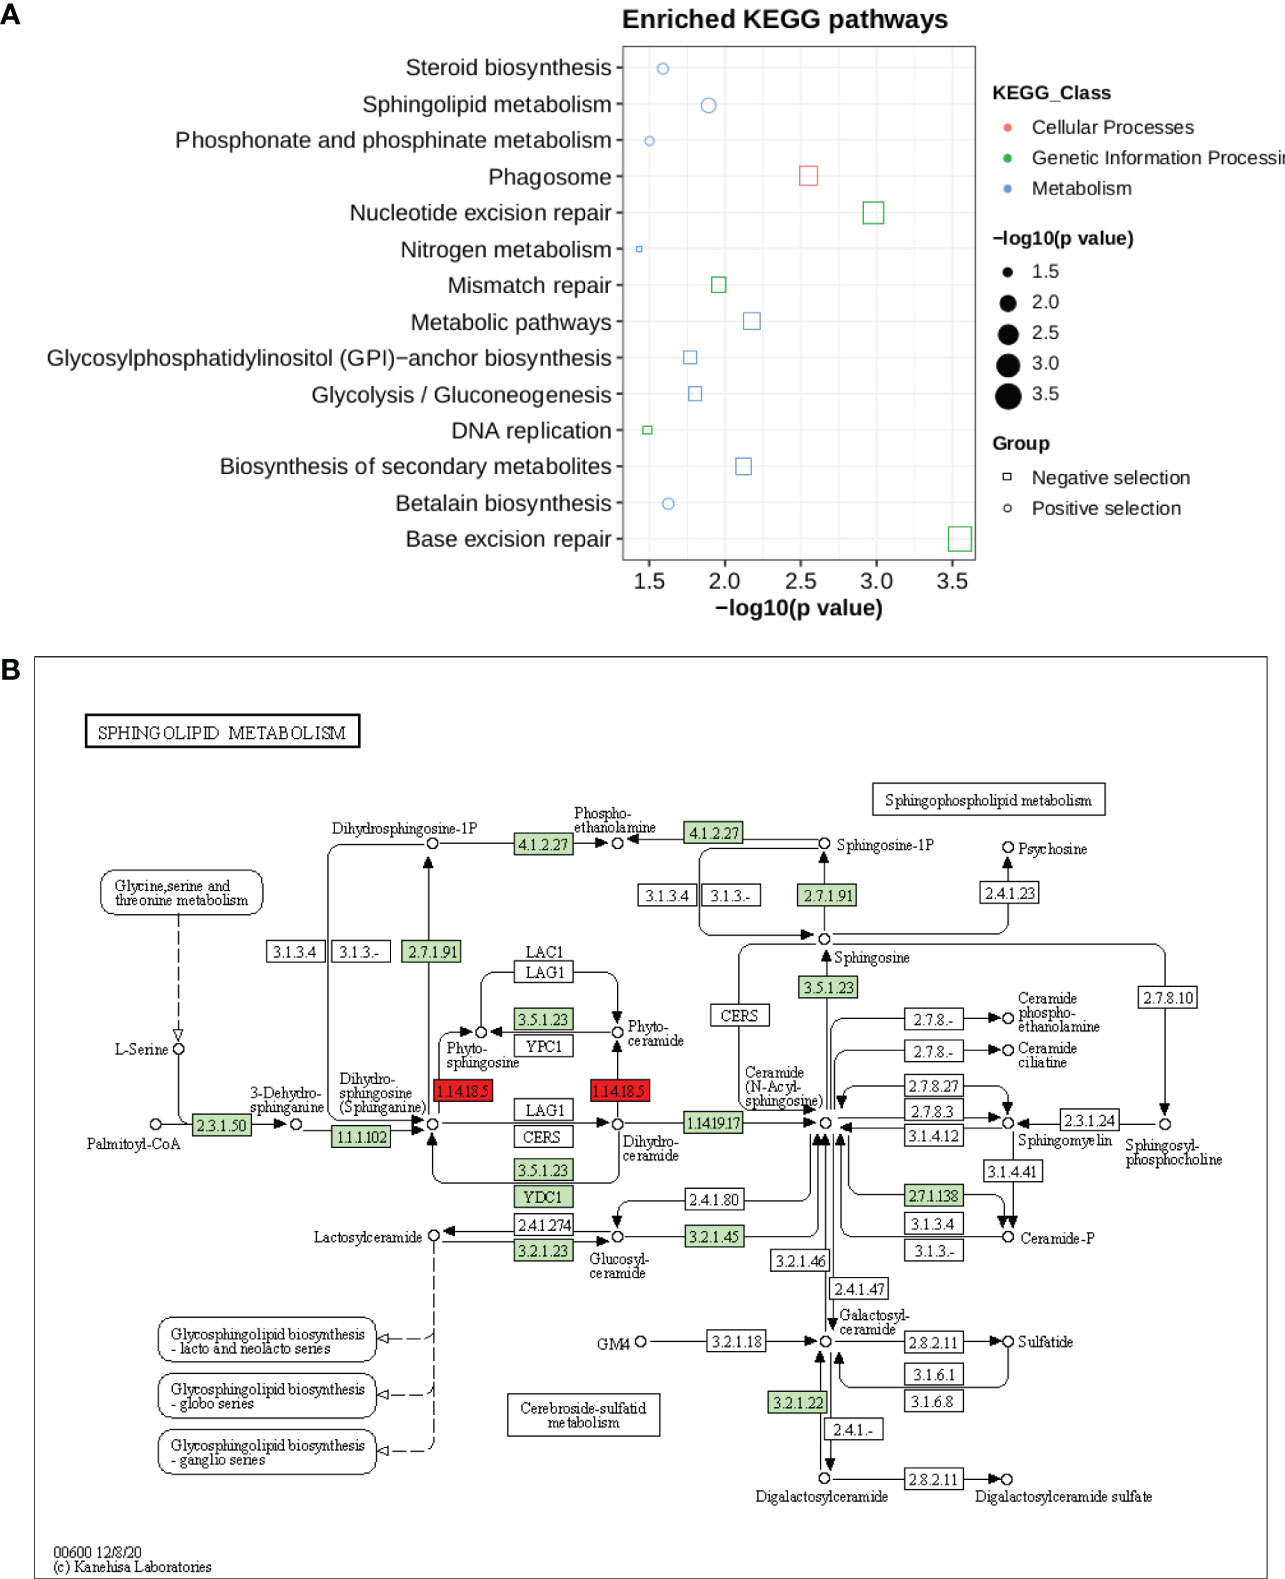
Figure 6 (A) KEGG pathway enrichment for genes under selection pressure (B) Pathway of sphingolipid metabolism. The two red boxes represent the positively selected genes involved in pathways.
Overlap of signatures of selection with QTLs
Quantitative trait loci associated with seven traits that overlapped with detected signatures of selection were compared with earlier reported sorghum QTLs (Hostetler et al., 2021). Analysis of the overlaps between signatures of selection and reported QTL indicated that 10 and 206 linked genes were identified as positively and negatively selected genes respectively (Supplementary Tables 34, 35). Some QTL for traits of plant height, root biomass, dead above-ground biomass, live above-ground biomass and total biomass overlapped significantly with putative gene regions of signatures of selection.
Discussion
We have demonstrated the utility of vast the sorghum genomic data that exists in public databases for characterization of a representative set of sorghum (Valluru et al. 2019). Our results validate the application of deep learning for the characterization of sorghum races and goes further to establish nucleotide diversity and genetic divergence across and within different sorghum races. We also used existing QTL data to identify candidate genes that are under both negative and positive selection.
The sorghum reference set used in the current study was earlier selected by Billot et al. (2013) after genotyping 3,367 global collections using 41 representative nuclear SSR markers and is considered to be representative of the sorghum collections that exist in various global gene banks. Our results confirm that the clustering of sorghum germplasm was largely according to regions (Paterson et al., 2009; Bekele et al., 2013; Ramu et al., 2013) indicating continuous gene flow between various racial groups depending on where the sorghum races are grown. The only distinct exception was in the guinea race, which was expected since the guinea race is specifically grown in West Africa and therefore any gene flow would be confined within the West African locations.
Our study also identified many intermediate accessions (more than 15 accessions) as a result of the continuous gene flow suggesting that a different criterion other than morphology will need to be used in future studies for the correct classification of sorghum races and their intermediates.
Capturing race-specific sequences will be critical in future studies for the follow-up identification of variants and/or, genes associated with each sorghum race. For example, longer k-mers (>15 bp) have been utilized as biomarkers (Drouin et al., 2016; Wang et al., 2018) as they can hold biological information and depict specific signatures in nucleotide sequences (Wang et al., 2016). Our ability to differentiate abundant k-mers between the different sorghum races in the current study provides an opportunity for future studies to utilize k-mers as race- or accession-specific identifiers in sorghum. Currently we were able to identify the sorghum race-specific k-mers, that are present in respective race, and able to locate the position and associate the genomic features. Based on the sequence read mapping, the gene PAV was earlier identified in the sorghum pangenome (Ruperao et al., 2021), and adapting the similar approach the genes having the race specific k-mers regions were also reported. With the known unique k-mer position, it is possible to extend the study of the genomic features having race-specific unique sequence (such as any genetic variations including the SSR, SNP, CNV and SV).
DeepVariant calling and its utility in sorghum breeding
For the first time in sorghum, we used the DeepVariant (Poplin et al., 2018) tool, a deep learning approach for SNP calling, and reported over two million genome-wide variants from existing sequencing data. One of the concerns of SNP calling from NGS data is the accuracy of SNPs. A recent comparison of SNPs called from the traditional SNP calling tools such as GATK (Depristo et al., 2011) with DeepVariant method reported superior performance of the latter (Lin et al., 2022), further validating our choice to implement this method in sorghum. Our results were largely consistent with previous studies in sorghum that involved SNP calling from NGS data, including the patterns of SNP distribution observed across the genome (Paterson et al., 2009; Bekele et al., 2013) and the non-synonymous to synonymous SNP substitution ratio. In this study, the deepvariant has called the variants with 0.19/Kbp which is comparatively less dense than the earlier reported results (0.33/Kbp) with GATK (Ruperao et al., 2021). Our results were also within the range reported for other genome-wide studies such as in soybean (Lam et al., 2010), rice 1.2 (McNally et al., 2009), and Arabidopsis 0.8 (Clark et al., 2007).
Future studies will need to compare DeepVariant with other existing methods and validate our results in different germplasm sets, such as the sorghum diversity panel (Casa et al., 2008). Such future studies will also need to pay special attention to sequence coverage and how it would affect the accuracy of variants called. Our study used a minimum overall coverage of 5x, which was more than adequate even for a less efficient SNP calling pipeline (Wu et al., 2019). Sequence coverage is one of the major factors affecting the accuracy of SNPs called from NGS datasets, especially in heterozygous species (Gong and Han, 2022). A coverage of 0.01x has been reported as the most cost-effective coverage in sorghum, with 94.1% SNP accuracy (Jensen et al., 2020). There will be a need for additional studies establishing the effect of various levels of coverage in the NGS datasets for DeepVariant calling, and how it would affect the SNP accuracy in sorghum.
Nucleotide diversity and divergence in sorghum
The genetic relatedness from the NJ tree (Supplementary Figure 3) and Pco (Supplementary Figure 9) analysis between the sorghum race accession demonstrates most of the guinea accessions forms the cluster, except for few accessions relates to caudatum race. Whereas durra race represented in two clusters, one cluster close to guinea and second in between kafir and caudatum (Supplementary Figure 3). Such intermediate race accessions and split of sorghum race clustering was also seen earlier for 389 sorghum diverse panel (Sapkota et al., 2020). On further investigation of structure analysis supports the two subpopulation clusters (K=2) in the sorghum population (Supplementary Figure 10) supporting the distance-based NJ analysis, indicating that the race accessions are genetically related. Our study was purely based on existing data and did not allow for much flexibility in the number of genotypes per race. The overall nucleotide diversity observed for sorghum of π = 0.000048 is significantly smaller than previously reported by Faye et al. (2019) but comparable to a more recent study (Sapkota et al., 2020) that reported π = 0.000032. This figure is much lower than for other cereals such as wheat (πA=0.0017, πB = 0.0025 and πD = 0.0002) (Zhou et al., 2020), maize (π = 0.014) (Tenaillon et al., 2001) and rice (π = 0.0024; Huang et al., 2010) and could be a consequence of the limited number of genotypes used in the study. The race-specific nucleotide diversity indicated that the caudatum (57 genotypes; πC = 0.0000419) had the lowest diversity followed by guinea (68 genotypes; 0.0000631) and durra (82 genotypes; πD = 0.0000637) races. On comparing the linkage disequilibrium (LD) decay, rapid LD decay was observed in durra followed by guinea and caudatum (Supplementary Figure 10), supporting the above diversity values of the sorghum race. The least diversity race population (caudatum) shows the higher extents of LD than the races with higher diversity (Durra). Supporting to these results, caudatum race consistently demonstrate the least genetically diverse showed higher LD values (Sapkota et al., 2020). However, studies also reported, the guinea race as the most genetically diverse sorghum type (Morris et al., 2013; Faye et al., 2019). Comparing our results and those of Morris et al. (2013) and Faye et al. (2019), suggests a positive correlation between the number of genotypes per race with the nucleotide diversity. More studies need to be done to confirm the effective population size per sorghum race that will be optimum for a reliable and consistent nucleotide diversity result.
Selection signatures
We used two approaches to detect selection sweeps across the sorghum genome, both of which are haplotype-based. The iHS method, which is based on a single population, was meant to detect recent positive selection (Voight et al., 2006), while the XP-EHH is based on the comparison of two populations and is considered powerful in detecting beneficial alleles shortly before, or at fixation (Alexandra et al., 2015). Such multiple statistical approaches were earlier used for selection sweeps in other crops like cotton (Gossypium herbaceum) (Nazir et al., 2020) and soybean (Glycine max) (Zhong et al., 2022). A recent study comparing different methods used for detecting selection sweeps reported that both iHS and XP-EHH were able to identify genomic regions undergoing selective sweep under a wide range of population structure scenarios (Vatsiou et al., 2016). Previous studies in sorghum have also reported evidence of selective sweeps in sorghum (Casa et al., 2006; Faye et al., 2019) although the methods used for detection were different. Our results on selective sweep regions were further strengthened by Tajima’s D results, which enabled us to identify candidate genes in the significant selective sweep regions.
The 2,370 candidate genes identified in our study (for under selection pressure), of which, 7.5% are positively selected, are similar to the proportion of genes identified for domestication and improvement using the gene-based population study by Mace et al. (2013). The genomic regions that are either positively or negatively selected in the respective sorghum races could give a hint on geographic preferences. More studies will need to delve deeper into specific regional selection sweeps that could eventually be used to predict ideal genotypes/phenotypes. The remaining candidate genes that were reported as undergoing negative selection with evidence from both Tajima’s D and Fst index values. Such genomic analysis of crop landraces would enhance our understanding of the basis of local adaptions (Li et al., 2017; Swarts et al., 2017).
Some of the trait-associated genes undergoing selection pressure that have been reported include the dry pithy stem gene mutation that led to the origin of sweet sorghum (Zhang et al., 2018), local adaptation to parasite pressure and signatures of balancing selection surrounding low germination stimulant (Bellis et al., 2020) and the strong selection pressure on the sorghum maturity gene (Ma3) (Wang et al., 2015). Comparative population genomics assist in dissecting the domestication and genome-wide effects of selection as studied in cotton, with reports that 311 selection sweep regions are associated with domestication and improvement (Nazir et al., 2020) and with selection sweeps identified comparing wild and domesticated soybean accessions (Zhong et al., 2022).
Populations subjected to strong selection pressure may experience genetic bottlenecks and result in a loss of genetic diversity. The level of diversity preserved in a population depends on the background of the emerging adaptive alleles (Wilson et al., 2017). Identification of such a large number of selection sweeps suggests the existence of domestication bottlenecks. The identified selection sweeps overlapped with highly differentiated regions suggesting the occurrence of differentiation due to human-mediated selection. These regions help in understanding the genetic basis of domestication and improvement in traits. On further comparison of the selection regions with significant loci of GWAS analysis (narrowing down the region), it may be possible to determine the genes underlying domestication and selection in the sorghum crop.
The results from this study lead to a better understanding of the changes at the genomic level caused by domestication, selection and improvement of sorghum accessions.
Methods
Plant material
We used 272 sorghum accessions, which included accessions that had been used in a previous sorghum pangenome study (Ruperao et al., 2021) and six sorghum bicolor accessions reported in Yan et al. (2018) (Supplementary Table 1). Among these genotypes, 82, 21, 57, 68, 14 were durra, kafir, caudatum, guinea and bicolor respectively, while the remaining were mixed accessions.
Variant discovery
The fastq sequence reads generated from the 272 sorghum accessions were trimmed with Trimmomatic 0.39 (Bolger et al., 2014). Alignments to the sorghum pangenome (dataverse.icrisat.org, https://doi.org/10.21421/D2/RIO2QM) as a reference (Ruperao et al., 2021) were performed using Bowtie2 version 2.4.2 (Langmead and Salzberg, 2012). All alignments were converted to binary files with Samtools 1.13 (Li et al., 2009) followed by filtering out the read duplication with Picard tools (http://broadinstitute.github.io/picard). The open-source DeepVariant (https://github.com/google/&6;deepvariant) (Poplin et al., 2018) tool was used to create individual genome call sets, followed by merging call sets with Bcftools 1.9 (Bcftools by samtools) then analyzing the merged call set. The merged variants were filtered with ‘maf 0.01 min-meanDP 2 minQ 20’. Filtering was done using Vcftools 0.1.16 (Danecek et al., 2011). Retained high-quality sites were used for downstream analysis. Functional annotation of SNPs was done using SnpEff v.4.3 (Cingolani et al., 2012).
Counting k-mers
The k-mer-based genetic distance between 272 sorghum accessions was measured with Mash (Ondov et al., 2016). Out of the 272 accessions used, the mean distance values within each race were used to compare k-mers between the sorghum races. To compare sequences across sorghum races, we determined k-mer frequency in sequencing reads from all samples. To identify the common and unique genomic sequences between the sorghum races, we split the sequencing reads into k length of the sequence. The optimal k-mer size for identifying the distinct k-mers was estimated using KmerGenie (Chikhi and Medvedev, 2014) within the k range of 21 to 121. The optimized k=47 was used for measuring the k-mer frequency as shown in the Figure 7. We used the hash-based tool Jellyfish (Marçais and Kingsford, 2011) to count k-mers with the optimized k-mer length of 31 (kmer 31, expect number of k-mers 100G, count both strand canonical representation, number of threads 25, number of files open simultaneously 2, output file name) and filtered out k-mers that appeared only once in samples as they were likely from sequencing errors. The k-mer hashes were visually inspected through KAT density plots (Mapleson et al., 2017) for all five sorghum race accessions by producing the k-mer frequency, GC plots and contamination checks. Unique k-mers mapped to sorghum pangenome were validated with mapped SNParray region from a previous study (Ruperao et al., 2021). Based on the Bowtie2 v2.4.2 (Langmead and Salzberg, 2012) mapped k-mers, the gene coverage was assessed with samtools mpileup (Li et al., 2009). The sequence region supporting with minimum of three k-mers was considered as sequence region present in the genome. The gene PAVs were extracted from the sorghum pan-genome genes PAVs catalog (Ruperao et al., 2021) with in-house developed script.
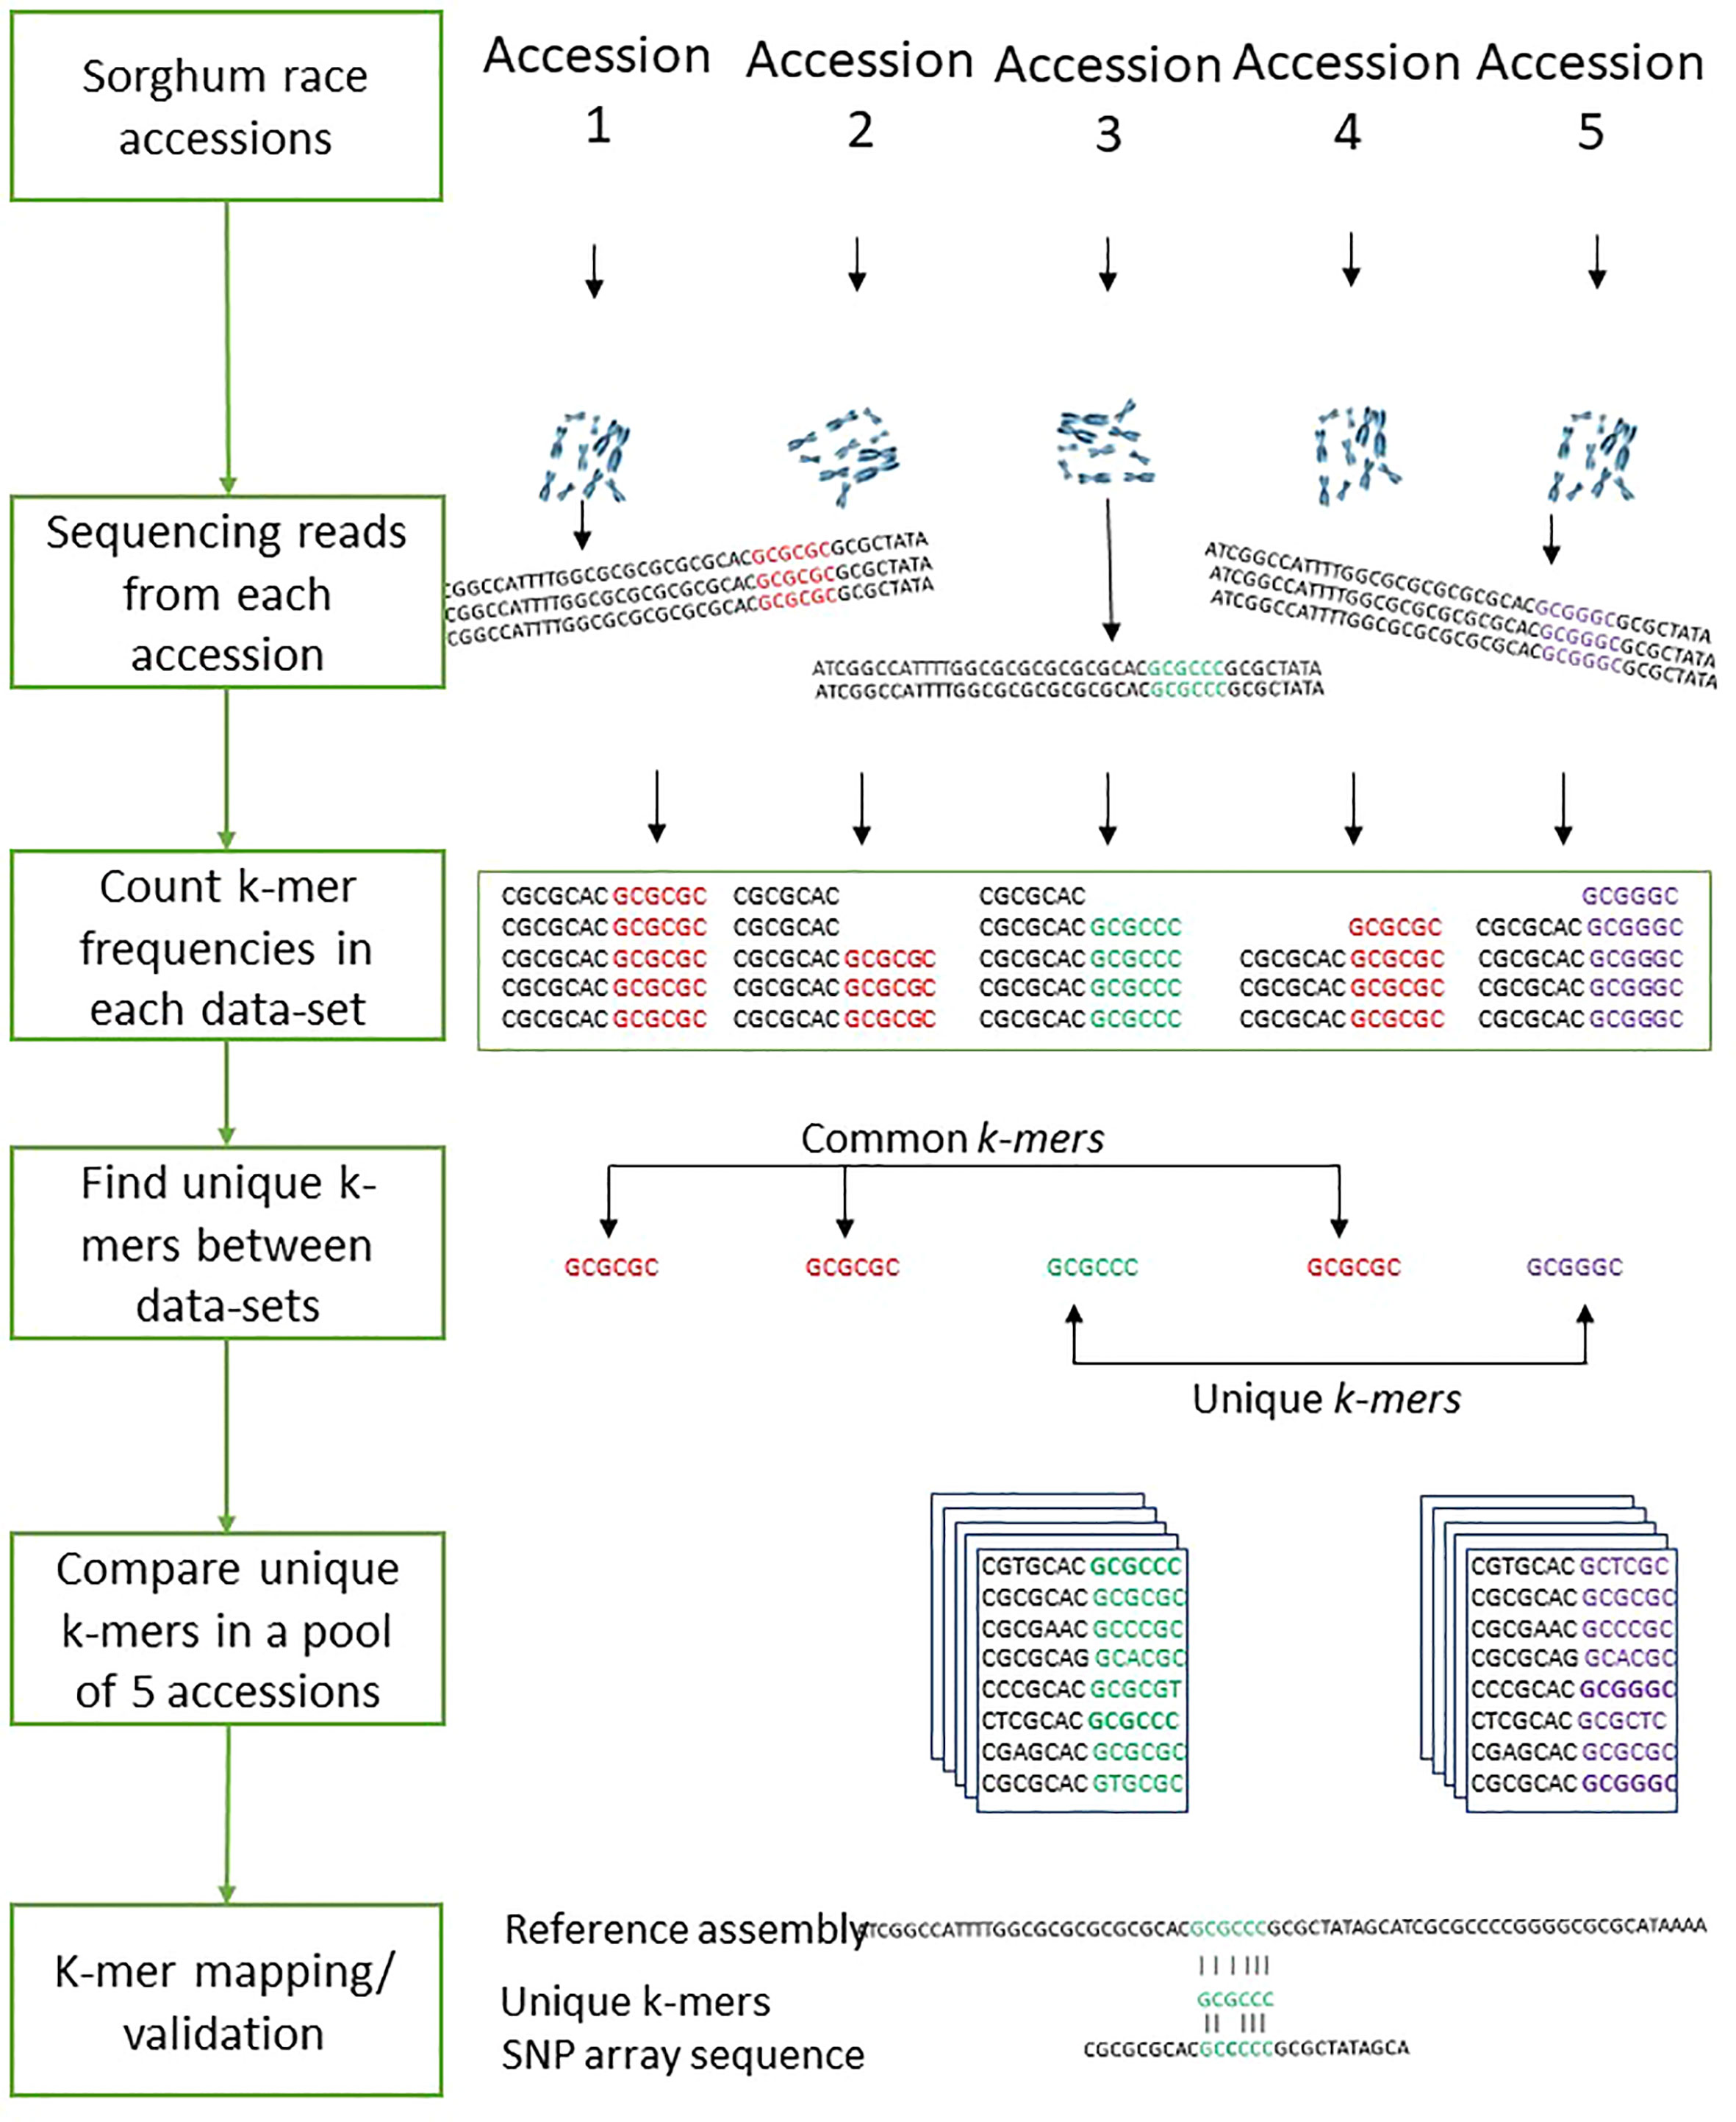
Figure 7 The workflows of the sorghum race accessions comparison with k-mer analysis.
Nucleotide diversity and relatedness
The filtered SNPs were further subgrouped based on race-specific variant alleles. Nucleotide diversity (pi) was calculated using Vcftools 0.1.16 (Danecek et al., 2011). The pi (π) distributions were compared to assess changes in genetic diversity over time. The pi (π) density plots were generated with in-house developed scripts.
In addition, a 1,000 bootstrap resampling was used to estimate the genetic relationship among the accessions with R “ape” (Paradis et al., 2004) package to construct a NJ tree and visualized it in iTOL tree viewer (Letunic and Bork, 2019). The Pco analysis was done with R “labdsv” package (https://CRAN.R-project.org/package=labdsv). The admixture v1.3.0 (Alexander et al., 2009) was used to estimate the population structure enabling the cross-validation (CV) with –cv flag. The cross-validation procedure was performed to 10-fold and the lowest CV was considered as optimal K value and the results were visualized with R package (github.com/royfrancis/pophelperShiny) POPHELPER v2.1.1 (Francis, 2017). PopLDdecay (Zhang et al., 2019) was used with MAF 0.01 and MaxDist 2000 to generate the linkage disequilibrium stats and Plot_MultiPop.pl used for plotting the LDdecay.
Population differentiation and signatures of selection
Tajima’s D (Tajima, 1989) and per-site Fst (based on Weir and Cockerham’s Fst estimator) (Weir and Cockerham, 1984) were calculated using Vcftools 0.1.16 software (Danecek et al., 2011). Integrated haplotype score (iHS) (Voight et al., 2006) analysis was performed using the “rehh” package (Gautier et al., 2017) in R v 3.6.3, while the extended haplotype-based homozygosity score test) (XP-EHH) (Sabeti et al., 2007) was derived using Beagle (Browning et al., 2021). Significant selective sweeps were detected using the Bonferroni FDR threshold (P < 0.05).
Overlap of putative genomic regions under selection with previously known QTLs was detected after downloading the mapped QTL regions from Hostetler et al. (2021) and comparing them with the identified selection regions.
Access to raw data
We obtained publicly accessible raw Illumina sequence data from three previous studies as shown in Table 1 and Supplementary Table 1. The sorghum accessions having minimum 5x coverage of whole-genome sequence data were used for the analysis, resulting in a total of 272 sorghum accessions.
Conclusion
This study compared the genomes of the sorghum races with short k-mer length sequence to identify the conserved and signature patterns of sorghum race sequences. We implemented a deep learning method to detect the variants and compared structural and functional annotations. On applying the k-mer-based genome comparison among the sorghum races, we were able to identify the unique k-mer sequences that is specific to the sorghum races and also possibly use as race-specific or accession specific (if k-mers compared between accessions) genetic markers. Our study observed a relatively lower genetic diversity in the caudatum and bicolor races than in kafir, guinea and durra races. Our results revealed several putative footprints of selection that harbor interesting candidate genes associated with agronomically important traits using different statistical approaches. The findings will enhance our understanding of the dynamics of the sorghum race genomes and help to design strategies to breed better genotypes.
Data availability statement
The datasets presented in this study can be found in online repositories. The names of the repository/repositories and accession number(s) can be found in the article/Supplementary Material.
Author contributions
PR conceived the research. PR, PG, MS, and RD carried out the research. SS managed the computational resource. SD and DO provided inputs on sorghum history and domestication. NT, EH, EM, SM, and BN assessed and provided inputs for manuscript. PR, NT, AR, and DO drafted and edited the manuscript. All authors contributed to the article and approved the submitted version.
Funding
The authors also acknowledge the supporting funds from AVISA (OPP1198373) and ICAR-BMGF (101165). We also acknowledge the support from the Bill and Melinda Gates Foundation (BMGF – INV-037010).
Conflict of interest
SPD joined Hytech Seed India Private Limited at the time of manuscript preparation.
The remaining authors declare that the research was conducted in the absence of any commercial or financial relationships that could be construed as a potential conflict of interest.
Publisher’s note
All claims expressed in this article are solely those of the authors and do not necessarily represent those of their affiliated organizations, or those of the publisher, the editors and the reviewers. Any product that may be evaluated in this article, or claim that may be made by its manufacturer, is not guaranteed or endorsed by the publisher.
Supplementary material
The Supplementary Material for this article can be found online at: https://www.frontiersin.org/articles/10.3389/fpls.2023.1143512/full#supplementary-material
References
Afolayan, G., Deshpande, S. P., Aladele, S. E., Kolawole, A. O., Angarawai, I., Nwosu, D. J., et al. (2019). Genetic diversity assessment of sorghum (Sorghum bicolor (L.) moench) accessions using single nucleotide polymorphism markers. Plant Genetic Resources. Cambridge: Cambridge University Press. 17 (5), 412–420. doi: 10.1017/S1479262119000212
Alexander, D. H., Novembre, J., Lange, K. (2009). Fast model-based estimation of ancestry in unrelated individuals. Genome Res. 19 (9). doi: 10.1101/gr.094052.109
Audano, P. A., Ravishankar, S., Vannberg, F. O. (2018). Mapping-free variant calling using haplotype reconstruction from k-mer frequencies. Bioinformatics 34 (10). doi: 10.1093/bioinformatics/btx753
Bankevich, A., Nurk, S., Antipov, D., Gurevich, A. A., Dvorkin, M., Kulikov, A. S., et al. (2012). SPAdes: A new genome assembly algorithm and its applications to single-cell sequencing. J. Comput. Biol. 19, 455–477. doi: 10.1089/cmb.2012.0021
Bekele, W. A., Wieckhorst, S., Friedt, W., Snowdon, R. J. (2013). High-throughput genomics in sorghum: from whole-genome resequencing to a SNP screening array. Plant Biotechnol. J. 11, 1112–1125. doi: 10.1111/pbi.12106
Bellis, E. S., Kelly, E. A., Lorts, C. M., Gao, H., DeLeo, V. L., Rouhan, G., et al. (2020). Genomics of sorghum local adaptation to a parasitic plant. Proc. Natl. Acad. Sci. U. S. A. 117 (8). doi: 10.1073/pnas.1908707117
Billot, C., Ramu, P., Bouchet, S., Chantereau, J., Deu, M., Gardes, L., et al. (2013). Massive sorghum collection genotyped with SSR markers to enhance use of global genetic resources. PloS One 8 (4). doi: 10.1371/journal.pone.0059714
Bolger, A. M., Lohse, M., Usadel, B. (2014). Trimmomatic: a flexible trimmer for illumina sequence data. Bioinformatics 30, 2114–2120. doi: 10.1093/bioinformatics/btu170
Brown, P. J., Myles, S., Kresovich, S. (2011). Genetic support for phenotype-based racial classification in sorghum. Crop Sci. 51, 224–230. doi: 10.2135/cropsci2010.03.0179
Browning, B. L., Tian, X., Zhou, Y., Browning, S. R. (2021). Fast two-stage phasing of large-scale sequence data. Am. J. Hum. Genet. 108, 1880–1890. doi: 10.1016/j.ajhg.2021.08.005
Casa, A. M., Mitchell, S. E., Jensen, J. D., Hamblin, M. T., Paterson, A. H., Aquadro, C. F., et al. (2006). Evidence for a selective sweep on chromosome 1 of cultivated sorghum. Crop Sci. 46 (SUPPL. 1). doi: 10.2135/cropsci2006.0001tpg
Casa, A. M., Pressoir, G., Brown, P. J., Mitchell, S. E., Rooney, W. L., Tuinstra, M. R., et al. (2008). Community resources and strategies for association mapping in sorghum. Crop Sci. 48 (1). doi: 10.2135/cropsci2007.02.0080
Chikhi, R., Medvedev, P. (2014). Informed and automated k-mer size selection for genome assembly. Bioinformatics 30, 31–37. doi: 10.1093/bioinformatics/btt310
Cingolani, P., Platts, A., Wang, L. L., Coon, M., Nguyen, T., Wang, L., et al. (2012). A program for annotating and predicting the effects of single nucleotide polymorphisms, SnpEff: SNPs in the genome of drosophila melanogaster strain w1118; iso-2; iso-3. Fly (Austin) 6, 80–92. doi: 10.4161/fly.19695
Clark, R. M., Schweikert, G., Toomajian, C., Ossowski, S., Zeller, G., Shinn, P., et al. (2007). Common sequence polymorphisms shaping genetic diversity in arabidopsis thaliana. Sci. (1979) 317, 338–342. doi: 10.1126/science.1138632
Danecek, P., Auton, A., Abecasis, G., Albers, C. A., Banks, E., DePristo, M. A., et al. (2011). The variant call format and VCFtools. Bioinformatics 27, 2156–2158. doi: 10.1093/bioinformatics/btr330
Depristo, M. A., Banks, E., Poplin, R., Garimella, K. V., Maguire, J. R., Hartl, C., et al. (2011). A framework for variation discovery and genotyping using next-generation DNA sequencing data. Nat. Genet. 43 (5). doi: 10.1038/ng.806
Deu, M., Rattunde, F., Chantereau, J. (2006). A global view of genetic diversity in cultivated sorghums using a core collection. Genome 49(2), 168–80. doi: 10.1139/g05-092
Drouin, A., Giguère, S., Déraspe, M., Marchand, M., Tyers, M., Loo, V. G., et al. (2016). Predictive computational phenotyping and biomarker discovery using reference-free genome comparisons. BMC Genomics 17, 1–15. doi: 10.1186/s12864-016-2889-6
Enyew, M., Feyissa, T., Carlsson, A. S., Tesfaye, K., Hammenhag, C., Geleta, M. (2022). Genetic diversity and population structure of sorghum [Sorghum bicolor (L.) moench] accessions as revealed by single nucleotide polymorphism markers. Front. Plant Sci. 0, 3110. doi: 10.3389/fpls.2021.799482
Faye, J. M., Maina, F., Hu, Z., Fonceka, D., Cisse, N., Morris, G. P. (2019). Genomic signatures of adaptation to sahelian and soudanian climates in sorghum landraces of senegal. Ecol. Evol. 9 (10), 6038–6051. doi: 10.1002/ece3.5187
Francis, R. M. (2017). Pophelper: an r package and web app to analyse and visualize population structure. Mol. Ecol. Resour. 17 (1). doi: 10.1111/1755-0998.12509
Gautier, M., Klassmann, A., Vitalis, R. (2017). rehh 2.0: a reimplementation of the r package rehh to detect positive selection from haplotype structure. Mol. Ecol. Resour 17, 78–90. doi: 10.1111/1755-0998.12634
Harlan, J. R., Stemler, A. (2012). “The races of sorghum in Africa,” in Origins of African plant domestication, De Gruyter Mouton. 465–478. doi: 10.1515/9783110806373.465
Harlan, J. R., Wet, J. M. J. (1972). A simplified classification of cultivated Sorghum1. Crop Sci. 12, 172–176. de. doi: 10.2135/cropsci1972.0011183X001200020005x
Haubold, B. (2014). Alignment-free phylogenetics and population genetics. Briefings Bioinf. 15, 407–418. doi: 10.1093/bib/bbt083
Hostetler, A. N., Govindarajulu, R., Hawkins, J. S. (2021). QTL mapping in an interspecific sorghum population uncovers candidate regulators of salinity tolerance. Plant Stress 2. doi: 10.1016/j.stress.2021.100024
Huang, X., Wei, X., Sang, T., Zhao, Q., Feng, Q., Zhao, Y., et al. (2010). Genome-wide association studies of 14 agronomic traits in rice landraces. Nat. Genet. 42, 961–967. doi: 10.1038/ng.695
Hurgobin, B., Edwards, D. (2017). SNP discovery using a pangenome: Has the single reference approach become obsolete? Biol. (Basel) 6, 21. doi: 10.3390/biology6010021
Jensen, S. E., Charles, J. R., Muleta, K., Bradbury, P. J., Casstevens, T., Deshpande, S. P., et al. (2020). A sorghum practical haplotype graph facilitates genome-wide imputation and cost-effective genomic prediction. Plant Genome 13 (1), e20009. doi: 10.1002/tpg2.20009
Kebbede, W. Y. (2020). Genetic variability and divergence in sorghum: Review. Int. J. Res. Stud. Agric. Sci. (IJRSAS) 6, 2454–6224. doi: 10.20431/2454-6224.0605002
Lam, H. M., Xu, X., Liu, X., Chen, W., Yang, G., Wong, F. L., et al. (2010). Resequencing of 31 wild and cultivated soybean genomes identifies patterns of genetic diversity and selection. Nat. Genet. 42, 1053–1059. doi: 10.1038/ng.715
Langmead, B., Salzberg, S. L. (2012). Fast gapped-read alignment with bowtie 2. Nat. Methods 9, 357–359. doi: 10.1038/nmeth.1923
Letunic, I., Bork, P. (2019). Interactive tree of life (iTOL) v4: Recent updates and new developments. Nucleic Acids Res. 47 (W1), W256–W259. doi: 10.1093/nar/gkz239
Li, H., Handsaker, B., Wysoker, A., Fennell, T., Ruan, J., Homer, N., et al. (2009). The sequence Alignment/Map format and SAMtools. Bioinformatics 25, 2078–2079. doi: 10.1093/bioinformatics/btp352
Li, L. F., Li, Y. L., Jia, Y., Caicedo, A. L., Olsen, K. M. (2017). Signatures of adaptation in the weedy rice genome. Nat. Genet. 49(5), 811–814. doi: 10.1038/ng.3825
Lin, Y. L., Chang, P. C., Hsu, C., Hung, M. Z., Chien, Y. H., Hwu, W. L., et al. (2022). Comparison of GATK and DeepVariant by trio sequencing. Sci. Rep. 12 (1). doi: 10.1038/s41598-022-05833-4
Mace, E. S., Tai, S., Gilding, E. K., Li, Y., Prentis, P. J., Bian, L., et al. (2013). Whole-genome sequencing reveals untapped genetic potential in africa’s indigenous cereal crop sorghum. Nat. Commun. 4, 2320. doi: 10.1038/ncomms3320
Mapleson, D., Accinelli, G. G., Kettleborough, G., Wright, J., Clavijo, B. J. (2017). KAT: a K-mer analysis toolkit to quality control NGS datasets and genome assemblies. Bioinformatics 33, 574. doi: 10.1093/bioinformatics/btw663
Marçais, G., Kingsford, C. (2011). A fast, lock-free approach for efficient parallel counting of occurrences of k-mers. Bioinformatics 27, 764–770. doi: 10.1093/bioinformatics/btr011
Massel, K., Campbell, B. C., Mace, E. S., Tai, S., Tao, Y., Worland, B. G., et al. (2016). Whole genome sequencing reveals potential new targetsfor improving nitrogen uptakeand utilization in sorghumbicolor sorghumbicolor. Front. Plant Sci. 7, 1544. doi: 10.3389/fpls.2016.01544
Mccouch, S., Baute, G. J., Bradeen, J., Bramel, P., Bretting, P. K., Buckler, E., et al. (2013). Agriculture: Feeding the future : Nature : Nature publishing group. Nature 499, 23–24. doi: 10.1038/499023a
McNally, K. L., Childs, K. L., Bohnert, R., Davidson, R. M., Zhao, K., Ulat, V. J., et al. (2009). Genomewide SNP variation reveals relationships among landraces and modern varieties of rice. Proc. Natl. Acad. Sci. 106, 12273–12278. doi: 10.1073/pnas.0900992106
Morris, G. P., Ramu, P., Deshpande, S. P., Hash, C. T., Shah, T., Upadhyaya, H. D., et al. (2013). Population genomic and genome-wide association studies of agroclimatic traits in sorghum. Proc. Natl. Acad. Sci. U.S.A. 110 (2), 453–458. doi: 10.1073/pnas.1215985110
Nazir, M. F., Jia, Y., Ahmed, H., He, S., Iqbal, M. S., Sarfraz, Z., et al. (2020). Genomic insight into differentiation and selection sweeps in the improvement of upland cotton. Plants 9 (6). doi: 10.3390/plants9060711
Nordström, K. J. V., Albani, M. C., James, G. V., Gutjahr, C., Hartwig, B., Turck, F., et al. (2013). Mutation identification by direct comparison of whole-genome sequencing data from mutant and wild-type individuals using k-mers. Nat. Biotechnol. 31, 325–330. 2013 31:4. doi: 10.1038/nbt.2515
Norman, A., Taylor, J., Edwards, J., Kuchel, H. (2018). Optimising genomic selection in wheat: Effect of marker density, population size and population structure on prediction accuracy. G3 Genes|Genomes|Genetics 8, 2889–2899. doi: 10.1534/g3.118.200311
Ondov, B. D., Treangen, T. J., Melsted, P., Mallonee, A. B., Bergman, N. H., Koren, S., et al. (2016). Mash: Fast genome and metagenome distance estimation using MinHash. Genome Biol. 17 (1), 132. doi: 10.1186/s13059-016-0997-x
Pajuste, F. D., Kaplinski, L., Möls, M., Puurand, T., Lepamets, M., Remm, M. (2017). FastGT: An alignment-free method for calling common SNVs directly from raw sequencing reads. Sci. Rep. 7 (1). doi: 10.1038/s41598-017-02487-5
Paradis, E., Claude, J., Strimmer, K. (2004). APE: Analyses of phylogenetics and evolution in r language. Bioinformatics 20, 289–290. doi: 10.1093/bioinformatics/btg412
Paterson, A. H., Bowers, J. E., Bruggmann, R., Dubchak, I., Grimwood, J., Gundlach, H., et al. (2009). The sorghum bicolor genome and the diversification of grasses. Nature 457, 551–556. doi: 10.1038/nature07723
Peng, Y., Leung, H. C. M., Yiu, S. M., Chin, F. Y. L. (2012). IDBA-UD: A de novo assembler for single-cell and metagenomic sequencing data with highly uneven depth. Bioinformatics 28, 1420–1428. doi: 10.1093/bioinformatics/bts174
Poplin, R., Chang, P. C., Alexander, D., Schwartz, S., Colthurst, T., Ku, A., et al. (2018). A universal SNP and small-indel variant caller using deep neural networks. Nat. Biotechnol. 36, 983–987. doi: 10.1038/nbt.4235
Ramu, P., Billot, C., Rami, J. F., Senthilvel, S., Upadhyaya, H. D., Ananda Reddy, L., et al. (2013). Assessment of genetic diversity in the sorghum reference set using EST-SSR markers. Theor. Appl. Genet. 126 (8). doi: 10.1007/s00122-013-2117-6
Ruperao, P., Thirunavukkarasu, N., Gandham, P., Selvanayagam, S., Govindaraj, M., Nebie, B., et al. (2021). Sorghum pan-genome explores the functional utility for genomic-assisted breeding to accelerate the genetic gain. Front. Plant Sci. 12, 963. doi: 10.3389/fpls.2021.666342
Sabeti, P. C., Varilly, P., Fry, B., Lohmueller, J., Hostetter, E., Cotsapas, C., et al. (2007). Genome-wide detection and characterization of positive selection in human populations. Nature 449, 913. doi: 10.1038/nature06250
Saleem, A., Muylle, H., Aper, J., Ruttink, T., Wang, J., Yu, D., et al. (2021). A genome-wide genetic diversity scan reveals multiple signatures of selection in a European soybean collection compared to Chinese collections of wild and cultivated soybean accessions. Front. Plant Sci. 12. doi: 10.3389/fpls.2021.631767
Sapkota, S., Boyles, R., Cooper, E., Brenton, Z., Myers, M., Kresovich, S. (2020). Impact of sorghum racial structure and diversity on genomic prediction of grain yield components. Crop Sci. 60, 132–148. doi: 10.1002/csc2.20060
Saxena, R. K., Edwards, D., Varshney, R. K. (2014). Structural variations in plant genomes. Briefings Funct. Genomics 13, 296–307. doi: 10.1093/bfgp/elu016
Sheppard, S. K., Didelot, X., Meric, G., Torralbo, A., Jolley, K. A., Kelly, D. J., et al. (2013). Genome-wide association study identifies vitamin B5 biosynthesis as a host specificity factor in campylobacter. Proc. Natl. Acad. Sci. U.S.A. 110, 11923–11927. doi: 10.1073/pnas.1305559110
Simpson, J. T., Wong, K., Jackman, S. D., Schein, J. E., Jones, S. J. M., Birol, I. (2009). ABySS: A parallel assembler for short read sequence data. Genome Res. 19, 1117–1123. doi: 10.1101/gr.089532.108
Smýkal, P., Nelson, M. N., Berger, J. D., von Wettberg, E. J. B. (2018). The impact of genetic changes during crop domestication Agronomy 2018, vol. 8 Page 119, 8, 119. doi: 10.3390/agronomy8070119
Song, K., Ren, J., Reinert, G., Deng, M., Waterman, M. S., Sun, F. (2014). New developments of alignment-free sequence comparison: measures, statistics and next-generation sequencing. Briefings Bioinf. 15, 343–353. doi: 10.1093/bib/bbt067
Stephan, W., Wiehe, T. H. E., Lenz, M. W. (1992). The effect of strongly selected substitutions on neutral polymorphism: Analytical results based on diffusion theory. Theor. Population Biol. 41, 237–254. doi: 10.1016/0040-5809(92)90045-U
Swarts, K., Gutaker, R. M., Benz, B., Blake, M., Bukowski, R., Holland, J., et al. (2017). Genomic estimation of complex traits reveals ancient maize adaptation to temperate north america. Science 1979), 357. doi: 10.1126/science.aam9425
Tajima, F. (1989). Statistical method for testing the neutral mutation hypothesis by DNA polymorphism. Genetics 123(3), 585–595. doi: 10.1093/genetics/123.3.585
Tao, Y., Luo, H., Xu, J., Cruickshank, A., Zhao, X., Teng, F., et al. (2021). Extensive variation within the pan-genome of cultivated and wild sorghum. Nat. Plants 7, 766–773. doi: 10.1038/s41477-021-00925-x
Telenti, A., Lippert, C., Chang, P. C., DePristo, M. (2018). Deep learning of genomic variation and regulatory network data. Hum. Mol. Genet. 27, R63–R71. doi: 10.1093/hmg/ddy115
Tenaillon, M. I., Sawkins, M. C., Long, A. D., Gaut, R. L., Doebley, J. F., Gaut, B. S. (2001). Patterns of DNA sequence polymorphism along chromosome 1 of maize (Zea mays ssp. mays L.). Proc. Natl. Acad. Sci. 98, 9161–9166. doi: 10.1073/pnas.151244298
Valluru, R., Gazave, E. E., Fernandes, S. B., Ferguson, J. N., Lozano, R., Hirannaiah, P., et al. (2019). Deleterious mutation burden and its association with complex traits in sorghum (Sorghum bicolor). Genetics 211 (3), 1075–1087. doi: 10.1534/genetics.118.301742
Vatsiou, A. I., Bazin, E., Gaggiotti, O. E. (2016). Detection of selective sweeps in structured populations: A comparison of recent methods. Mol. Ecol. 25 (1). doi: 10.1111/mec.13360
Voight, B. F., Kudaravalli, S., Wen, X., Pritchard, J. K. (2006). A map of recent positive selection in the human genome. PloS Biol. 4, 0446–0458. doi: 10.1371/journal.pbio.0040072
Wang, Y., Fu, L., Ren, J., Yu, Z., Chen, T., Sun, F. (2018). Identifying group-specific sequences for microbial communities using long k-mer sequence signatures. Front. Microbiol. 9, 872. doi: 10.3389/fmicb.2018.00872
Wang, Y., Tan, L., Fu, Y., Zhu, Z., Liu, F., Sun, C., et al. (2015). Molecular evolution of the sorghum maturity gene Ma3. PloS One 10 (5). doi: 10.1371/journal.pone.0124435
Wang, Y., Lei, X., Wang, S., Wang, Z., Song, N., Zeng, F., et al. (2016). Effect of k-tuple length on sample-comparison with high-throughput sequencing data. Biochem. Biophys. Res. Commun. 469, 1021–1027. doi: 10.1016/j.bbrc.2015.11.094
Weir, B. S., Cockerham, C. C. (1984). ESTIMATING f-STATISTICS FOR THE ANALYSIS OF POPULATION STRUCTURE. Evol. (N Y) 38, 1358–1370. doi: 10.1111/j.1558-5646.1984.tb05657.x
Wendorf, F., Close, A. E., Schild, R., Wasylikowa, K., Housley, R. A., Harlan, J. R., et al. (1992). Saharan exploitation of plants 8,000 years BP. Nature 359, 721–724. doi: 10.1038/359721a0
Wilson, B. A., Pennings, P. S., Petro, D. A. (2017). Soft selective sweeps in evolutionary rescue. Genetics 205 (4). doi: 10.1534/genetics.116.191478
Wu, S., Wang, X., Reddy, U., Sun, H., Bao, K., Gao, L., et al. (2019). Genome of 'Charleston gray', the principal american watermelon cultivar, and genetic characterization of 1,365 accessions in the U.S. Natl. Plant Germplasm System watermelon collecton. Plant Biotechnol. J. 17 (12), 2246–2258. doi: 10.1111/pbi.13136
Yan, S., Wang, L., Zhao, L., Wang, H., Wang, D. (2018). Evaluation of genetic variation among sorghum varieties from southwest China via genome resequencing. Plant Genome 11, 170098. doi: 10.3835/plantgenome2017.11.0098
Zerbino, D. R., Birney, E. (2008). Velvet: Algorithms for de novo short read assembly using de bruijn graphs. Genome Res. 18, 821–829. doi: 10.1101/gr.074492.107
Zhang, L. M., Leng, C. Y., Luo, H., Wu, X. Y., Liu, Z. Q., Zhang, Y. M., et al. (2018). Sweet sorghum originated through selection of dry, a plant-specific nac transcription factor gene[open]. Plant Cell 30 (10), 2286–2307. doi: 10.1105/tpc.18.00313
Zhong, L., Zhu, Y., Olsen, K. M. (2022). Hard versus soft selective sweeps during domestication and improvement in soybean. Mol. Ecol. 31 (11), 3137–3153. doi: 10.1111/mec.16454
Zhou, Y., Zhao, X., Li, Y., Xu, J., Bi, A., Kang, L., et al. (2020). Triticum population sequencing provides insights into wheat adaptation. Nat. Genet. 52, 1412–1422. doi: 10.1038/s41588-020-00722-w
Keywords: sorghum race, deep learning, deep variant calling, k-mer analysis, selection pressure, gene enrichment, positive and negative selection
Citation: Ruperao P, Gandham P, Odeny DA, Mayes S, Selvanayagam S, Thirunavukkarasu N, Das RR, Srikanda M, Gandhi H, Habyarimana E, Manyasa E, Nebie B, Deshpande SP and Rathore A (2023) Exploring the sorghum race level diversity utilizing 272 sorghum accessions genomic resources. Front. Plant Sci. 14:1143512. doi: 10.3389/fpls.2023.1143512
Received: 16 January 2023; Accepted: 22 February 2023;
Published: 17 March 2023.
Edited by:
Lida Zhang, Shanghai Jiao Tong University, ChinaReviewed by:
Liyi Zhang, Guizhou Academy of Agricultural Sciences (CAAS), ChinaChristos Noutsos, State University of New York at Old Westbury, United States
Copyright © 2023 Ruperao, Gandham, Odeny, Mayes, Selvanayagam, Thirunavukkarasu, Das, Srikanda, Gandhi, Habyarimana, Manyasa, Nebie, Deshpande and Rathore. This is an open-access article distributed under the terms of the Creative Commons Attribution License (CC BY). The use, distribution or reproduction in other forums is permitted, provided the original author(s) and the copyright owner(s) are credited and that the original publication in this journal is cited, in accordance with accepted academic practice. No use, distribution or reproduction is permitted which does not comply with these terms.
*Correspondence: Pradeep Ruperao, r.pradeep@cgiar.org; Abhishek Rathore, abhishek.rathore@cgiar.org