 Bing Li
 Xiaodong Ma
 Ben Zhao
 Laigang Wang
 Syed Tahir Ata-Ul-Karim
- 1International School, Huanghe Science & Technology College, Zhengzhou, Henan, China
- 2Farmland Irrigation Research Institute, Chinese Academy of Agricultural Sciences, Xinxiang, Henan, China
- 3Graduate School of Agricultural and Life Sciences, The University of Tokyo, Tokyo, Japan
Accurate and timely nitrogen (N) scheduling requires knowledge of in-season crop N deficit. Therefore, understanding the association between crop growth and crop N demand during its growth period is imperative for fine-tuning N scheduling decisions to actual crop N demand and to enhance N use efficiency. The concept of the critical N dilution curve has been employed to assess and quantify the intensity and time of crop N deficit. However, research regarding the association between crop N deficit and N use efficiency in wheat is limited. The present study was carried out to determine whether there are relationships between the accumulated nitrogen deficit (Nand) and agronomic N use efficiency (AEN) as well as with its components (N fertilizer recovery efficiency (REN) and N fertilizer physiological efficiency (PEN)) of winter wheat and to explore the potential capacity of Nand for predicting AEN and its components. Data acquired from five variable N rates (0, 75, 150, 225, and 300 kg ha−1) field experiments using six winter wheat cultivars were used to establish and validate the relationships between Nand and AEN, REN, and PEN. The results indicated that plant N concentration in winter wheat was significantly affected by N application rates. Nand varied from −65.73 to 104.37 kg ha−1 after Feekes stage 6 under different N application rates. The AEN and its components were also affected by cultivars, N levels, seasons, and growth stages. A positive correlation was observed between Nand, AEN, and its components. Validation using an independent data set showed the robustness of the newly developed empirical models to accurately predict AEN, REN, and PEN with an RMSE of 3.43 kg kg−1, 4.22%, and 3.67 kg kg−1 and RRMSE of 17.53%, 12.46%, and 13.17%, respectively. This indicates that Nand has the potential to predict AEN and its components during the growth period of winter wheat. The findings will assist in improving in-season N use efficiency by fine-tuning N scheduling decisions in winter wheat cultivation.
1 Introduction
Wheat is grown in nearly every region of the world. The economic and dietary significance of wheat for million of smallholder farmers,poorest, and undernourished people cannot be disputed. Therefore, wheat is imperative for ensuring global food and nutritional security (Zheng et al., 2021). Wheat production has kept pace with the gigantic increase in human population, mainly due to high-yield cultivars and N fertilizer application. N fertilizer is the most important plant nutrient for enhancing the grain yield and quality of major cereals (Ata-Ul-Karim et al., 2016; Zhao et al., 2021). However, inappropriate N fertilizer application not only decreases the agronomic N use efficiency (AEN) but also poses negative side effects, disturbing aquatic and terrestrial ecosystems as well as seriously afflicting the atmosphere (Rutting et al., 2018). Therefore, it is critical to optimize the current N use in crop production to improve the AEN and reduce the N requirement.
The critical N dilution curve is a plant-based diagnostic approach that has been widely used for over three decades for diagnosing crop N status. Additionally, it has also been integrated as a reference index for calibrating other methods of crop N management such as chlorophyll meters, remote sensing, and soil nitrate (Devienne-Barret et al., 2000; Zhao et al., 2016; Zha et al., 2020). A critical N dilution curve-based N nutrition index has been widely used to assess crop N status. Accumulated N deficit (Nand) is also a critical N dilution curve-based index, which also has the potential to quantify crop N status (Ata-Ul-Karim et al., 2013, Zhao et al., 2022). The critical N dilution curve for winter wheat has been established in different countries around the world, including China (Yue et al., 2012). Nand, being a crop-specific, precise, and theoretically sound index in relation to actual crop growth, is agronomically relevant to serve as an N diagnostic tool (Ata-Ul-Karim et al., 2013).
Nitrogen is required by plants for generating a photosynthetically active canopy to ensure optimal grain yield and storing enough grain protein. Crop growth, grain yield, and grain quality are highly dependent on substantial N inputs. N application in agricultural production has markedly increased over the past half-century worldwide, including in China (Wang and Lu, 2020). China is currently the largest consumer of N fertilizer worldwide. Excessive N application is a common practice in the intensive cropping systems of China. The average N application rates in wheat-producing regions of China reach up to 550 kg ha−1 year−1 (Zhang et al., 2015). Excessive N use has led to low AEN (27.5%) in wheat-growing regions (Ding et al., 2018). Agronomists and crop breeders are trying to seek crop cultivars with better AEN to ensure higher grain yields with low N requirements. Previous studies showed that AEN could be affected by N fertilizer application (Halvorson et al., 2005; Zhai et al., 2019). Therefore, it is important to understand the changes in AEN due to N fertilizer application to develop cost-effective and eco-friendly N management strategies. The AEN is crucial to interpreting and understanding the trade-offs between optimal agriculture production and the potential loss of N fertilizer. Additionally, the variability in AEN can also assist in the adoption of suitable crop management practices by growers as well as the selection of wheat cultivars with higher N use efficiencies (Cantarella et al., 2018). It is challenging to compare the difference in N fertilizer use under different N management conditions in agricultural production without prior knowledge of AEN (Sadras and Denison, 2016). Therefore, understanding the limited factors related to AEN is essential to improving crop production and reducing N loss. This study hypothesizes that the crop N deficit has a significant effect on the values of AEN and its components across different N treatments, there is a strong linear relationship between Nand and AEN and that this relationship can be employed for in-season assessment of crop N status. However, little has been done to investigate the relationship of Nand with AEN and its components during the growth period of winter wheat.
Therefore, this study aims to develop the relationship of Nand with AEN and its components (physiological N fertilizer efficiency (PEN) and N fertilizer recovery efficiency (REN)) for winter wheat. The findings will assist in improving in-season N use efficiency by fine-tuning N scheduling decisions in winter wheat cultivation.
2 Materials and methods
2.1 Experimental site and design
Four multi-locational experiments with varied N application rates were conducted at Xinxiang and Jiaozuo from 2016 to 2018 using the six most widely grown winter wheat cultivars in the region. The detailed description of soil characteristics of experimental sites, cultivars, N rates, planting, sampling, and harvesting timing is shown in Table 1. The weather conditions during the experimental period are shown in Figure 1. Treatments were replicated thrice using a randomized complete block design. The size of each plot was 24 m2 (6 m × 4 m). The seeding rate was 240 kg ha−1. N fertilizer (urea, 46% N) was applied (50:50) as basal and top dressing before sowing and at Feekes stage 4. P (as P2O5) and K (as K2O) were applied at the rates of 120 kg ha−1 and 105 kg ha−1, respectively. The broadcasting method of fertilizer application was used to apply fertilizer to each plot. Weeds, pests, and diseases were managed using chemical methods, with chemicals applied at recommended rates. Each plot was irrigated evenly using surface irrigation with a 4-inch plastic-coated hose. N fertilizer application was the only factor limiting crop growth and productivity.
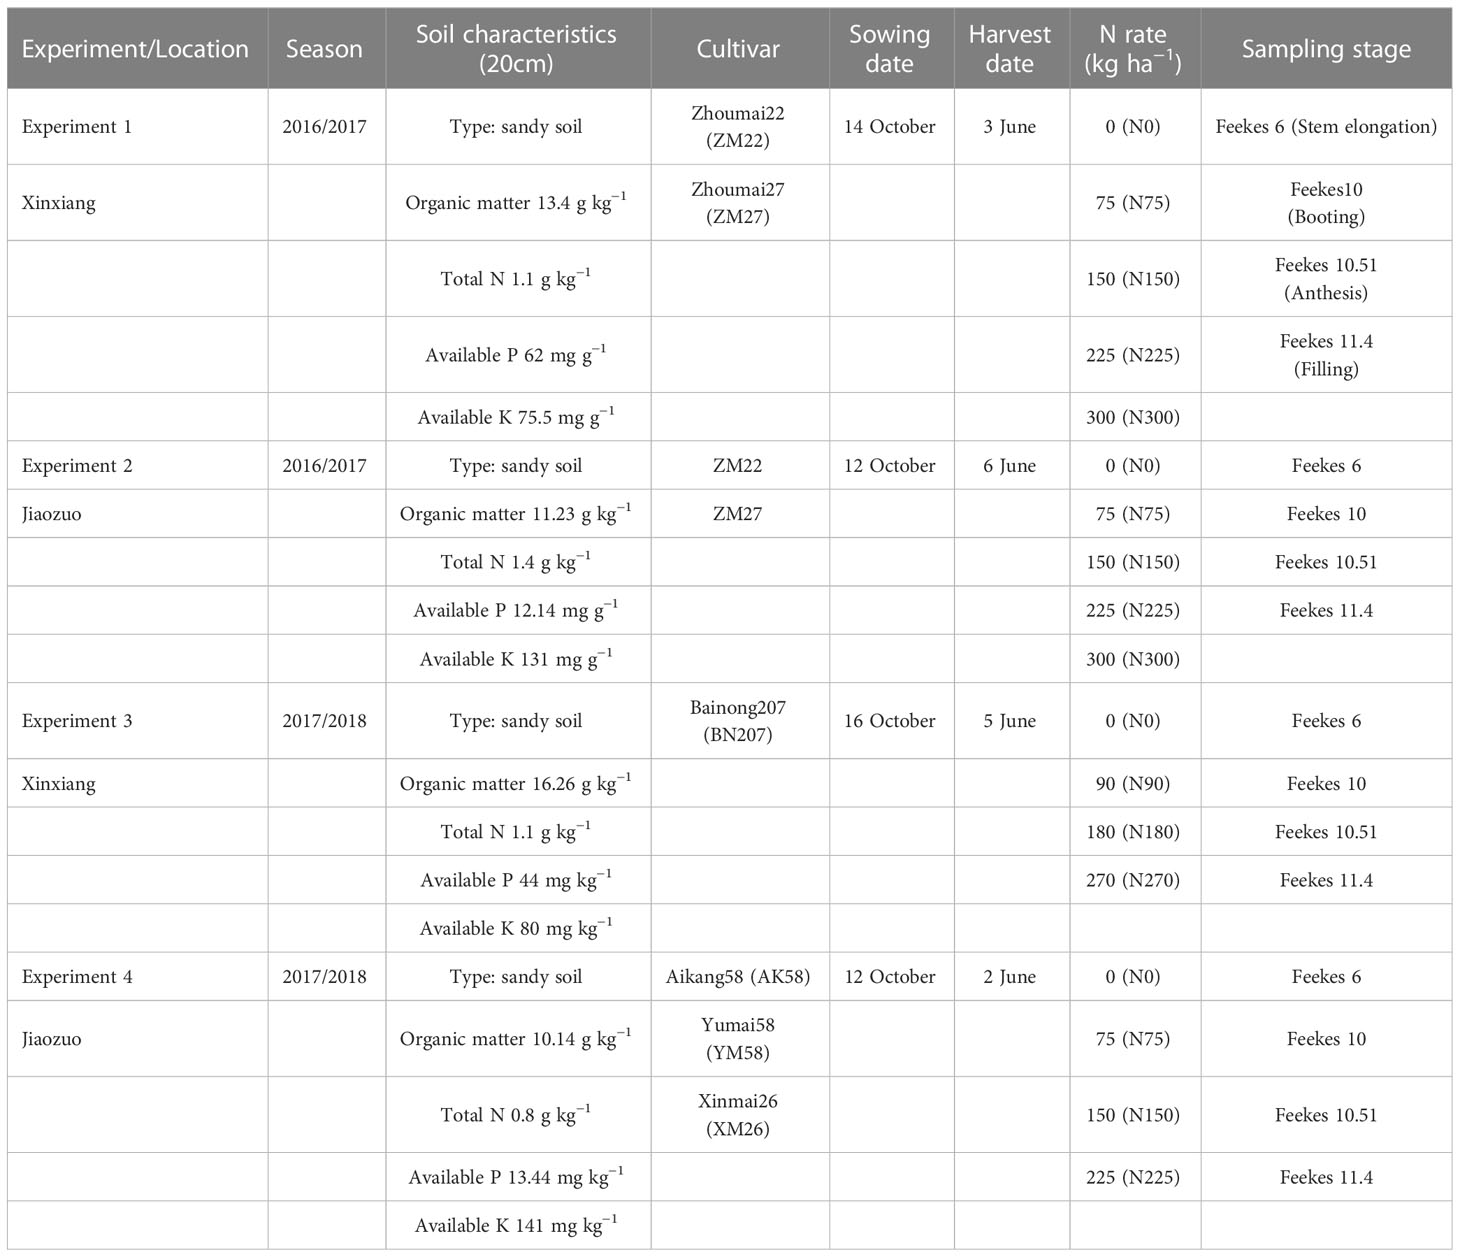
Table 1 Characteristics of the four field experiments conducted in this study during 2016–2018.
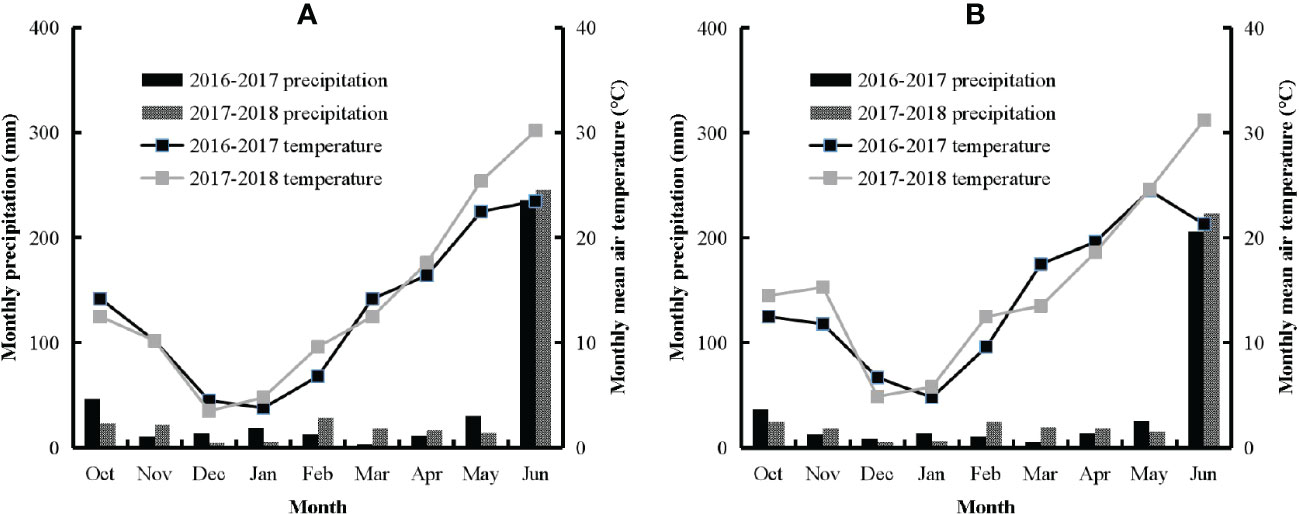
Figure 1 Monthly mean air temperature (°C) and precipitation (mm) from 2016 to 2018 seasons at different experimental sites (A) Xinxiang (XX); (B) Jiaozuo (JZ).
2.2 Crop sampling and measurements
Twenty plants were sampled from each experimental plot at different Feekes stages for the determination of plant dry matter (DM) and plant N concentration (PNC). Plant samples were oven-dried for 48 h at 80°C to get a constant weight and then weighed on an analytical balance, followed by grinding and sieving through a sieve for lab analysis. Samples of 0.15 g of ground plant biomass were digested using a mixture of H2O2 and H2SO4, and the PNC was determined using the Kjeldahl method (Bremner and Mulvancy, 1982).
Grain yield at maturity was determined by harvesting a 1 m2 area from each plot and adjusting the moisture content to 14%. A thousand grain weight (TGW) was measured from 1,000 grain samples. Grain protein content was measured by multiplying the grain N concentration by a factor of 6.25, while protein yield was measured by multiplying crop yield by grain protein content. The descriptions, abbreviations, and units of all indices are described in Supplementary Table S1.
2.3 Accumulated N deficit
Plant Nand was estimated by subtracting the critical plant N accumulation (PNA) from the actual PNA across different N rates at each sampling stage (Ata-Ul-Karim et al., 2013). The dilution curve of Nc concentration (Nc = 4.15DM−0.38) of winter wheat was used to calculate the value of Nand (Yue et al., 2012).
Where Ncna is the PNA under the Nc condition (kg ha−1), Nna is the actual PNA across varied N (kg ha−1), and 10 is the conversion factor. If Nand is equal to 0, optimal N nutrition is observed. If Nand = 0, N nutrition was considered optimum, while Nand >0 indicated N deficiency and v<0 pointed out luxury consumption (Ata-Ul-Karim et al., 2013).
2.4 Agronomic nitrogen use efficiency and its components
Agronomic N use efficiency is the amount of additional grain harvested per kilogram of N fertilizer applied. AEN could be represented as Gw/Nf, where Gw is grain yield and Nf is N fertilizer application (kg ha−1) (Halvorson et al., 2005). This is defined as (Gwi − Gw0)/Nf where i is the level of N fertilizer under various treatments and 0 is the N fertilizer under control treatment.
The two primary components of AEN are: (1) N fertilizer recovery efficiency (REN), which describes the recovery efficiency of fertilizer N from soil (Nti − Nt0)/Nf (Zhang et al., 2008), and (2) physiological N use efficiency (PEN) is the measure of the ability of a plant to produce grain/biomass with N acquired at the whole plant level (Gwi − Gw0)/(Nti − Nt0) (Zhang et al., 2008), where Nt represents plant N accumulation at harvest. Therefore, AEN was expressed by the following equation:
2.5 Data analysis
The data of PNC, grain yield, grain protein content, grain protein yield, TGW, AEN, REN, and PEN were subjected to one-way analysis of variance analysis for comparing the statistical difference using the SPSS software package version 22 (SPSS Inc., Chicago, IL, USA). The difference between the data means was assessed using the least significant difference (LSD) test at the 5% level. The fixed effects included cultivar, N treatments, and site, while the random effects included block. The fitted linear model was estimated based on the least square method.
2.6 Development and validation of models
Data acquired from field experiments in 2016–2017 were used to develop the relationship between Nand and AEN and its components, while the data acquired in 2017–2018 were used to validate the newly developed relationships. Root mean square error (RMSE), relative root mean square error (RRMSE), and a 1:1 plot were used to determine the robustness of newly developed models between the estimated and observed values of AEN, REN, and PEN. RMSE and RRMSE were calculated as follows:
where n represents the sample number, and Pi and Oi represent estimated and observed values, respectively. Õ is the average value of the observed values.
3 Results
3.1 Plant nitrogen concentration under different nitrogen rates
Plant N concentration increased with the increase in N input rates, and a significant difference was observed for PNC under different N treatments and growth stages (Figure 2). PNC significantly declined from Feekes stage 6 to Feekes stage 11.4 with the growth of winter wheat during the 2016–2017 season at Xinxiang and Jiaozuo (Supplementary Tables S2, S3). The maximum value of PNC was observed at Feekes stage 6 for both cultivars, while the minimum value of PNC was observed at Feekes stage 11.4. PNC ranged from 1.19% to 4.18% and 1.09% to 3.46% for ZM22 and ZM27, respectively, during the 2016–2017 season of Xinxiang (Figures 2A, B), while PNC during the 2016–2017 season of Jiaozuo ranged from 1.18% to 4.05% and 1.18% to 3.76% for ZM22 and ZM27, respectively (Figures 2C, D). Overall, ZM22 showed higher PNC than ZM27 across different N treatments, growth stages, seasons, and experimental sites.
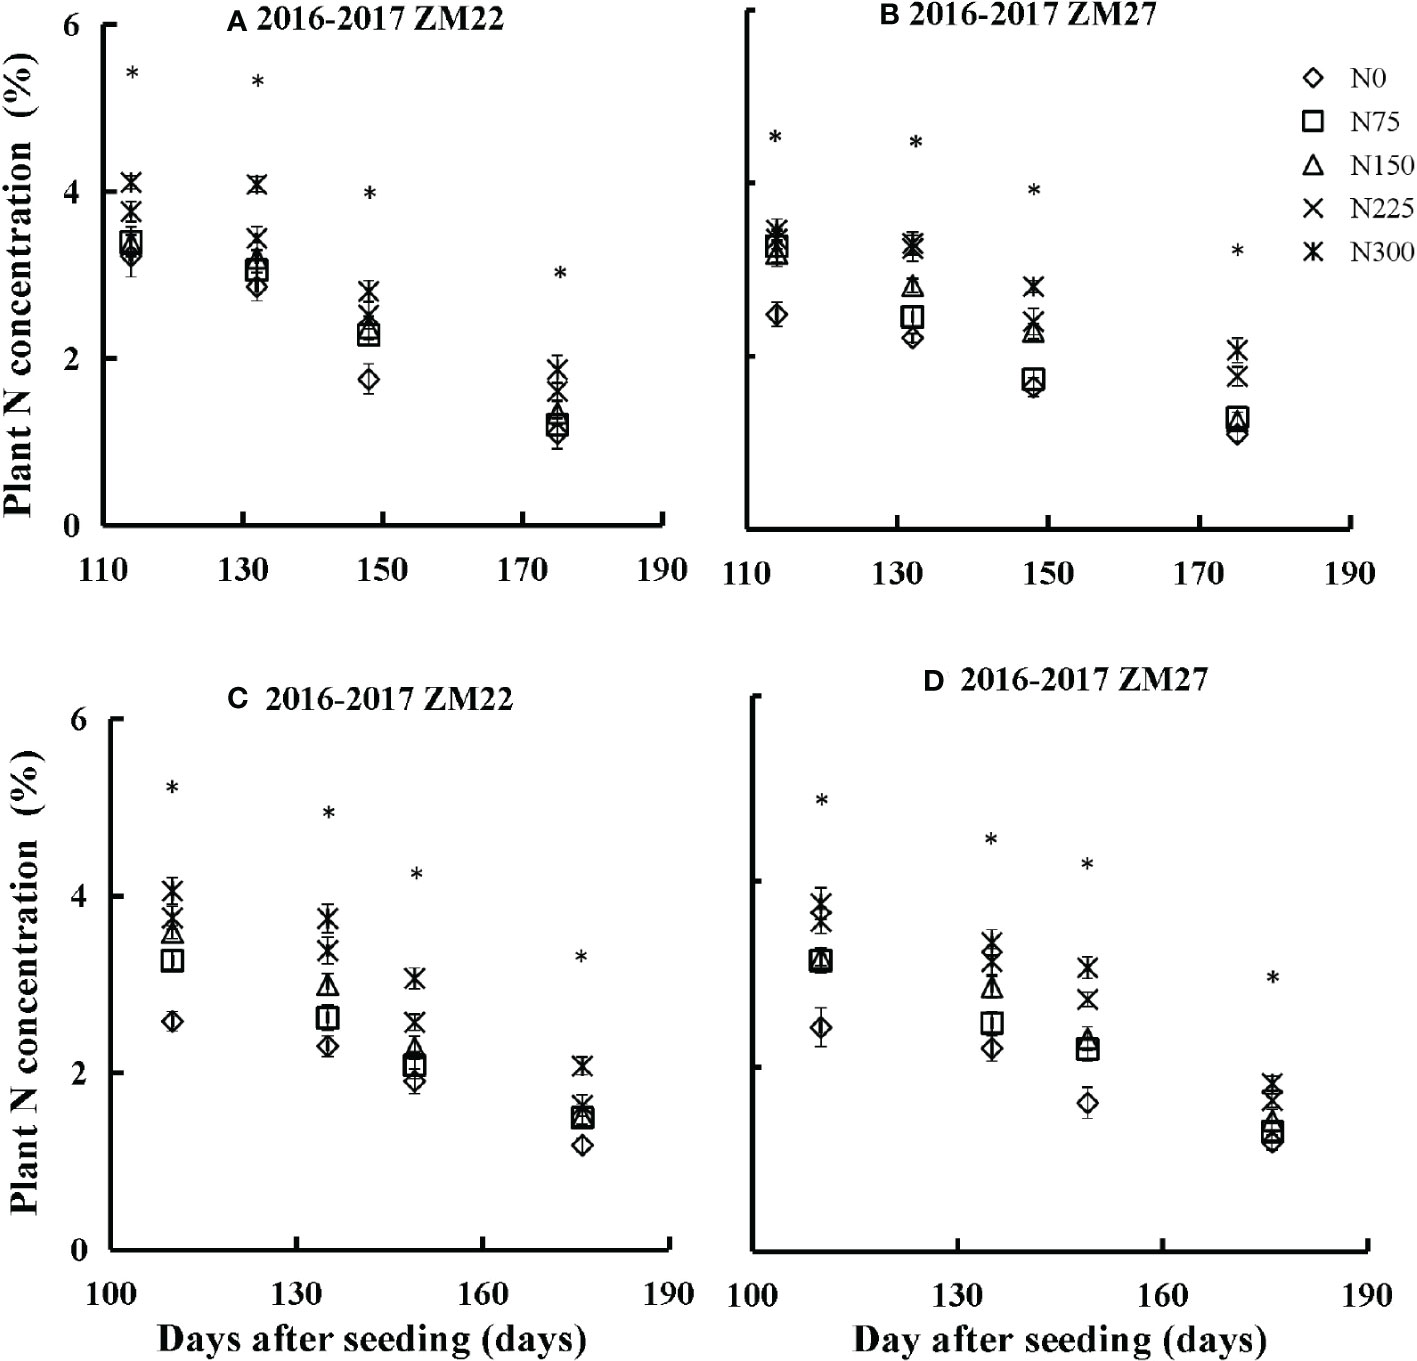
Figure 2 Changes in PNC as a function of time (days after sowing) at various N rates in the 2016–2017 seasons and for different cultivars (A, B) Xinxiang; (C, D) Jiaozuo. The vertical bar represents the standard deviation of plant N concentration, and the symbol *indicates that the p-value is<0.05.
3.2 Grain yield and quality-related indices under different nitrogen rates
Grain yield, grain protein content, grain protein yield, and TGW were not affected (p<0.05) by the interactive effect of cultivar × N rate, cultivar × site, N rate × site, and cultivar × N rate × site. The grain yield of both cultivars was affected by the application of N fertilizer (Table 2), and maximum grain yield was observed with ZM27. ZM27 showed 10% higher grain yield than ZM22. The grain yield of both cultivars declined under maximum N application (300 kg ha−1) during the 2016–2017 wheat growing season. Higher grain protein yield and grain protein content were observed for ZM22 as compared to ZM27. Grain protein yield and protein content of ZM22 were 20% and 8% higher than those of ZM27, respectively. Besides, grain protein yield and grain protein content were also affected by N application. Grain protein yield and grain protein content of both cultivars showed an average increase of 19% and 137%, respectively, as compared with the N0 treatment. However, little variation was observed in grain protein yield and grain protein content across the sites. Grain protein content was slightly higher at Xinxiang than at Jiaozuo, while grain protein yield was higher at Jiaozuo. Additionally, the TGW of both cultivars was not affected by fertilizer application rates.
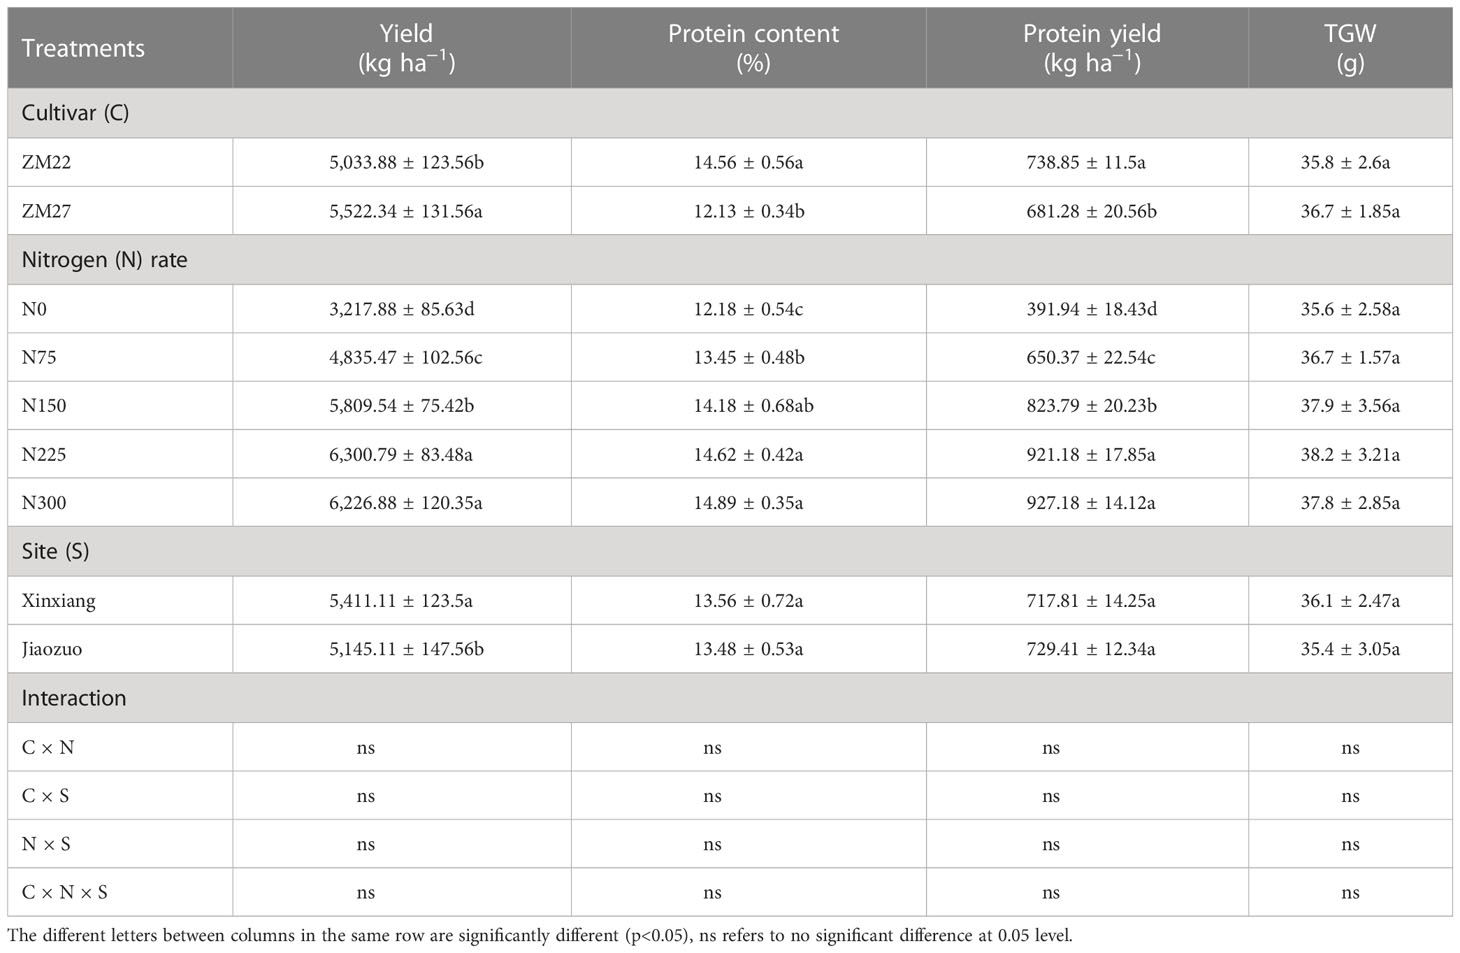
Table 2 Mean values of yield, protein content, protein yield, and a thousand grain weight (TGW) of two cultivars under five N levels during the 2016–2017 growing seasons.
3.3 Accumulated nitrogen deficit under different nitrogen rates
The accumulated nitrogen deficit varied from −65.73 to 104.37 kg ha−1 under different N rates across seasons, cultivars, sites, and growth stages of winter wheat. There were substantial differences in Nand across different N treatments and cultivars (Figure 3). The Nand showed a declining trend with increasing N application rates, while it increased gradually towards advancing maturity. This increase towards advancing maturity was obvious under N-limiting treatments (N0, N75, and N150), and it reached its maximum value at Feekes stage 11.4. Conversely, this increase was minor under optimal N conditions (N225), while under non-N-limiting treatment (N300), excess N accumulation was observed until Feekes stage 11.4. The Nand ranged from 104.37 to −44.42 kg ha−1 and 93.07 to −40.64 kg ha−1 during the 2016 to 2017 season at Xinxiang for ZM22 and ZM27, respectively, while it ranged from 91.97 to −38.27 kg ha−1 and 102.08 to −65.73 kg ha−1 during the 2016 to 2017 season at Jiaozuo for ZM22 and ZM27, respectively. Non-significant differences were observed for Nand across different cultivars and sites (p-value = 0.817). The Nand values were higher than 0 for N0, N75, and N150 treatments, were almost equal to 0 for the N225 treatment, and were lower than 0 for the N300 treatment across sites and seasons.
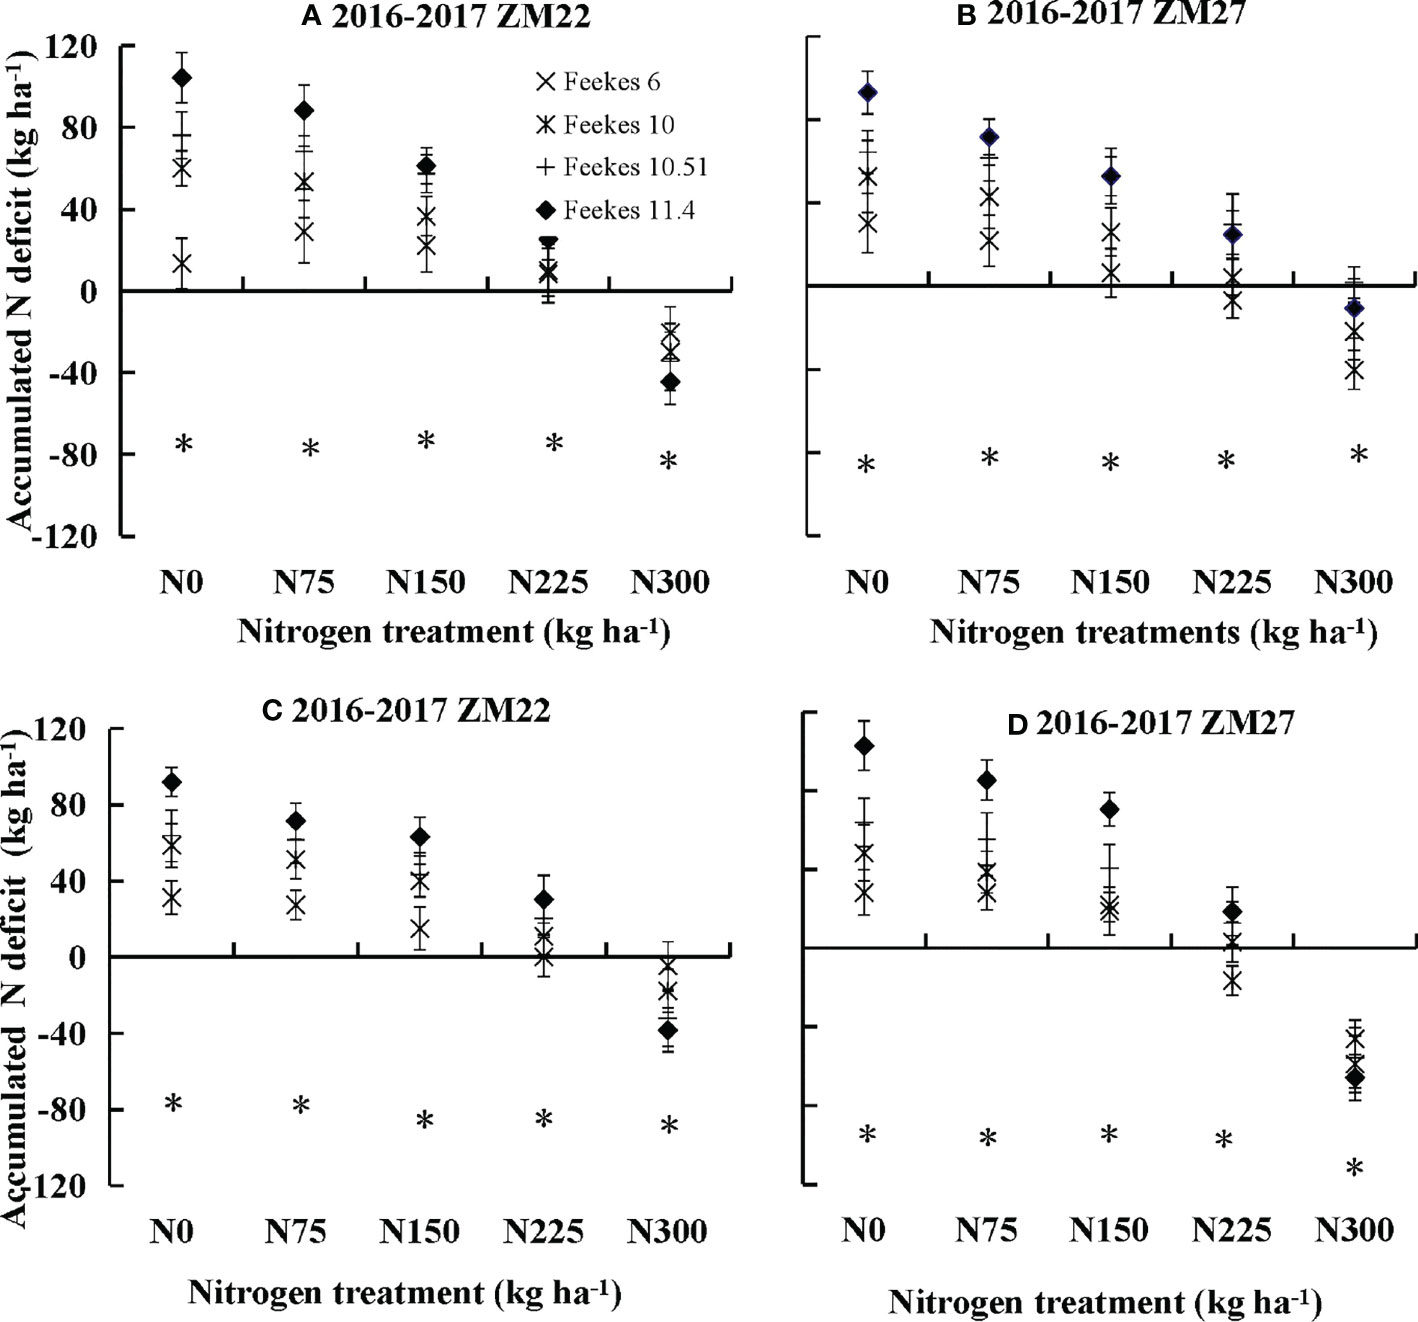
Figure 3 Changes in accumulated N deficit for winter wheat under different N application rates in experiments conducted from 2016 to 2017 (A, B) Xinxiang; (C, D) Jiaozuo. The vertical bar represents the standard deviation of accumulation N deficit, and the symbol *indicates that the p-value is<0.05.
3.4 Agronomic nitrogen fertilizer use efficiency and its components under different nitrogen rates
Agronomic N fertilizer use efficiency and its components (REN and PEN) were not affected (p<0.05) by the interactive effect of cultivar × N rate, cultivar × site, N rate × site, and cultivar × N rate × site. AEN, REN, and PEN were affected by N fertilizer application (Table 3). The values of AEN, PEN, and REN ranged from 12.5 to 23.56 kg kg−1, 23.51 to 37.39 kg kg−1, and 31.6% to 55.7%, respectively, across different N rates during the 2016 to 2017 season (Table 3). AEN, REN, and PEN were higher at 75 kg N ha−1 than those at 300 kg N ha−1, which indicates that AEN, REN, and PEN declined with increasing N supply. ZM27 showed higher values of AEN and PEN than ZM22. The ZM27 of AEN and PEN were 42% and 37.6% higher than those of ZM22, while the REN of ZM22 was 5% lower than that of ZM27. However, non-significant differences were observed for AEN, REN, and PEN of wheat cultivars at both sites; the minor differences might be attributed to experimental error (Table 3).
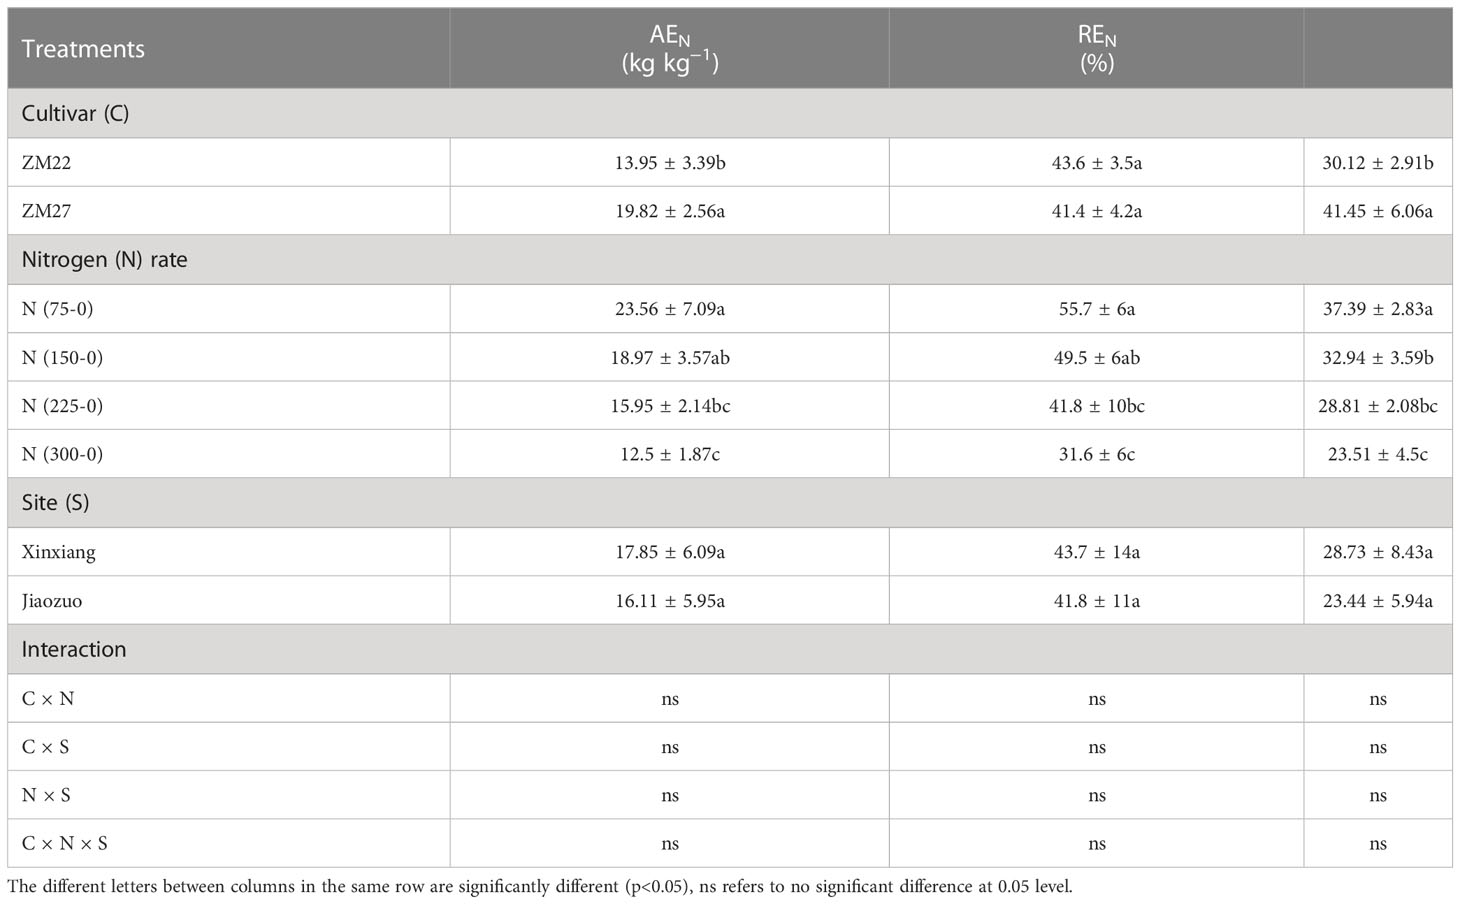
Table 3 N fertilizer agronomic efficiency and its components for two cultivars under different N levels during the 2016 to 2017 growing seasons and the mean values of the two cultivars under the different N levels.
3.5 Relationships between accumulated nitrogen deficit and agronomic nitrogen use efficiency and its components
Accumulated nitrogen deficit was positively correlated with AEN, REN, and PEN for both cultivars during the 2016 to 2017 seasons at Xinxiang and Jiaozuo (Figures 4–6). The robustness of these relationships was validated using data acquired from an independent experiment from 2017 to 2018. The RMSE of 3.43 kg kg−1, 4.22%, and 3.67 kg kg−1 and RRMSE of 17.53%, 12.46%, and 13.17% were observed for AEN, REN, and PEN, respectively, while the values of R2 were 0.67, 0.73, and 0.85 for AEN, REN, and PEN, respectively, indicating a good relationship between the observed and predicted AEN, REN, and PEN values (Figure 7).
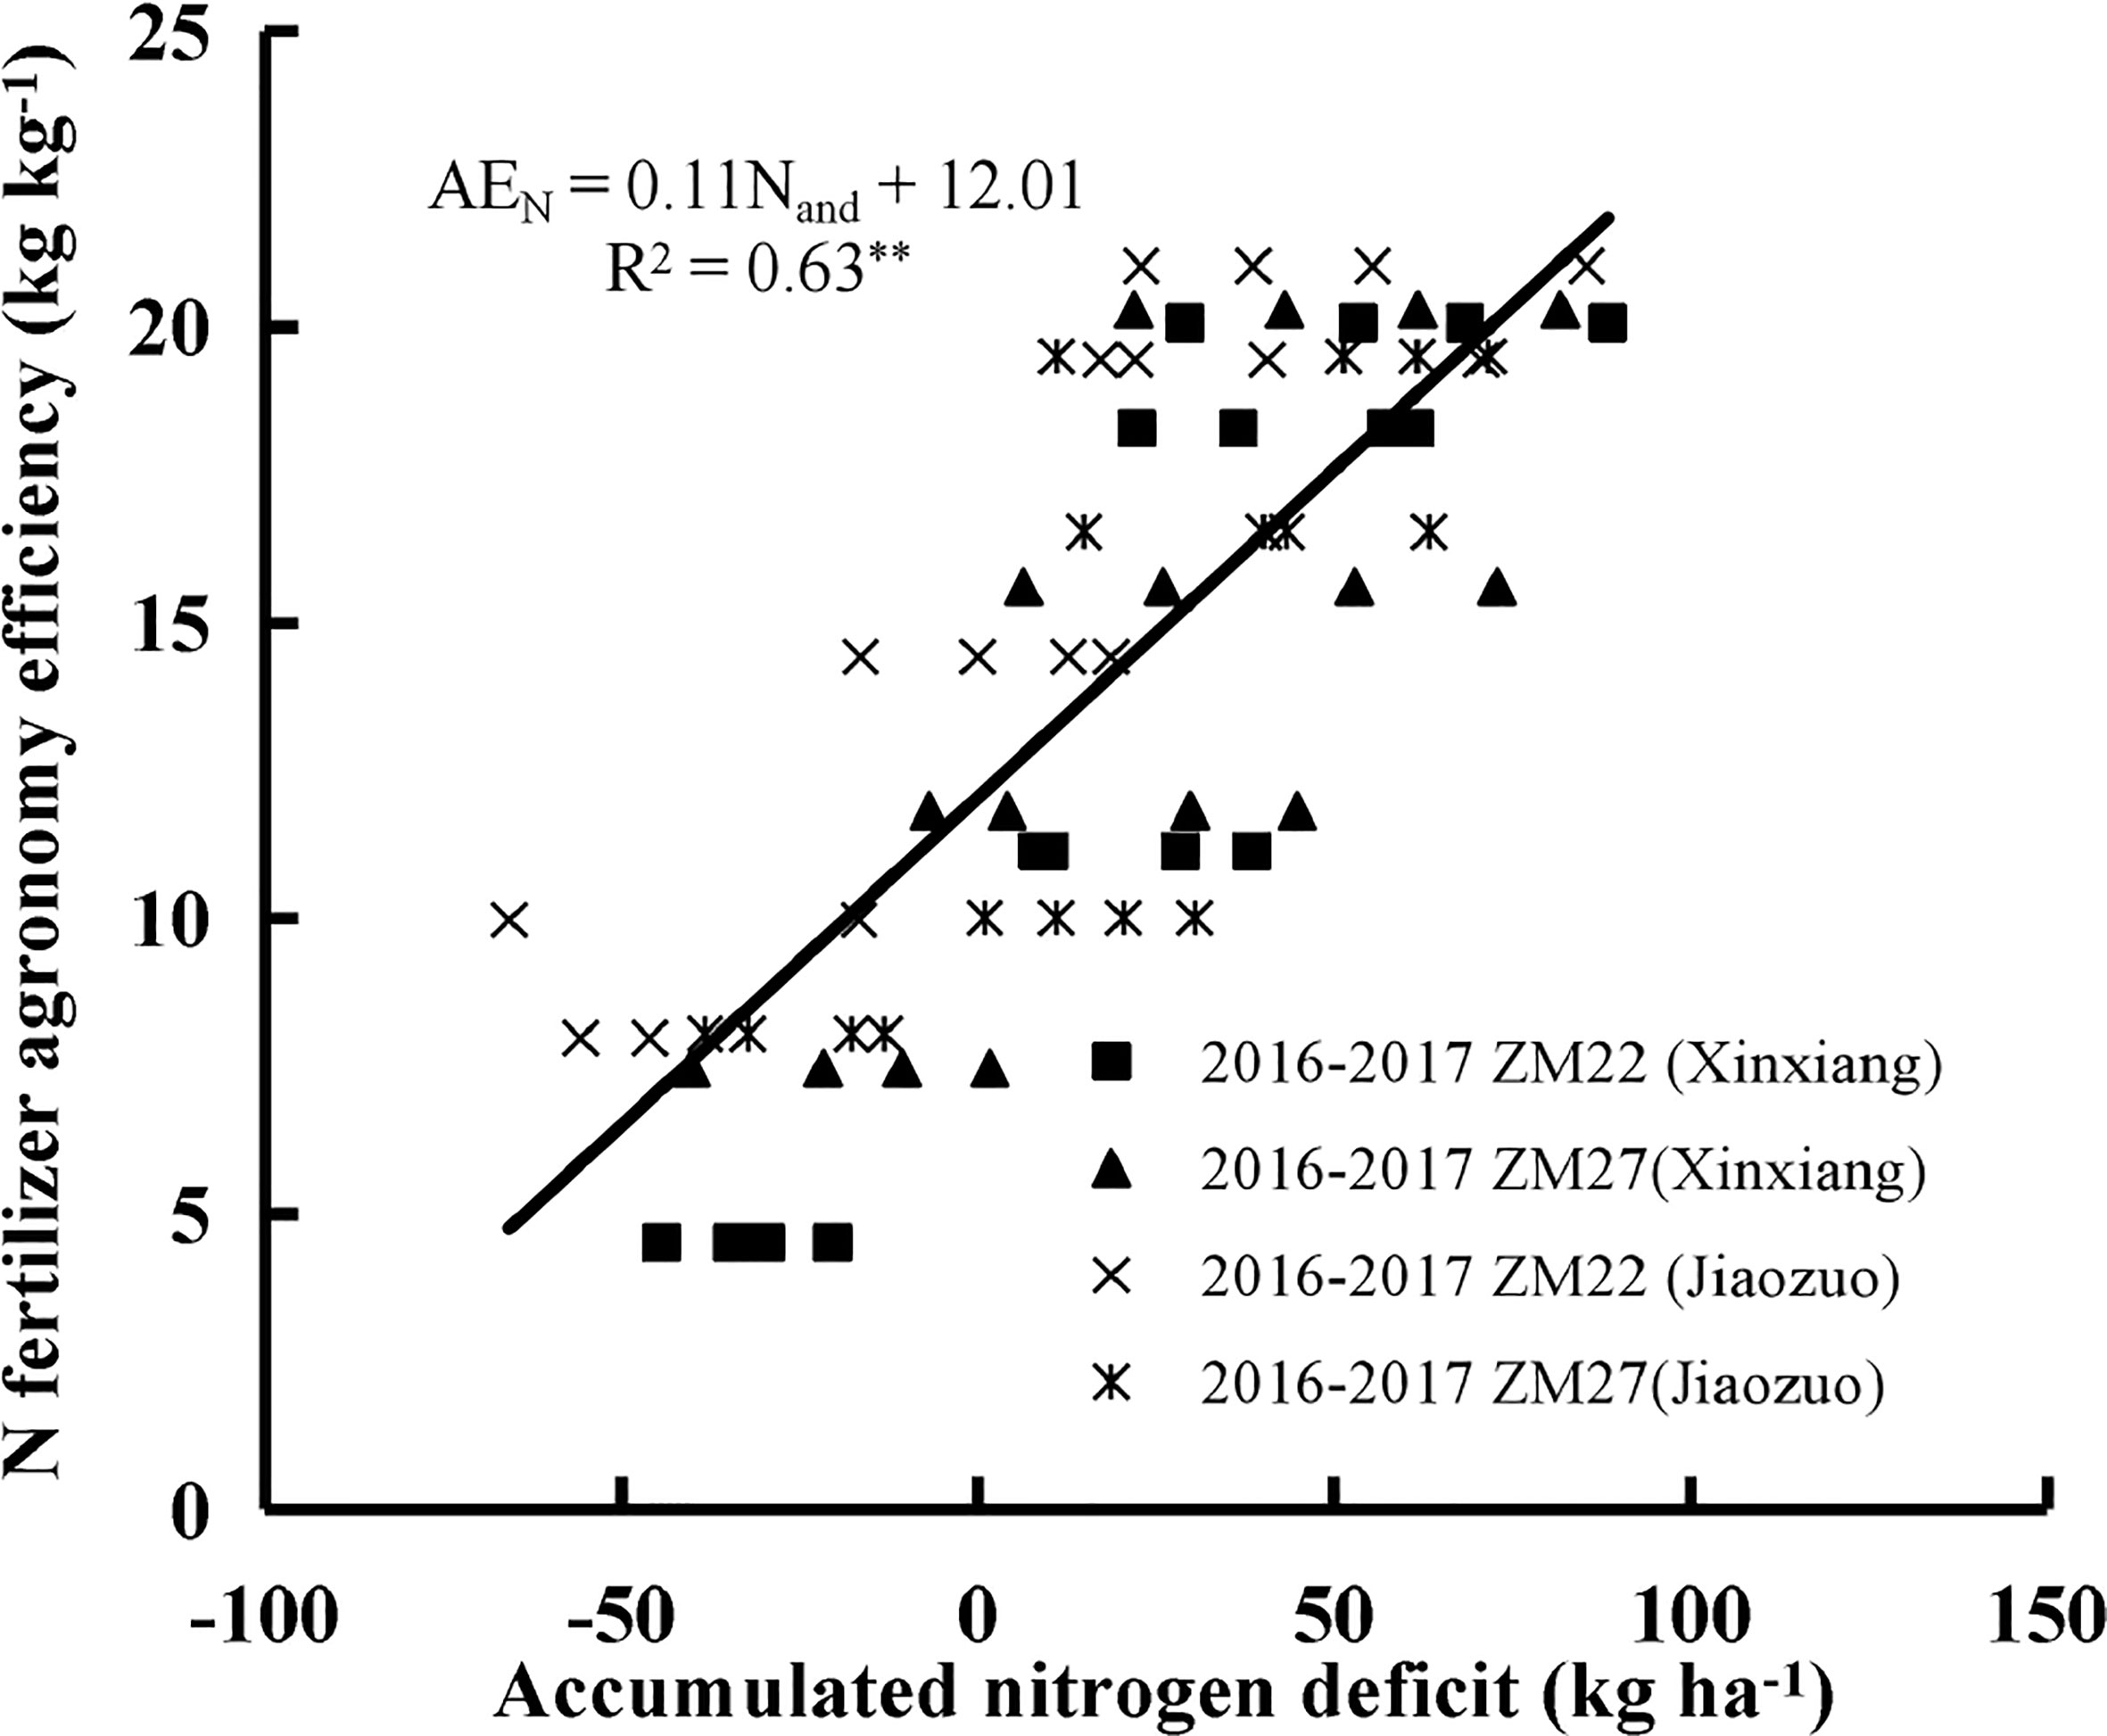
Figure 4 The relationship between accumulated N deficit and N fertilizer agronomic efficiency of winter wheat from 2016 to 2017 at Xinxiang and Jiaozuo. The symbol **indicates that the p-value is<0.01.
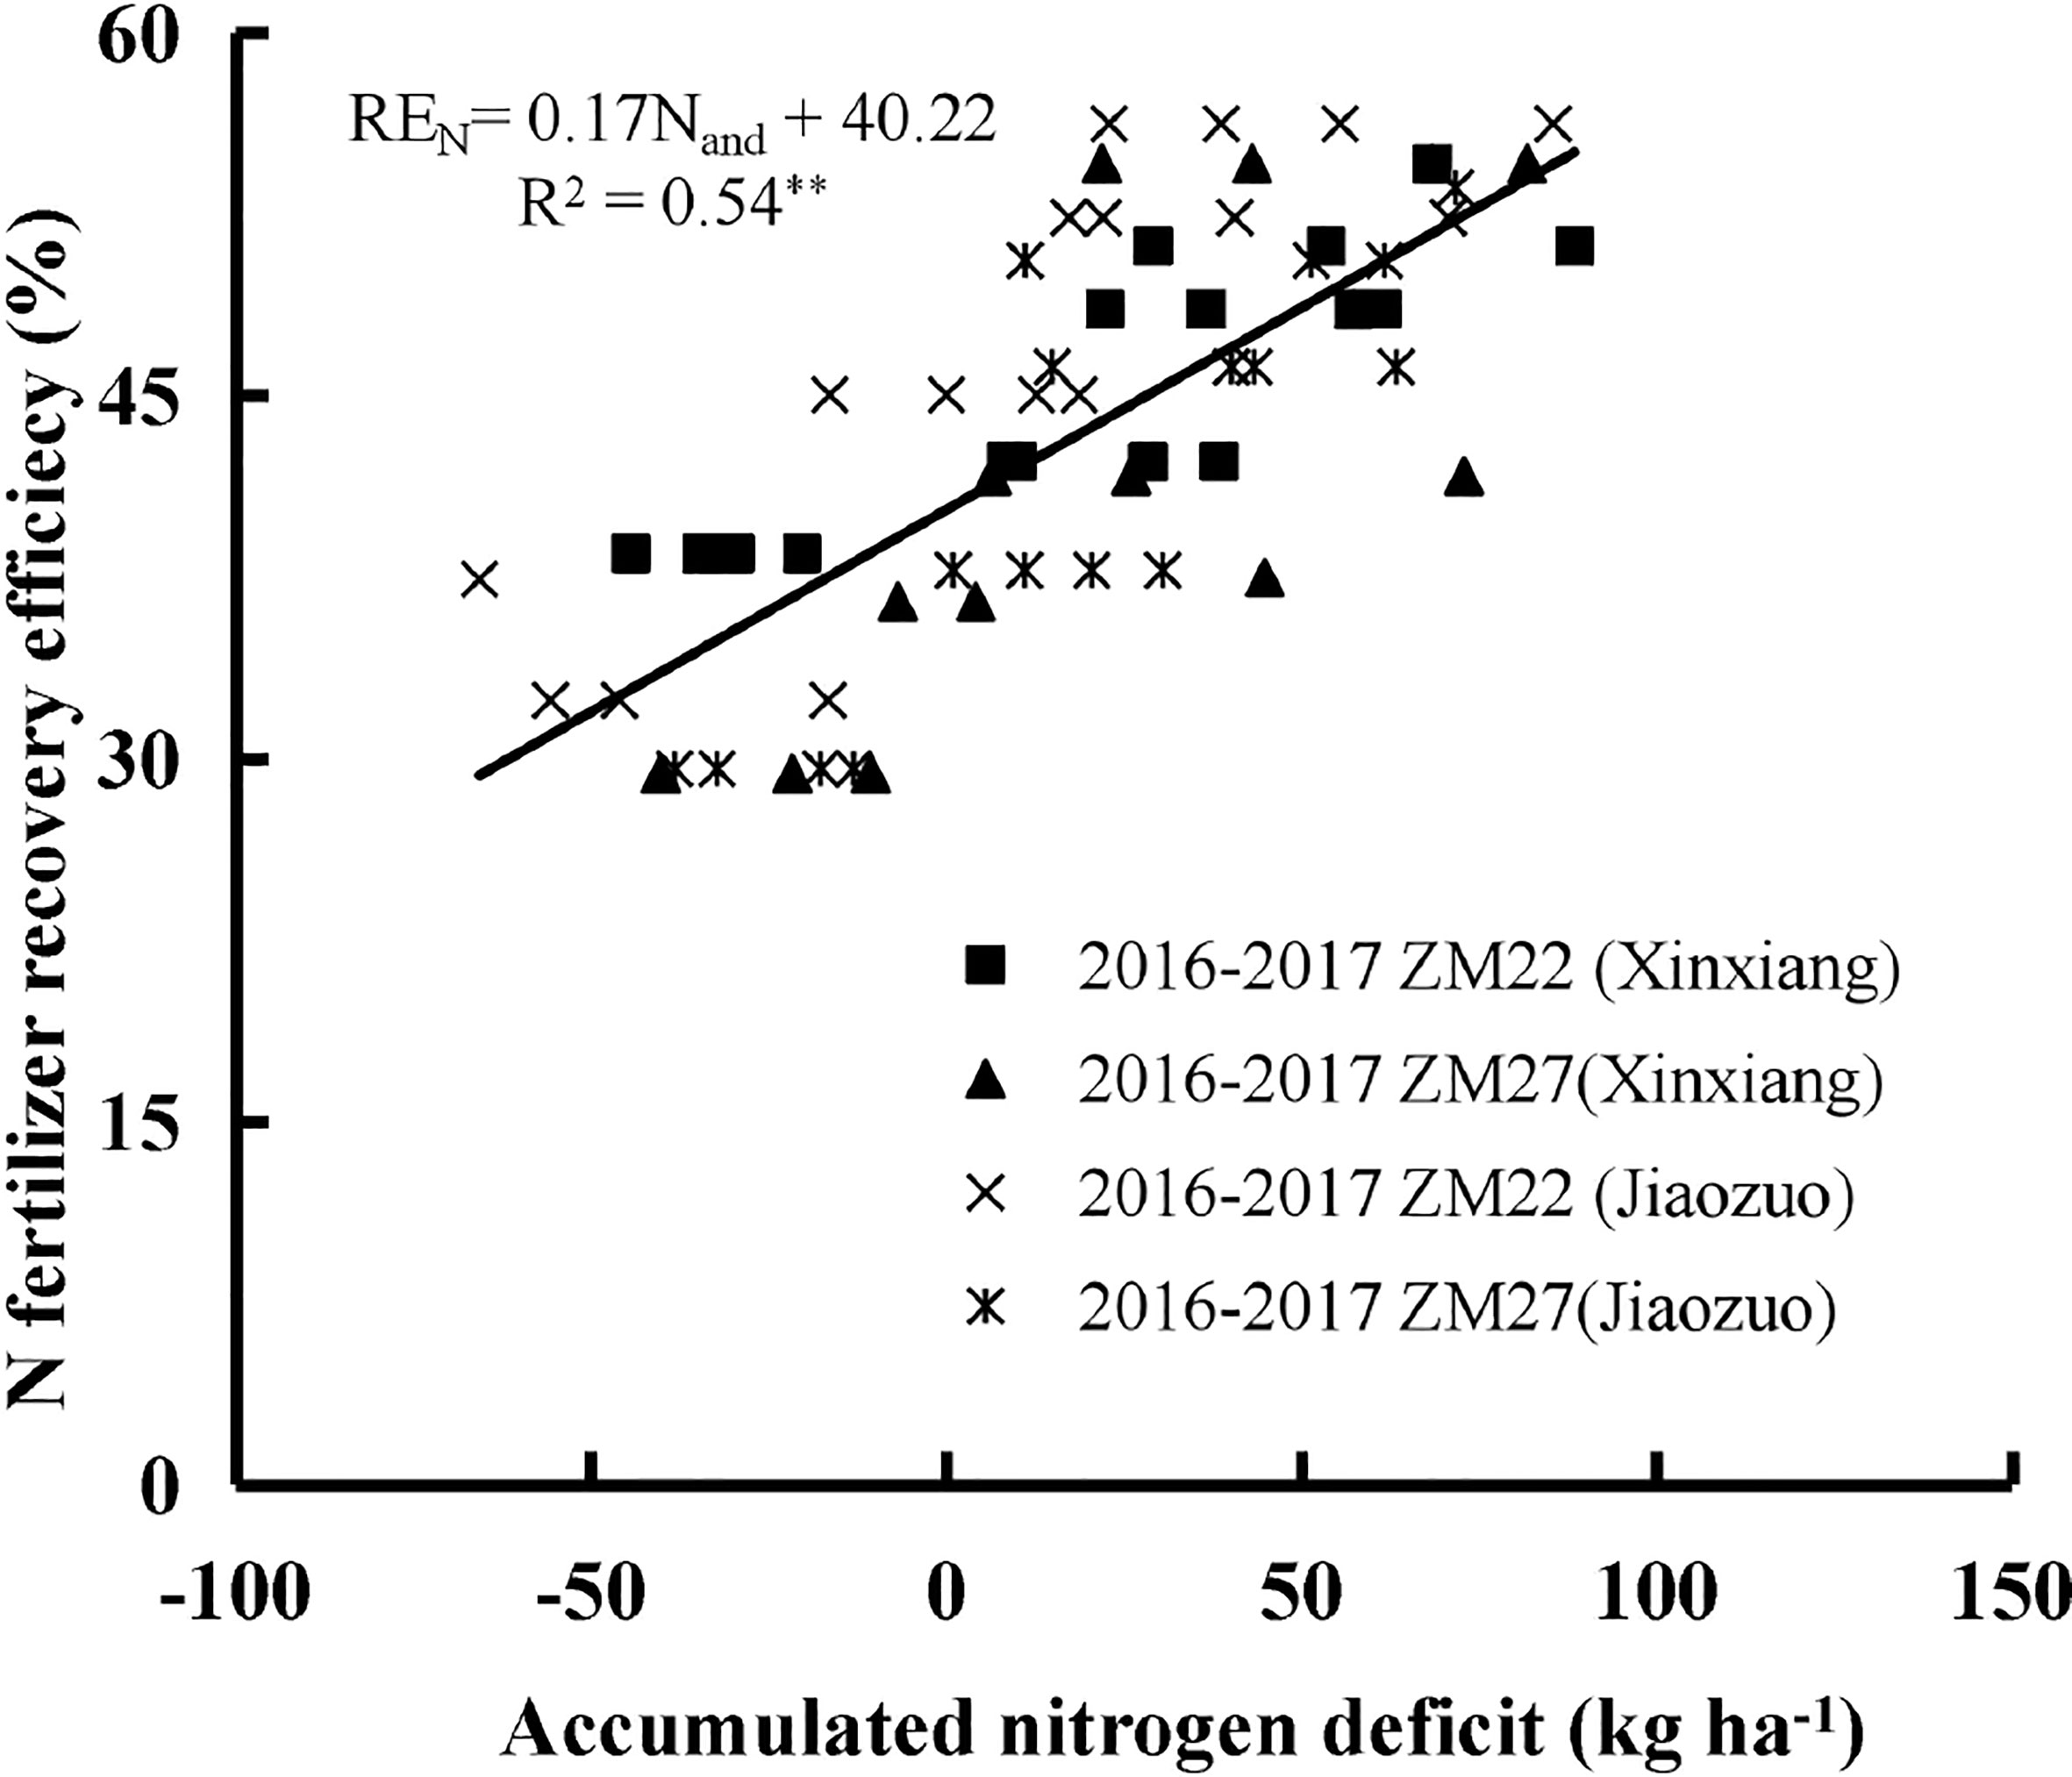
Figure 5 The relationship between accumulated N deficit and N fertilizer recovery efficiency of winter wheat from 2016 to 2017 at Xinxiang and Jiaozuo. The symbol **indicates that the p-value is<0.01.
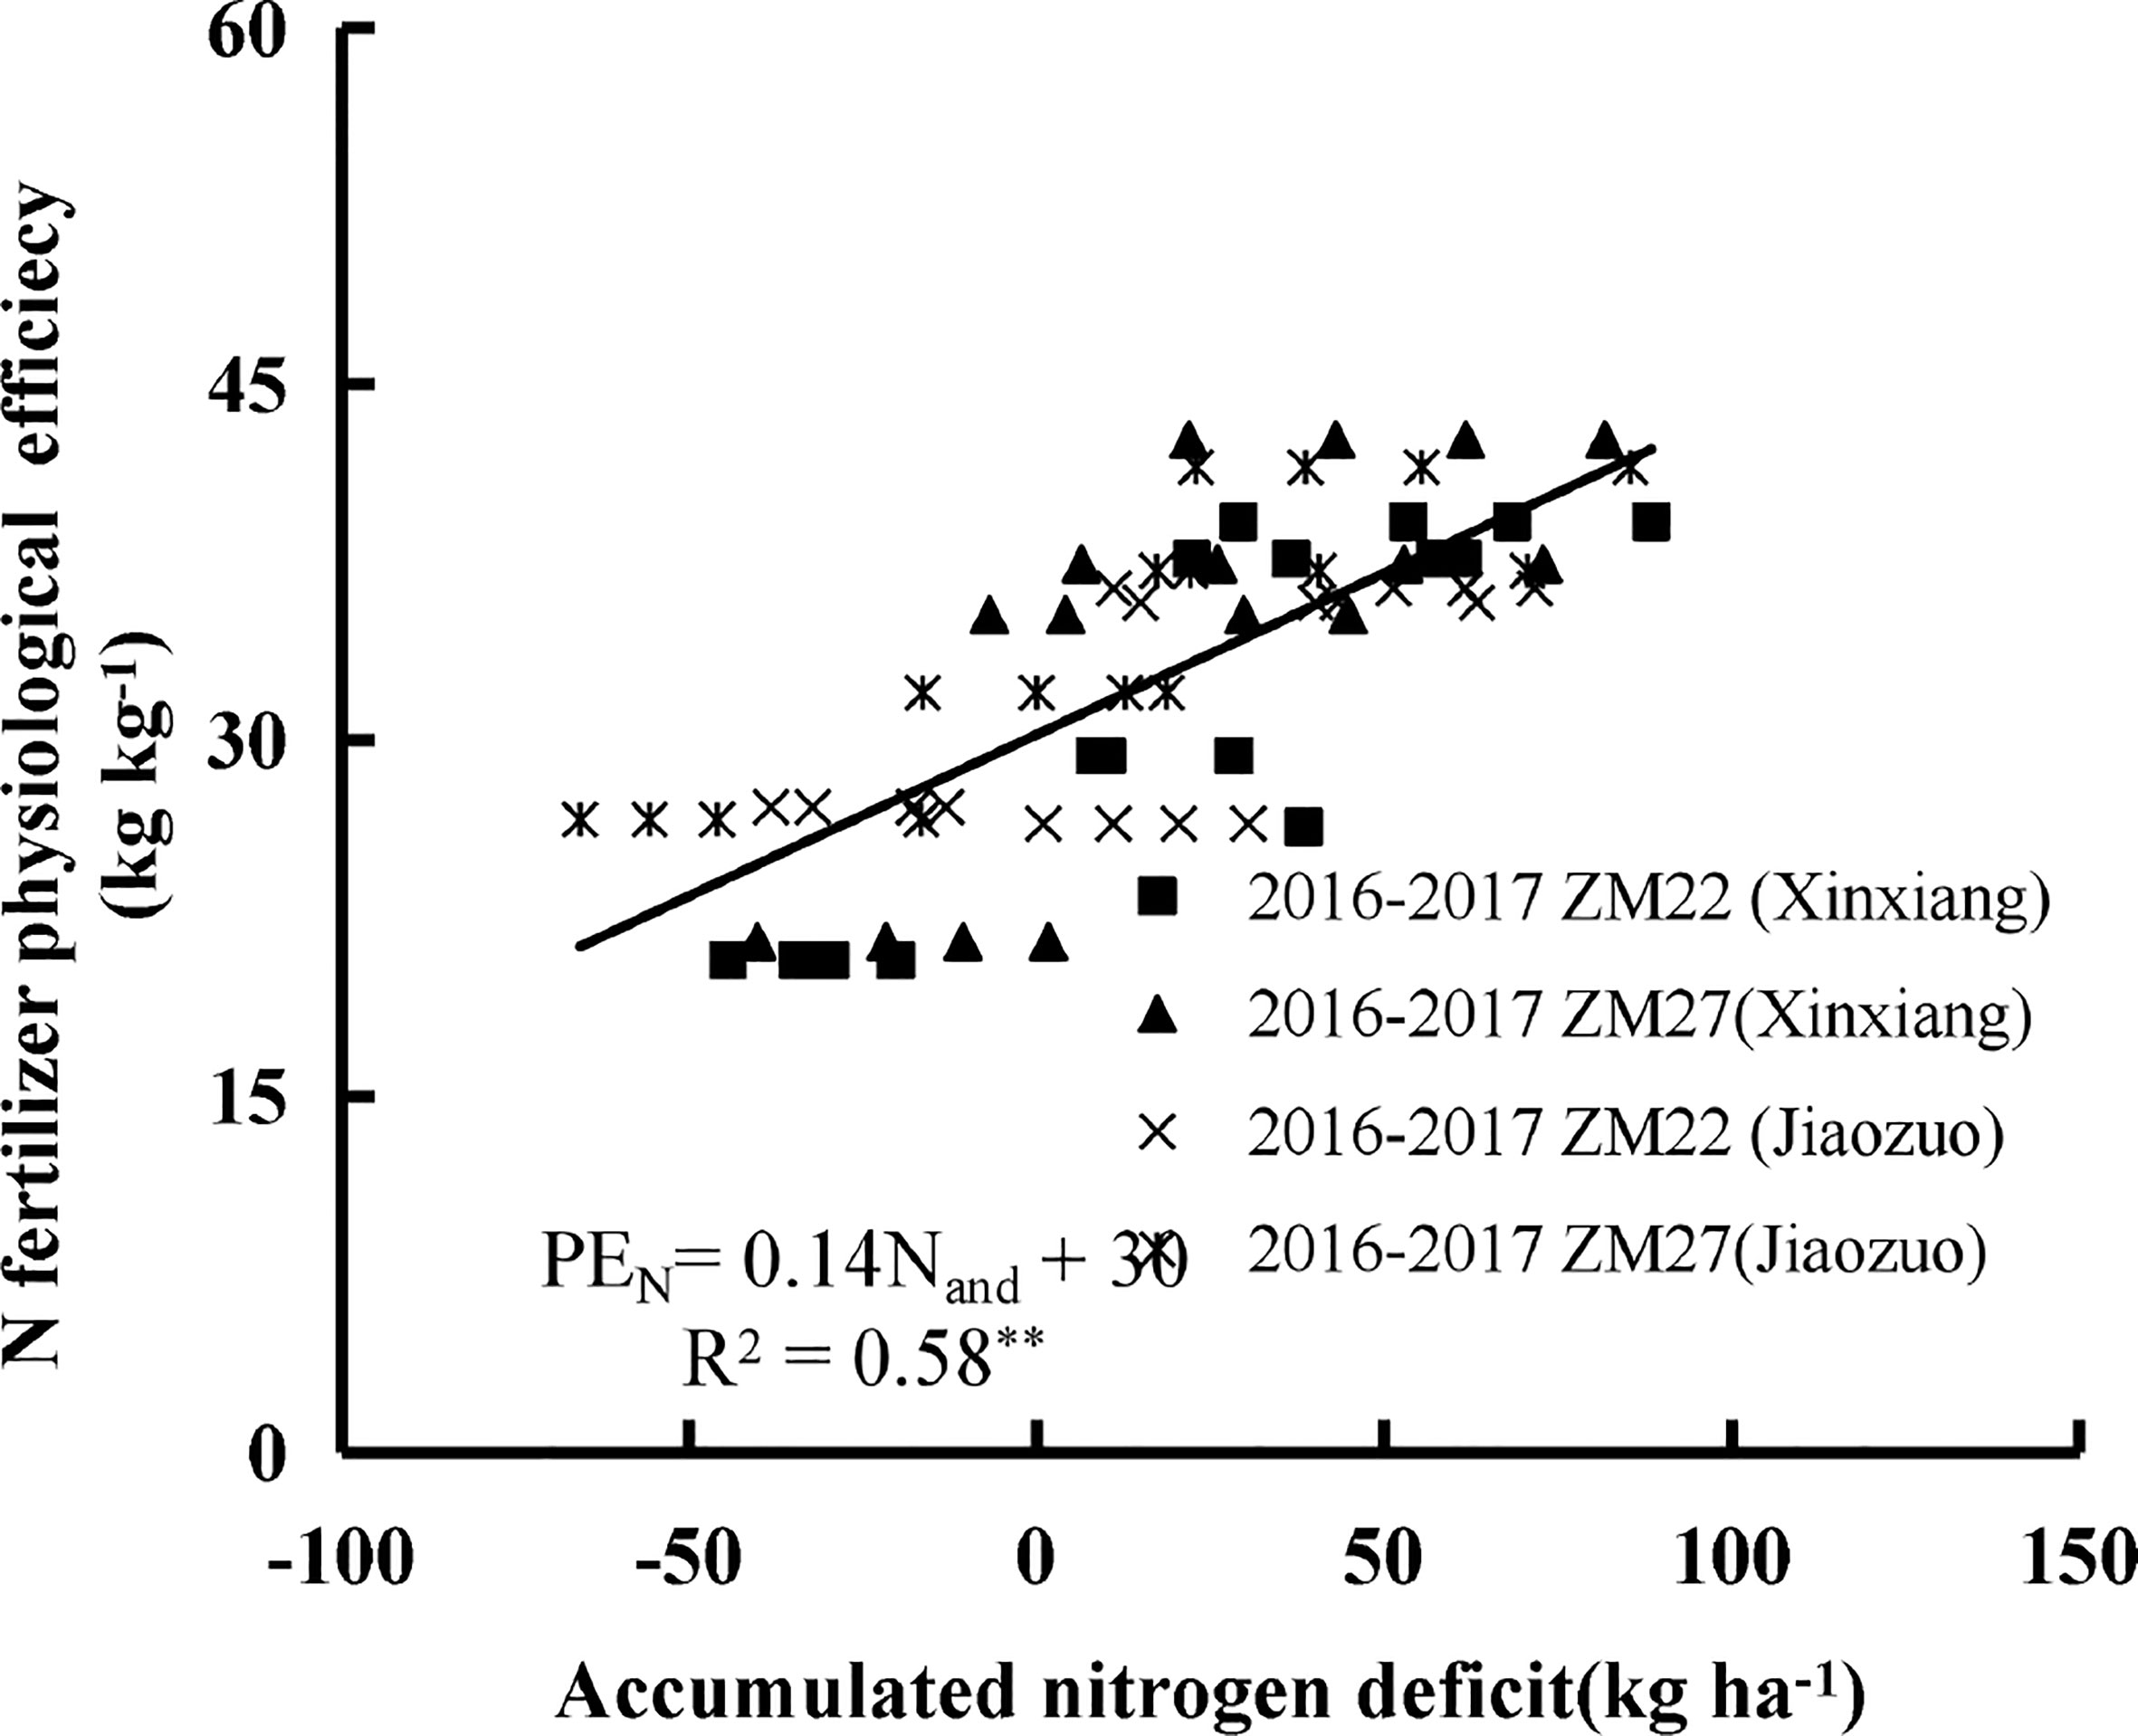
Figure 6 The relationship between accumulated N deficit and N fertilizer physiological efficiency of winter wheat from 2016 to 2017 at Xinxiang and Jiaozuo. The symbol **indicates that the p-value is<0.01.
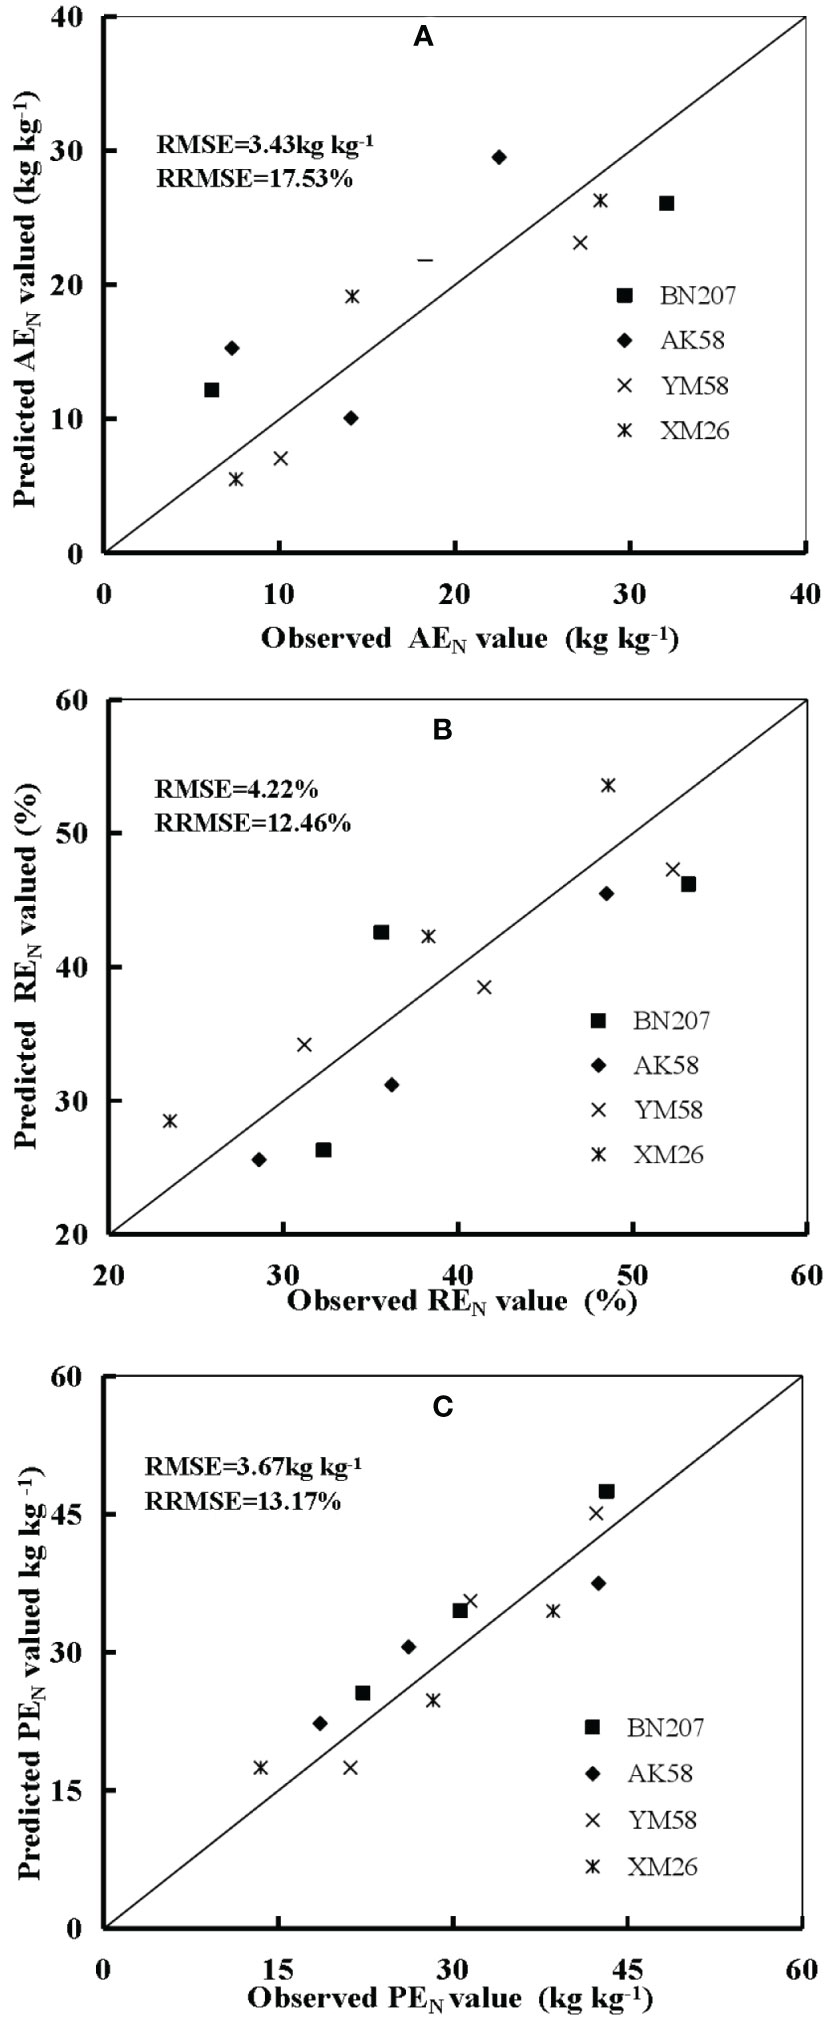
Figure 7 Comparison of the observed and predicted difference of AEN (A), REN (B), and PEN (C) values from 2016 to 2017 at Xinxiang and Jiaozuo.
4 Discussions
4.1 Effect of nitrogen rate on the growth of winter wheat
The nitrogen fertilizer application rate affects PNC during the growth period of winter wheat. PNC generally increases with increasing N application rates. Plants can accumulate excessive N nutrition in their organs (leaf and stem). A significant increase in plant dry matter accumulation and leaf area expansion with an increase in PNC under N-limiting conditions has been previously reported; however, excessive N application beyond the threshold level (non-limiting N conditions) poses negative impacts on plant growth (Yao et al., 2014; Zhao et al., 2014). Additionally, when soil N level is high, the result shows little increase in PNC or yield as N fertilizer increases in some studies (Feng et al., 2008). This might be because plants tend to absorb soil N, not fertilizer N (Grant et al., 1999; Lafond et al., 2008).
The increase in grain yield from N0 to N225 treatment in this study indicated that the winter wheat plant has very high N requirements (Table 2). However, the effect of N fertilizer on yield changes with site and year. An obvious change in yield under different soil types, climates, and cultivars in south Asia has been previously reported (Ladha et al., 2003). The change in winter wheat yield was mainly attributed to the change in yield components (the number of spikes per plant and grain weight per plant), and there was a significant effect of N application on the formation of yield components in winter wheat (Zhao et al., 2020). Excessive N application does not always warrant higher grain yield but decreases N use efficiency and poses negative impacts on the environment due to environmental loss of applied N up to ∼180 kg ha−1 yr−1 (Vitousek et al., 2009). The recommended N application rates of 120–170 kg N ha−1 to balance grain yield, NUE, and N loss in the North China Plain have been previously reported (Cui et al., 2009; Ma et al., 2019).
The effect of N application rates was more obvious on grain protein yield than grain protein content, which was attributed to the impacts of N fertilizer on grain yield and protein content. The grain protein content increased irrespective of N supply conditions; however, the increase in grain protein content was minor under N non-limiting treatments (Zhao et al., 2020). The non-significant effect of N fertilizer on TGW agreed with previous reports (Yan et al., 2019).
4.2 Effect of N application on accumulated nitrogen deficit, agronomic nitrogen use efficiency and its components, and their relationships
The variability in Nand with N rates and crop growth stages in this study was in consensus with a study on rice (Ata-Ul-Karim et al., 2013). Nand is a suitable index for in-season crop N deficit monitoring and can potentially be used to quantify the amount of supplemental N fertilization scheduled during crop growth. Nand has advantages over other indices such as PNC (Guillard et al., 2021), DM (Zhu et al., 2003), and chlorophyll concentration (Li et al., 2019) as it contains more information on crop growth conditions by integrating PNC with plant dry matter while diagnosing plant N status (Lemaire et al., 2008; Ziadi et al., 2008; Ata-Ul-Karim et al., 2017a).
Accumulated N deficit can be exploited for in-season estimation of crop N status and to fine-tune the supplemental N scheduling during the growth period as it is crop-specific, precise, and theoretically sound in relation to actual crop growth (Ata-Ul-Karim et al., 2017b). Being based on the N dilution theory, Nand is not only theoretically sound but also relevant agronomically as an N diagnostic tool to quantify the in-season crop N status. Results indicated that the winter wheat plant invested a higher proportion of dry matter in the stem (low organ N concentration) after Feekes stage 6 as compared to the leaf (high organ N concentration) to ensure optimal plant height and capture more light. Additionally, the decline in the N concentration of shaded leaves per unit leaf area contributes to optimizing plant N allocation in relation to light distribution for improving canopy photosynthesis (Lemaire et al., 2008).
The lower variability of AEN and its components across cultivars and sites might be due to similar climatic conditions and management practices at both sites (Figure 1). The decrease in AEN under N non-limiting treatments indicated that higher N fertilizer losses occurred under higher N application rate treatments. The variability of AEN and PEN between cultivars in this study was in consensus with inter- and intra-specific genetic variability for N fertilizer use among crop cultivars and species (Wu et al., 2006; Salim and Raza, 2020). The higher values of AEN and PEN of ZM27 indicated that a higher amount of grain yield was produced per unit of N fertilizer applied as compared to ZM22. Both cultivars showed non-significant differences in REN, which indicates that AEN and PEN were mainly affected by the characteristics of the cultivars rather than REN, which might be affected by external environments. Plant N uptake under field conditions is also affected by the high spatial and temporal heterogeneity in soil N availability (Finger et al., 2019). The lower REN at a high level of soil N was due to the lower absorption of fertilizer N by winter wheat plants. The accumulated NO−3-N in the soil poses an obvious effect on the N fertilizer use efficiency as a supplement of soil N has a very high replacement value for N fertilizer (Cassman et al., 2003). The proportion of N applied that is not absorbed by the plant under non-limiting N conditions increases the risk of N leaching due to the movement of applied N to deeper soil layers during the crop growth period (Villar-Mir et al., 2002).
The significantly positive relationships of Nand with AEN, REN, and PEN indicated that Nand can be potentially applied to predict AEN, REN, and PEN during the crop growth period. Nand can also be used for the estimation of crop N requirements, which can be calculated as the difference between critical N accumulation and actual N accumulation (Eq. (2)). Nand has successfully differentiated the N sub-optimal optimal and supra-optimal N growth conditions (Figure 3), and Nand = 0 indicates that N nutrition is optimum, while Nand >0 indicates N deficiency and<0 points out luxury consumption (Ata-Ul-Karim et al., 2013). The relationships between these characteristics can also contribute to a better understanding of N fertilizer management for increasing agronomic N use efficiency. The high yield was the result of better exploitation of N, which is accompanied by lower AEN with the increase in N application. REN describes the recovery efficiency of fertilizer N by the crop from the soil. REN can serve as an important parameter for strategizing precise and quantitative N application technologies. However, it is affected by various factors (soil type, N application, agro-climatic conditions, yield level, and cultivars; Conant et al., 2013). REN was approximately 40% in this study when Nand was equal to 0. A previous study reported that 40% of the REN of winter wheat could be considered a critical value in a high-yield field (Xu, 2010). REN will decrease with the decline of Nand when Nand is lower than 0 due to lower absorption of fertilizer N from the soil by the plant because of excessive N accumulation by the plant. PEN is considered the most important component of AEN, as PEN accounts for more of the variation in AEN than REN (Dordas, 2008). PEN generally remains relatively stable during the crop growth period and is little affected by grain yield. A cultivar with a higher REN should be selected for increasing AEN (Novoa and Loomis, 1981; Raun and Johnson, 1999). Many trade-offs exist between the different components of AEN as they are influenced by several factors.
5 Conclusions
Accumulated N deficits under different N rates demonstrated significant variation across sites, growth stages, and cultivars. Nand well distinguished the plant’s internal N status, which indicated that Nand has the potential to quantify the in-season crop N status of winter wheat. Nand was positively correlated with AEN and its components. The validation results demonstrated that the newly developed models can accurately predict in-season AEN and its components. The findings would assist in improving in-season N use efficiency by fine-tuning N scheduling decisions in winter wheat cultivation in intensive wheat cropping systems in China. However, more independent experiments under different agro-climatic conditions, crop management practices, and crop species are required to test the wide-scale applicability of Nand for in-season assessment of crop N status and N use efficiencies.
Data availability statement
The original contributions presented in the study are included in the article/Supplementary Material. Further inquiries can be directed to the corresponding authors.
Author contributions
BZ, LW, and SA conceived the idea and led the study design. BL and XM carried out the experiments, performed the analysis, and wrote the manuscript. BZ, LW, and SA reviewed and edited the manuscript. All authors listed have made a substantial, direct, and intellectual contribution to the work and approved it for publication.
Funding
This study was supported by the Science and Technology Project of Xinxiang city (GG2021024).
Conflict of interest
The authors declare that the research was conducted in the absence of any commercial or financial relationships that could be construed as a potential conflict of interest.
Publisher’s note
All claims expressed in this article are solely those of the authors and do not necessarily represent those of their affiliated organizations, or those of the publisher, the editors and the reviewers. Any product that may be evaluated in this article, or claim that may be made by its manufacturer, is not guaranteed or endorsed by the publisher.
Supplementary material
The Supplementary Material for this article can be found online at: https://www.frontiersin.org/articles/10.3389/fpls.2023.1128799/full#supplementary-material
References
Ata-Ul-Karim, S. T., Liu, X., Lu, Z., Yuan, Z., Zhu, Y., Cao, W. (2016). In-season estimation of rice grain yield using critical nitrogen dilution curve. Field Crops Res. 195, 1–8. doi: 10.1016/j.fcr.2016.04.027
Ata-Ul-Karim, S. T., Yao, X., Liu, X. J., Cao, W. X., Zhu, Y. (2013). Development of critical nitrogen dilution curve of japonica rice in Yangtze river reaches. Field Crops Res. 149, 149–158. doi: 10.1016/j.fcr.2013.03.012
Ata-Ul-Karim, S. T., Zhu, Y., Cao, Q., Rehmani, M. I. A., Cao, W. X., Tang, L. (2017a). In-season assessment of grain protein and amylose content in rice using critical nitrogen dilution curve. Eur. J. Agron. 90, 139–151. doi: 10.1016/j.eja.2017.08.001
Ata-Ul-Karim, S. T., Zhu, Y., Lu, X. J., Cao, Q., Tian, Y. C., Cao, W. (2017b). Estimation of nitrogen fertilizer requirement for rice crop using critical nitrogen dilution curve. Field Crops Res. 201, 32–40. doi: 10.1016/j.fcr.2016.10
Bremner, J. M., Mulvancy, C. S. (1982). “Nitrogen-total,” in Methods of soil analysis. Ed. Page, A. L. (Madison, WI: American Society of Agronomy), 595–624.
Cantarella, H., Otto, R., Soares, J. R., de Brito Silva, A. G. (2018). Agronomic efficiency of NBPT as a urease inhibitor: A review. J. Adv. Res. 13, 19–27. doi: 10.1016/j.jare.2018.05.008
Cassman, K. G., Dobermann, A., Walters, D. T. (2003). Agroecosystems, nitrogen-use efficiency, and nitrogen management. Ambio 31, 132–140. doi: 10.1579/0044-7447-31.2.132
Conant, R. T., Berdanier, A. B., Grace, P. R. (2013). Patterns and trends in nitrogen use and nitrogen recovery efficiency in world agriculture. Global Biogeochem. Cycles 27, 558–566. doi: 10.1016/j.envint.2020.105989
Cui, Z., Zhang, F., Dou, Z., Miao, Y., Sun, Q., Cheng, X. (2009). Regional evaluation of critical nitrogen concentrations in winter wheat production of the north China plain. Agron. J. 101, 159–166. doi: 10.2134/agronj2008.0102
Devienne-Barret, F., Justes, E., Machet, J. M., Mary, B. (2000). Integrated control of nitrate uptake by crop growth rate and soil nitrate availability under field conditions. Ann. Bot. 86, 995–1005. doi: 10.1006/anbo.2000.1264
Ding, W. C., Xu, X. P., He, P., Ullah, S., Zhang, J. J., Cui, Z. L., et al. (2018). Improving yield and nitrogen use efficiency through alternative fertilization options for rice in China: A meta-analysis. Field Crops Res. 227, 11–18. doi: 10.1016/j.fcr.2018.08.001
Dordas, C. A. (2008). Nitrogen nutrition index and its relationship to n use efficiency in linseed. Eur. J. Agron. 34, 124–132. doi: 10.1016/j.eja.2010.11.005
Feng, W., Yao, X., Zhu, Y., Tian, Y. C., Cao, W. X. (2008). Monitoring leaf nitrogen status with hyperspectral reflectance in wheat. Eur. J. Agron. 28, 394–404. doi: 10.1016/j.eja.2007.11.005
Finger, R., Swinton, S. M., El Benni, N., Walter, A. (2019). Precision farming at the nexus of agricultural production and the environment. Ann. Rev. Resour. Econ. 11 (1), 313–335. doi: 10.1146/annurev-resource-100518-093929
Grant, C. A., Dribnenki, J. C. P., Bailey, L. D. (1999). A comparison of the yield response of solin (cv. linola 947) and flax (cvs. McGregor and vimy) to application of nitrogen, phosphorus, and provide (Penicillium bilaji). Can. J. Plant Sci. 79, 527–533. doi: 10.4141/P98-085
Guillard, K., Miele, K. M., Surer, I., Morris, T. F. (2021). Guiding fall fertilization of cool-season turfgrass lawns with verdure tissue-n tests. Crop Sci. 61, 2090–2112. doi: 10.1002/csc2.20406
Halvorson, A. D., Schweissing, F. C., Bartolo, M. E., Reule, C. A. (2005). Corn response to nitrogen fertilization in a soil with high residual nitrogen. Agron. J. 97, 1222–1229. doi: 10.2134/agronj2004.0279
Ladha, J. K., Dawe, D., Pathak, H., Padre, A. T., Yadav, R. L., Singh, B., et al (2003). How extensive are yield declines in long-term rice–wheat experiments in Asia? Field Crops Res 81 (2-3), 159–180.
Lafond, G. P., Irvine, B., Johnston, A. M., May, W. E., Mcandrew, D. W., Shirtliffe, S. J., et al. (2008). Impact of agronomic factors on seed yield formation and quality in flax. Can. J. Plant Sci. 88, 485–500. doi: 10.4141/CJPS07112
Lemaire, G., Jeuffroy, M. H., Gastal, F. (2008). Diagnosis tool for plant and crop n status in vegetative stage theory and practices for crop n management. Eur. J. Agron. 28, 614–624. doi: 10.1016/j.eja.2008.01.005
Li, R., Chen, J., Qin, Y., Fan, M. (2019). Possibility of using a SPAD chlorophyll meter to establish a normalized threshold index of nitrogen status in different potato cultivars. J. Plant Nutr. 42, 834–841. doi: 10.1080/01904167.2019.1584215
Ma, G., Liu, W., Li, S., Zhang, P., Wang, C., Lu, H., et al. (2019). Determining the optimal n input to improve grain yield and quality in winter wheat with reduced apparent n loss in the north China plain. Front. Plant Sci. 10. doi: 10.3389/fpls.2019.00181
Raun, W. R., Johnson, G. V. (1999). Improving nitrogen use efficiency for cereal production. Agron. J. 91, 357–363. doi: 10.2134/agronj1999.00021962009100030001x
Rutting, T., Aronsson, H., Delin, S. (2018). Efficient use of nitrogen in agriculture. Nutr. Cycl. Agroecosyst. 110, 1–5. doi: 10.1007/s10705-017-9900-8
Sadras, V.O., Denison, R.F. (2016). Neither crop genetics nor crop management can be optimised. Field Crops Res. 189, 75–83.
Salim, N., Raza, A. (2020). Nutrient use efficiency (NUE) for sustainable wheat production: A review. J. Plant Nutr. 43, 297–315. doi: 10.1080/01904167.2019.1676907
Villar-Mir, J. M., Villar-Mir, P., Stockle, C. O., Ferrer, F., Aran, M. (2002). On farm monitoring of soil nitrate nitrogen in irrigated cornfields in the ebro valley (northeast spain). Agron. J. 94, 373–380. doi: 10.2134/agronj2002.3730
Vitousek, P. M., Naylor, R., Crews, T., David, M. B., Drinkwater, L. E., Holland, E., et al. (2009). Nutrient imbalances in agricultural development. Science 324, 1519–1520. doi: 10.1126/science.1170261
Wang, Y., Lu, Y. (2020). Evaluating the potential health and economic effects of nitrogen fertilizer application in grain production systems of China. J. Clean. Prod. 264, 121635. doi: 10.1016/j.jclepro.2020.121635
Wu, X. Q., Xu, Y. C., Shen, Q. R., Guo, S. W. (2006). Ammonia volatilization from shoots of different rice genotypes with different nitrogen use efficiency after flowering. Chin. J. Rice Sci. 20, 429–433.
Xu, K. (2010). Study on precise and quantitative nitrogen rate and its application in wheat (Yangzhou: Yangzhou University).
Yan, S., Wu, Y., Fan, J., Zhang, F., Qiang, S., Zheng, J., et al. (2019). Effects of water and fertilizer management on grain filling characteristics, grain weight and productivity of drip-fertigated winter wheat. Agric. Water Manage. 213, 983–995. doi: 10.1016/j.agwat.2018.12.019
Yao, X., Zhao, B., Tian, Y. C., Liu, X. J., Ni, J., Cao, W. X., et al. (2014). Using leaf dry matter to quantify the critical nitrogen dilution curve for winter wheat cultivated in eastern China. Field Crop Res. 149, 149–158. doi: 10.1016/j.fcr.2013.12.007
Yue, S. C., Meng, Q. F., Zhao, R. F., Li, F., Chen, X. P., Zhang, F. S., et al. (2012). Critical nitrogen dilution curve for optimizing nitrogen management of winter wheat production in the north China plain. Agron. J. 104, 523–529. doi: 10.2134/agronj2011.0258
Zha, H., Miao, Y., Wang, T., Li, Y., Zhang, J., Sun, W., et al. (2020). Improving unmanned aerial vehicle remote sensing-based rice nitrogen nutrition index prediction with machine learning. Remote Sens. 12, 215. doi: 10.3390/rs12020215
Zhai, L., Xu, P., Zhang, Z., Wei, B., Jia, X., Zhang, L. (2019). Improvements in grain yield and nitrogen use efficiency of summer maize by optimizing tillage practice and nitrogen application rate. Agron. J. 111, 666–676. doi: 10.2134/agronj2018.05.0347
Zhang, X., Davidson, E. A., Mauzerall, D. L., Searchinger, T. D., Dumas, P., Shen, Y. (2015). Managing nitrogen for sustainable development. Nature 528 (7580), 51–59. doi: 10.1038/nature15743
Zhang, F. S., Wang, J. Q., Zhang, W. F., Cui, Z. L., Ma, W. Q., Chen, X. P., et al. (2008). Nutrient use efficiencies of major cereal crops in China and measures for improvement. Acta Pedol. Sin. 45, 915–924. doi: 10.3321/j.issn:0564-3929.2008.05.018
Zhao, B., Ata-Ul-Karim, S. T., Lemaire, G., Duan, A., Liu, Z., Guo, Y., et al. (2021). Exploring the nitrogen source-sink ratio to quantify ear nitrogen accumulation in maize and wheat using critical nitrogen dilution curve. Field Crops Res. 274, 108332. doi: 10.1016/j.eja.2019.125967
Zhao, B., Liu, Z., Ata-Ul-Karim, S. T., Xiao, J., Liu, Z., Qi, A., et al. (2016). Rapid and nondestructive estimation of the nitrogen nutrition index in winter barley using chlorophyll measurements. Field Crops Res. 185, 59–68. doi: 10.1016/j.fcr.2015.10.021
Zhao, B., Niu, X., Ata-Ul-Karim, S. T., Wang, L., Duan, A., Liu, Z., et al. (2020). Determination of the post-anthesis nitrogen status using ear critical nitrogen dilution curve and its implications for nitrogen management in maize and wheat. Eur. J. Agron. 113, 125967. doi: 10.1016/j.eja.2019.125967
Zhao, B., Yao, X., Tian, Y. C., Liu, X. J., Ata-UI-Karim, S. T., Ni, J., et al. (2014). New critical nitrogen curve based on leaf area index for winter wheat. Agron. J. 106, 379–389. doi: 10.2134/agronj2013.0213
Zhao, B., Ata-Ul-Karim, S. T., Duan, A., Gao, Y., Lou, H., Liu, Z., et al. (2022). Estimating the impacts of plant internal nitrogen deficit at key top dressing stages on corn productivity and intercepted photosynthetic active radiation. Front. Plant Sci. 13, 864258. doi: 10.3389/fpls.2022.864258
Zheng, B., Zhang, X., Wang, Q., Li, W., Huang, M., Zhou, Q., et al. (2021). Increasing plant density improves grain yield, protein quality and nitrogen agronomic efficiency of soft wheat cultivars with reduced nitrogen rate. Field Crops Res. 267, 108145. doi: 10.1016/j.fcr.2021.108145
Zhu, Y., Cao, W. X., Zhou, Z. G., Tian, Y. C. (2003). A knowledge model for suitable dynamic growth indices in winter wheat. Sci. Agric. Sin. 37, 43–50. doi: 10.3864/j.issn.0578-1752.040107
Keywords: accumulated nitrogen deficit, nitrogen diagnosis, nitrogen fertilizer scheduling, plant nitrogen concentration, winter wheat
Citation: Li B, Ma X, Zhao B, Wang L and Ata-Ul-Karim ST (2023) In-season assessment of agronomic nitrogen use efficiency and its components in winter wheat using critical nitrogen dilution curve. Front. Plant Sci. 14:1128799. doi: 10.3389/fpls.2023.1128799
Received: 21 December 2022; Accepted: 20 February 2023;
Published: 15 March 2023.
Edited by:
Xiaorong Fan, Nanjing Agricultural University, ChinaReviewed by:
Yanhua Zeng, Jiangxi Agricultural University, ChinaLawrence Aula, University of Nebraska-Lincoln, United States
Copyright © 2023 Li, Ma, Zhao, Wang and Ata-Ul-Karim. This is an open-access article distributed under the terms of the Creative Commons Attribution License (CC BY). The use, distribution or reproduction in other forums is permitted, provided the original author(s) and the copyright owner(s) are credited and that the original publication in this journal is cited, in accordance with accepted academic practice. No use, distribution or reproduction is permitted which does not comply with these terms.
*Correspondence: Laigang Wang, wanglaigang@hnagri.org.cn; Syed Tahir Ata-Ul-Karim, ataulkarim@g.ecc.u-tokyo.ac.jp