 Yonghui Pan1†
 Yiwen Cao
 Xusheng Meng
 Min Wang
 Shiwei Guo
- 1Jiangsu Provincial Key Lab for Organic Solid Waste Utilization, National Engineering Research Center for Organic-based Fertilizers, Jiangsu Collaborative Innovation Center for Solid Organic Waste Resource Utilization, Nanjing Agricultural University, Nanjing, Jiangsu, China
- 2Center of Agricultural Green Development Promotion, Fuyang, Anhui, China
Enhancing photosynthetic capacity is widely accepted as critical to advancing crop yield. Therefore, identifying photosynthetic parameters positively related to biomass accumulation in elite cultivars is the major focus of current rice research. In this work, we assessed leaf photosynthetic performance, canopy photosynthesis, and yield attributes of super hybrid rice cultivars Y-liangyou 3218 (YLY3218) and Y-liangyou 5867 (YLY5867) at tillering stage and flowering stage, using inbred super rice cultivars Zhendao11(ZD11) and Nanjing 9108 (NJ9108) as control. A diurnal canopy photosynthesis model was applied to estimate the influence of key environmental factors, canopy attributes, and canopy nitrogen status on daily aboveground biomass increment (AMDAY). Results showed that primarily the light-saturated photosynthetic rate at tillering stage contributed to the advancing yield and biomass of super hybrid rice in comparison to inbred super rice, and the light-saturated photosynthetic rate between them was similar at flowering stage. At tillering stage, the higher CO2 diffusion capacity, together with higher biochemical capacity (i.e., maximum carboxylation rate of Rubisco, maximum electron transport rate (Jmax), and triose phosphate utilization rate) favored leaf photosynthesis of super hybrid rice. Similarly, AMDAY in super hybrid rice was higher than inbred super rice at tillering stage, and comparable at flowering stage partially due to increased canopy nitrogen concentration (SLNave) of inbred super rice. At tillering stage, model simulation revealed that replacement of Jmax and gm in inbred super rice by super hybrid rice always had a positive effect on AMDAY, and the averaged AMDAY increment was 5.7% and 3.4%, respectively. Simultaneously, the 20% enhancement of total canopy nitrogen concentration through the improvement of SLNave (TNC-SLNave) resulted in the highest AMDAY across cultivars, with an average increase of 11.2%. In conclusion, the advancing yield performance of YLY3218 and YLY5867 was due to the higher Jmax and gm at tillering stage, and TCN-SLNave is a promising target for future super rice breeding programs.
1 Introduction
Rice (Oryza sativa L.), one of the most important food crops in the world, provides 35–60% of calories for about 3 billion people. It has been estimated that the global population will increase to nearly 10 billion by 2050, requiring a 70% -100% increase in the yield of major food crops (Tilman et al., 2011; Tilman and Clark, 2015). However, the year-on-year increase in the yield of rice in many parts of the world has plateaued, while the potential for expanding arable land is limited (Simkin et al., 2019). Clearly, it becomes an urgent task to improve rice yield potential per harvested area, while improving leaf photosynthetic efficiency is regarded as a vital approach (Zhu et al., 2010; Faralli and Lawson, 2020). Some strategies have been proposed for improving leaf photosynthesis, such as engineering more efficient ribulose-1,5-bisphosphate carboxylase/oxygenase (Rubisco) (Whitney and Sharwood, 2008), increasing the recovery rate of photosystem II from the photo-protected state (Zhu et al., 2004), introducing the CO2 concentration mechanism into crops (Price et al., 2008), facilitating synchronous stomatal conductance response with mesophyll demands for CO2 (Mcausland et al., 2016). However, these manipulations would require research efforts of decades as stated by Long et al. (2016). Recently, Yoon et al. (2020) provided evidence that an engineered increase in Rubisco production increased rice yield and nitrogen use efficiency for biomass production under field experiments, which is a promising start and could translate into other genotypes and environments in the future.
Considering complicated constraints of engineering, natural variation in the photosynthetic capacity of rice cultivars can be explored by identifying superior cultivars and traits and integrating them into breeding projects for enhancement of rice yield potential, which is the most efficient approach in short term (< 5 years) as indicated by Parry et al. (2011). However, improvement in leaf-level photosynthesis did not necessarily increase plant biomass or crop yield. Driever et al. (2014) found natural variations in photosynthetic capacity by testing 64 wheat cultivars, while no significant relationship between photosynthetic capacity at the leaf level and yield was found. As pointed out by Yin and Struik (2015), these analyses focused primarily on potential maximum conversion efficiency, with little quantitative allowance for the case of light saturation of photosynthesis (Asat). More importantly, they paid little attention to the scaling up of the evaluation at the leaf level into quantitative information at the canopy level in space. Leaf photosynthesis is determined by CO2 diffusion capacity including stomatal conductance (gs) and mesophyll conductance (gm) and biochemical factors (maximum Rubisco carboxylation rate, Vcmax; maximum electron transport rate, Jmax) (Flexas et al., 2008; Flexas et al., 2012). While canopy photosynthesis is more related to crop yield, which is determined by canopy structure, canopy nitrogen distribution, leaf-level photosynthesis, and its interaction with environment parameters (solar radiation, air temperature, vapour pressure deficit, and atmospheric CO2 concentration) (Yin and Struik, 2015; Peng, 2000). A concise procedure for scaling up from instantaneous leaf assimilation to daily canopy photosynthesis (Acan,day) and then subsequently to total biomass production over a crop cycle is critical for selecting crop varieties with higher canopy photosynthesis and thereby the substantial crop yield. While the measurement of canopy photosynthesis directly is difficult, this can be addressed by running numerical simulations using canopy photosynthesis models instead.
So far, many canopy photosynthesis models have been developed. The big leaf model (Running and Coughlan, 1988; Sellers et al., 1992), sunlit-shaded model (Gu et al., 2014; Wu et al., 2018), multi-layer model (Amthor, 1994; De Pury and Farquhar, 1997), 3D canopy architecture model (Song et al., 2013; Shi et al., 2019) were used to simulate canopy light distribution with different levels of complexity and accuracy. For rice, a 3D canopy architecture model (Song et al., 2013; Shi et al., 2019) was used to estimate canopy photosynthesis, which focused on the impacts of manipulation of canopy structure (stem height, leaf width, leaf angle) on canopy CO2 assimilation. However, leaf photosynthesis was simulated via light response curves rather than photosynthetic mechanistic models and they ignored environment fluctuations (atmosphere CO2 concentration, vapour pressure deficit, air temperature). Gu et al. (2014) used the mechanistic model connected with GECROS to analyze photosynthetic manipulations on rice biomass production based on quantitative trait loci related to different photosynthetic parameters. This was inspiring because with the rapid advances of plant genomics research, the modeling work could potentially help guide progress in photosynthetic enhancement for field crop improvement through crop breeding, engineering, and also precision agriculture. The daily canopy photosynthesis-stomatal conductance model (DCaPS) developed by Wu et al. (2018) was a standalone diurnal canopy photosynthesis simulator, which upscaled the biochemical models of photosynthesis to a canopy level for simulating canopy CO2 assimilation of crop over a day. It incorporated the influences of total canopy nitrogen concentration (TCN), canopy leaf area index (LAIcan), average canopy nitrogen concentration per unit area (SLNave), canopy photosynthetic nitrogen extinction coefficient (KN), Vcmax, Jmax, and gm on canopy photosynthesis. In this sense, this model adopted in rice research will help identification of efficient approaches to improve rice canopy photosynthesis and grain yield.
Since 1996, the establishment of the “super rice” mega-project had constantly achieved leaps in the yield potential of rice in China. Up to 2021, 135 “super” rice varieties have been identified by the Ministry of Agriculture (http://www.ricedata.cn/), and some cultivars achieved grain yields of more than 12 t ha-1 (Peng et al., 2008). To date, the comparison in the grain yield was primarily conducted among the super hybrid, inbred, and ordinary hybrid rice to clarify the yield advantage of “super” rice (Zhang et al., 2015; Liu et al., 2018; Li et al., 2019). However, some studies show that there are substantial variations in grain yield (Chen et al., 2014), rice architectures (Zhang et al., 2014), leaf photosynthetic properties (Wei et al., 2018), and nutrient utilization (Ahmed Jewel et al., 2019) among the super high yielding varieties. In this context, to break the yield ceiling of rice production, it was essential to establish the mechanism underlying the yield advantage and photosynthetic capacity in super hybrid rice and inbred super rice. Our previous study found that Yliangyou 3218 (YLY 3218) achieved a high yield due to its improved radiation use efficiency (Pan et al., 2020). Therefore, a comparison in the yield performance and leaf-level photosynthesis was performed between two super hybrid rice Y-liangyou 3218 (YLY3218) and Y-liangyou 5867 (YLY5867), and two inbred super rice Zhendao11 (ZD11) and Nanjing9108 (NJ9108) at two growth stages (tiller stage and flowering stage) in the present study. Then simulated daily aboveground biomass increment (AMDAY) via DCaPS. Furthermore, based on the canopy photosynthetic model, we adopted single factor enhancement or substitution analysis method. These systematic analyses would enable us to identify differences in crop biomass production patterns and leaf photosynthesis, and the key factors affecting canopy photosynthetic rate at different growth stages.
2 Materials and methods
2.1 Plant material and growth conditions
The field experiment was conducted in Rugao County, Jiangsu Province, China (32°26′24″N, 120° 29′24″E). The upper soil (0-20 cm) chemical properties were as follows: pH 7.54, organic matter 20.2 g kg-1, total nitrogen 1.97 g kg-1, Olsen-P 10.8 mg kg-1, NH4OAc-K 92.0 mg kg-1. Two different types of super rice cultivars, namely YLY3218 and YLY5867 as super hybrid rice cultivars and ZD11 and NJ9108 as two inbred super rice cultivars were used in the study. Seeds for the cultivars were sown on seedbeds after germination on May 20th of 2020; uniform seedlings for each cultivar were transplanted on June 20th of 2020 with a hill spacing of 25×13 cm (two plants per hill). The experiment was performed in a randomized block design consisting of three replicates, and the plot area of each treatment was 25 m2. Nitrogen fertilizer (urea) was set as 90 kg nitrogen ha-1 and applied on four dates: 40% as basal fertilizer, 20% at the mid-tillering stage, 20% at the panicle initiation stage, and 20% at the spikelet differentiation stage. Phosphorus (calcium superphosphate, 75 kg P2O5 ha-1) and potassium (potassium chloride, 90 kg K2O ha-1) were supplied with equal amounts for each treatment at the basal and panicle initiation stage, and the proportion of phosphorus or potassium was 50% and 50% at these two stages. Weeds, pests, and diseases were controlled periodically with herbicides, insecticides, and fungicides. The weather data during rice growth period, including the air temperature, precipitation, and photosynthetically active radiation, was recorded by a meteorological station located next to the field (Figure S1).
2.2 Gas exchange and fluorescence measurements
Leaf photosynthetic gas exchange parameters were measured using a portable, open-circuit, infrared gas analysis system (LI-6400XT, LI-COR Inc., Lincoln, NE, USA) equipped with an integrated fluorescence leaf chamber (LI-6400-40) at tillering stage (July 25th, 2020) and flowering stage (September 1st, 2020). At least six newly expanded leaves for each cultivar were selected for simultaneous measurement of gas exchange and chlorophyll fluorescence from 9:00 to 15:00. Steady-state photosynthesis under light-saturating conditions was reached by using a photosynthetic photon flux density of 1500 μmol m-2 s-1. Besides, we set leaf temperature as 35 ± 0.1 °C, reference CO2 concentration as 400 μmol mol−1, air flow rate as 500 μmol s-1, and relative humidity as 55-60%; leaves were acclimated in the leaf chamber for 15-20 min to a steady-state; then the gas exchange parameters such as Asat, gs, and intercellular CO2 concentration (Ci) and steady-state fluorescence yield (Fs) and maximum fluorescence (Fm′) with a light saturating pulse (0.8 s) of approximately 8000 μmol photons m-2 s-1 were recorded.
The effective quantum efficiency of photosystem II (ΦPSII) was quantified as:
The potential electron transport rate (J) was calculated as:
where the PPFD is the photosynthetic photon flux density; α is the leaf absorption and β is the proportion of quanta absorbed by PSII. Values of α and β were determined following the method presented by Yin et al. (2009). Briefly, the leaf photosynthetic light response curve was measured under the condition of 2% oxygen concentration; the light levels were changed to 200, 150, 75, 50, and 30 μmol m-2 s-1. The parameter (ΦPSII × PPFD/4) obtained in curve is linear related to the net photosynthetic rate, whose slope is the product of α and β.
2.3 CO2 response curves
CO2 response curves (A/Ci curves) were measured on leaves which were used for measurements of gas exchange and chlorophyll fluorescence (at least four leaves per cultivar). For each A/Ci curve, leaves were acclimated in the leaf chamber for at least 30 min; then the CO2 concentration decreased stepwise from 400 to 300, 250, 200, 100 and increased from 100 to 400, 450, 500, 550, 650, 800 and 1000 μmol mol-1. Data were recorded when the gas exchange parameters were stabilized at a given CO2 concentration. Chloroplast CO2 concentration (Cc) and gm were calculated as described by Sharkey et al. (2007).
Γ* is the CO2 compensation point in the absence of mitochondrial respiration, which was set as 40.0 μmol m-2 s-1. Rd is the mitochondrial respiration rate in the light. In this study, Rd was determined as the vertical intercept of the fitting line between ΦPSII× PPFD/4 and net photosynthetic rate as mentioned above.
Accordingly, A/Ci curves were transferred to A/Cc curves, which were used for the estimation of Vcmax, Jmax, and triose phosphate utilization rate (TPU).
2.4 Biomass, leaf area index, leaf nitrogen concentration, grain yield, and leaf inclination angle (β)
After measuring the photosynthetic parameters, five plants for each cultivar were randomly sampled. Firstly, plants were separated into the latest fully expanded leaf, other leaves, stem, and root. The newly expanded leaves were digitally scanned (ES-1200C scanner; Epson, Long Beach, CA, USA), and the area was computed by Image J software (National Institutes of Health, Bethesda, MD, USA). LAI was the product of the total leaf area per plot of plant and transplanting density. The samples were then desiccated at 105°C for 30 min and dried at 70°C to constant weight, followed by weighing and milling. For leaf nitrogen content, the milled latest fully expanded leaf samples were digested with H2SO4-H2O2 at 280°C and the nitrogen concentration of each sample was determined with a continuous flow analyzer (AA3; Seal Analytical, Inc., Southampton, UK). The leaf area, biomass, and nitrogen concentration of the top leaves and the other leaves were measured following the method presented above. The SLNave (g m-2) was calculated as:
where the LAo is the area of the top leaves (m2), the LAother is the area of the other leaves (m2), the DMo is the biomass of the top leaves (g), the DMother is the biomass of the other leaves (g), No is the nitrogen content of the top leaves (%) and Nother is the nitrogen content of the other leaves (%).
For both growth stages, the plant canopy analyzer (LAI-2200C, LI-COR Inc., Lincoln, NE, USA) was used to determine the β for each cultivar. Briefly, in each plot, the analyzer was positioned at the top of the canopy to record the incident solar radiation 5 times and then 20-30 times at the bottom of the canopy. The instrument will automatically obtain the β of the canopy.
At the harvest stage, brown grain yield was estimated by a 6 m2 area plants for each plot (super hybrid rice, 16 October; inbred super rice, 28 October) and adjusted to a 14% water content.
2.5 Description of DCaPS
DCaPS developed by Wu et al. (2018) was used for simulating daily canopy CO2 assimilation (from sunrise to sunset) of rice. A schematic diagram of this model is shown in Figure S2, and detailed information about model parameters and equations is provided in Tables S1–S3. Model inputs are composed of environment, canopy architecture, canopy nitrogen status, CO2 diffusion, photosynthetic and temperature response parameters, which is listed in Table S3. Model outputs are diurnal environment variables, diurnal canopy photosynthesis. Environment parameters in the form of hourly values of incident solar radiation, air temperature (Ta, an approximate value for leaf temperature), and air vapour pressure deficit for one day were derived from daily values. The LAIcan was split into sunlit and shade fractions by a single-layer sunlit-shade leaves modeling approach as described by De Pury and Farquhar (1997), and then the amount of photosynthetically active radiation including direct and diffuse solar radiation intercepted by each fraction was determined. Canopy nitrogen distribution (SLNave; nitrogen concentration per unit leaf area at the top of the canopy, SLNtop) was used to estimate daily nitrogen status for sunlit and shaded leaves followed by previous crop model (Hammer et al., 2010). The key photosynthetic parameters (the maximum carboxylation rate of Rubisco at 25°C, Vcmax25; maximum electron transport rate at 25°C, Jmax25; mesophyll conductance at 25°C, gm25) were used to derive the slope of linear relationship between Vcmaxper leaf area at 25°C and nitrogen (χv), and the slope of linear relationship between Jmaxper leaf area at 25°C and nitrogen (χJ). Alternatively, hourly values of CO2 assimilate rate (minimum value of Ac and Aj, Figure S1) of sunlit and shaded leaves were determined after combining with nitrogen status, CO2 diffusion models and temperature adjustment based on photosynthetic parameters following Wu et al. (2018). Finally, Acan,day was determined from integration of CO2 assimilation rate across leaf fractions and time. The AMDAY was calculated as:
where 44 is the molecular weight of CO2, 0.85 represents the dry matter distribution coefficient of the aboveground at tillering stage and flowering stage (dimensionless), and 0.41 was introduced as a conversion factor that accounts for the loss of CO2 assimilation (g biomass g-1 CO2), as described by Sinclair and Horie (1989).
2.6 Simulated scenarios, input variables, and validation simulations
Simulation of daily canopy photosynthesis was conducted for each treatment with its specific input parameters as listed in Table S3. To explore the most efficient target to improve daily canopy photosynthesis, canopy architecture parameters (LAIcan, β), canopy nitrogen status parameters (TNC; SLNave, KN) and photosynthetic parameters (Vcmax, Jmax, and gm) were enhanced by 20% increment of associated model parameters. And the simulation results with adjusted parameters were compared with those of original simulations. The increment of LAIcan or SLNave resulted in TNC. Therefore, in the current simulation, TNC increment was through an improvement in one of these two factors and the other one keeps unchanged. When increasing LAIcan (SLNave) by 20%, alternatively, SLNave (LAIcan) should decrease by 20%, and the ratio of SLNave to SLNtop (SLNratio_top) was also recalculated to ensure TNC and KN were kept constant. For the improvement of KN, Vcamx, Jmax, and gm, KN, slope of linear relationship between Vcmaxper leaf area at 25°C and nitrogen (χv), slope of linear relationship between Jmaxper leaf area at 25°C and nitrogen (χJ) and gm were directly increased by 20% without any other changes.
To verify the factors determining the difference in Acan,DAY between super hybrid rice and inbred super rice, every single parameter of inbred super rice was replaced by that of super hybrid rice, and the rules of parameter adjustment are the same as mentioned above.
2.7 Statistical analysis
Analysis of variance (ANOVA) was used to analyze the data, and the significant difference between cultivars or nitrogen treatments within a cultivar was accessed by the least significant difference (LSD) test (P< 0.05). Simulation of daily canopy photosynthesis was conducted by Visual Studio 2019 (Microsoft Corporation, Redmond, WA, USA) with application of the source code developed by Wu et al. (2018) which is available at https://github.com/QAAFI/DCaPS.git.
3 Results
3.1 Grain yield and biomass
Averaged across the cultivars, grain yield of super hybrid rice was significantly higher than that of the inbred super rice (Figure 1A). The grain yield of super hybrid rice was 10.6 t hm-2 (YLY3218) and 10.3 t hm-2 (YLY5867), respectively, while the inbred super rice had a lower grain yield than YLY3218 by 15.1% (ZD11) and 17.0% (NJ9108). In accordance with the grain yield, the super hybrid rice had a consistently higher amount of biomass than the inbred super rice throughout the tillering stage and flowering stage (Figure 1B).
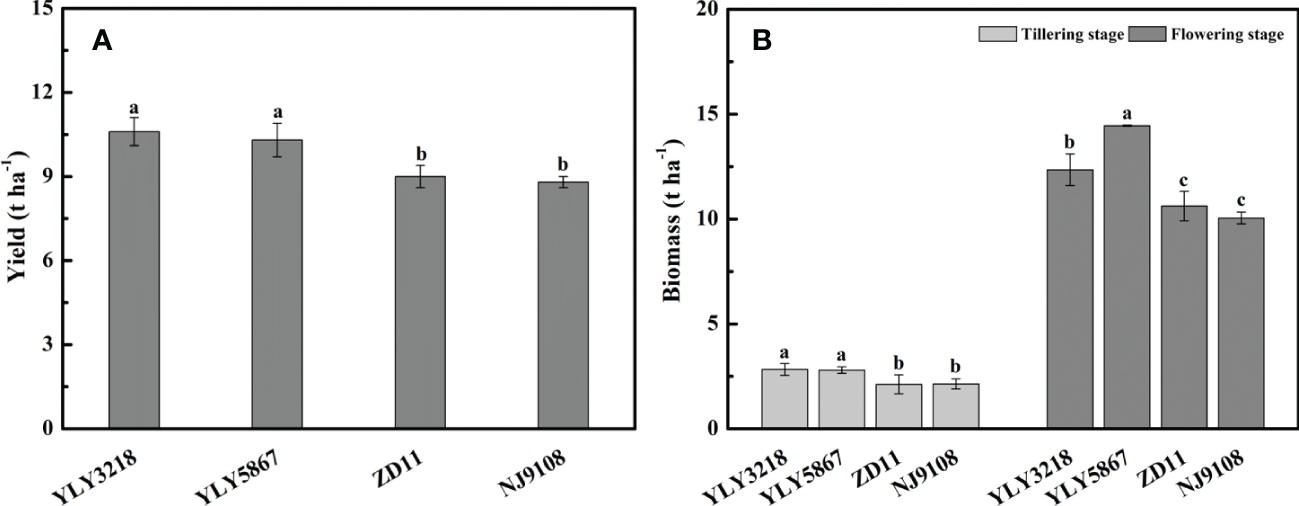
Figure 1 Yield (A) and total biomass (B) of different rice cultivars during tillering and flowering stage. Different letters mean significant differences (P< 0.05) among rice cultivars during the same growth stage.
3.2 Asat, leaf nitrogen content per area, and leaf CO2 diffusion parameters
Asat of YLY3218 was significantly higher than that of inbred super rice (ZD11 and NJ9108) at tillering stage (Figure 2A); whereas it was comparable to ZD11 at flowering stage. Interestingly, there was no consistent difference in SLN at both stages between the super hybrid rice and the inbred super rice (Figure 2B). We further studied the photosynthetic parameters of each cultivar at both stages. Coincidence with the Asat, gs and gm of super hybrid rice were significantly higher than those of inbred super rice at tillering stage; however, those variations associated with cultivars disappeared during flowering stage (Table 1).
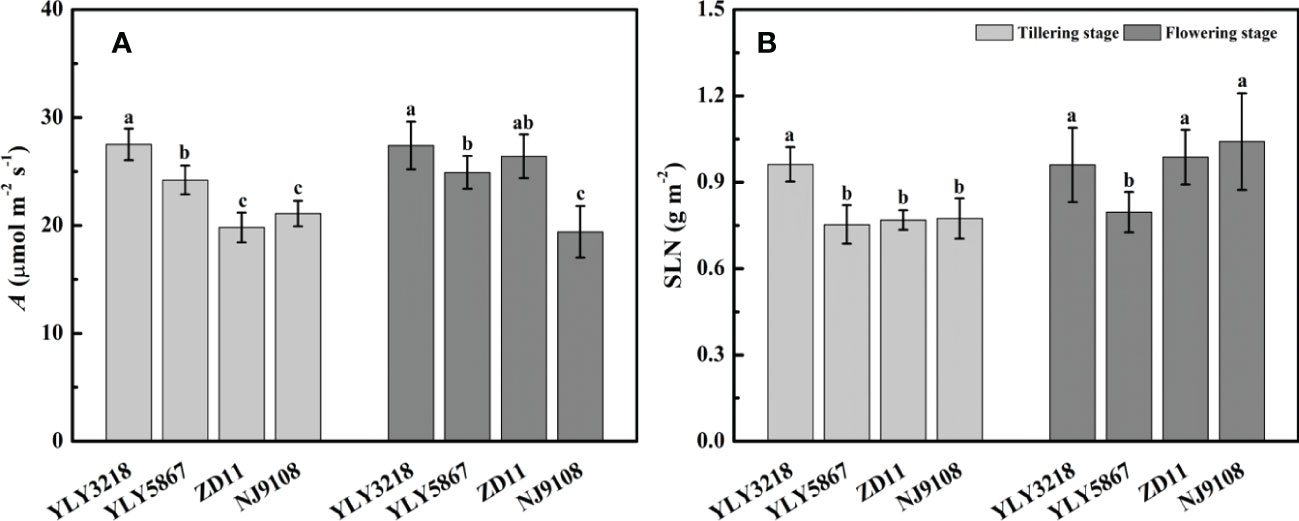
Figure 2 Net photosynthesis rate under saturated irradiance (Asat) (A) and nitrogen concentration per leaf area (SLN) (B) of the latest fully expanded leaves for different rice cultivars during tillering and flowering stage. Different letters mean significant differences (P< 0.05) among rice cultivars during the same growth stage.
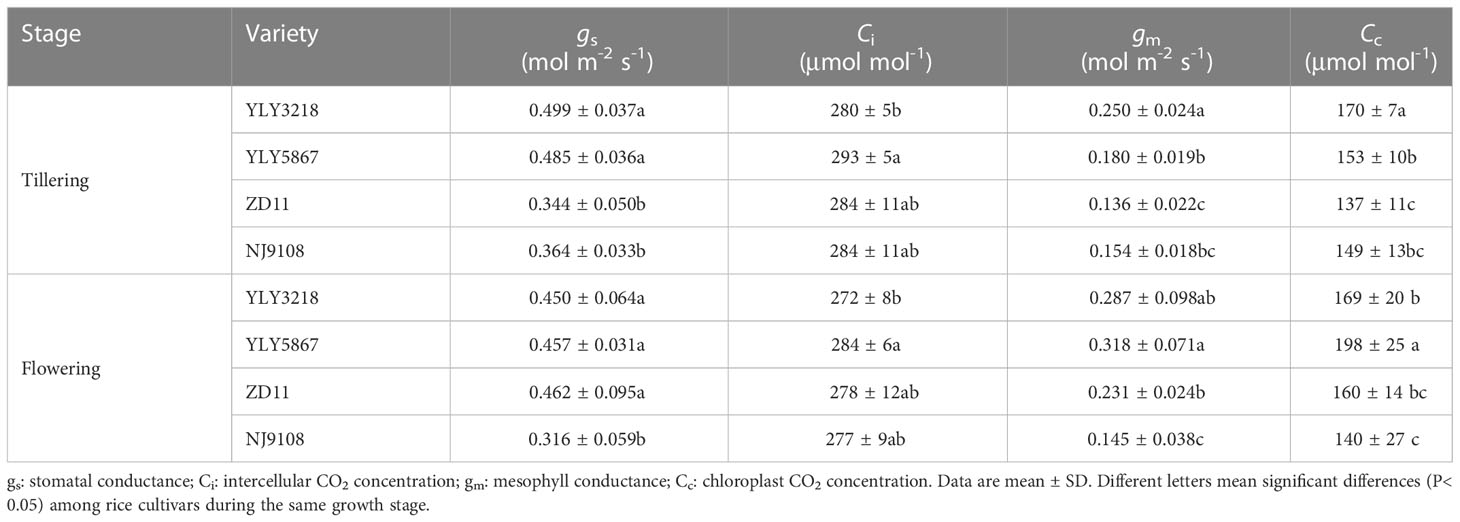
Table 1 CO2 diffusion parameters pf the latest fully expanded leaves for different rice cultivars during tillering stage and flowering stage.
At the tillering stage, Vcmax, Jmax, and TPU were greater in super hybrid rice than in inbred super rice (Table 2). At flowering stage, Vcmax was significantly higher in YLY3218 (141.1 μmol m-2 s-1) than in the inbred super rice; however, there was no difference in the Vcmax between the cultivars. The Jmax (221.7 μmol m-2 s-1) and TPU (13.3 μmol m-2 s-1) observed in YLY3218 were similar to ZD11, both of which were significantly higher than that in YLY5867 and NJ9108.
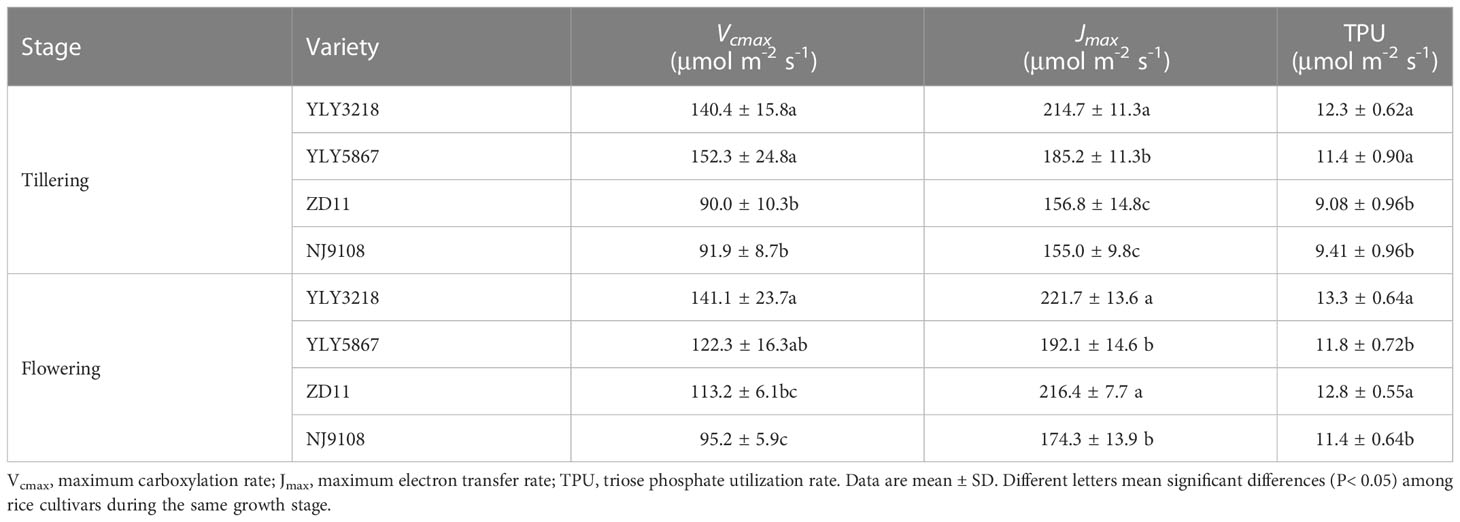
Table 2 Maximum carboxylation rate, maximum electron transfer rate and triose phosphate utilization rate of the latest fully expanded leaves for different rice cultivars during tillering and flowering stage.
3.3 LAI, β, and average canopy nitrogen concentration
Paralleled with the reductions in grain yield and biomass, a significant reduction in LAI of inbred super rice was found of 15.1%-17.7% at tillering stage and 14.2%-17.7% at flowering stage (Figure 3A). Generally, β of flowering stage was lower than that of tillering stage (Figure 3B). We noted that the β of super hybrid rice was not higher than that of inbred super rice. At both tillering stage and flowering stage, the inbred super rice had consistently the highest β value, comparable to YLY5867 but statically higher than YLY3218. There was no difference in the SLNave at tillering stage between the super hybrid rice and the inbred super rice (Figure 3C). While the SLNave value of inbred super rice was significantly higher than super hybrid rice at flowering stage, the maximal SLNave was reached in NJ9108 (Figure 3C).
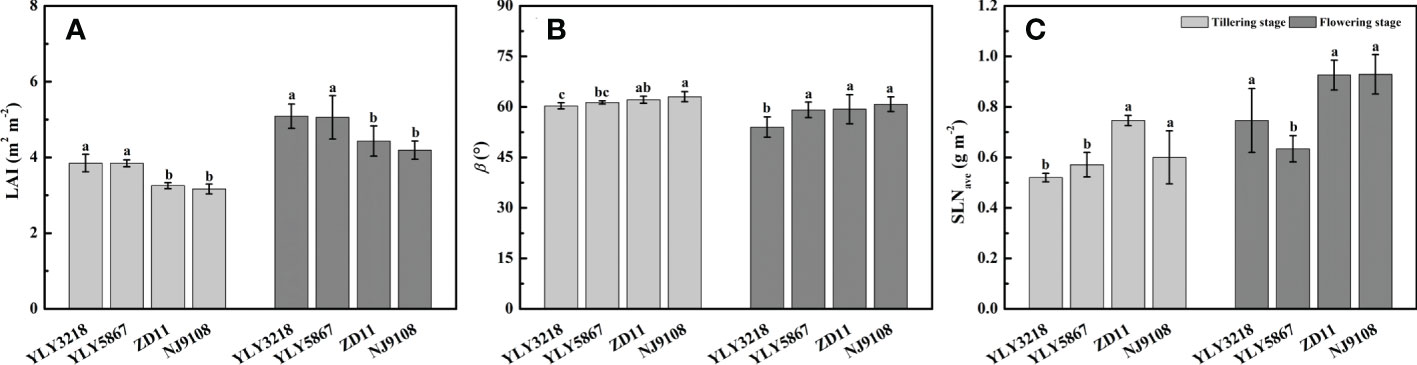
Figure 3 Leaf area index (LAI) (A), leaf inclination angle (β) (B), and average canopy nitrogen concentration per unit leaf area (SLNave) (C) for different rice cultivars during tillering stage and flowering stage. Different letters mean significant differences (P< 0.05) among rice cultivars during the same growth stage.
3.4 AMDAY simulated by improvement in targeted parameters
According to Wu et al. (2018), simulation of daily canopy photosynthesis for the hybrid super rice and the inbred super rice based on specific input parameters in the present study was done using DCaPS. At tillering stage, as shown in Figure 4, the values of AMDAY based on the observed parameters ranged from 17.92 g m-2 to 21.66 g m-2. The super hybrid rice achieved a high compared to the inbred super rice. To find out the most promising target for enhancing AMDAY, 20% improvement of AMDAY value of different targets were used to complete new simulations, and resulted in -19.3% to 23.7% increment compared with original simulations for super hybrid rice and inbred super rice (Figure 5). Among these parameters, enhancement of total canopy nitrogen concentration through improvement in SLNave (TCN-SLNave) exhibited the greatest increase in AMDAY, and the increment averaged across the cultivars was 18.2%. We noted that the enhancement of LAIcan had a consistently negative impact on AMDAY across the cultivars, with a maximal reduction of 19.3% in YLY3218. While the increment of AMDAY through Vcmax and β exhibited a slight impact on AMDAY, the improvement of which was, however, too little to be the promising target for improving AMDAY.
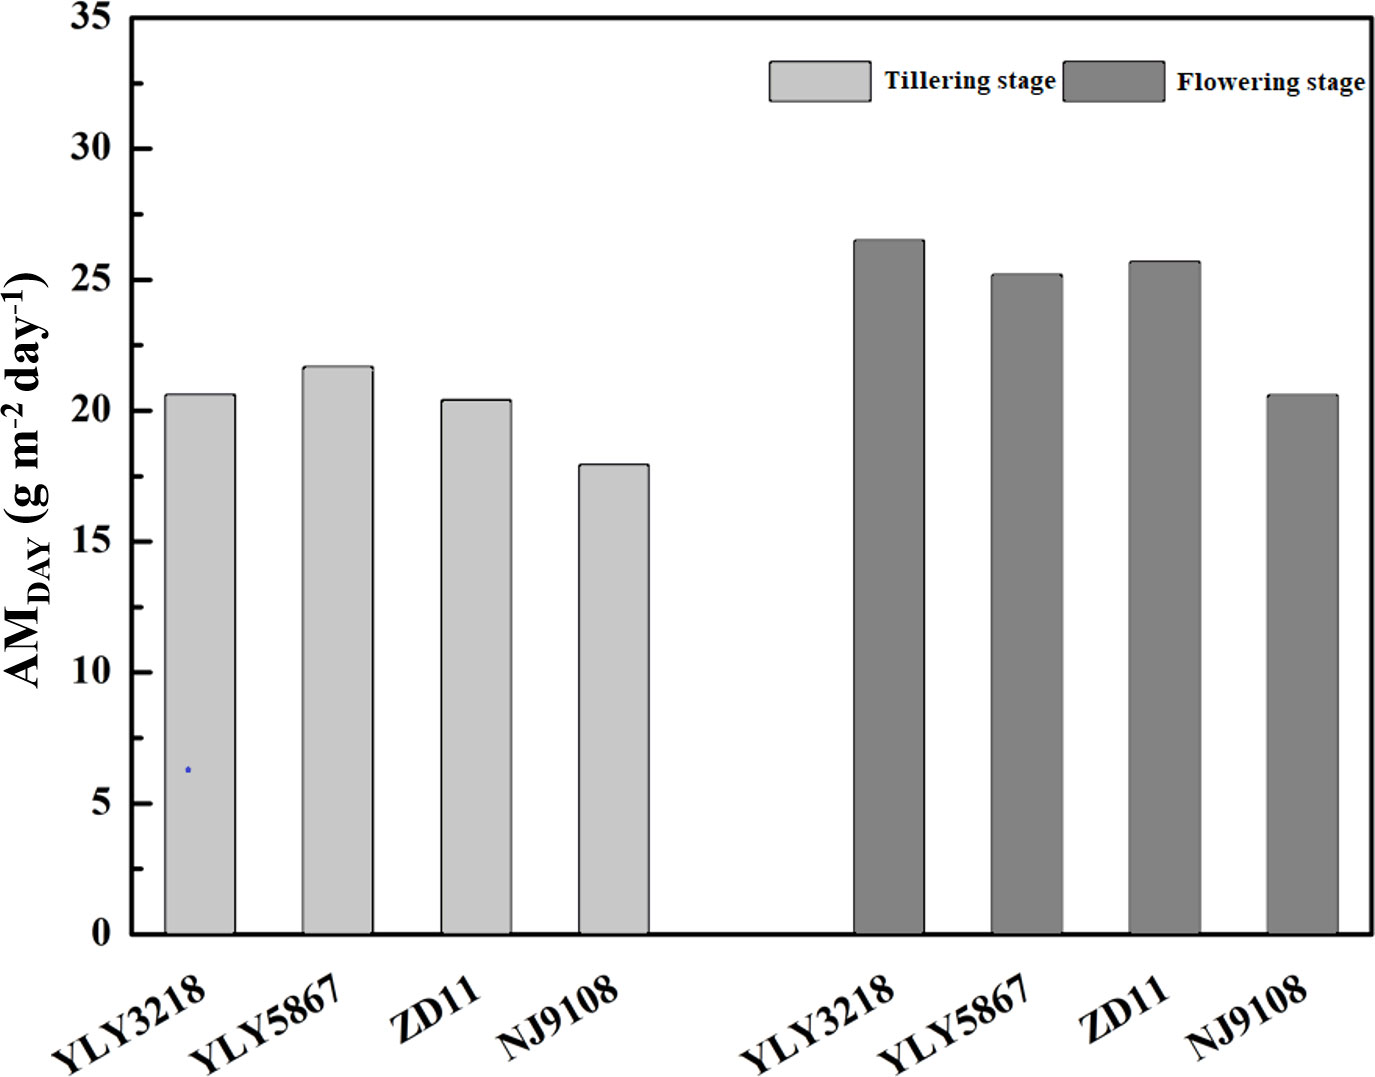
Figure 4 Daily aboveground biomass increment (AMDAY) simulated by observed parameters for different rice cultivars during tillering and flowering stage. Different letters mean significant differences (P< 0.05) among rice cultivars during the same growth stage.
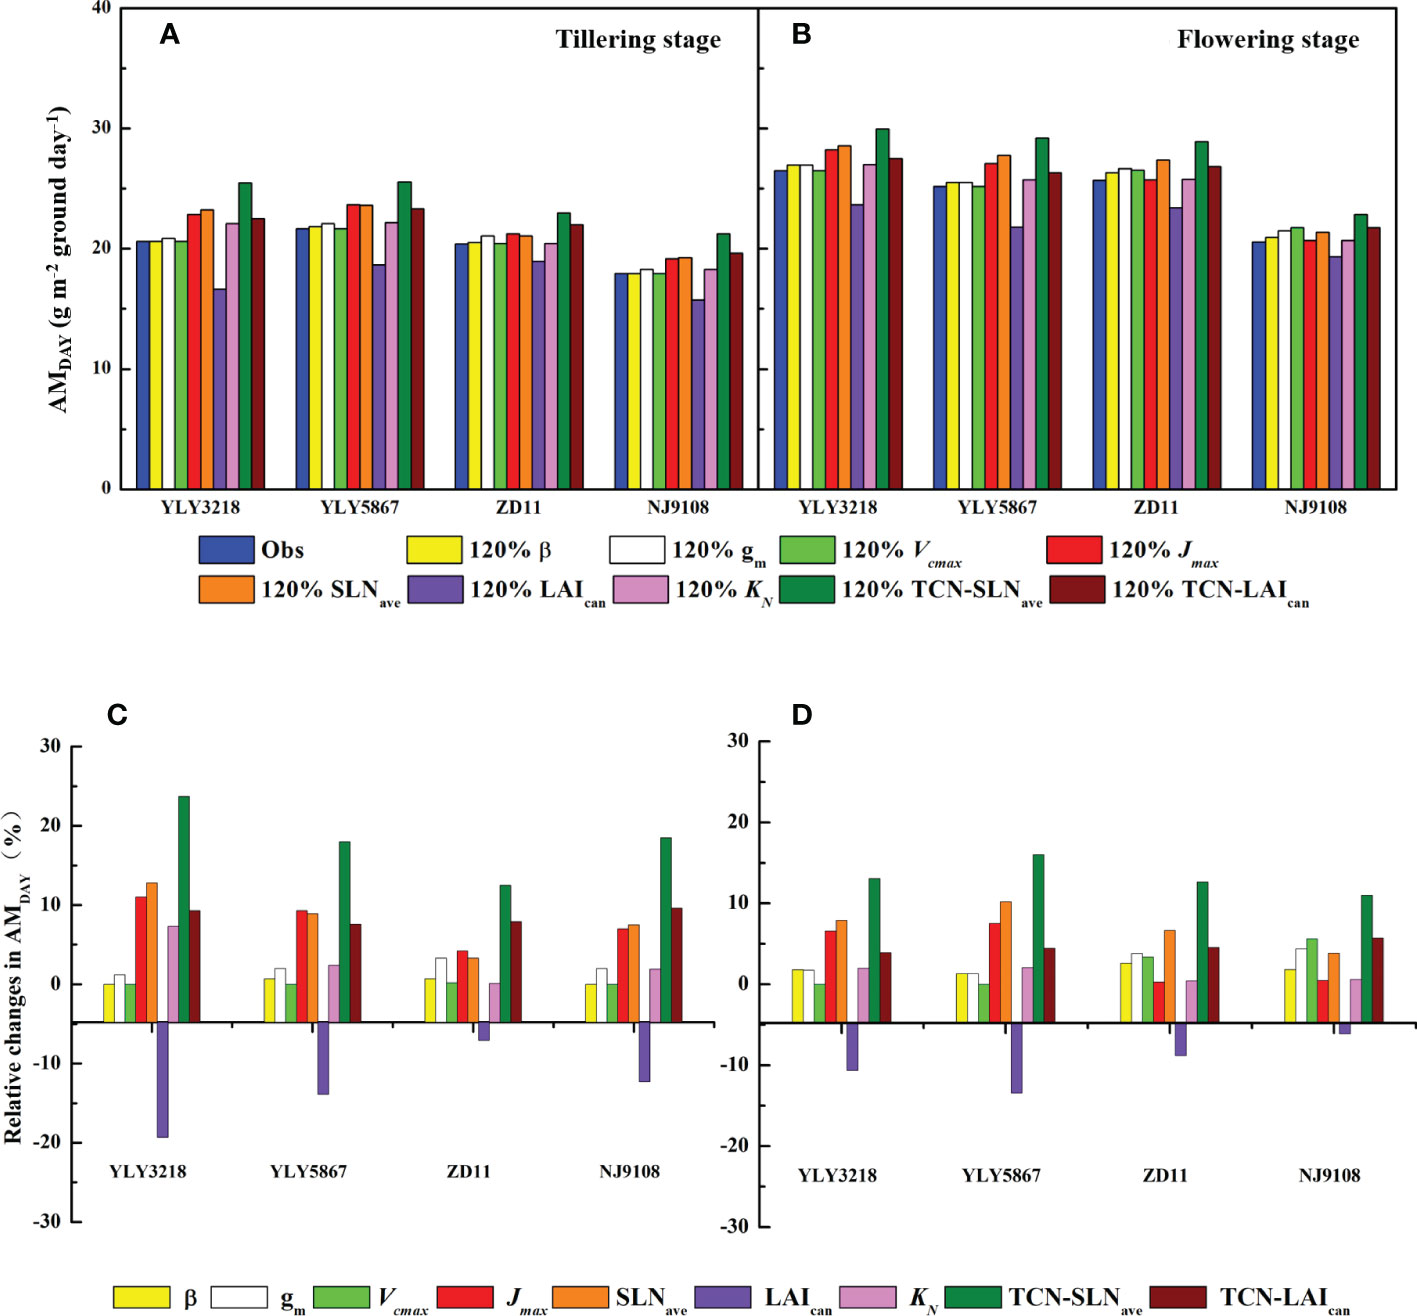
Figure 5 AMDAY simulated by 20% enhancement in targeted parameters (A, B) and the corresponding percentage change (C, D) for different rice cultivars during tillering (A, C) and flowering stage (B, D). Targeted parameters include canopy average leaf inclination relative to the horizontal (β), mesophyll conductance (gm), maximum carboxylation rate (Vcmax), maximum electron transfer rate (Jmax), average canopy nitrogen concentration per unit leaf area (SLNave), canopy leaf area index (LAIcan), canopy photosynthetic nitrogen extinction coefficient (KN), total canopy nitrogen concentration through improvement in SLNave (TNC-SLNave), total canopy nitrogen concentration through improvement in LAIcan (TNC-LAIcan).
Consistent with the tillering stage, Jmax, SLNave, and the TCN-SLNave were still the promising target for improving AMDAY. While the increment in LAIcan minimizes the value of AMDAY of YLY5867, which was 21.80 g m-2. We further found that the effect of KN on the increment of AMDAY was weakened in ZD11 and NJ9108.
3.5 AMDAY simulated based on replaced parameters
To identify the key parameters that dominate AMDAY variation among the super hybrid rice and inbred super rice, we employed the canopy mechanistic model method based on replaced parameters of super hybrid rice (Figure 6). At tillering stage, TCN-SLNave had the largest contribution (14.8%) to the AMDAY increment in NJ9108. However, if the TCN-SLNave in ZD11 was replaced by that of YLY32018, the AMDAY can be decreased by 7.67%. Specially, we noted that the replacement of Jmax and KN contributed to the averaged increment of the AMDAY in both the ZD11 and NJ9108.
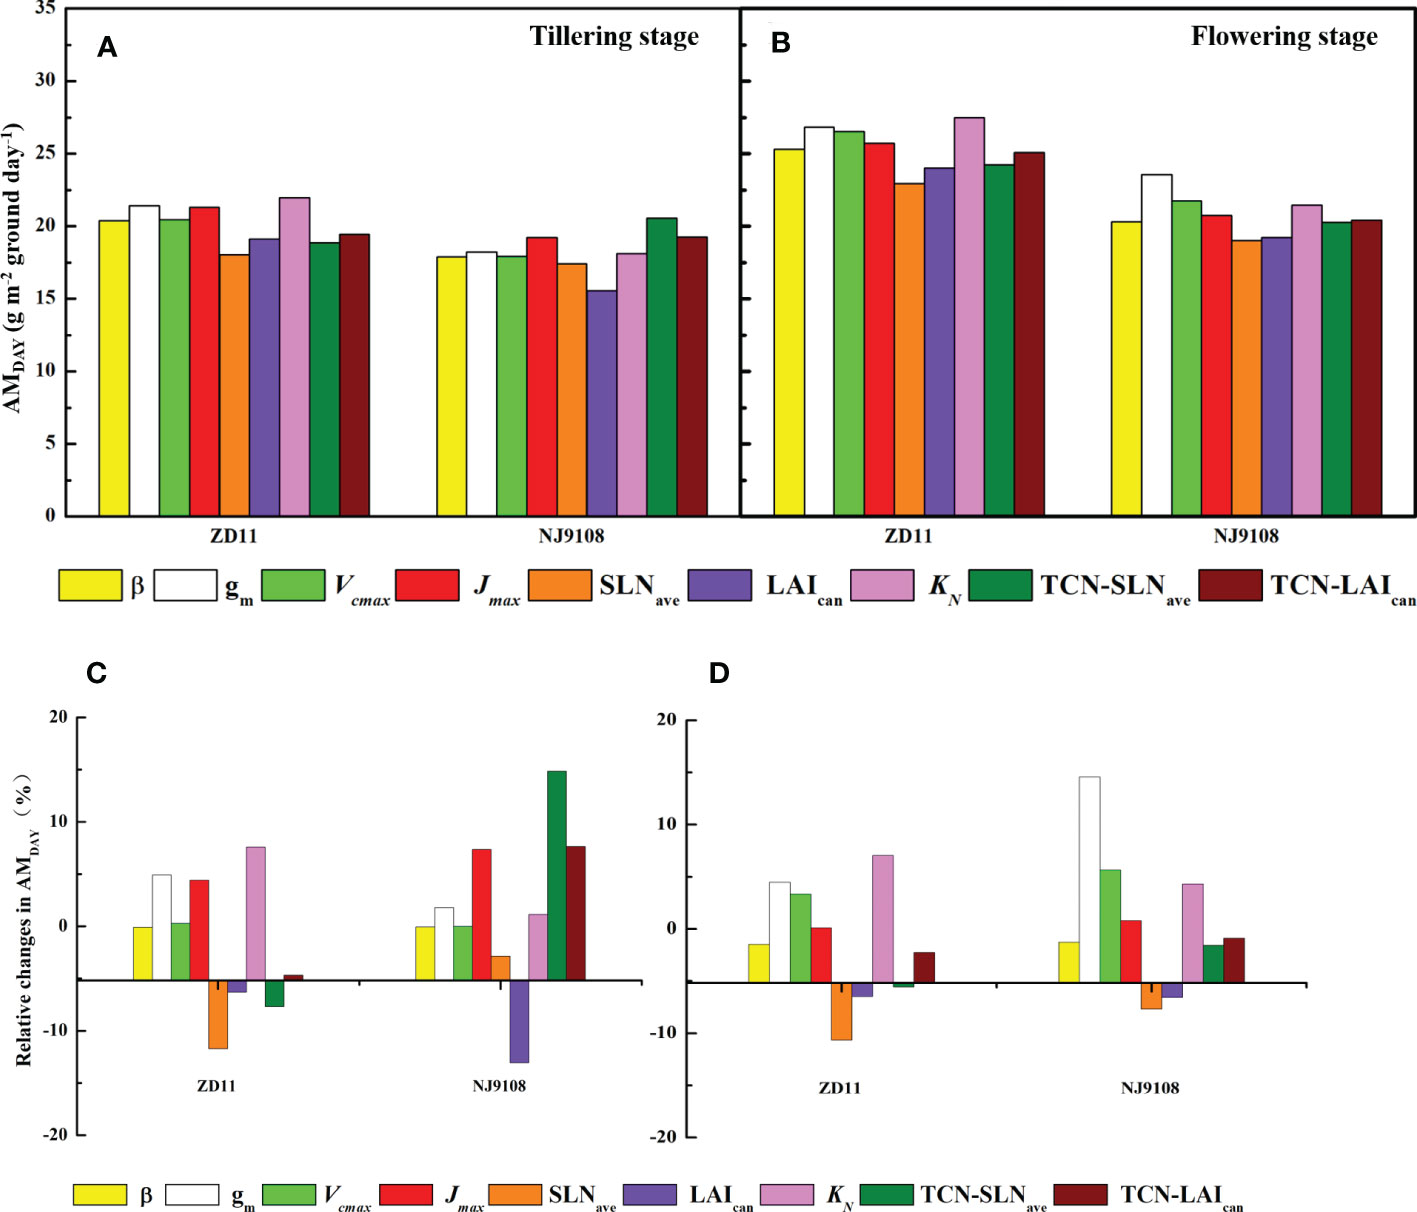
Figure 6 AMDAY based on replaced parameters (A, B) and percentage change in AMDAY (C, D) for different rice cultivars during tillering (A, C) and flowering stage (B, D). The simulated values based on replaced parameters of YLY5867 or YLY3218 were compared with counterparts based on observed parameters. Replaced parameters include canopy average leaf inclination relative to the horizontal (β), mesophyll conductance (gm), maximum carboxylation rate (Vcmax), maximum electron transfer rate (Jmax), average canopy nitrogen concentration per unit leaf area (SLNave), canopy leaf area index (LAIcan), canopy photosynthetic nitrogen extinction coefficient (KN), total canopy nitrogen concentration through improvement in SLNave (TNC-SLNave), total canopy nitrogen concentration through improvement in LAIcan (TNC-LAIcan).
In contrast, when performing the same analysis at flowering stage, the maximal increment in AMDAY was owing to the leaf gm, by 14.6% in NJ9108 and 4.47% in ZD11. The contribution of Jmax to the AMDAY increment was substantially weaker, while most of the variation in AMDAY was due to KN, especially in ZD11, with an increment of 7.05%.
4 Discussion
The utilization of super rice plays an important role in high-yield production of rice over the past several decades in China. Nevertheless, there are significant differences in grain yield between the super hybrid rice and inbred super rice, i.e., YLY3218 and YLY5867 were manifested by higher grain yield (Figures 1A, S3), which was mainly caused by larger panicle in super hybrid rice (Table S4). Consistently, we noted that the super hybrid rice group generally accumulated more biomass at both tillering stage and flowering stage than inbred super rice group, accompanied by larger LAI (Figures 1B, 3A). In most studies, improved crop biomass production was attributed to an improving photosynthetic efficiency (Zhu et al., 2012; Qu et al., 2017). Our results showed that super hybrid rice group had higher single Asat than inbred super rice, especially at tillering stage. Further analysis showed that higher Asat might be attributed to the synchronous improvement of CO2 diffusion capacity and biochemical capacity (Tables 1, 2), and suggested that the nitrogen concentration per leaf area (SLN) did not contribute that much (Figure 2B). Similar results were also observed by Wu et al. (2019) and He et al. (2017). Moreover, Asat in ZD11 was comparable to that of super hybrid rice at flowering stage, which indicated that the single-leaf photosynthesis advantages of the super hybrid rice cultivars were not achieved at all growth stages (Figure 2A). In this sense, leaf Asat is not always a limiting factor for grain yield and crop biomass (Evans and Dunstone, 1970; Zhao et al., 2008). For example, the decreasing Asat of super hybrid rice could be compensated by the change in LAI, resulting in an almost unimpacted yield. Additionally, by conducting the correlation analysis, the strong positive relationships between LAI and yield at both tillering and flowering stages were observed (tillering stage: r = 0.995, P< 0.01; flowering stage: r = 0.987, P< 0.05), while Asat merely showed a weak correlation to the yield (Table S5). LAI is one of the two important indicators representing plant canopy structure (Laidlaw and Withers, 1998). These results were in line with the findings of Shi et al. (2019), who further stated that the synergetic changes of Asat and LAI could contribute to higher canopy photosynthesis.
Improving canopy photosynthesis is regarded as a major target to improve crop biomass production and yield potential (Song et al., 2016). To explore the optimal factors contributing to substantial higher Asat in super rice group at two growth stages, we performed a canopy photosynthetic model based on a 20% enhancement in each targeted parameter (Figures 5A, B). In this study, we examined AMDAY as a surrogate of canopy photosynthetic rate. Results showed that improvement of TCN-SLNave had the greatest increment in AMDAY at both tillering stage and flowering stage, with an average increase of 18.1% among cultivars at tillering stage and 10.7% at flowering stage (Figures 5C, D). Especially, AMDAY could also be significantly elevated by increasing the averaged SLNave, and a maximal increase of AMDAY by 12.8% was reached in YLY3218 (Figure 5C). Nitrogen is one of the most important limiting resources for plant growth. Hikosaka et al. (2016) indicated that the distribution of SLNave with a leaf canopy is one of the most essential factors for canopy photosynthesis, which depended mostly on LAI (Moreau et al., 2012). In contrast, improvement of LAI presented the greatest negative effect on AMDAY in both cultivars, which decreased AMDAY by averaging 13.1% at tillering stage and 9.3% at flowering stage (Figure 5D). This is partly because of the lack of synergistic changes in leaf angle and nitrogen distribution. Especially when the plant nitrogen content is not sufficient, the gain of increasing LAI for total canopy photosynthesis was compensated by the decrease of Asat, which even led to a decrease in AMDAY. This is again supported by the result that a together improvement of LAI and canopy nitrogen accumulation (TCN-LAIcan) can increase AMDAY by up to 9.33%. As reported by previous studies, for plants with a higher LAI, the further increase in plant canopy photosynthesis depends on a more vertical leaf angle at the top of the canopy and a more optimal nitrogen distribution within the canopy (Zhu et al., 2010; Long et al., 2016).
Notably, the improvement of Jmax can also be used as a potential route to further improve super rice, especially for super hybrid rice; while the increase in Vcmax had rarely affected AMDAY enhancement (Figures 5C, D), indicating the assimilate rate of leaf fractions were electron transport limited, which was in agreement with Wu et al. (2018). In the present canopy model, 20% elevation of Jmax resulted in a 5.78% increase in AMDAY. In well-fertilized C3 crops, controls on photosynthetic capacity should be shared between Vcmax and Jmax (Zhu et al., 2010). This is further supported by previous studies that overexpression of the RiesKe Fes protein in Arabidopsis led to increased photosynthesis, biomass, and grain yield, by enhancing the rate of electron transport (Yamori et al., 2016; Simkin et al., 2017). However, Sinclair et al. (2004) assessed the impact of a 50% increase in the production of mRNA for the synthesis of Rubisco, only a 6% increase or even a 6% decrease was observed in yield, which depended on whether there is extra nitrogen accumulation. The foregoing has established that at the current atmospheric CO2 concentration, generation of RuBP during tillering stage was important for the increase of canopy photosynthesis of super rice cultivars.
In the present study, we observed a higher AMDAY in super hybrid rice group at tillering stage, while ZD11 had a comparable AMDAY compared with super hybrid rice at flowering stage (Figure 4). As a composition of canopy structure, erect leaves are undoubtedly the most conducive to the enhancement of canopy photosynthetic efficiency and AMDAY. A canopy with a gradually increased β can increase the daily integral of carbon uptake by as much as 40%, compared to a canopy with horizontal leaves (Long et al., 2016). In the present study, however, β value only showed slight differences between cultivars (Figure 3B). For rice, one possibility could be that the canopy architecture had been effectively optimized for maximum light capture through breeding (Horton, 2000). In this sense, what are the major factors controlling the different canopy photosynthesis between super hybrid rice and inbred super rice? To answer this question, we performed single-factor substitution analysis, i.e., based on the superior parameters of the two super hybrid rice cultivars, the corresponding values were substituted for the two inbred super rice cultivars, one by one, and so on, at tillering and flowering stages, respectively. Results showed that for high AMDAY in super hybrid rice, gm, KN, and Jmax were predicted to have the largest contributions (Figures 6A, B). This is supported by a previous study that rice productivity could be significantly improved by mining the parameters determining light-limited photosynthesis (Horton, 2000). According to Zhu et al. (2022), a higher ratio of the extinction coefficient for effective leaf nitrogen to the light extinction coefficient generally led to enhanced canopy photosynthesis and dry matter content. At flowering stage, the improvement of super inbred rice was attributed to its higher SLNave. Previous studies showed that the leaf nitrogen concentration was the key factor in determining photosynthetic capacity on a scale of single leaf or canopy (Schnier et al., 1990; Pao et al., 2019). Crop nutrient utilization and photosynthetic nitrogen use efficiency at late development stage were the preconditions for maintaining canopy photosynthetic advantage (Shi et al., 2019).
In summary, the improvement of canopy photosynthesis is considered to be one of the major goals to produce super high yield in the new era, in which the choice of superior traits is the most important approach. Our model showed that keeping a higher LAI and Asat during tillering stage is of great importance for the canopy photosynthesis increment of super rice, which needs to be supported by the optimal canopy nitrogen content. For ZD11 and NJ9108, the improvement of Jmax, gm, and KN had the largest impact on canopy photosynthesis compared with YLY3218 and YLY5867. These identified parameters can be used as useful targets to further improve rice yield of the tested rice varieties. It was foreseeable that the system method and analysis allowed us to suggest strategies to further improve the productivity of these superior rice varieties. The methods presented here can also be used to identify the key targets attribute to the increase in other rice lines.
Data availability statement
The raw data supporting the conclusions of this article will be made available by the authors, without undue reservation.
Author contributions
YP: Conceptualization, Investigation, Methodology, Software, Validation, Writing - review and editing; YCa: Investigation, Methodology, Formal analysis, Writing - original draft; YCh: Investigation, Software; XM: Writing - review and editing; GW: Supervision, Funding acquisition, Resources; MW and SG: Conceptualization, Supervision, Funding acquisition, Resources, Writing - review and editing. All authors contributed to the article and approved the submitted version.
Funding
This work was supported by the National Natural Science Foundation of China (U200320013) and the Fundamental Research Funds for the Central Universities (ZJ22195022).
Conflict of interest
The authors declare that the research was conducted in the absence of any commercial or financial relationships that could be construed as a potential conflict of interest.
Publisher’s note
All claims expressed in this article are solely those of the authors and do not necessarily represent those of their affiliated organizations, or those of the publisher, the editors and the reviewers. Any product that may be evaluated in this article, or claim that may be made by its manufacturer, is not guaranteed or endorsed by the publisher.
Supplementary material
The Supplementary Material for this article can be found online at: https://www.frontiersin.org/articles/10.3389/fpls.2023.1110257/full#supplementary-material
References
Ahmed Jewel, Z., Ali, J., Pang, Y., Mahender, A., Acero, B., Hernandez, J., et al. (2019). Developing green super rice varieties with high nutrient use efficiency by phenotypic selection under varied nutrient conditions. Crop J. 7, 368–377. doi: 10.1016/j.cj.2019.01.002
Amthor, J. S. (1994). Scaling CO2-photosynthesis relationships from the leaf to the canopy. Photosynth. Res. 39, 321–350. doi: 10.1007/BF00014590
Chen, S., Wang, D., Xu, C., Ji, C., Zhang, X., Zhao, X., et al. (2014). Responses of super rice (Oryza sativa L.) to different planting methods for grain yield and nitrogen-use efficiency in the single cropping season. PloS One 9 (8), e104950. doi: 10.1371/journal.pone.0104950
De Pury, D., Farquhar, G. (1997). Simple scaling of photosynthesis from leaves to canopies without the errors of big-leaf models. Plant Cell Environ. 20, 537–557. doi: 10.1111/j.1365-3040.1997.00094.x
Driever, S. M., Lawson, T., Andralojc, P. J., Raines, C. A., Parry, M. A. (2014). Natural variation in photosynthetic capacity, growth, and yield in 64 field grown wheat genotypes. J. Exp. Bot. 65, 4959–4973. doi: 10.1093/jxb/eru253
Evans, L., Dunstone, R. L. (1970). Some physiological aspects of evolution in wheat. Aust. J. Biol. Sci. 23, 725–742. doi: 10.1071/BI9700725
Faralli, M., Lawson, T. J. (2020). Natural genetic variation in photosynthesis: An untapped resource to increase crop yield potential. Plant J. 101, 518–528. doi: 10.1111/tpj.14568
Flexas, J., Barbour, M. M., Brendel, O., Cabrera, H. M., Carriquí, M., Diaz-Espejo, A., et al. (2012). Mesophyll diffusion conductance to CO2: An unappreciated central player in photosynthesis. Plant Sci. 193, 70–84. doi: 10.1016/j.plantsci.2012.05.009
Flexas, J., Ribas-Carbó, M., Díaz-Espejo, A., Galmés, J., Medrano, H. (2008). Mesophyll conductance to CO2: Current knowledge and future prospects. Plant Cell Environ. 31, 602–621. doi: 10.1111/j.1365-3040.2007.01757.x
Gu, J. F., Yin, X. Y., Stomph, T. J., Struik, P. C. (2014). Can exploiting natural genetic variation in leaf photosynthesis contribute to increasing rice productivity? A simulation analysis. Plant Cell Environ. 37, 22–34. doi: 10.1111/pce.12173
Hammer, G. L., van Oosterom, E., McLean, G., Chapman, S. C., Broad, I., Harland, P., et al. (2010). Adapting APSIM to model the physiology and genetics of complex adaptive traits in field crops. J. Exp. Bot. 61, 2185–2202. doi: 10.1093/jxb/erq095
He, W., Adachi, S., Sage, R. F., Ookawa, T., Hirasawa, T. J. (2017). Leaf photosynthetic rate and mesophyll cell anatomy changes during ontogenesis in backcrossed indica× japonica rice inbred lines. Photosyn. Res. 134, 27–38. doi: 10.1007/s11120-017-0403-x
Hikosaka, K., Anten, N. P., Borjigidai, A., Kamiyama, C., Sakai, H., Hasegawa, T., et al. (2016). A meta-analysis of leaf nitrogen distribution within plant canopies. Ann. Bot. 118, 239–247. doi: 10.1093/aob/mcw099
Horton, P. J. (2000). Prospects for crop improvement through the genetic manipulation of photosynthesis: Morphological and biochemical aspects of light capture. J. Exp. Bot. 51, 475–485. doi: 10.1093/jexbot/51.suppl_1.475
Laidlaw, A. S., Withers, J. A. (1998). Changes in contribution of white clover to canopy structure in perennial ryegrass/white clover swards in response to n fertilizer. Grass Forage Sci. 53, 287–291. doi: 10.1046/j.1365-2494.1998.00128.x
Li, S., Jiang, H., Wang, J., Wang, Y., Pan, S., Tian, H., et al. (2019). Responses of plant growth, physiological, gas exchange parameters of super and non-super rice to rhizosphere temperature at the tillering stage. Sci. Rep. 9, 10618. doi: 10.1038/s41598-019-47031-9
Liu, K., He, A. B., Ye, C., Liu, S. W., Lu, J. T., Gao, M. T., et al. (2018). Root morphological traits and spatial distribution under different nitrogen treatments and their relationship with grain yield in super hybrid rice. Sci. Rep. 8, 131. doi: 10.1038/s41598-017-18576-4
Long, S. P., Zhu, X., Naidu, S. L., Ort, D. R. (2016). Can improvement in photosynthesis increase crop yields? Plant Cell Environ. 29, 315–330.
Mcausland, L., Vialet-Chabrand, S., Davey, P., Baker, N. R., Brendel, O., Lawson, T. (2016). Effects of kinetics of light-induced stomatal responses on photosynthesis and water-use efficiency. New Phytol. 211, 1209–1220. doi: 10.1111/nph.14000
Moreau, D., Allard, V., Gaju, O., Le Gouis, J., Foulkes, M. J., Martre, P. J. (2012). Acclimation of leaf nitrogen to vertical light gradient at anthesis in wheat is a whole-plant process that scales with the size of the canopy. Plant Physiol. 160, 1479–1490. doi: 10.1104/pp.112.199935
Pan, Y. H., Gao, S., Xie, K. L., Lu, Z. F., Meng, X. S., Wang, S. Y., et al. (2020). Higher radiation use efficiency produces greater biomass before heading and grain yield in super hybrid rice. Agronomy-Basel. 10, 209–221. doi: 10.3390/agronomy10020209
Pao, Y. C., Chen, T. W., Moualeu-Ngangue, D. P., Stützel, H. J. (2019). Environmental triggers for photosynthetic protein turnover determine the optimal nitrogen distribution and partitioning in the canopy. J. Exp. Bot. 70, 2419–2434. doi: 10.1093/jxb/ery308
Parry, M. A., Reynolds, M., Salvucci, M. E., Raines, C., Andralojc, P. J., Zhu, X. G., et al. (2011). Raising yield potential of wheat II. Increasing photosynthetic capacity and efficiency. J. Exp. Bot. 62, 453–467. doi: 10.1093/jxb/erq304
Peng, S. (2000). Single-leaf and canopy photosynthesis of rice. Studies Plant Sci. 7, 213–228. doi: 10.1016/S0928-3420(00)80017-8
Peng, S., Khush, G. S., Virk, P., Tang, Q., Zou, Y. (2008). Progress in ideotype breeding to increase rice yield potential. Field Crops Res. 108, 32–38. doi: 10.1016/j.fcr.2008.04.001
Price, G. D., Badger, M. R., Woodger, F. J., Long, B. M. (2008). Advances in understanding the cyanobacterial CO2-concentrating-mechanism (CCM): Functional components, ci transporters, diversity, genetic regulation and prospects for engineering into plants. J. Exp. Bot. 59, 1441–1461. doi: 10.1093/jxb/erm112
Qu, M., Zheng, G., Hamdani, S., Essemine, J., Song, Q., Wang, H., et al. (2017). Leaf photosynthetic parameters related to biomass accumulation in a global rice diversity survey. Plant Physiol. 175, 248–258. doi: 10.1104/pp.17.00332
Running, S. W., Coughlan, J. C. (1988). A general model of forest ecosystem processes for regional applications. i. hydrological balance, canopy gas exchange and primary production processes. Ecol. Model. 42, 125–154. doi: 10.1016/0304-3800(88)90112-3
Schnier, H., Dingkuhn, M., De Datta, S., Mengel, K., Wijangco, E., Javellana, C. J. (1990). Nitrogen economy and canopy carbon dioxide assimilation of tropical lowland rice. Agron. J. 82, 451–459. doi: 10.2134/agronj1990.00021962008200030002x
Sellers, P. J., Berry, J. A., Collatz, G. J., Field, C. B., Hall, F. G. (1992). Canopy reflectance, photosynthesis, and transpiration. 3. a reanalysis using improved leaf models and a new canopy integration scheme. Remote Sens. Environ. 42, 187–216. doi: 10.1016/0034-4257(92)90102-P
Sharkey, T. D., Bernacchi, C. J., Farquhar, G. D., Singsaas, E. L. (2007). Fitting photosynthetic carbon dioxide response curves for C3 leaves. Plant Cell Environ. 30, 1035–1040. doi: 10.1111/j.1365-3040.2007.01710.x
Shi, Z., Chang, T. G., Chen, G., Song, Q., Zhu, X. G. (2019). Dissection of mechanisms for high yield in two elite rice cultivars. Field Crops Res. 241, 107563. doi: 10.1016/j.fcr.2019.107563
Simkin, A. J., Lopez-Calcagno, P. E., Raines, C. A. (2019). Feeding the world: improving photosynthetic efficiency for sustainable crop production. J. Exp. Bot. 70, 1119–1140. doi: 10.1093/jxb/ery445
Simkin, A. J., McAusland, L., Lawson, T., Raines, C. A. (2017). Overexpression of the RieskeFeS protein increases electron transport rates and biomass yield. Plant Physiol. 175, 134–145. doi: 10.1104/pp.17.00622
Sinclair, T. R., Horie, T. (1989). Leaf nitrogen, photosynthesis, and crop radiation use efficiency-a review. Crop Sci. 29, 90–98. doi: 10.2135/cropsci1989.0011183X002900010023x
Sinclair, T. R., Purcell, L. C., Sneller, C. H. (2004). Crop transformation and the challenge to increase yield potential. Trends Plant Sci. 9, 70–75. doi: 10.1016/j.tplants.2003.12.008
Song, Q., Chu, C., Parry, M. A., Zhu, X. G., Security, E. (2016). Genetics-based dynamic systems model of canopy photosynthesis: The key to improve light and resource use efficiencies for crops. Food Energy Secur. 5, 18–25. doi: 10.1002/fes3.74
Song, Q. F., Zhang, G. L., Zhu, X. G. (2013). Optimal crop canopy architecture to maximise canopy photosynthetic CO2 uptake under elevated CO2 - a theoretical study using a mechanistic model of canopy photosynthesis. Funct. Plant Biol. 40, 109–124. doi: 10.1071/FP12056
Tilman, D., Balzer, C., Hill, J., Befort, B. L. (2011). Global food demand and the sustainable intensification of agriculture. Proc. Nal. Acad. Sci. 108, 20260–20264. doi: 10.1073/pnas.1116437108
Tilman, D., Clark, M. (2015). Food, agriculture & the environment: Can we feed the world & save the earth? Daedalus. 144, 8–23. doi: 10.1162/DAED_a_00350
Wei, H., Hu, L., Zhu, Y., Xu, D., Zheng, L., Chen, Z., et al. (2018). Different characteristics of nutrient absorption and utilization between inbred japonica super rice and inter-sub-specific hybrid super rice. field. Crops Res. 218, 88–96. doi: 10.1016/j.fcr.2018.01.012
Whitney, S. M., Sharwood, R. E. (2008). Construction of a tobacco master line to improve rubisco engineering in chloroplasts. J. Exp. Bot. 59, 1909–1921. doi: 10.1093/jxb/erm311
Wu, A., Doherty, A., Farquhar, G. D., Hammer, G. L. (2018). Simulating daily field crop canopy photosynthesis: an integrated software package. Funct. Plant Biol. 45, 362–377. doi: 10.1071/FP17225
Wu, A., Hammer, G. L., Doherty, A., von Caemmerer, S., Farquhar, G. D. (2019). Quantifying impacts of enhancing photosynthesis on crop yield. Nat. plants. 5, 380–388. doi: 10.1038/s41477-019-0398-8
Yamori, W., Kondo, E., Sugiura, D., Terashima, I., Suzuki, Y., Makino, A. J. (2016). Enhanced leaf photosynthesis as a target to increase grain yield: Insights from transgenic rice lines with variable rieske FeS protein content in the cytochrome b6/f complex. Plant Cell Environ. 39, 80–87. doi: 10.1111/pce.12594
Yin, X., Struik, P. C. (2015). Constraints to the potential efficiency of converting solar radiation into phytoenergy in annual crops: From leaf biochemistry to canopy physiology and crop ecology. J. Exp. Bot. 66, 6535–6549. doi: 10.1093/jxb/erv371
Yin, X., Struik, P. C., Romero, P., Harbinson, J., Evers, J. B., van der Putten, P. E., et al. (2009). Using combined measurements of gas exchange and chlorophyll fluorescence to estimate parameters of a biochemical C3 photosynthesis model: a critical appraisal and a new integrated approach applied to leaves in a wheat (Triticum aestivum) canopy. Plant Cell Environ. 32, 448–464. doi: 10.1111/j.1365-3040.2009.01934.x
Yoon, D. K., Ishiyama, K., Suganami, M., Tazoe, Y., Watanabe, M., Imaruoka, S., et al. (2020). Transgenic rice overproducing rubisco exhibits increased yields with improved nitrogen-use efficiency in an experimental paddy field. Nat. Food 1, 134–139. doi: 10.1038/s43016-020-0033-x
Zhang, W. J., Li, G. H., Yang, Y. M., Li, Q., Zhang, J., Liu, J. Y., et al. (2014). Effects of nitrogen application rate and ratio on lodging resistance of super rice with different genotypes. J. Integr. Agr. 13, 63–72. doi: 10.1016/S2095-3119(13)60388-3
Zhang, M., Shan, Y., Kochian, L., Strasser, R. J., Chen, G. (2015). Photochemical properties in flag leaves of a super-high-yielding hybrid rice and a traditional hybrid rice (Oryza sativa l.) probed by chlorophyll a fluorescence transient. Photosynth. Res. 126, 275–284. doi: 10.1007/s11120-015-0151-8
Zhao, X. Q., Xu, J. L., Zhao, M., Lafitte, R., Zhu, L. H., Fu, B. Y., et al. (2008). QTLs affecting morph-physiological traits related to drought tolerance detected in overlapping introgression lines of rice (Oryza sativa l.). Plant Sci. 174, 618–625. doi: 10.1016/j.plantsci.2008.03.009
Zhu, X. G., Long, S. P., Ort, D. R. (2010). Improving photosynthetic efficiency for greater yield. Ann. Rev. Plant Bio. 61, 235–261. doi: 10.1146/annurev-arplant-042809-112206
Zhu, X. G., Ort, D. R., Whitmarsh, J., Long, S. P. (2004). The slow reversibility of photosystem II thermal energy dissipation on transfer from high to low light may cause large losses in carbon gain by crop canopies: A theoretical analysis. J. Exp. Bot. 55, 1167–1175. doi: 10.1093/jxb/erh141
Zhu, X. G., Song, Q., Ort, D. R. (2012). Elements of a dynamic systems model of canopy photosynthesis. Curr. Opin. Plant Biol. 15, 237–244. doi: 10.1016/j.pbi.2012.01.010
Keywords: yield, photosynthetic capacity, super rice, canopy photosynthesis, leaf nitrogen concentration
Citation: Pan Y, Cao Y, Chai Y, Meng X, Wang M, Wang G and Guo S (2023) Identification of photosynthetic parameters for superior yield of two super hybrid rice varieties: A cross-scale study from leaf to canopy. Front. Plant Sci. 14:1110257. doi: 10.3389/fpls.2023.1110257
Received: 28 November 2022; Accepted: 01 February 2023;
Published: 14 February 2023.
Edited by:
Wei Huang, Kunming Institute of Botany (CAS), ChinaReviewed by:
Qingfeng Song, Center for Excellence in Molecular Plant Sciences (CAS), ChinaKeiki Ishiyama, Tohoku University, Japan
Copyright © 2023 Pan, Cao, Chai, Meng, Wang, Wang and Guo. This is an open-access article distributed under the terms of the Creative Commons Attribution License (CC BY). The use, distribution or reproduction in other forums is permitted, provided the original author(s) and the copyright owner(s) are credited and that the original publication in this journal is cited, in accordance with accepted academic practice. No use, distribution or reproduction is permitted which does not comply with these terms.
*Correspondence: Shiwei Guo, sguo@njau.edu.cn; Guanjun Wang, 905136238@qq.com
†These authors have contributed equally to this work and share first authorship