 Jia Teng1†
 Jianyu Wang1†Lan Zhang1†Chendan Wei1Shaoqi Shen1Qimeng Xiao1Yuanshuai Yue1
 Yanan Hao1
 Weina Ge1*
 Jinpeng Wang1,2*
- 1Department of Bioinformatics, School of Life Sciences and Center for Genomics and Computational Biology, North China University of Science and Technology, Tangshan, China
- 2State Key Laboratory of Systematic and Evolutionary Botany, Institute of Botany, Chinese Academy of Science, Beijing, China
Eudicots account for ~75% of living angiosperms, containing important food and energy crops. Recently, high-quality genome sequences of several eudicots including Aquilegia coerulea and Nelumbo nucifera have become available, providing an opportunity to investigate the early evolutionary characteristics of eudicots. We performed genomic hierarchical and event-related alignments to infer homology within and between representative species of eudicots. The results provide strong evidence for multiple independent polyploidization events during the early diversification of eudicots, three of which are likely to be allopolyploids: The core eudicot-common hexaploidy (ECH), Nelumbo-specific tetraploidy (NST), and Ranunculales-common tetraploidy (RCT). Using different genomes as references, we constructed genomic alignment to list the orthologous and paralogous genes produced by polyploidization and speciation. This could provide a fundamental framework for studying other eudicot genomes and gene(s) evolution. Further, we revealed significantly divergent evolutionary rates among these species. By performing evolutionary rate correction, we dated RCT to be ~118–134 million years ago (Mya), after Ranunculales diverged with core eudicots at ~123–139 Mya. Moreover, we characterized genomic fractionation resulting from gene loss and retention after polyploidizations. Notably, we revealed a high degree of divergence between subgenomes. In particular, synonymous nucleotide substitutions at synonymous sites (Ks) and phylogenomic analyses implied that A. coerulea might provide the subgenome(s) for the gamma-hexaploid hybridization.
Introduction
There are around 280,000 species of eudicots, accounting for ~75% of all living angiosperms (Zeng et al., 2014). Ranunculales, Proteales, Trochodendrales, and Buxales are four sister groups of core eudicots (Bremer et al., 2009; Byng et al., 2016). Among all sequenced core eudicots, Vitis vinifera (2n = 38) was the first sequenced fruit crop. There are relatively few structural changes in its genome (Jaillon et al., 2007), and it is often selected as a good reference for research on the evolution of eudicots. Recently, several high-quality whole genomes from basal eudicots have been sequenced or updated. Nelumbo nucifera (2n = 16) is a member of the family Nelumbonaceae from order Proteales, which was first sequenced in 2013 (Ming et al., 2013) and has further been updated in assembly (Gui et al., 2018; Shi et al., 2020). Macadamia integrifolia (2n = 28) is a representative species of Proteales and its genome has been sequenced (Nock et al., 2020). Ranunculales is the earliest group diverging from other eudicots, including the genomes of Aquilegia coerulea (2n = 14) (Aköz and Nordborg, 2019), Aquilegia oxysepala var. kansuensis (2n = 14) (Xie et al., 2020), and Papaver somniferum L. (2n = 22) (Guo et al., 2018) which are already available. Tetracentron sinense (2n = 48) is a member of Trochodendrales, an endemic and endangered deciduous tree with the genome sequenced (Liu et al., 2020). All these genomes are chromosome-level assembly and located at the critical phylogenetic positions of eudicots, facilitating to elucidate key evolutionary features during the early evolution of eudicots.
Polyploidy, or whole-genome duplication (WGD), is a key driver in species evolution and occurs widely in angiosperms (Paterson et al., 2004; Jiao et al., 2011; Jiao and Paterson, 2014; Murat et al., 2017). Previous studies have revealed that an ancient hexaploidy event, known as gamma (Vision et al., 2000; Bowers et al., 2003; Jaillon et al., 2007; Tang et al., 2008), occurred within a few million years during the early diversification of eudicots (Bell et al., 2010; Magallon et al., 2015). As yet, among all identified WGDs, the gamma event might affect the largest number of eudicots' plant groups (Jiao et al., 2011). After WGD, there are complex chromosomal rearrangements (Murat et al., 2017), a large number of duplicated genes are lost, and sequence divergence occurs. These are important processes in promoting genetic innovation (Puchta et al., 1996; Long et al., 2003; Mitchell-Olds and Schmitt, 2006), but make genomes extremely complex (Wang et al., 2017, 2018b, 2019b, 2020a). This may lead to problematic interpretations of the evolution of WGD events (Wang et al., 2005, 2016; Li et al., 2015). Early divergence of eudicots occurred at ~130–150 Mya (Jiao et al., 2011; Magallon et al., 2015). Therefore, the major eudicot clades diverged in a relatively short period compared to their entire evolutionary history, which also constitutes a challenge for deciphering the gamma event.
Several studies have sought to narrow the phylogenetic placement of the gamma event, and it was determined to be shared by the core eudicots (Bowers et al., 2003; Jaillon et al., 2007; Lyons et al., 2008; Jiao et al., 2012; Ming et al., 2013). In contrast to this, a recent study reported that A. coerulea share an ancient tetraploid with core eudicots, and this tetraploid was hybridized with a diploid to form the gamma hexaploid (Aköz and Nordborg, 2019). However, another report re-identified the placement of the Aquilegia WGD and found that it is more likely to be lineage-specific (Shi and Chen, 2020). Besides, the ancient WGD of P. somniferum is still unclear. P. somniferum (high noscapine 1, HN1) genome sequencing and analyses suggested an ancient segmental or whole-genome duplication(s) that occurred in P. somniferum before the Papaveraceae-Ranunculaceae divergence (Guo et al., 2018). Another variety of P. somniferum (Chinese Herbal Medicine, CHM) genome sequencing project implied that Ranunculales may share one common WGD (Pei et al., 2021). Focusing on P. somniferum WGD, Shi and Chen used phylogenomic analyses of duplicated genes and proposed that the syntenic ratio is 2:2 between Aquilegia and Papaver (Shi and Chen, 2020), supporting the independent WGD of P. somniferum, but not shared by Aquilegia and Papaver.
Here, representative genomes from major clades of eudicots were selected for genomic hierarchical and event-related analyses. The study aims to clarify the early evolutionary history of eudicots, examine whether there is a common WGD after eudicots divergence from monocots, investigate the divergent evolutionary rates among the species under consideration, construct the multi-genomic homology information related to polyploidization and speciation, and explore the polyploidy nature of Ranunculales-common tetraploidy (RCT), Nelumbo-specific tetraploidy (NST), and core eudicot-common hexaploidy (ECH).
Results
Colinear Genes and Characterized Ks Distribution
According to the latest assembled genomic version, we found that the N. nucifera genome has better intragenomic homology than V. vinifera and A. coerulea, and it retains more colinear genes generated by ancestral WGD (Supplementary Tables 1, 2). For homologous blocks with at least four anchor gene pairs, N. nucifera has 392 blocks containing 6,471 colinear gene pairs. Under the same criteria, V. vinifera and A. coerulea have relatively few colinear genes. The intergenomic collinearity is better than intragenomic, and the intergenomic homologous regions between N. nucifera and V. vinifera were better preserved than between N. nucifera and A. coerulea or A. coerulea and V. vinifera (Supplementary Tables 1, 2). For homologous blocks with four or more colinear genes, we detected 994–1,352 regions between any two of these three eudicots. The least is between V. vinifera and A. coerulea, and the most is between N. nucifera and V. vinifera.
Based on the Ks divergence between each colinear gene pair within and among genomes, we found that the peak of the Ks distribution between N. nucifera duplicated gene pairs is at ~0.492 (Supplementary Table 3). The Ks peak in N. nucifera genome (0.492) is much smaller than in A. coerulea (1.030) and V. vinifera (1.029) (Figure 1A and Supplementary Figures 1A–C), indicating that NST is apparently younger than RCT and ECH. Previous studies have reported that NST occurred ~65 Mya (Ming et al., 2013; Gui et al., 2018; Shi et al., 2020). Ks peaks generated by the RCT are at divergent locations in A. coerulea and P. somniferum genomes, and the ancient Ks peak in P. somniferum is slightly larger than in A. coerulea (Figure 1A). This suggests that P. somniferum evolved faster than A. coerulea. The younger Ks peak of P. somniferum is at ~0.079, indicating Papaver-specific tetraploidy (PST) in addition to RCT.
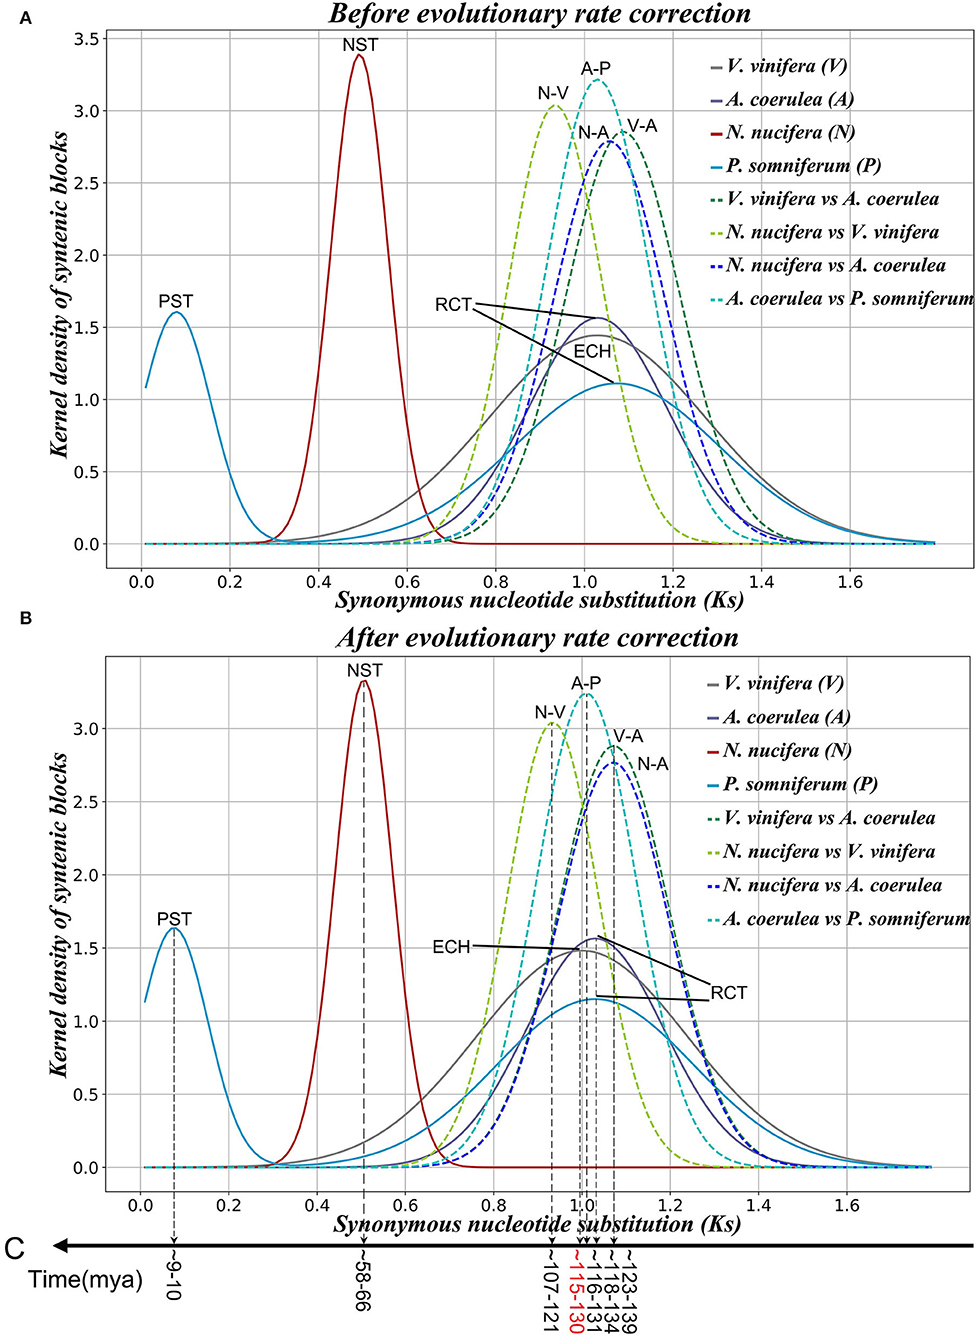
Figure 1. Ks distribution of colinear genes within and among genomes. (A) Before evolutionary rate correction. (B) After evolutionary rate correction. (C) Inferred ages of key evolutionary events.
Absence of ECH Event in Nelumbo, Macadamia, and Tetracentron Lineages
We constructed an intragenomic dot plot of N. nucifera and an intergenomic dot plot of N. nucifera and V. vinifera genomes, showing large homologous chromosomal blocks with the Ks medians of colinear gene pairs. The Ks medians of paralogous regions in N. nucifera genome are around 0.492, corresponding to the NST event (Figure 1A, Supplementary Figure 3, and Supplementary Table 3). The genomic colinear depth ratio is 1:1 within N. nucifera genome, that is, a N. nucifera gene (or chromosome region) corresponds to only one best matched homologous gene (or chromosome region) within the genome; just like the local dot plot show the region of N. nucifera chromosome 1 (49.99–67.52 Mb) corresponds to one best region is chromosome 3 (49.45–63.39 Mb) (Figure 2A). These homologous regions were generated by the more recent tetraploidy event in the ancestral genome of N. nucifera. Furthermore, comparative analysis of N. nucifera-V. vinifera dot plot identified the orthologous regions with Ks medians around 0.934, corresponding to the divergence of N. nucifera and V. vinifera (Figure 1A, Supplementary Figure 4, and Supplementary Table 3). The genomic colinear depth ratio of N. nucifera-V. vinifera is 2:3, that is, a pair of paralogous genes (or chromosomal regions) generated by NST in N. nucifera genome corresponds to three best matched genes (or orthologous regions) in V. vinifera (Figure 2B). The genomic colinear ratio confirms that there is no hexaploidization in N. nucifera, but a lineage-specific tetraploid event occurred at ~65 Mya (Jaillon et al., 2007; Jiao et al., 2011; Ming et al., 2013).
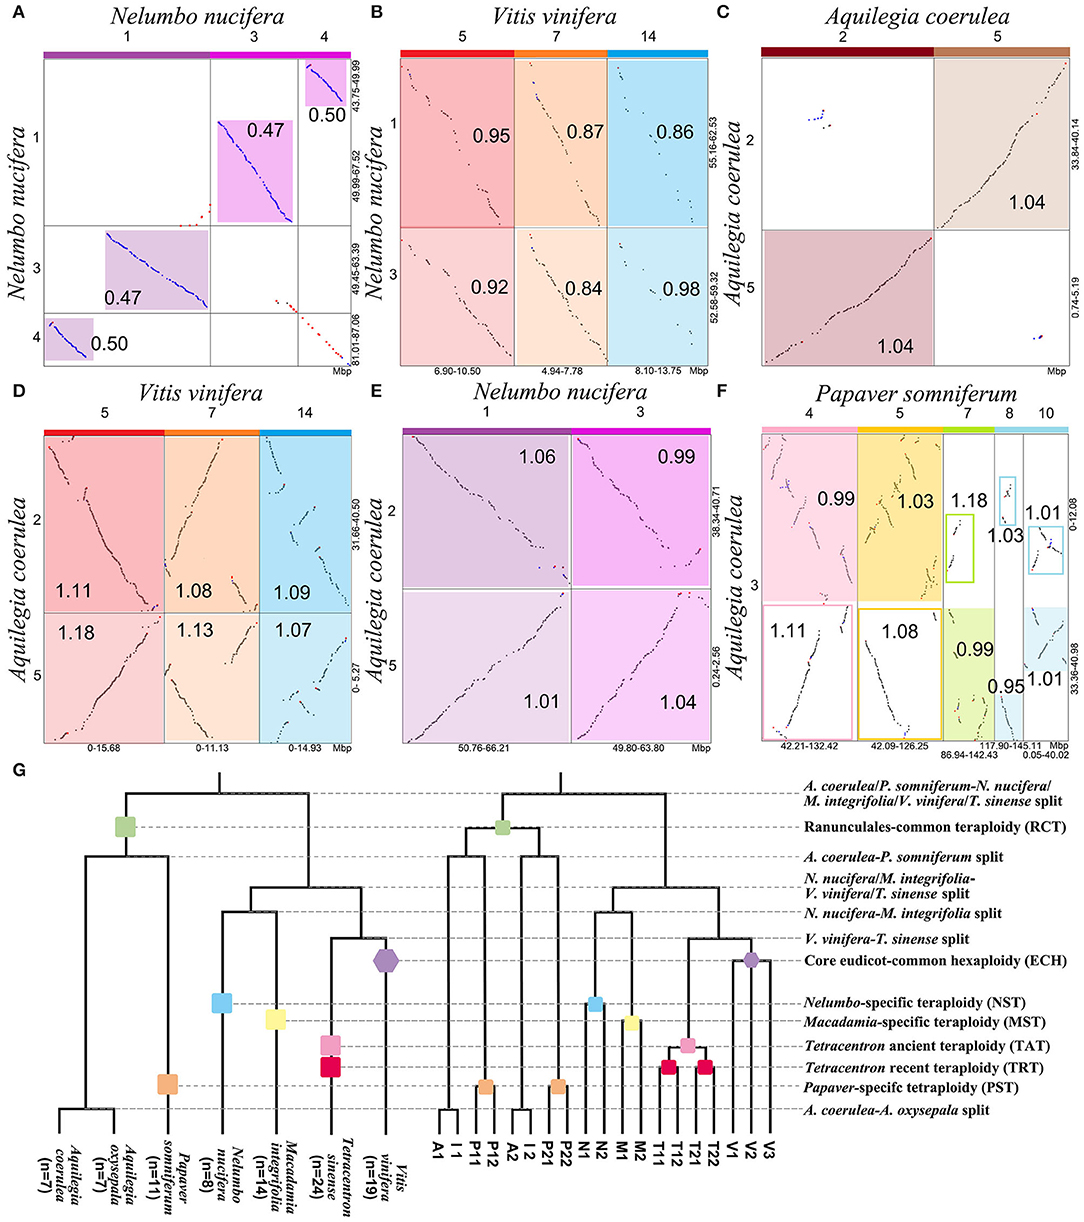
Figure 2. Intragenomic and intergenomic local dot plots and phylogenetic tree. Local dot plot and Ks medians (A) within N. nucifera, (B) between V. vinifera and N. nucifera, (C) within A. coerulea, (D) between V. vinifera and A. coerulea, (E) between N. nucifera and A. coerulea, and (F) between A. coerulea and P. somniferum. On the top of the local dot plots, the colored blocks represent the paralogous chromosomes produced by WGD. The highlighted areas of different brightness represent homologous regions, and the outparalogous regions between genomes are framed by solid lines. (G) Species and gene phylogenetic trees of A. coerulea (A), A. oxysepala (I), N. nucifera (N), P. somniferum (P), M. integrifolia (M), T. sinense (T), and V. vinifera (V). The phylogenetic relationship was based on the current accepted topology (Angiosperm Phylogeny Website). A number of three paralogous genes produced by the ECH in the V. vinifera genome are denoted by V1, V2, and V3, and each has two orthologous genes in N. nucifera, A. coerulea, and M. integrifolia, and four in P. somniferum and T. sinense.
When comparing N. nucifera and M. integrifolia genomes, we identified the orthologous regions related to the species divergence with Ks medians around 0.763 (Supplementary Figure 5). The colinear depth ratio of 2:2 was inferred between their genomes, indicating that a tetraploidy event occurred in M. integrifolia after diverged with the N. nucifera, that is, Macadamia-specific tetraploidy (MST). Besides, we identified the orthologous regions generated from the divergence of V. vinifera and T. sinense (Supplementary Figure 6). The colinear depth ratio between V. vinifera and T. sinense is 4:3, confirming that there were two T. sinense lineage-specific WGDs, namely, T. sinense-ancient tetraploidy (TAT) and T. sinense-recent tetraploidy (TRT), which is consistent with previous study (Liu et al., 2020). These comparisons strongly support that the Nelumbo, Macadamia, and Tetracentron lineages lack the paleohexaploidy (ECH) and the respective WGD events.
Ranunculales-Common Tetraploidization
Through the intragenomic structure comparison of A. coerulea, we found longer paralogous regions with Ks medians around 1.030, and the best intragenomic homologous match is 1:1 (Figure 1A, Supplementary Figure 7, and Supplementary Table 3). It confirms that A. coerulea underwent one tetraploidization event; for example, the best match of chromosome 2 is chromosome 5, and they are paralogous regions produced by RCT (Figure 2C). In the A. coerulea–V. vinifera dot plot, the orthologous regions with Ks medians are around 1.087, corresponding to the divergence of them (Figure 1A, Supplementary Figure 8, and Supplementary Table 3). The colinear depth ratio between the A. coerulea and V. vinifera genomes is 2:3, that is, a pair of paralogous genes (or chromosomal regions) generated by RCT in A. coerulea, corresponding to three best matched genes (or orthologous regions) in V. vinifera, just like Figure 2D shows. The result implies that an A. coerulea ancestral tetraploidization event occurred after splitting with V. vinifera, and the ECH only covers V. vinifera (core eudicots).
Furthermore, strong evidence was obtained by intergenomic comparison of A. coerulea and N. nucifera. The Ks medians between homologous regions are about 1.056 (Supplementary Figure 9 and Supplementary Table 3), corresponding to the divergence of A. coerulea and N. nucifera, and the colinear depth ratio between them is 2:2. For example, a pair of paralogous regions in A. coerulea chromosomes 2 and 5 correspond to two orthologous regions in N. nucifera chromosomes 1 and 3 (Figure 2E). The Ks peak of N. nucifera WGD is 0.492, this is, significantly younger than A. coerulea WGD (1.030) (Figure 1A and Supplementary Table 3). It strongly suggests that there is no shared WGD of N. nucifera and A. coerulea after the formation of eudicots, unlike previously reported that the WGD of A. coerulea is shared by all eudicots (Aköz and Nordborg, 2019). If the WGD of A. coerulea is shared by N. nucifera, the colinear depth ratio between them would be 2:4, conflicting with the Nelumbo, Macadamia, and Tetracentron lineages lack shared WGD events with A. coerulea.
Ranunculales shared an ancient tetraploidization. The Ks medians of homologous regions between A. coerulea and P. somniferum genomes are around 1.030, and the colinear depth ratio between them is 2:4 (Supplementary Figure 10). Comparing Ks values of homologous regions, we found a pair of paralogous genes (or chromosomal regions) generated by RCT in the A. coerulea genome correspond to the two best matched genes (or orthologous regions) in P. somniferum and two secondary genes (or outparalogous regions), just like the local dot plot shows (Figures 2F,G). The orthologous syntenic depth ratio supports a further WGD event of P. somniferum after RCT. The older is shared by A. coerulea and P. somniferum and is likely to be RCT, whereas the younger WGD occurred only in P. somniferum. As shown in Ks distribution, the Ks peaks of A. coerulea WGD and P. somniferum older WGD are close to the peak of A. coerulea–P. somniferum divergence. This suggests that they may have immediately diverged after the shared WGD, thus rendering it very difficult to time the WGD.
Phylogenomic Analysis
Phylogenetic analysis is used to further validate the polyploidizations. A constructed gene tree is considered to support a topology when the bootstrap support (BS) of the key node in the gene tree ≥50% (Figure 3). When investigating the RCT event, we constructed trees for 198 orthogroups, and each group had one pair of A. coerulea paralogous genes, at least three P. somniferum, one V. vinifera, and one N. nucifera orthologous genes to these A. coerulea genes. We detected that 45.96% (91/198) trees supporting the RCT occurred after the divergence of A. coerulea from N. nucifera and V. vinifera, whereas only 25.76% (51/198) trees supporting the RCT shared by A. coerulea and V. vinifera (Figures 3A,B,M and Supplementary Tables 5, 10). Among all trees that support T1 (Figure 3A), 34.07% (31/91) trees support RCT shared by A. coerulea and P. somniferum, and only 19.78 (18/91) trees support the RCT occurred after the divergence of A. coerulea from P. somniferum (Figures 3C,D,N and Supplementary Tables 6, 10). This is a significant support if similar analysis of grass was considered, because 31–37% of duplicated gene trees in different species support a grass-common WGD event (Paterson et al., 2004). Some trees have inconsistent topologies likely caused by divergent evolutionary rates of recursively duplicated genes. Then, to examine the NST and MST events, 174 trees for orthogroups were constructed, which containing one pair of N. nucifera paralogous genes, one pair of M. integrifolia paralogous genes, and at least one T. sinense and V. vinifera orthologous genes to the N. nucifera and M. integrifolia genes. A total of 81.03% (141/174) and 72.41% (126/174) trees support that the NST and MST are lineage-specific events (Figures 3E,F,O and Supplementary Tables 7, 10). Similarly, 192 trees of orthogroups were constructed, each of which have at least three paralogous genes of T. sinense, and one N. nucifera, A. coerulea, and V. vinifera orthologous genes. Eventually, 46.88% (90/192) trees support two Tetracentron-specific WGD events (TAT and TRT) (Figures 3H,P and Supplementary Tables 8, 10). Moreover, using the orthogroups which involving three ECH-related paralogous genes and at least one T. sinense, N. nucifera, and A. coerulea orthologous genes, we constructed 163 trees. Notably, 40.49% (66/163) trees likely support the ancestor of A. coerulea donated genes for the ECH-related paralogues (Figures 3J,Q and Supplementary Tables 9, 10).
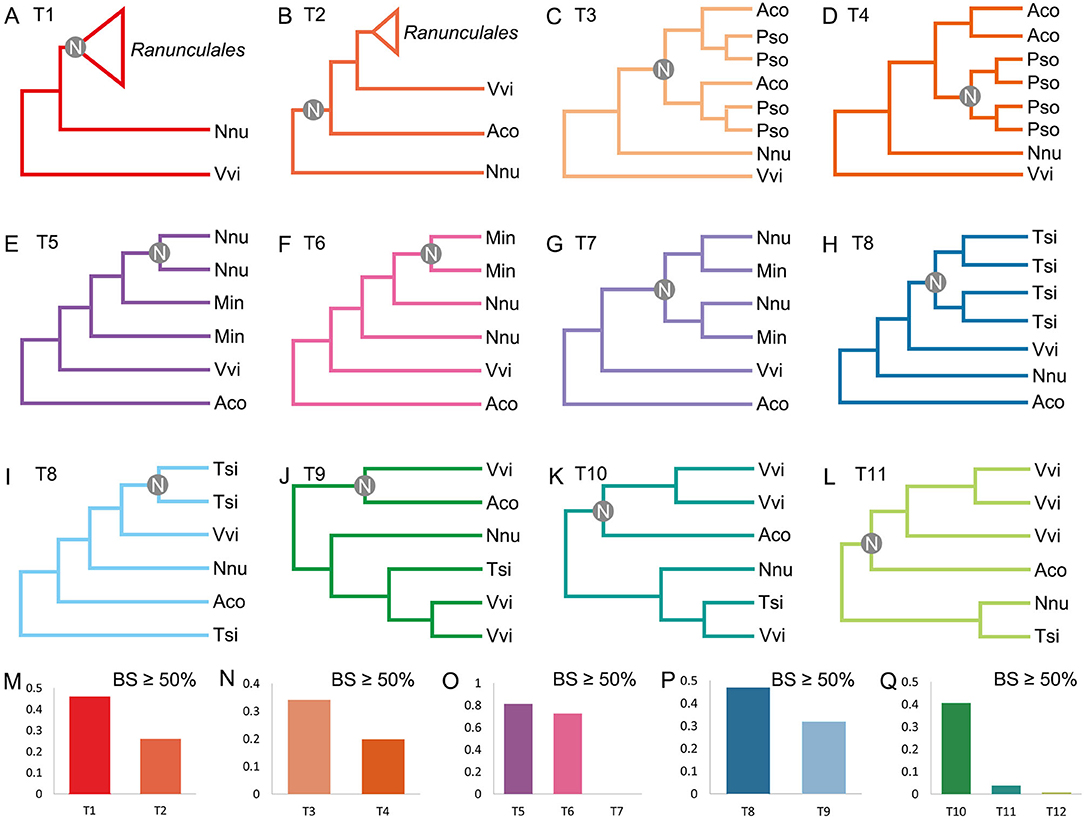
Figure 3. Possible topologies of gene trees and statistics of phylogenomic analysis. Topology support (A) WGDs of Ranunculales independently of other species, (B) a WGD shared by A. coerulea and V. vinifera, (C) RCT, (D) respective WGDs of A. coerulea and P. somniferum, (E) NST, (F) MST, (G) common WGD of N. nucifera and M. integrifolia, (H) two WGDs of T. sinense, (I) only one WGD of T. sinense, (J) A. coerulea provide one paralogous gene pair to V. vinifera, (K) A. coerulea provide two paralogous gene pairs to V. vinifera, (L) A. coerulea provide three paralogous gene pairs to V. vinifera. The key nodes are indicated by gray circles. (M–Q) Gene tree frequencies for different topologies, and BS of the key node is more than 50%. Ranunculales represents genes from species of Ranunculales, and Aco, Pso, Vvi, Nnu, Min, and Tsi represent genes from the genomes of A. coerulea, P. somniferum, V. vinifera, N. nucifera, M. integrifolia, and T. sinense, respectively. The x-axis labels T1 to T12 refer to the support for the topologies.
Multiple Genome Alignment to Construct a Framework for Eudicots
Using the V. vinifera genome as the reference, a multiple alignment table was established to store homologous information between and within the genomes (Supplementary Table 11). We filled all V. vinifera gene identifiers in the first column of the table and added the gene identifiers of other species, column by column, and species by species, according to the colinear relationships inferred by multiple alignments. If no gene loss occurs, each V. vinifera gene has two orthologous genes in the N. nucifera, M. integrifolia, A. coerulea, and A. oxysepala and four orthologous genes in P. somniferum and T. sinense genomes, respectively. When a gene was absent in the expected location (usually due to gene loss, translocation, or inadequate assembly), this is recorded in the corresponding cell. Finally, the multiple alignment table including 19 = (3+2+2+2+2+4+4) columns contains three subgenomes of V. vinifera, two subgenomes of N. nucifera, M. integrifolia, A. coerulea, and A. coerulea, and four subgenomes of P. somniferum and T. sinense, respectively. The table summarizes the results of multiple genome and event-related alignments and shows the paralogous genes (or chromosomal regions) produced by genome triplication and duplication, as well as orthologous genes (or chromosomal regions) established by species (Supplementary Figure 11). However, the multiple alignment table with V. vinifera genome as the reference cannot reflect the complete information of homologous collinearity. In particular, it cannot contain all the duplicated genes that are produced by specific WGD of basal eudicots. In other words, genes colinear to the V. vinifera genes in the basal eudicots may be lost. Therefore, we constructed another table with A. coerulea genome as the reference, as a complement to Supplementary Table 11 to better represent the composition of eudicot genes and to establish a framework for other eudicots (Supplementary Figure 12 and Supplementary Table 12).
Any local alignment at the genome level can use linear relationships to clearly show homology of chromosomal regions within and between genomes, and to see in detail the occurrence of gene loss or gene translocations. We selected local alignment regions with A. coerulea as the reference (Figure 4). A pair of paralogous regions generated by RCT in the A. coerulea genome were used. They correspond to two orthologous regions in N. nucifera and three in V. vinifera. In the local alignment regions, it can be discerned that some genes have colinear genes in each selected local chromosomal region, that is, some homologous genes are present in all expected chromosomal regions after species divergence or after WGD. However, there are a large number of genes without colinear genes at their expected locations on the corresponding chromosomes, revealing that widespread gene loss or translocation occurred in their ancestral genomes.
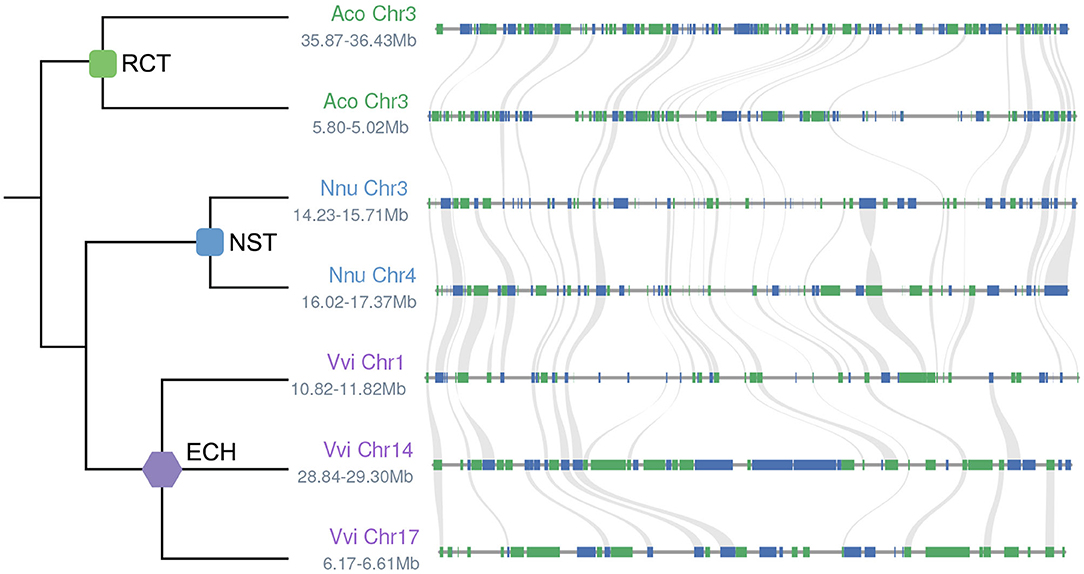
Figure 4. Local alignment in A. coerulea, N. nucifera, and V. vinifera genomes. The phylogeny of homologous regions is shown on the left. The chromosomes of A. coerulea (Vvi), N. nucifera (Nnu), and V. vinifera (Vvi) and the locations on chromosomes are shown on the left side of the chromosome segments. Genes are represented as rectangles and homologous genes between adjacent chromosomal regions are linked with gray curves.
Evolutionary Divergence and Dating
The kernel function analysis is used to distinguish different Ks distributions, and then, the main normal distributions in each observed Ks distribution are evaluated by linear combinations of several normal distribution functions. Eventually, each identified Ks peak is associated with an ancient evolutionary event (polyploidization or speciation) (Figure 1A and Supplementary Table 3). According to previous studies, the time of divergence between V. vinifera and N. nucifera was estimated to be ~125–135 Mya (Moore et al., 2010), and the gamma event occurred at ~115–130 Mya (Jiao et al., 2012). However, before evolutionary rate correction, the peak value of Ks between N. nucifera and V. vinifera is ~0.934 (±0.104), which is younger than the peak value of Ks in the V. vinifera genome is ~1.029 (±0.244), mainly because the evolutionary rate of N. nucifera is slower than V. vinifera.
To determine the age of polyploidization and speciation for selected species, we developed a model to correct diverged evolution rates (refer to Supplementary Text for details). After correction, the Ks peak between A. coerulea and N. nucifera or V. vinifera ~1.072 (±0.127) (Supplementary Table 4) corresponds to the ancestral divergence of A. coerulea and V. vinifera/N. nucifera. Based on the occurrence time of gamma ~115–130 Mya (Jiao et al., 2012), we deduced that the divergence time of A. coerulea and N. nucifera/V. vinifera was ~123–139 Mya (Figures 1B,C). The NST occurred at ~58–66 Mya, close to the previously reported time of ~54–74 Mya (Ming et al., 2013), at the K-P boundary. The RCT event shared by A. coerulea and P. somniferum was slightly later than the divergence of A. coerulea and V. vinifera or N. nucifera, occurring at ~118–134 Mya. Not long after the RCT event, divergence of A. coerulea and P. somniferum occurred at ~116–131 Mya, and the PST event was at ~9–10 Mya (Figures 1B,C). Notably, after correction, the Ks peak of N. nucifera-V. vinifera divergence at 0.934 (±0.104) was still younger than ECH peak at 1.000 (±0.238), implying that some sister groups of core eudicots (like the ancestor of A. coerulea) could donate the genes to ECH hexaploid.
Genomic Fractionation
With V. vinifera genome as the reference, it is clear that extensive genomic fractionation occurs after WGD events (NST and RCT). For example, using V. vinifera chromosome 1 as the outgroup, 61 and 57% of V. vinifera genes were not found at the respective colinear locations in N. nucifera duplicated regions generated by NST, and 47% of V. vinifera genes had no colinear genes in N. nucifera expected duplicated regions (Supplementary Table 13). With V. vinifera chromosome 1 as the reference, more gene loss or translocation occurred in each or both subgenomes of A. coerulea produced by RCT (Supplementary Table 14). Using the A. coerulea genome as the reference, N. nucifera and V. vinifera genome fractionation were also explored (Supplementary Tables 15, 16), and extensive genomic fractionation occurs after WGD events (NST and ECH).
The amount and length of gene loss or translocation may occur in an almost random manner and can be described by an extremely approximate geometric distribution. Taking the V. vinifera genome as the reference, the distributions of different gene loss regions observed in N. nucifera and A. coerulea were fitted by using geometric distribution curves of different densities (Figures 5A,B and Supplementary Table 17). In addition, taking A. coerulea as the reference, the distributions of different gene loss regions observed in V. vinifera and N. nucifera were fitted (Figures 5C,D and Supplementary Table 17). Comparing the difference in geometric distribution curves between species, we found that the longer of genes were lost, the greater of deviation between the observed number and the number predicted by theory. To reveal the potential mechanisms and scales of genomic fractionation, we counted the number of continuously removing genes at the colinear locations of each genome corresponding to the reference genome. Most of the removing genes constitute “small runs,” with one or two removing genes in succession (Figure 5). As a mutual reference, we compared the small runs of V. vinifera and A. coerulea and found that A. coerulea has more small runs, suggesting that there may be more recent (or ongoing) gene loss in A. coerulea to destroy genomic collinearity.
Figure 5. Geometric distributions of gene loss rates fitting: (A) N. nucifera to the V. vinifera genome, (B) A. coerulea to the V. vinifera genome, (C) V. vinifera to the A. coerulea genome, and (D) N. nucifera to the A. coerulea genome. The x-axis indicates numbers of continuously missing genes in gene collinearity regions.
Unbalanced Fractionation Between the WGDs Homoeologous Regions
Three Unbalanced V. vinifera Subgenomes
By comparing the duplicated regions of the V. vinifera genome corresponding to each chromosome in A. coerulea, we identified three sets of paralogous chromosomes generated by ECH and found similar gene loss or transfer rates (Supplementary Table 15). With each of the seven chromosomes of A. coerulea as the reference, respectively, the differences in gene loss rates of paralogous regions in V. vinifera are <0.05, and the mean difference in loss rates is 0.02. When using chromosomes 5 and 7 of A. coerulea as the reference, there are paralogous regions in V. vinifera with almost identical gene loss rates. The greatest difference in gene loss rate between the paralogous regions of V. vinifera is 0.04. It seems that paralogous chromosomes generated by ECH have balanced gene loss rates, consistent with previous findings suggesting no significant differences in gene retention between duplicated chromosomal regions (Tang et al., 2008). However, detailed studies of gene retention and loss level using sliding windows along chromosomes suggest that regions of duplicated chromosomes may originate from three unbalanced subgenomic divergences. Aligned with the reference genome, local regions show variation in gene retention ~0–31.68% (Supplementary Figure 13).
We further compared the retention levels of the three V. vinifera subgenomes (A1, A2, and A3) generated by ECH according to one gene as a step with a sliding window of 100 genes. Using the N. nucifera genome as the reference, there were only 58.34, 58.22, and 65.53% homologous sliding windows for A1-A2, A1-A3, and A2-A3, respectively, showing no significant difference (less than 5% difference in gene retention rates: p < 0.05) in genomic fractionation (Supplementary Table 18). Then, we employed the recently proposed polyploidy index (P-index) as a mathematical quantitative indicator to infer the evolutionary types of polyploids (Wang et al., 2019a). Based on phylogenetic inference, N. nucifera is relatively close to V. vinifera, so we chose the N. nucifera genome as the reference, yielding a P-index of 0.46 for ECH (Supplementary Table 19). It supports that the three subgenomes generated by ECH are divergent, which shows an allopolyploid nature.
Two Unbalanced N. nucifera Subgenomes
With V. vinifera chromosomes as the reference, we compared the paralogous regions in N. nucifera produced by NST and found nine chromosomes with gene loss rates difference > 0.05 (Supplementary Table 13). Using seven A. coerulea chromosomes as the reference, we found that no paralogous chromosomes in N. nucifera have a gene loss rate difference > 0.05 (Supplementary Table 16). Perhaps using the whole chromosomes from reference genome to compare the gene loss rate, there is no significant difference between homologous regions. Their difference may be hidden. Thus, we also used sliding windows along chromosomes to identify the balance of duplicated chromosome regions gene retention and loss level. It is found that the regions of duplicated chromosomes may originate from two unbalanced subgenomic fractionation. Aligning with the reference genome, the local regions show a change in gene retention rates ~0–69.31% (Supplementary Figures 14A,B). Further, with the V. vinifera genome as the reference, we compared the retention levels of the two N. nucifera subgenomes generated by NST under the same criteria and found that the window with no significant difference was only 39.13% (p < 0.05) (Supplementary Table 18). The P-index for NST was calculated as 0.52 (Supplementary Table 19), with V. vinifera as the outgroup, which also demonstrates the allopolyploid nature.
Two Unbalanced A. coerulea Subgenomes
Similarly, with V. vinifera chromosomes as the reference, we found that the two duplicated regions of A. coerulea produced by RCT often have divergent gene loss rates. For 17 of the 19 V. vinifera chromosomes, the gene loss rate difference between two A. coerulea duplicated regions is >0.05 (Supplementary Table 14). We also used sliding windows to show the unbalanced gene retention level, revealing that the A. coerulea have two unbalanced subgenomic fractionation (Figure 6). Aligning with the reference genome, the local regions show a change in gene retention rates ~0–69.39%. Furthermore, with the N. nucifera genome as the reference, we compared the retention levels of the two A. coerulea subgenomes generated by RCT under the same criteria and found that the window with no significant difference was only 37.67% (p < 0.05) (Supplementary Table 18). With N. nucifera as the outgroup, we calculated the P-index for RCT as 0.39 (Supplementary Table 19). However, considering that N. nucifera genome has more specific chromosomal rearrangements (Gui et al., 2018), the V. vinifera genome was taken as the additional reference, and the P-index for RCT is 0.66, suggesting that the allopolyploid nature of RCT event.
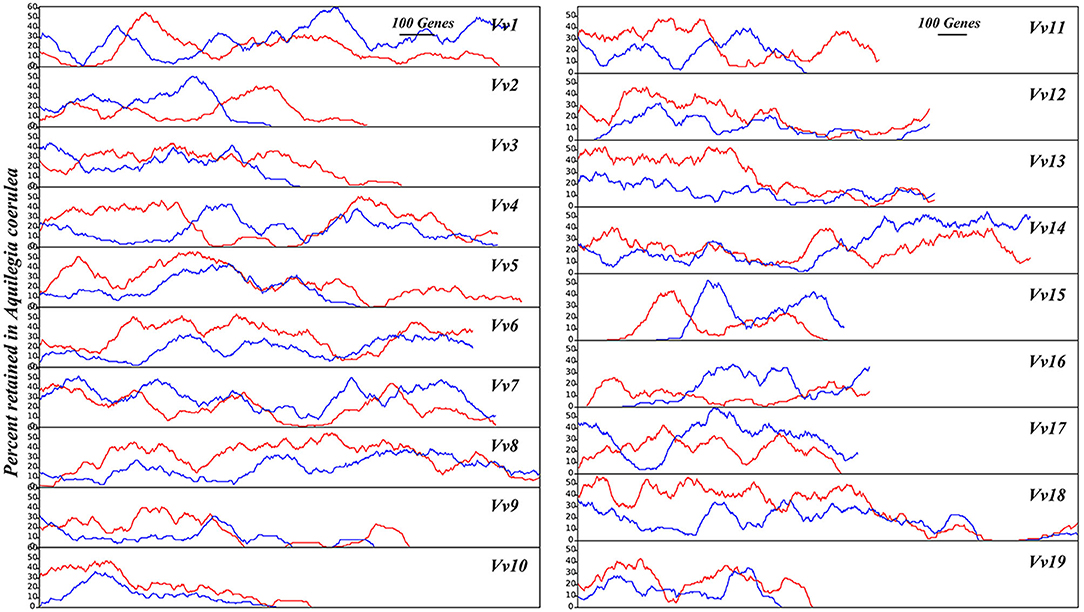
Figure 6. A. coerulea gene retention along corresponding orthologous V. vinifera chromosomes. Using the V. vinifera chromosomes as the reference, with 100 genes as a sliding window, the percentage of gene retention in two sets of A. coerulea subgenomes is shown in red and blue lines, respectively.
Discussion
Polyploidization Events During the Early Diversification of Eudicots
Recursive polyploidy is common in plants and it is the key driving force for species diversification, contributing to genetic innovation and adaptation to extreme environments (Jiao et al., 2011; Van de Peer et al., 2017; Landis et al., 2018). With the completion of genome sequencing and resequencing, many WGD events have been identified, such as the 1,000 transcriptome sequencing analysis, which identified 244 WGDs at different locations in the phylogeny of green plants at one time (Leebens-Mack et al., 2019). However, the timing of WGDs occurring at rapidly diverging nodes remains a huge challenge as shown by several recent studies which generated controversial results regarding WGDs that occur in the early stage of rapid eudicot diversification. The central question is whether there was a shared WGD event in all eudicots (Aköz and Nordborg, 2019, 2020; Liu et al., 2020; Shi and Chen, 2020). Here, we integrated genomic structure, phylogenetic, and Ks distribution analysis and performed genomic hierarchical and event-related alignments to infer homology between and among representative species of the eudicots. The results strongly suggest that there was no shared WGD across all eudicots. The paleohexaploid resulting from the gamma event (ECH) is the only common ancestor of the core eudicots. Indeed, the WGD (RCT) in A. coerulea is particularly old and is shared with P. somniferum, almost at the base of eudicots divergence, but not shared by Proteales.
Eudicot plants appeared on Earth about 130–150 Mya (Jiao et al., 2011; Magallon et al., 2015) and the sister groups of core eudicots diverged from the core eudicots in a relatively short period, maybe within only several million years (Bell et al., 2010; Magallon et al., 2015). As shown above, we dated the RCT and ECH events as occurring independently, and they are close to the divergence of Ranunculales from other eudicots. In addition, the A. coerulea–P. somniferum divergence occurred shortly after the RCT. The evolutionary events occurring at rapid diverging nodes present a challenge in terms of timing them accurately, mainly due to the limited extent of DNA sequence divergence information retained by existing species. As a result, most of the gene trees obtained from phylogenetic analysis do not have sufficient resolution to effectively support the judgment of evolutionary relationships (Jiao et al., 2012; Chanderbali et al., 2017; Shi and Chen, 2020). Our previously developed pipeline which integrates genomic homologous dot plots, Ks distribution of colinear genes, and phylogenetic genomic analysis is an appropriate tool for these WGD events (Wang et al., 2018b). In addition, polyploidization often produced a large number of duplicated genes, complex chromosomal rearrangements, and duplicated gene loss (Soltis et al., 2015; Murat et al., 2017; Wang et al., 2017, 2018b, 2019b), which hinders the inference of polyploidy history, and can lead to problematic conclusions.
We found that the colinear depth ratio of A. coerulea–P. somniferum is 2:4 (Supplementary Figure 10). However, Shi and Chen proposed that the colinear depth ratio is 2:2 (Shi and Chen, 2020). This conflicts due to P. somniferum undergoing complex chromosome rearrangement, and a large amount of duplicated gene loss, resulting in that they only identified the recent WGD event (Guo et al., 2018; Shi and Chen, 2020). The ancient WGD of P. somniferum may have lost more duplicated genes than the recent WGD, thus mixing together the 4DTV peak of homologous genes produced by large- and small-scale genomic duplications. Moreover, sequencing analyses of CHM genome suggested that P. somniferum underwent two WGDs and the ancient one was shared with A. coerulea, and only the 4DTV peaks and paralog peaks are available as evidence to support this (Pei et al., 2021). Therefore, in addition to comparative genomic and phylogenetic analyses, we counted the RCT- and PST-produced colinear blocks in P. somniferum. They covered 60.69 and 82.39% of the genome, respectively, which is very similar to the two identified WGDs (ξ and η events) produced blocks of Selaginella reported in previous studies, covering 64.8 and 76.7% of the genome, respectively (for details, refer to Supplementary Text; Wang et al., 2020b). These comparisons supported that the two rounds duplication of P. somniferum are two whole-genome duplication events, rather than one WGD and one segmental duplication.
Event-Related Alignment of Selected Eudicots
Identification of gene homology relationships in plant genomes is extremely difficult due to large-scale chromosomal reorganization following recurring polyploidy events (Soltis et al., 2014, 2015). After reconstructing the WGD events during the early diversification of eudicots, we selected representative species of eudicots for intragenomic and intergenomic comparisons and constructed multiple genome alignment of A. coerulea, N. nucifera, and V. vinifera associated with polyploidization and speciation. The constructed alignment was shown by a homologous gene list, including orthologous produced by species divergence and paralogous produced by ancestral polyploidization events. This list of homologous collinearity genes can provide a valuable genomic platform for researchers, to search for the functional genes (or gene families) which are related to the economically and agriculturally important traits and investigate the origin of genes, functional innovations, and the phylogenetic relationships of involving families and regulatory pathways in multiple species. Moreover, this event-related alignment provides a general framework for the alignment analysis of eudicots and others, and new genome aligning information could be convenient to add in this alignment.
Gene Loss and Retention
Homologous chromosomal regions produced by polyploidization may have substantial gene loss and translocation. A. coerulea, N. nucifera, and V. vinifera retained only a small fraction of the duplicated genes generated by polyploidization after RCT, NST, and ECH events, respectively. Large-scale duplicated gene losses following polyploidization have been recognized (Long et al., 2003; Mitchell-Olds and Schmitt, 2006; Soltis et al., 2016). This phenomenon has been further confirmed in cotton (Wang et al., 2016), legumes (Wang et al., 2017), and Cucurbitaceae (Wang et al., 2018b). Genome fractionation accumulated by small runs of lost genes (Schnable et al., 2011; Wang et al., 2017) and the length of fractionated regions grows with time. This may reflect the direction of evolution to some extent and helps polyploids eventually become stable, but this hypothesis needs to be tested. With selected reference genomes, we found that gene loss in V. vinifera, N. nucifera, and A. coerulea occurred randomly and could almost be described by geometric distributions. However, the actual pattern of gene loss could be more complex, as there was an obvious deviation of the data from the random distribution. Natural selection, convergent evolution, and domestication could be changing the patterns of genes loss in certain regions, and this needs to be investigated in the future with appropriate methods.
Divergent Genomic Evolutionary Rates
Here, the distributions of synonymous nucleotide substitutions at synonymous sites (Ks) of colinear genes were employed to compare the divergence levels of genomic evolutionary rates. We found the significantly divergent evolutionary rates among the considered species after the polyploidization and speciation events. This situation widely exists in many other angiosperm lineages, such as the families of Cucurbitaceae (Wang et al., 2018b), Fabaceae (Wang et al., 2017), Malvaceae (Wang et al., 2019b), Apiaceae (Wang et al., 2020a), and Poaceae (Wang X. et al., 2015). As previous studies demonstrated, the divergent evolutionary rates could be caused by the differentiation difference in duplicated genes produced by polyploidization (Soltis et al., 2015); for example, the maize genome has a faster evolution rate than other grasses, which may be driven by its specific WGD (Wang X. et al., 2015). Among the Ranunculales, P. somniferum evolved faster than A. coerulea, which perhaps influenced by the PST event. In addition, previous studies suggested that N. nucifera evolved slower than V. vinifera, pointing to the evolutionary rates may be influenced by the living environment of species (Ming et al., 2013; Wang et al., 2017). The high divergence evolutionary rates among different species may affect the evaluation of phylogenetic relationships and the age of evolutionary events, hindering our understanding of the origin and evolution of species and some genes with important trait. Therefore, we emphasize taking the evolutionary events with the same age shared by species as the correction benchmark, correcting the key polyploidization and speciation events other than the correction benchmark, and then infer the relatively accurate evolutionary of studied species.
Hypothetical Paleo-Allopolyploidization
Depending on how polyploids are formed, they can be classified as autopolyploids and allopolyploids, mainly because of the different origins of the subgenomes. If the reports about the nature of polyploidy are relatively accurate, allopolyploidy may be more common in the process of plant evolution, especially in favor of the emergence of large plant groups (Ramsey and Schemske, 2002). Previous studies suggested that V. vinifera and N. nucifera may be allo-paleopolyploid (Aköz and Nordborg, 2019; Shi et al., 2020). Here, we confirmed again by the genomic fractionation patterns between subgenomes in V. vinifera and N. nucifera. This also demonstrated that the genomic fractionation of allopolyploid and autopolyploid shows two different states of imbalance and balance, respectively, and the robustness of P-indices for “diagnosing” the nature of polyploidies (Wang et al., 2019a). Using the similar method, we inferred the likely allopolyploid nature of RCT event.
Allopolyploids have a heterosis and higher offspring survival rates (Ramsey and Schemske, 2002), which may provide more opportunities for plant diversity, and our study also supports the role of allopolyploidy in speciation of early clades of eudicots. Thereby, the three allopolyploidy (ECH, NST, and RCT) events are associated with the establishment of the major clades of eudicots. The divergence between V. vinifera and N. nucifera is still earlier than the ECH event after evolutionary rate correction (Figure 1B), which may be due to the donation of A. coerulea to gamma hexaploidy. Additionally, the results of phylogenetic analysis also seem to support this hypothesis, as the previous studies proposed “two-step duplication” model, the sister group (likely ancestor of A. coerulea) of core eudicots hybridized with the ancestor of core eudicots to form gamma hexaploid (Ming et al., 2013; Chanderbali et al., 2017). This is different from the recent hypothesis that gamma hexaploidy originated from the hybridization of ancestral tetraploid of all eudicots and one diploid (Aköz and Nordborg, 2019). Nevertheless, we are still not confident enough to determine the origin of gamma hexaploidy, because it remains hardly difficult to exclude the result of reticular hybridization, partial genomic introgression, parallel evolution, and incomplete lineage sorting (ILS) during the early diversification of eudicots.
Materials and Methods
Materials
We downloaded genomic sequences and annotations from the relevant websites of genome projects, for which complete information can be found in Supplementary Table 22.
Inferring Gene Collinearity
Gene collinearity indicates that the genes and gene order among genomes are conservative to some extent, which can reflect the homologous chromosomal structure of the shared ancestor; it is essential for understanding genomic changes, especially in inferring the evolution of complex plant genomes. First, protein sequences are searched for potential homologous genes (E < 1e-5) by performing BLASTP (Altschul et al., 1990). Second, gene homology information was used as input to ColinearScan (Wang et al., 2006) to locate colinear gene pairs. The key parameter, the maximum gap, was set at 50 intervention genes as per the approach taken in previous genomic research (Wang et al., 2018b). We compared A. coerulea, N. nucifera, and V. vinifera genomes and identified the intragenomic and intergenomic colinear genes. Colinear genes preserved in modern genomes can provide important genetic homologous imprints to reveal ancient evolutionary events.
Synonymous Substitutions
Using the Bioperl Statistical module, synonymous nucleotide substitutions on synonymous sites (Ks) were estimated through the Nei–Gojobori approach (Nei and Gojobori, 1986).
Identification of the Genomic Homology and the Polyploidy-Produced Subgenomes
To identify the genomic homology including paralogy within genomes and orthology between genomes, we performed the genome colinear dot plots integrated with the Ks medians of colinear gene pairs in homologous chromosomal regions (Supplementary Figures 3–10). The orthologous and paralogous chromosomal regions were identified by comparing the Ks values of colinear regions related to the species divergence and specific polyploidy events. When identifying subgenomes generated by polyploidization, a genome unaffected by that polyploidy event is required as a reference and the reference genome has good assembly quality. There are fragmented orthologous regions between the reference genome and the considered genome, and these orthologous regions can be sequentially assigned to different subgenomes. The chromosomes with higher gene losses were inferred to be from a sensitive subgenome, whereas the others from a dominant subgenome (Schnable et al., 2011). If the reconstructed chromosomes show no difference in gene loss, they were assigned arbitrarily to each subgenome.
Calculation of the P-Index
To infer the possible nature of polyploids, the degree of divergence among polyploid subgenomes was estimated by previously developed statistics, the polyploidy-index (P-index) (Wang et al., 2019a). The P-index value would fall in the range of [0–1]. When the value is infinitely close to 0, it indicates that there is almost the same genomic fractionation level between subgenomes; on the contrary, when the value is infinitely close to 1, it shows that one of the subgenomes has an absolutely fractionation advantage. Previous studies have demonstrated that the robustness of P-indices for “diagnosing” the nature of polyploidies, which is supported by considering the P-indices > 0.3, including several known or previously inferred paleo-allopolyploids of Brassica napus, Zea mays, Gossypium hirsutum, and Brassica oleracea (Schnable et al., 2011; Chalhoub et al., 2014; Li et al., 2014; Wang M. et al., 2015; Renny-Byfield et al., 2017), whereas the small values point to several paleo-autopolyploids of Glycine max, Populus trichocarpa, and Actinidia chinensis (Liu et al., 2017; Wang et al., 2017, 2018a). Therefore, we could infer the evolutionary types of polyploids and assess their evolutionary impact based on a P-index threshold of 0.3. The detailed P-index calculation scheme here is as follows.
First, when calculating P-index, a reference genome was employed to infer orthologous regions with the studied genome, and identifying the potential gene losses or translocations in each of the inferred subgenomes produced by an ancient polyploidization event. A well-assembled, rare specific genomic rearrangement, and evolutionarily close genome could serve as an ideal reference genome for estimating the p-index value of considered genome. For example, using N. nucifera and V. vinifera as reference genomes, respectively, the p-index of RCT events was calculated. N. nucifera is evolutionarily close to Ranunculus, and V. vinifera has less genome rearrangement. Then, the subgenomes of a considered polyploidy-affected genome were mapped onto a selected reference genome, which is not affected by the polyploidization event. Assuming that there were K chromosomes in the reference genome, the subgenomes A and B identified in the considered genome. Regardless of whether one dominates, each pair of homoeologous chromosomes was divided into NC Windows with M (such as 100) genes. For the i-th window of a specific homoeologous chromosome pair, the gene retention rate Ai and Bi relative to the reference genome was obtained, and thus, the P-index value was conferred as follows:
which would fall in the range of [0–1]. The shorter chromosomes in reference genome retain fewer colinear genes, leading to greater volatility. Thus, each chromosome is estimated with:
Windows with similar or excessively different gene retention rates would affect the evaluation. To remove them, the evaluation coefficient was defined as follows:
in which the gene retention difference level is defined as follows:
Topology Tree Construction
To clarify the WGD events of selected genomes, we used MEGA X (Kumar et al., 2018) to construct topology trees with homologous genes from multiple genome alignment lists. The maximum likelihood algorithm was employed to construct the gene trees using nucleotide sequences, and the bootstrap value was set to 1,000 to test the stability of the constructed gene trees, the gap was set as “Use all sites,” and the model was set as “Tamura-Nei model.” Based on the multi-genomic alignment homologous gene lists, we selected specific collinearity-based orthogroups to verify considered polyploidization events, respectively. The orthogroups selected to construct the gene trees should include those paralogues generated from the specific WGD events to be examined, as much as possible that the genes are generated from same ancestral chromosomes of considered genomes, excluding lineage-specific genes (selected orthogroups for inferring polyploidization events are described in Phylogenomic Analysis). In addition, some homologous genes were selected from other species that have not experienced the polyploidy events to be verified. Finally, for different evolutionary events, we constructed the gene trees. The independent or shared polyploidy events can be determined by the phylogenetic position of paralogous genes in the topology trees.
Other Methods
Description of details about the “Kernel function analysis of Ks” and “Evolutionary rate correction” can be found in the “Supplementary Text.”
Data Availability Statement
The original contributions presented in the study are included in the article/Supplementary Material, further inquiries can be directed to the corresponding author/s.
Author Contributions
JinW conceived and led the research. JT implemented and coordinated the analysis. CW, SS, QX, YY, and YH performed the analysis. JianW, WG, JT, JinW, and LZ wrote the paper. All authors contributed to the article and approved the submitted version.
Funding
We appreciate the financial support from the China National Science Foundation (31501333 and 32170236 to JinW) and the Natural Science Foundation of Hebei Province (C20209064 and C2015209069 to JinW).
Conflict of Interest
The authors declare that the research was conducted in the absence of any commercial or financial relationships that could be construed as a potential conflict of interest.
Publisher's Note
All claims expressed in this article are solely those of the authors and do not necessarily represent those of their affiliated organizations, or those of the publisher, the editors and the reviewers. Any product that may be evaluated in this article, or claim that may be made by its manufacturer, is not guaranteed or endorsed by the publisher.
Acknowledgments
We thank Shoutong Bao, Yishan Feng, and Yan Zhang for helpful discussions about the article, and Jigao Yu for guidance on software, and Yanli Wang, Chunyang Wu, and Wenbo Xu for downloading and processing the genomic data.
Supplementary Material
The Supplementary Material for this article can be found online at: https://www.frontiersin.org/articles/10.3389/fpls.2022.883140/full#supplementary-material
References
Aköz, G., and Nordborg, M. (2019). The Aquilegia genome reveals a hybrid origin of core eudicots. Genome Biol. 20, 1–12. doi: 10.1186/s13059-019-1888-8
Aköz, G., and Nordborg, M. (2020). Response to “A reappraisal of the phylogenetic placement of the Aquilegia whole-genome duplication”. Genome Biol. 21, 1–2. doi: 10.1186/s13059-020-02211-z
Altschul, S. F., Gish, W., Miller, W., Myers, E. W., and Lipman, D. J. (1990). Basic local alignment search tool. J. Mol. Biol. 215, 403–410. doi: 10.1016/S0022-2836(05)80360-2
Bell, C. D., Soltis, D. E., and Soltis, P. S. (2010). The age and diversification of the angiosperms re-revisited. Am. J. Bot. 97, 1296–1303. doi: 10.3732/ajb.0900346
Bowers, J. E., Chapman, B. A., Rong, J., and Paterson, A. H. (2003). Unravelling angiosperm genome evolution by phylogenetic analysis of chromosomal duplication events. Nature 422, 433–438. doi: 10.1038/nature01521
Bremer, B., Bremer, K., Chase, M. W., Fay, M. F., Reveal, J. L., Soltis, D. E., et al. (2009). An update of the angiosperm phylogeny group classification for the orders and families of flowering plants: APG III. Bot. J. Linn. Soc. 161, 105–121. doi: 10.1111/j.1095-8339.2009.00996.x
Byng, J. W., Chase, M. W., Christenhusz, M. J. M., Fay, M. F., Judd, W. S., Mabberley, D. J., et al. (2016). An update of the angiosperm phylogeny group classification for the orders and families of flowering plants: APG IV. Bot. J. Linn. Soc. 181, 181–120. doi: 10.1111/boj.12385
Chalhoub, B., Denoeud, F., Liu, S., Parkin, I. A. P., Tang, H., Wang, X., et al. (2014). Early allopolyploid evolution in the post-Neolithic Brassica napus oilseed genome. Science 345, 950–953. doi: 10.1126/science.1260782
Chanderbali, A. S., Berger, B. A., Howarth, D. G., Soltis, D. E., and Soltis, P. S. (2017). Evolution of floral diversity: genomics, genes and gamma. Philos. Trans. R. Soc. B 372, 20150509. doi: 10.1098/rstb.2015.0509
Gui, S., Peng, J., Wang, X., Wu, Z., Cao, R., Salse, J., et al. (2018). Improving Nelumbo nucifera genome assemblies using high-resolution genetic maps and BioNano genome mapping reveals ancient chromosome rearrangements. Plant J. 94, 721–734. doi: 10.1111/tpj.13894
Guo, L., Winzer, T., Yang, X., Li, Y., Ning, Z., He, Z., et al. (2018). The opium poppy genome and morphinan production. Science 362, 343–347. doi: 10.1126/science.aat4096
Jaillon, O., Aury, J. M., Noel, B., Policriti, A., Clepet, C., Casagrande, A., et al. (2007). The grapevine genome sequence suggests ancestral hexaploidization in major angiosperm phyla. Nature 449, 463–467. doi: 10.1038/nature06148
Jiao, Y., Leebens-Mack, J., Ayyampalayam, S., Bowers, J. E., McKain, M. R., McNeal, J., et al. (2012). A genome triplication associated with early diversification of the core eudicots. Genome Biol. 13, 1–14. doi: 10.1186/gb-2012-13-1-r3
Jiao, Y., and Paterson, A. H. (2014). Polyploidy-associated genome modifications during land plant evolution. Philos. Trans. R. Soc. B 369, 20130355. doi: 10.1098/rstb.2013.0355
Jiao, Y., Wickett, N. J., Ayyampalayam, S., Chanderbali, A. S., Landherr, L., Ralph, P. E., et al. (2011). Ancestral polyploidy in seed plants and angiosperms. Nature 473, 97–100. doi: 10.1038/nature09916
Kumar, S., Stecher, G., Li, M., Knyaz, C., and Tamura, K. (2018). MEGA X: molecular evolutionary genetics analysis across computing platforms. Mol. Biol. Evol. 35, 1547–1549. doi: 10.1093/molbev/msy096
Landis, J. B., Soltis, D. E., Li, Z., Marx, H. E., Barker, M. S., Tank, D. C., et al. (2018). Impact of whole-genome duplication events on diversification rates in angiosperms. Am. J. Bot. 105, 348–363. doi: 10.1002/ajb2.1060
Leebens-Mack, J. H., Barker, M. S., Carpenter, E. J., Deyholos, M. K., Gitzendanner, M. A., Graham, S. W., et al. (2019). One thousand plant transcriptomes and the phylogenomics of green plants. Nature 574, 679–685. doi: 10.1038/s41586-019-1693-2
Li, F., Fan, G., Wang, K., Sun, F., Yuan, Y., Song, G., et al. (2014). Genome sequence of the cultivated cotton Gossypium arboreum. Nat. Genet. 46, 567–572. doi: 10.1038/ng.2987
Li, Z., Baniaga, A. E., Sessa, E. B., Scascitelli, M., Graham, S. W., Rieseberg, L. H., et al. (2015). Early genome duplications in conifers and other seed plants. Sci. Adv. 1, e1501084. doi: 10.1126/sciadv.1501084
Liu, P., Zhang, X., Mao, J., Hong, Y., Zhang, R., Nie, S., et al. (2020). The Tetracentron genome provides insight into the early evolution of eudicots and the formation of vessel elements. Genome Biol. 21, 1–30. doi: 10.1186/s13059-020-02198-7
Liu, Y., Wang, J., Ge, W., Wang, Z., Li, Y., Yang, N., et al. (2017). Two highly similar poplar paleo-subgenomes suggest an autotetraploid ancestor of salicaceae plants. Front. Plant Sci. 8, 571. doi: 10.3389/fpls.2017.00571
Long, M., Betrán, E., Thornton, K., and Wang, W. (2003). The origin of new genes: glimpses from the young and old. Nat. Rev. Genet. 4, 865–875. doi: 10.1038/nrg1204
Lyons, E., Pedersen, B., Kane, J., Alam, M., Ming, R., Tang, H., et al. (2008). Finding and comparing syntenic regions among Arabidopsis and the outgroups papaya, poplar, and grape: CoGe with Rosids. Plant Physiol. 148, 1772–1781. doi: 10.1104/pp.108.124867
Magallon, S., Gomez-Acevedo, S., Sanchez-Reyes, L. L., and Hernandez-Hernandez, T. (2015). A metacalibrated time-tree documents the early rise of flowering plant phylogenetic diversity. N. Phytol. 207, 437–453. doi: 10.1111/nph.13264
Ming, R., VanBuren, R., Liu, Y., Yang, M., Han, Y., Li, L., et al. (2013). Genome of the long-living sacred lotus (Nelumbo nucifera Gaertn.). Genome Biol. 14, 1–11. doi: 10.1186/gb-2013-14-5-r41
Mitchell-Olds, T., and Schmitt, J. (2006). Genetic mechanisms and evolutionary significance of natural variation in Arabidopsis. Nature 441, 947–952. doi: 10.1038/nature04878
Moore, M. J., Soltis, P. S., Bell, C. D., Burleigh, J. G., and Soltis, D. E. (2010). Phylogenetic analysis of 83 plastid genes further resolves the early diversification of eudicots. Proc. Natl. Acad. Sci. U.S.A. 107, 4623–4628. doi: 10.1073/pnas.0907801107
Murat, F., Armero, A., Pont, C., Klopp, C., and Salse, J. (2017). Reconstructing the genome of the most recent common ancestor of flowering plants. Nat. Genet. 49, 490–496. doi: 10.1038/ng.3813
Nei, M., and Gojobori, T. (1986). Simple methods for estimating the numbers of synonymous and nonsynonymous nucleotide substitutions. Mol. Biol. Evol. 3, 418–426. doi: 10.1093/oxfordjournals.molbev.a040410
Nock, C. J., Baten, A., Mauleon, R., Langdon, K. S., Topp, B., Hardner, C., et al. (2020). Chromosome-scale assembly and annotation of the Macadamia genome (Macadamia integrifolia HAES 741). Genes Genomes Genet. 10, 3497–3504. doi: 10.1534/g3.120.401326
Paterson, A. H., Bowers, J. E., Chapman, B. A., and Phillips, R. L. (2004). Ancient polyploidization predating divergence of the cereals, and its consequences for comparative genomics. Proc. Natl. Acad. Sci. U.S.A. 101, 9903–9908. doi: 10.1073/pnas.0307901101
Pei, L., Wang, B., Ye, J., Hu, X., Fu, L., Li, K., et al. (2021). Genome and transcriptome of Papaver somniferum Chinese landrace CHM indicates that massive genome expansion contributes to high benzylisoquinoline alkaloid biosynthesis. Hortic. Res. 8, 1–13. doi: 10.1038/s41438-020-00435-5
Puchta, H., Dujon, B., and Hohn, B. (1996). Two different but related mechanisms are used in plants for the repair of genomic double-strand breaks by homologous recombination. Proc. Natl. Acad. Sci. U.S.A. 93, 5055–5060. doi: 10.2307/38902
Ramsey, J., and Schemske, D. W. (2002). Neopolyploidy in flowering plants. Annu. Rev. Ecol. Syst. 33, 589–639. doi: 10.1146/annurev.ecolsys.33.010802.150437
Renny-Byfield, S., Rodgers-Melnick, E., and Ross-Ibarra, J. (2017). Gene fractionation and function in the ancient subgenomes of maize. Mol. Biol. Evol. 34, 1825–1832. doi: 10.1101/095547
Schnable, J. C., Springer, N. M., and Freeling, M. (2011). Differentiation of the maize subgenomes by genome dominance and both ancient and ongoing gene loss. Proc. Natl. Acad. Sci. U.S.A. 108, 4069–4074. doi: 10.1073/pnas.1101368108
Shi, T., and Chen, J. (2020). A reappraisal of the phylogenetic placement of the Aquilegia whole-genome duplication. Genome Biol. 21, 1–5. doi: 10.1186/s13059-020-02212-y
Shi, T., Rahmani, R. S., Gugger, P. F., Wang, M., Li, H., Zhang, Y., et al. (2020). Distinct expression and methylation patterns for genes with different fates following a single whole-genome duplication in flowering plants. Mol. Biol. Evol. 37, 2394–2413. doi: 10.1093/molbev/msaa105
Soltis, D. E., Visger, C. J., Marchant, D. B., and Soltis, P. S. (2016). Polyploidy: pitfalls and paths to a paradigm. Am. J. Bot. 103, 1146–1166. doi: 10.3732/ajb.1500501
Soltis, D. E., Visger, C. J., and Soltis, P. S. (2014). The polyploidy revolution then…and now: Stebbins revisited. Am. J. Bot. 101, 1057–1078. doi: 10.3732/ajb.1400178
Soltis, P. S., Marchant, D. B., Van de Peer, Y., and Soltis, D. E. (2015). Polyploidy and genome evolution in plants. Curr. Opin. Plant Biol. 35, 119–125. doi: 10.1016/j.pbi.2005.01.001
Tang, H., Wang, X., Bowers, J. E., Ming, R., Alam, M., and Paterson, A. H. (2008). Unraveling ancient hexaploidy through multiply-aligned angiosperm gene maps. Genome Res. 18, 1944–1954. doi: 10.1101/gr.080978.108
Van de Peer, Y., Mizrachi, E., and Marchal, K. (2017). The evolutionary significance of polyploidy. Nat. Rev. Genet. 18, 411–424. doi: 10.1038/nrg.2017.26
Vision, T. J., Brown, D. G., and Tanksley, S. D. (2000). The origins of genomic duplications in Arabidopsis. Science 290, 2114–2117. doi: 10.1126/science.290.5499.2114
Wang, J., Qin, J., Sun, P., Ma, X., Yu, J., Li, Y., et al. (2019a). Polyploidy index and its implications for the evolution of polyploids. Front. Genet. 10, 807. doi: 10.3389/fgene.2019.00807
Wang, J., Sun, P., Li, Y., Liu, Y., Yang, N., Yu, J., et al. (2018b). An overlooked paleotetraploidization in Cucurbitaceae. Mol. Biol. Evol. 35, 16–26. doi: 10.1093/molbev/msx242
Wang, J., Sun, P., Li, Y., Liu, Y., Yu, J., Ma, X., et al. (2017). Hierarchically aligning 10 legume genomes establishes a family-level genomics platform. Plant Physiol. 174, 284–300. doi: 10.1104/pp.16.01981
Wang, J., Yu, J., Li, J., Sun, P., Wang, L., Yuan, J., et al. (2018a). Two likely auto-tetraploidization events shaped kiwifruit genome and contributed to establishment of the actinidiaceae family. iScience 7, 230–240. doi: 10.1016/j.isci.2018.08.003
Wang, J., Yu, J., Li, Y., Wei, C., Guo, H., Liu, Y., et al. (2020b). Sequential paleotetraploidization shaped the carrot genome. BMC Plant Biol. 20, 52. doi: 10.1186/s12870-020-2235-7
Wang, J., Yu, J., Sun, P., Li, C., Song, X., Lei, T., et al. (2020a). Paleo-polyploidization in Lycophytes. Genomics Proteomics Bioinf. 18, 333–340. doi: 10.1016/j.gpb.2020.10.002
Wang, J., Yuan, J., Yu, J., Meng, F., Sun, P., Li, Y., et al. (2019b). Recursive paleohexaploidization shaped the durian genome. Plant Physiol. 179, 209–219. doi: 10.1104/pp.18.00921
Wang, M., Liu, C., Xing, T., Wang, Y., and Xia, G. (2015). Asymmetric somatic hybridization induces point mutations and indels in wheat. BMC Genomics 16, 807. doi: 10.1186/s12864-015-1974-6
Wang, X., Guo, H., Wang, J., Lei, T., Liu, T., Wang, Z., et al. (2016). Comparative genomic de-convolution of the cotton genome revealed a decaploid ancestor and widespread chromosomal fractionation. N. Phytol. 209, 1252–1263. doi: 10.1111/nph.13689
Wang, X., Shi, X., Hao, B., Ge, S., and Luo, J. (2005). Duplication and DNA segmental loss in the rice genome: implications for diploidization. N. Phytol. 165, 937–946. doi: 10.1111/j.1469-8137.2004.01293.x
Wang, X., Shi, X., Li, Z., Zhu, Q., Kong, L., Tang, W., et al. (2006). Statistical inference of chromosomal homology based on gene colinearity and applications to Arabidopsis and rice. BMC Bioinf. 7, 447. doi: 10.1186/1471-2105-7-447
Wang, X., Wang, J., Jin, D., Guo, H., Lee, T. H., Liu, T., et al. (2015). Genome alignment spanning major poaceae lineages reveals heterogeneous evolutionary rates and alters inferred dates for key evolutionary events. Mol. Plant 8, 885–898. doi: 10.1016/j.molp.2015.04.004
Xie, J., Zhao, H., Li, K., Zhang, R., Jiang, Y., Wang, M., et al. (2020). A chromosome-scale reference genome of Aquilegia oxysepala var. kansuensis. Hortic. Res. 7, 1–13. doi: 10.1038/s41438-020-0328-y
Keywords: Aquilegia coerulea, Nelumbo nucifera, Vitis vinifera, hierarchical alignment, gene colinearity, polyploidization
Citation: Teng J, Wang J, Zhang L, Wei C, Shen S, Xiao Q, Yue Y, Hao Y, Ge W and Wang J (2022) Paleopolyploidies and Genomic Fractionation in Major Eudicot Clades. Front. Plant Sci. 13:883140. doi: 10.3389/fpls.2022.883140
Received: 24 February 2022; Accepted: 27 April 2022;
Published: 31 May 2022.
Edited by:
Da-Cheng Hao, Dalian Jiaotong University, ChinaReviewed by:
Jacob B. Landis, Cornell University, United StatesDequan Zhang, Dali University, China
Fei Gao, Minzu University of China, China
Copyright © 2022 Teng, Wang, Zhang, Wei, Shen, Xiao, Yue, Hao, Ge and Wang. This is an open-access article distributed under the terms of the Creative Commons Attribution License (CC BY). The use, distribution or reproduction in other forums is permitted, provided the original author(s) and the copyright owner(s) are credited and that the original publication in this journal is cited, in accordance with accepted academic practice. No use, distribution or reproduction is permitted which does not comply with these terms.
*Correspondence: Weina Ge, gwn-06@163.com; Jinpeng Wang, wangjinpeng@ibcas.ac.cn
†These authors have contributed equally to this work