 Jian Hui
 Haibo Bai
 Shuhua Li
- Ningxia Key Laboratory of Agricultural Biotechnology, Agricultural Biotechnology Research Center, Ningxia Academy of Agriculture and Forestry Science, Yinchuan, Ningxia, China
Wheat is one of the most important food crops in the world and drought can severely impact on wheat productivity. The identification and deployment of genes for improved water use efficiency (WUE) can help alleviate yield loss under water limitation. In this study, a high-density genetic linkage map of wheat recombinant inbred lines (Ningchun 4 x Ningchun 27) containing 8751 specific locus amplified fragment (SLAF) tags (including 14757 SNPs), with a total map distance of 1685 cM and an average inter-marker map distance of 0.19 cM was constructed by SLAF-seq technology. The economic yield WUE and nine related traits under three water treatments was monitored over four years. The results showed that loci conditioning WUE were also associated with grain carbon isotope discrimination (CID), flag leaf chlorophyll content, plant height, 1000-grain weight, grain weight per spike and grain number per spike. One locus on chromosome 2B explained 26.3% WUE variation in multiple environments. Under good soil moisture conditions before flowering, the high CID genotype QWue.acn-2BNingchun 27, was associated with WUE, high grain weight per spike, and kilo-grain weight. Under rain-fed conditions, the low CID genotype QWue.acn-2BNingchun 4 tended to maintain more spike number and was associated with improved WUE and yield. The introduction of good chromosome fragments of QWue.acn-2B into elite lines by molecular marker assisted selection will boost up the cultivation of high-yield and water-saving wheat varieties.
Introduction
Wheat, as a staple food for about 40% of the world’s population, is one of the most important food crops, with the largest sown area and the widest distribution in the world (Acevedo et al., 2018). Drought is an increasingly important environmental factor restricting the productivity of wheat. With diminishing water resources for irrigation, improving yield under drought has become the main breeding goal for many crops (Sivamani et al., 2000). Breeding wheat varieties with high water use efficiency of economic yield is a major measure to increase productivity, especially under water-limited conditions (Ehdaie and Waines, 1993). At present, the cultivation of water-efficient varieties is generally carried out from two aspects: Leaf WUE or Population WUE and related agronomic traits (such as plant height, yield, and yield related traits) (Hsiao, 2000; Narasimhamoorthy et al., 2006; Kuneg et al., 2007). For leaf WUE, the two main parameters are considered, including intrinsic water use efficiency (WUEi) and instantaneous water use efficiency (WUEinst). The former is the ratio of net photosynthetic rate (Pn) to stomatal conductance (gs), which is used to evaluate the effect of genotype on plants, while the latter is the ratio of leaf Pn to transpiration rate (Tr), which is mainly used to estimate the impact of environmental factors on plants (Fischer and Turner, 1978; Gago et al., 2014; Franks et al., 2015; Khler et al., 2015). Population WUE was divided into biological yield WUE (Biomass/Total water consumption during growth period) and economic yield WUE (Economic yield/Total water consumption during growth period). From the perspective of breeding and agricultural production, screening and utilization of WUE genotypes with higher economic yield is a powerful means to address the contradiction between drought and high yield.
Drought induces a series of adaptive changes in the structure, physiology and biochemistry of cells in crops, resulting in differences in growth and development, whereas some morphological changes can affect economic WUE and yield. It has been reported that grain filling rate, grain yield, number of grains per ear, and 1000-grain weight under drought stress are effective indicators for the identification of crop drought resistance and water use efficiency (Li and Pan, 2005). There was a significant positive correlation between wheat canopy temperature depression below air temperature and stomatal conductance and yield (Amani et al., 2010), and under variable field conditions, the SPAD (Soil and plant analysis development) value of flag leaves was significantly positively correlated with yield (Islam et al., 2014). SPAD value and canopy temperature can be useful indicators for drought stress tolerance (Srivastava et al., 2017) of different wheat genotypes (Balota et al., 1999), and can also be used to predict wheat WUE and yield. For wheat, dwarf genes can enhance wheat lodging resistance, improve harvest index (Richards, 1992), and indirectly affect WUE. Previous studies have found that Rht1, Rht2 and Rht3 genes have negative effects on WUE (Ehdaie and Waines, 1994), while Rht13 and Rht8 genes have positive effects on WUE (Yan and Zhang, 2017). Currently, carbon isotope discrimination (Δ or CID) is widely used as an indirect assessment of the water status of C3 crops under water-limited conditions. A negative correlation between Δ and WUE was confirmed in multiple C3 species (Farquhar and Richards, 1984; Hubick et al., 1986; Hubick and Farquhar, 1989; Condon et al., 1990; Hall et al., 1990; Hall et al., 1992; Ismail and Hall, 1992; Rebetzke et al., 2002; Lambrides et al., 2004; Rytter, 2005). However, this conclusion is usually obtained in pot conditions or at the level of single plant and single leaf, and is less relevant to the relationship between Δ, WUE and yield at the population level. In fact, WUE of leaf does not always translate into higher crop WUE or yield (Condon et al., 2004). CID and grain yield differ depending on material source, tissue site, sampling time and water status can be positive, neutral or negative (Condon et al., 2002; Monneveux et al., 2005; Xing et al., 2007; Khazaei and Mohammady, 2010). It has been reported that Δ usually decreases from the oldest part of the plant to the youngest part under different water conditions (Hubick and Farquhar, 1989; Acevedo, 1993), and the mature grain is the most suitable part for measuring Δ. Compared with the leaf of Δ, the grain of Δ has higher generalized heritability, better correlation with harvest index and grain yield, can reflect the efficiency of carbon allocation to grain, and well predict yield (Merah et al., 2001).
Molecular biology and genomics have become major tools for dissecting trait potential and unearthing genes for trait improvement (Kole et al., 2015; Henry et al., 2018). Analysis of shoot δ13C (a natural isotope of carbon) of the Chinese Spring wheat-Betzes barley disomic addition line indicated that a gene controlling WUE was carried on chromosome 4H (Handley et al., 1994). A study of “chinese spring” group D chromosome substitution lines showed that the wheat chromosome 7D increased WUE (Gorny, 1999). Using Δ as as an indicator of WUE, the QTL controlling transpiration efficiency was mapped on the ERECTA marker on chromosome 2, and the ERECTA gene was cloned from Arabidopsis thaliana, it regulates transpiration efficiency by changing leaf stomatal number and leaf structure (Masle et al., 2005). It has been reported that genes associated with high photosynthetic rate and high WUE were detected on chromosome arms 1AL, 2AL, 2AS and 7AS, In addition, 2AL had a gene that controlled a low transpiration rate (Zhang and Shan, 2000). Three wheat mapping populations grown under well-watered conditions were used to identify identical or overlapping loci for numerous quantitative trait loci (QTL) for canopy temperature and leaf porosity and plant height (Rebetzke et al., 2013). These research studies provide a reference for utilization of high WUE genes for drought resistance in wheat, but they do not specify the impact of genes/QTL on economic yield.
QTL mapping studies can be used to identify molecular markers closely linked with functional genes and even the functional genes themselves, which provides a shortcut for molecular marker-assisted (MAS) breeding of high WUE materials (varieties) (Pinto et al., 2010; Sun et al., 2017; Yadav et al., 2022). Amongst molecular markers, SNPs markers are the most numerous, widely distributed and highly polymorphic, allowing the construction of high-density genetic maps that are conducive to the accurate positioning of QTLs. SLAF-seq is a high-throughput sequencing-based method for large-scale genotyping (Sun et al., 2013), which can obtain DNA fragments of specific length (SLAF tags) by restriction enzyme digestion. The advantages of this method include high throughput, high accuracy, low cost, and short cycle and has been successfully applied to many species such as crops, vegetables, forest trees and aquatic products (Zhang et al., 2013; Wei et al., 2014; Zhu et al., 2016; Hu et al., 2016; Yin et al., 2018; Zhang et al., 2020; Wei et al., 2020). At present, there are few reports on population-level mapping of wheat economic water use efficiency traits. In this study, SLAF-seq technology was used to construct a high-density genetic map of wheat recombinant inbred lines (RIL) that were evaluated for agronomic WUE-related phenotypes over multiple years.
Materials and methods
Plant materials
The F10:11 recombinant inbred lines (n=128) were derived from a cross between bread wheat Ningchun 4 and Ningchun 27. Ningchun 4 is the main variety in Ningxia Yellow River irrigation area, with high and stable yield and Ningchun 27 is the main variety planted in the dry land in the mountainous area of Southern Ningxia, with strong drought tolerance. They are the backbone materials of wheat breeding in Ningxia province, China. The former has higher WUE under irrigation conditions and lower WUE under dry farming conditions, and the latter is just the opposite. Genomic DNA for the SLAF-seq was extracted from young leaves at seedling stage of parents and RILs using the cetyltrimethylammonium bromide (CTAB) method.
Test design
The experiments were conducted in the Ningxia irrigation area (Yongning County: 1144 m above sea level, 150-200 mm annual rainfall, 1700-1900 mm evaporation, and less than 100 mm rainfall during the growth period of spring wheat), and the Ningxia rain fed area (Yuanzhou District: altitude 1567 m, annual rainfall 300-400 mm, evaporation 1700-1900 mm, rainfall 180-300 mm during the growth period of spring wheat). The climatic characteristics of the test site in the wheat growing season are shown in Supplementary Table S1. RILs were planted in plots, with 6 rows in each plot, a length of 3 m, a row spacing of 0.15 m, and a plot area of 2.7 m2. The field trial design used randomized complete block design. RILs were randomly arranged in each trial treatment and repeated twice.
Three treatments were designed among which two (T1 & T2) were irrigated and one (T3) was rainfed.Two water treatments were set in the irrigated area: normal irrigation (T1): irrigated a total of four times during the growth period at the tillering, jointing, heading and filling stages with 1200 m3/ha, 900 m3/ha, 900 m3/ha and 600 m3/ha, respectively. The irrigation quota was 3600 m3/ha. Water stress treatment after heading (T2): the plots were irrigated as described above the tillering and jointing stages (total irrigation of 2100 m3/ha). A water measuring weir was used to measure and control the amount of irrigation water. There was a protection area more than 5 m around the test area, and the agricultural film was pressed into a depth of 2 m to prevent lateral water leakage. In rain fed areas, no irrigation was used during the whole wheat growth period: rain-fed only (T3). Field irrigation amount of wheat under different treatments were listed in Supplementary Table S2.
Measurements of agronomic and physiological traits
Traits and measurement time are presented in Supplementary Table S3. The specific measurement methods of traits are as follows.
CT measurements: 15 days after flowering (milky stage), Model 2958 infrared thermometer (Spectrum Technologies Inc.) was used to measure the temperature of the wheat canopy in each plot three times from 13:00 to 15:00 in the afternoon of sunny days, and the mean value was recorded.
LCC measurements: 15 days after flowering (milky stage), the flag leaves of 10 wheat plants randomly selected from each plot were measured with a SPAD-502 chlorophyll meter (Spectrum Technologies Inc.), and the mean value was recorded.
SNUA and GYUA measurements: the number of spikes in the middle two rows of each plot at maturity was determined, and this was converted to the number of spikes per hectare. After harvest, plot yields were determined and converted into yield per hectare.
PH, FSN, KGW, GWS and GNS measurements: 10 plants were sampled from each plot at the maturity stage for testing, and the average value of each agronomic trait was taken. WUE calculation: grain yield/water consumption (ET) was used to calculate the economic yield and WUE of each variety for each treatment, and the water balance method was used to estimate ET, ET= (WH + R + E) - (WK+ F + N), where ET is crop water consumption; WH is the water storage in a two meters soil layer at the time of sowing; R is the sum of rainfall and irrigation during the growth period; E is the amount of water entering a two meters soil layer from the lower soil layer; WK is the water storage in two meters soil layer at harvest; F is the amount of water penetrating below two meters; N is runoff.
CID measurements: at maturity, 20 plants were randomly calibrated for each line, and the mixed grains were used as the samples to be tested. After the samples were washed with distilled water, they were dried at 70 °C for 48 hours to a constant weight, ground into a 100 mesh sieve, and put into a 1.5ml centrifuge tube. Bast (Beijing) Institute of desertification control technology was entrusted to determine the carbon isotopic composition of wheat samples with mat XP isotope mass spectrometer (δ13C), with PDB (PEE Dee belemnite) as the standard. δ13C formula is calculated as follows: δ13C (‰) = [(Rsample/RPDB - 1) × 1000] (R is 13C/12C ratio), and the calculation formula of carbon parity discrimination (△ or CID) is: △ (‰) = [(δ13Cair - δ13Csample) ×1000]/(1 + δ13Csample), where, δ13Cair = - 8‰ (Farquhar et al., 1989).
QTL analysis
SLAF-seq analysis was conducted by Biomarker Technologies Corporation (Address:12 Fuqian Street, Shunyi District, Beijing, China). The library was sequenced using the Illumina HiSeq platform. A high-density genetic map was drawn by HighMap software (Li et al., 2008). Multi-environmental traits were mapped using the additive effect model (ICIM-ADD) of IciMapping 4.2 software for complete interval mapping, and the QTL mapping function was used to convert the recombination rate to genetic distance (cM) using the Kosambi mapping function with a scan step size of 1 cM, a LOD critical value of 2.5, and using statistical detection threshold of P=0.001. Standard naming of QTL in wheat according to the standard nomenclature described in the Cataloque of Gene Symbols for wheat (Mcintosh et al., 2013), for example, QPh.acn-4D.1 was the first QTL associated with plant height on chromosome 4D, which was detected by Agricultural Biotechnology Research Center of Ningxia (ACN). Major QTLs were defined as those having a phenotypic variation explanation rate (PVE) of greater than 10%. The relative position and genetic positions of QTLs on chromosomes were drawn by R 4.1.0 and MG2C_v2.1 (Chao et al., 2021), respectively.
Data processing
A mixed linear model was used, with year as a random factor, and strain and treatment as fixed factors, to obtain the best linear estimator (BLUE value) of WUE of each variety and its main related traits. R studio version 4.1 was used to plot WUE and to generate the correlation heatmap of the main agronomic and physiological traits.
Results
Genetic map construction
For the SLAF-seq analysis, the average sequencing depth of parents was 18.8X, including 20.0X for Ningchun 4, 17.6X for Ningchun 27 and 6.3X for the offspring. A total of 1,270,454 SLAF tags were developed, including 186,087 polymorphic SLAF tags, with a polymorphism ratio of 14.65%. A total of 89968 (aa×bb type) SLAF tags suitable for wheat RILs were developed. After removing markers with low quality, low depth, low coverage and very significant partial separation, 8751 SLAF tags (including 14,757 SNPs) were finally obtained for genetic map construction. By comparing with the reference genome (IWGSC RefSeq v1.0: https://urgi.versailles.inra.fr/download/iwgsc/IWGSC_RefSeq_Annotations/v1.0/), the SLAF tags were divided into 21 linkage groups representing the 21 wheat chromosomes. The linear arrangement of markers in the linkage group was analyzed by HighMap software, and the genetic distance between adjacent markers was estimated. Finally, a genetic map with a total map distance of 1685.32 cM and an average map distance of 0.19 cM was obtained (Figure 1). The number of linkage group markers ranged from 53 (2D) to 1020 (2A), and the average genetic distance ranged from 0.06 cM (1B) to 0.69 cM (7D). The lowest proportion of gap length less than 5 cM in the linkage group was 97.73% (7D), the highest was 100% (3A, 3B, 6A, 6B and 7A), and the maximum gap was between 11.62 cM (1A) and 3.58 cM (6B). A total of 194 markers (2.2% of the total) with partial segregation were included in the construction of the map. The proportion of double exchange of markers in each linkage group was very low, ranging from 0.02% (1B) to 0.39% (5B), and the proportion of deletions ranged from 1.19% (1B) to 18.19% (6B). Spearman rank correlation coefficient revealed that the correlation coefficient between the sequence of markers of each linkage group of the determined map and their position in the reference genome is high, indicating that the map is of high quality. The marker number, total map distance, average map distance, gap < 5 cM ratio, maximum gap, the number of partial segregation markers, double exchange ratio, deletion rate, and collinearity correlation coefficient of each linkage group are shown in Table 1.
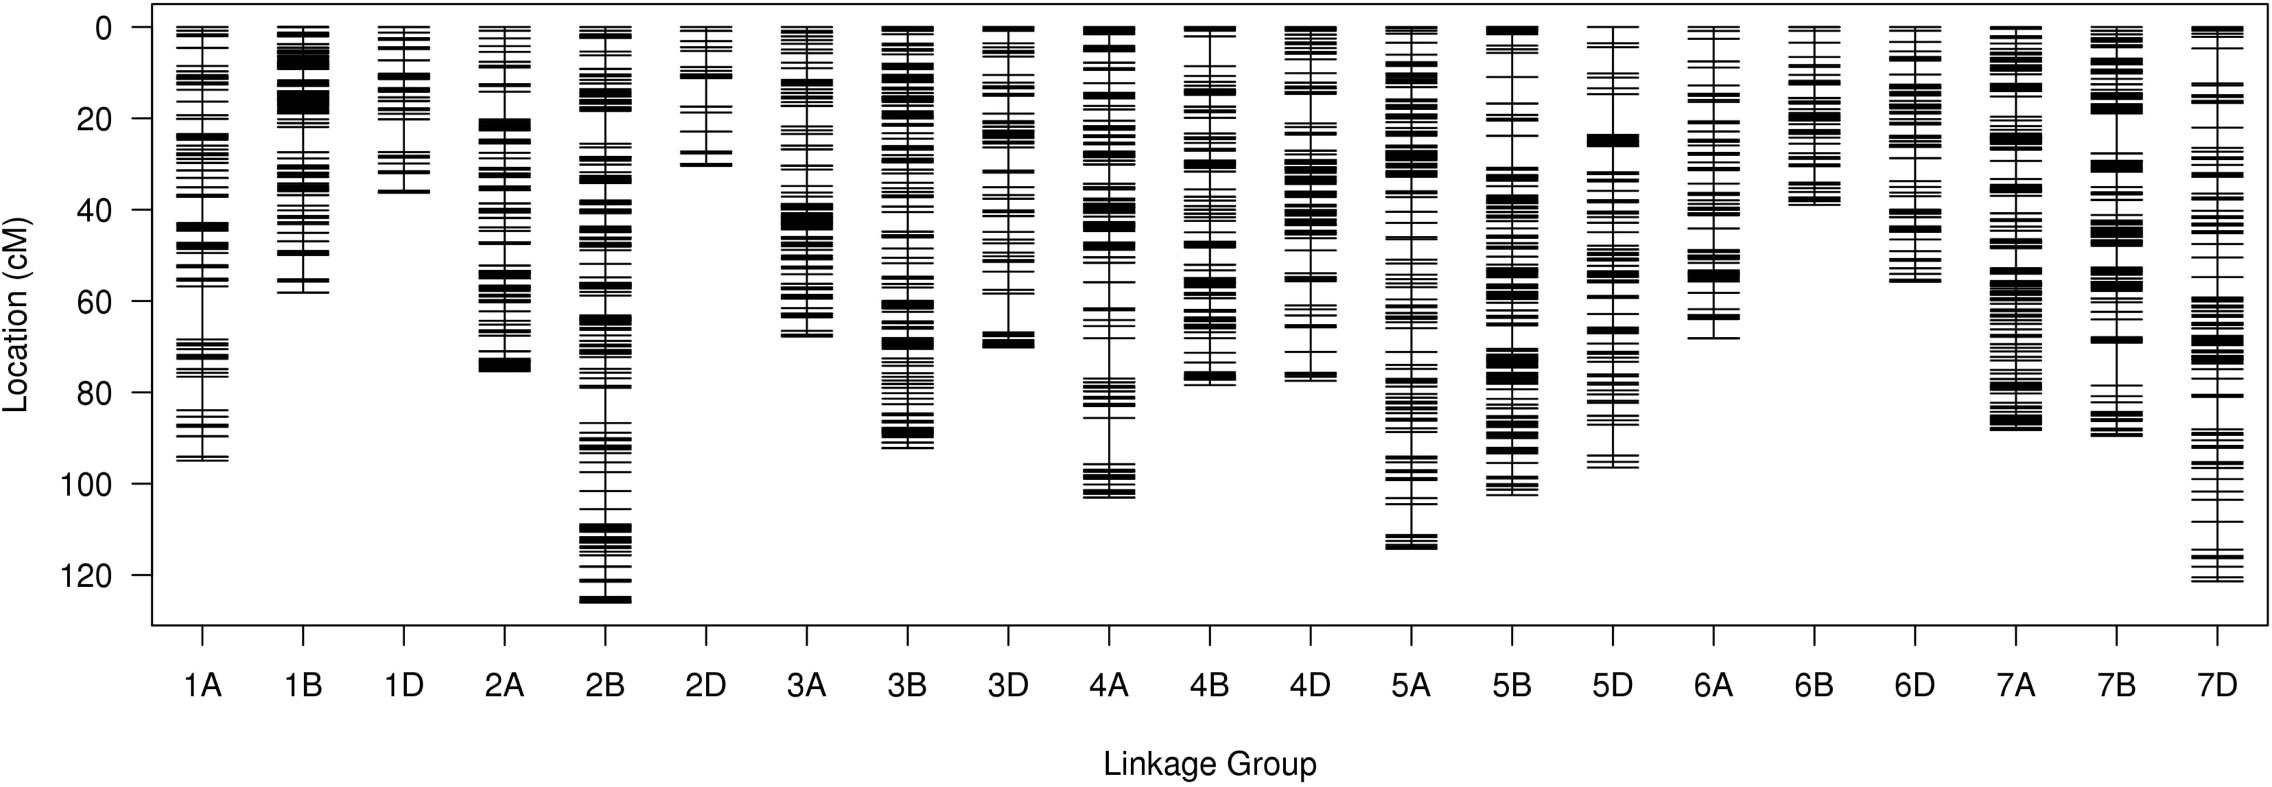
Figure 1 Genetic linkage map of wheat.
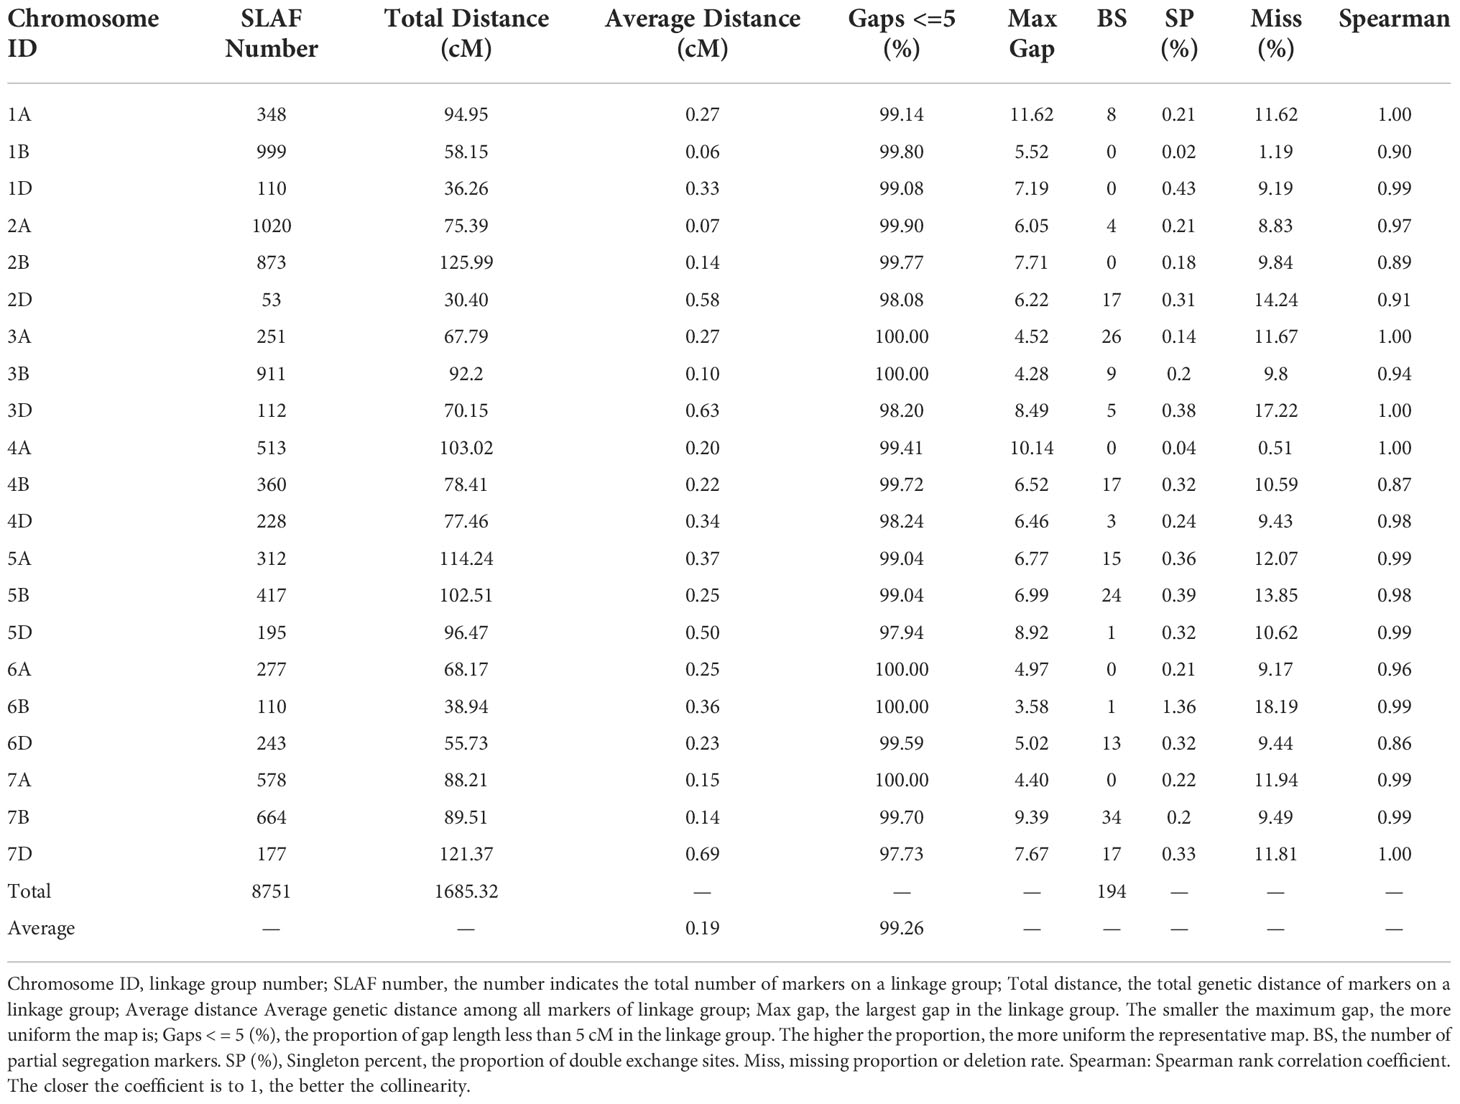
Table 1 Basic statistics of the genetic map.
Correlation of WUE with other traits
Water treatment affected both yield and WUE. With decreasing water treatments, yield decreased significantly, and the trend of GYUA was T1>T2>T3, while WUE showed a trend of first increasing and then decreasing, with high statistical significance. The tendency of WUE was T2> T1> T3 (Figure 2).
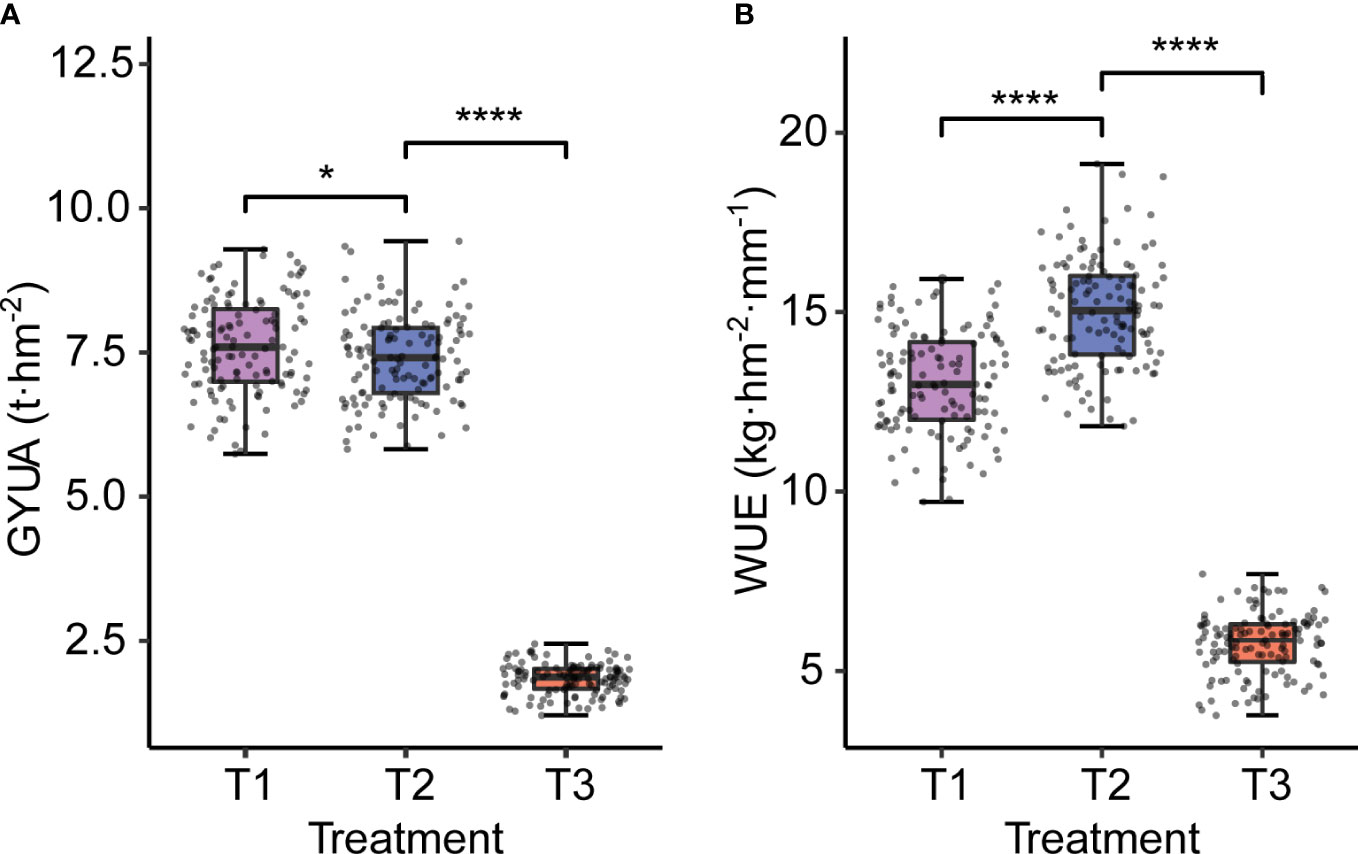
Figure 2 GYUA and WUE under different water treatments. (A) GYUA in different treatments. (B) WUE in different treatments. ****P < 0.0001, *P < = 0.05.
Correlation analysis illustrated that WUE was significantly correlated with other traits across treatments, and the degree of correlation varied with the environment. Except for KGW, SNUA and PH, the correlations between WUE and the other six traits were weakened with decreasing levels of irrigation, especially in the T3 treatment, which not only further weakened the correlations, but also changed the direction of some correlations (Figure 3). Specifically, under the T1 treatment, WUE was significantly positively correlated with KGW, FSN, CID, SWPS, LCC, GNS, and showed a strongly significant negative correlation with CT and PH. Under the T2 treatment the correlation between WUE and various traits were very similar to T1, except for a lack of correlation with PH.Under the T3 treatment, WUE was positively correlated with SNUA and PH, negatively correlated with FSN (P < 0.001), and negatively correlated with KGW and CID (Figure 3).
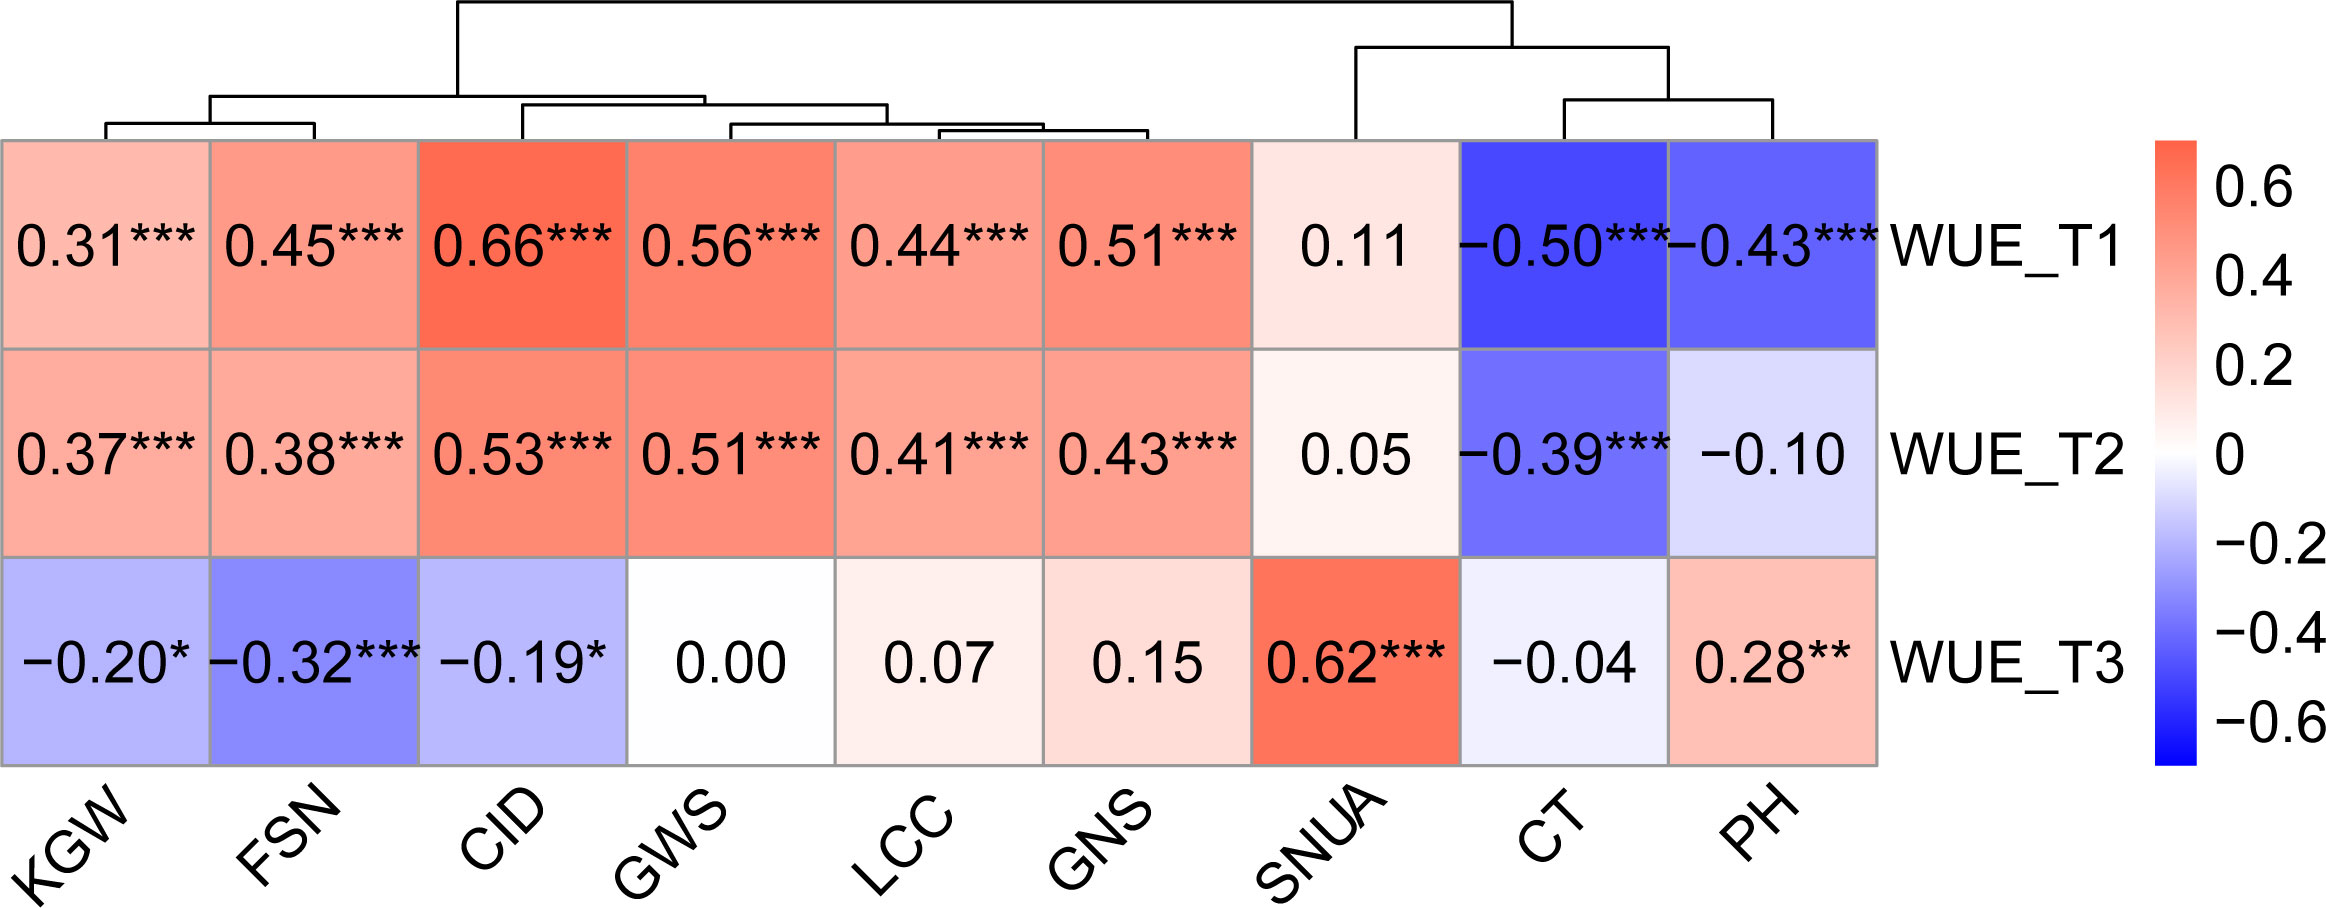
Figure 3 Correlation between WUE and other traits in different treatments. Pearson correlation coefficient in 0.6-0.8 is strong correlation, 0.4-0.6 is medium correlation, 0.2-0.4 is weak correlation, 0.0-0.2 is very weak correlation or no correlation. *** is P< 0.001, ** is P< 0.01, * is P< 0.05.
QTL mapping of WUE and related traits
QTL mapping showed that the sites controlling WUE were distributed on 1A, 1B, 1D, 2A, 2B, 4B, 4D, 6D, 7A, 7B and 7D. Among these, the main effect locus was QWue.acn-2B (2B.2, 2B.3 and 2B.4; LOD 4.7-8.4), which was detected under different treatments in multiple years. The size of the QTL interval was ~2 cM and the phenotypic contribution rate was 15.6%-26.3%. The direction of the effect for WUE was environment specific for this locus: under T1 and T2 treatments Ningchun 27 had a positive effect, while under the T3 treatment the Ningchun 4 allele performed better. Chromosome 2B also harbored QTLs for KGW, GWS, GNS, PH, CID, LCC, and CT, which were mostly overlapping with QWue.acn-2B, and each of these has a fixed additive effect direction. The superior alleles for QLcc-2B, QCt-2B, and the inferior allele qPH-2B all came from Ningchun 27 (Figure 4, Table 2).
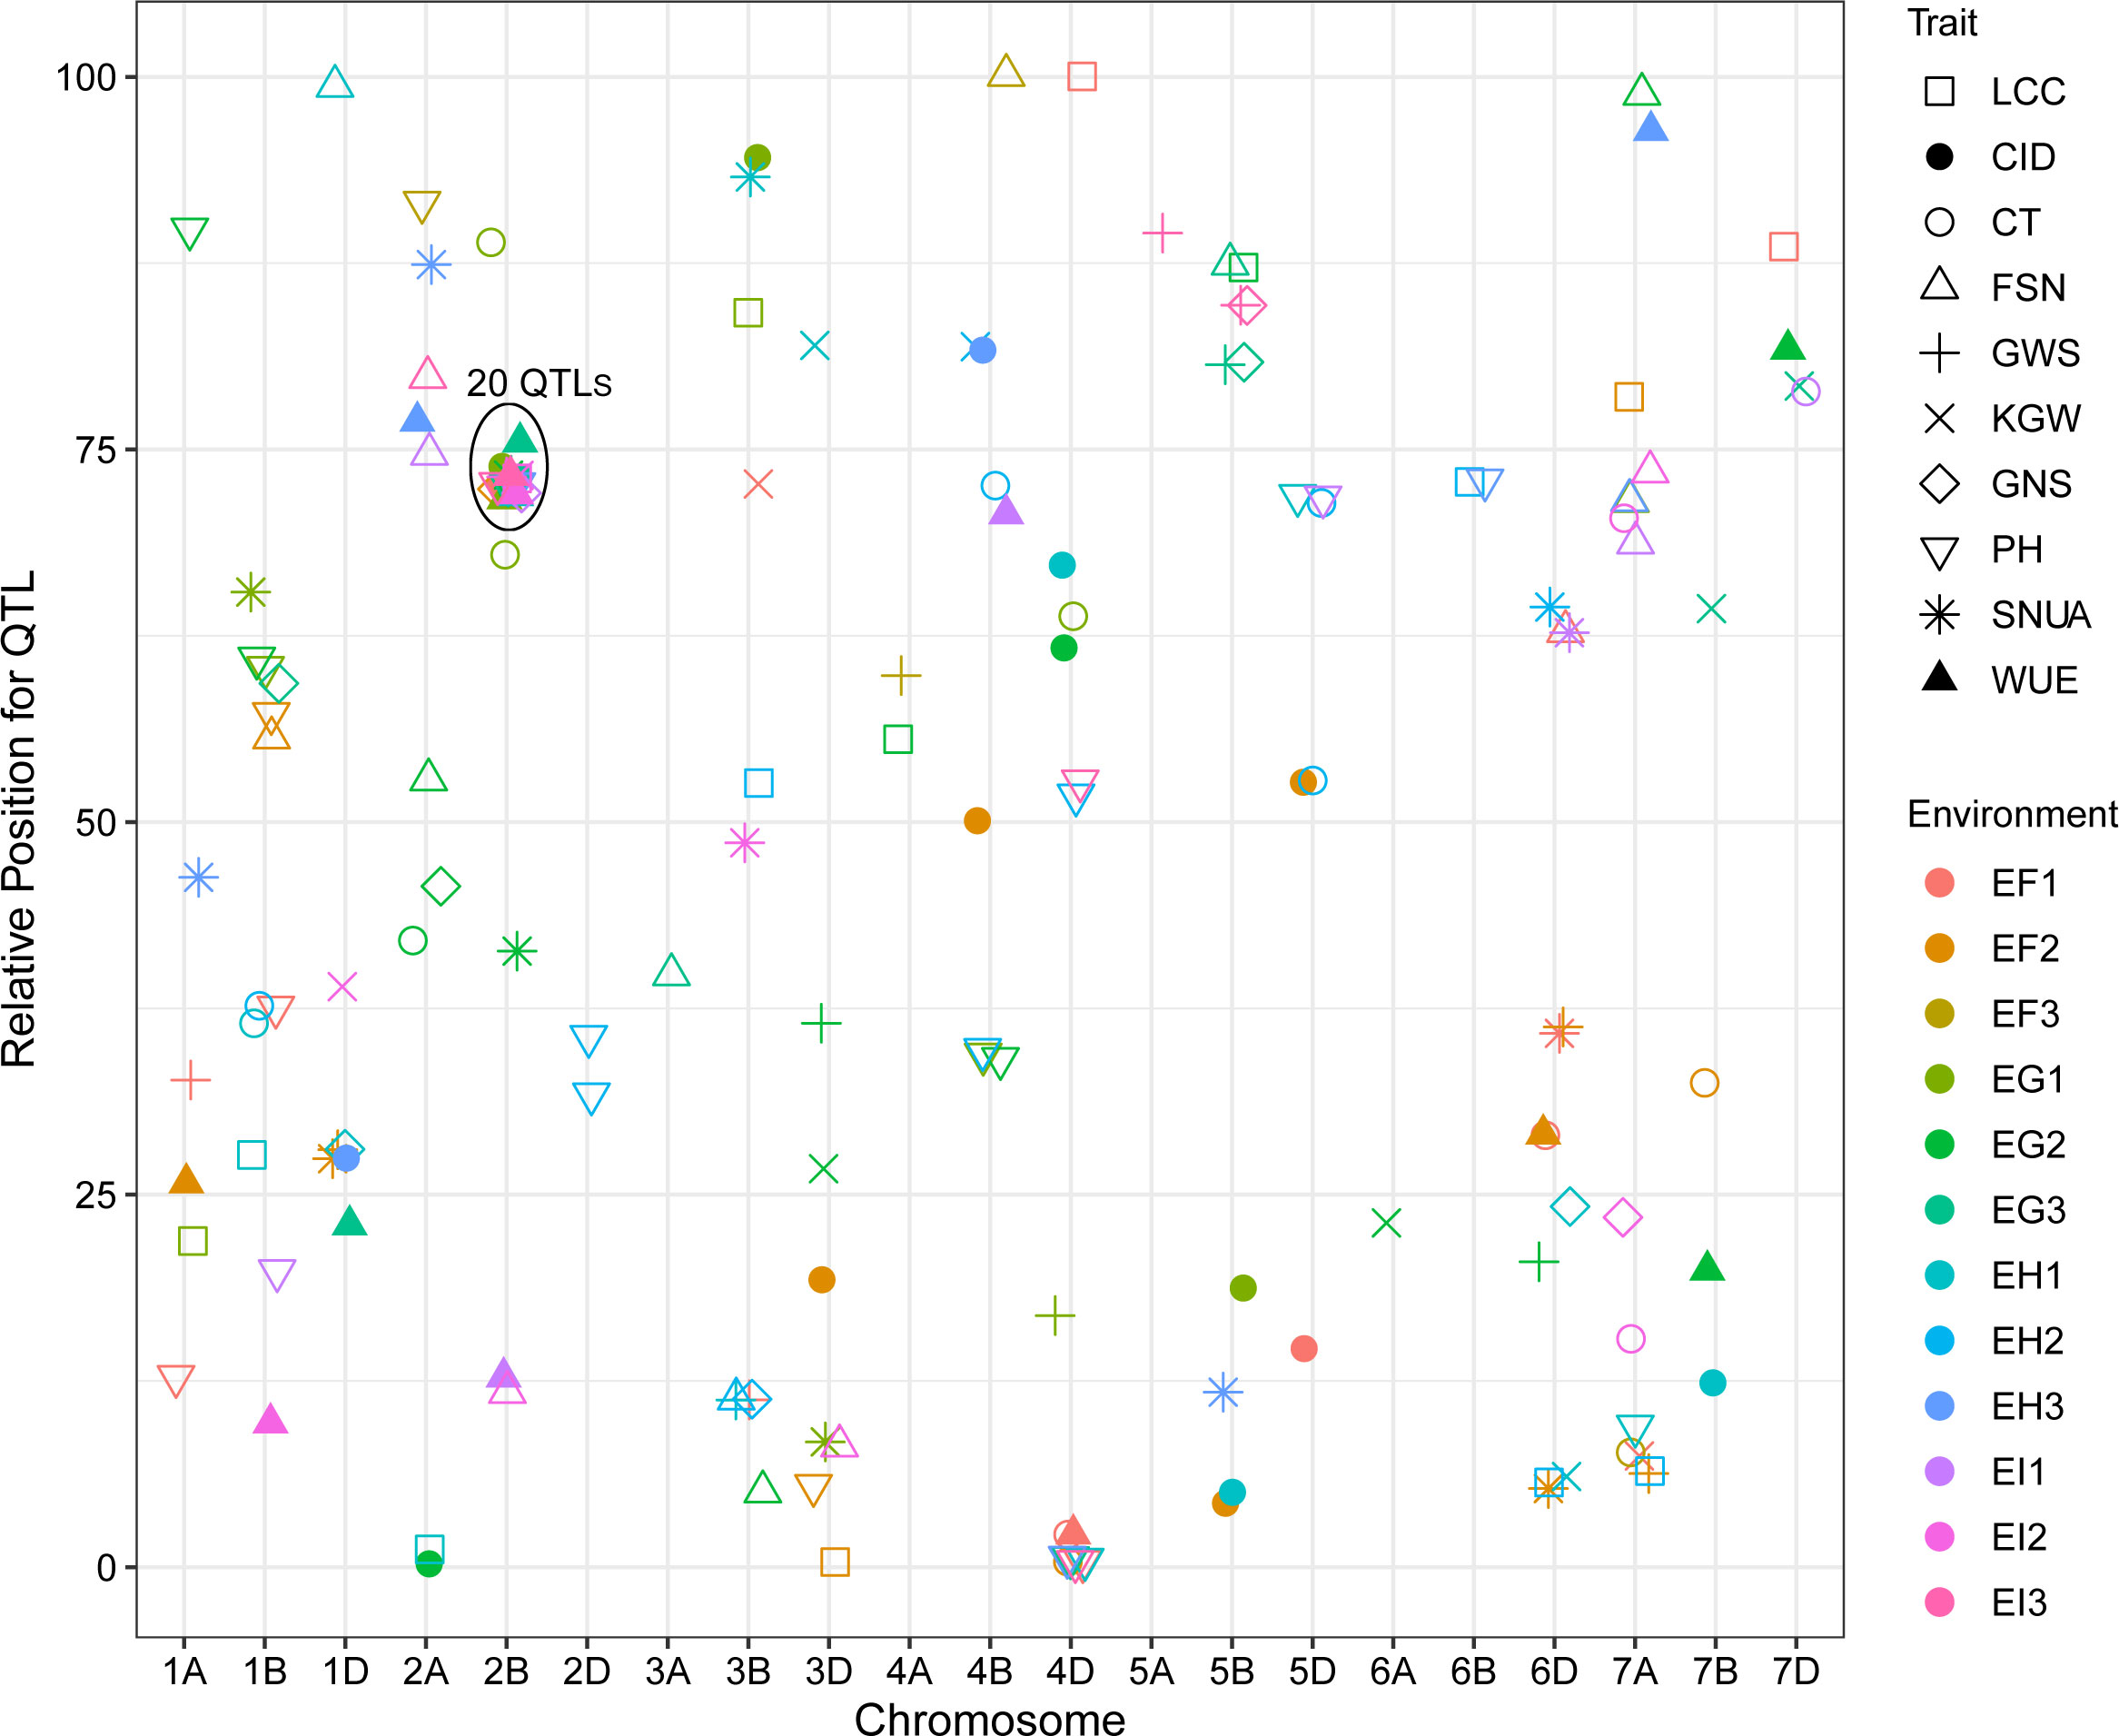
Figure 4 Distribution of QTLs for WUE and related traits across wheat chromosomes. Relative position is the percentage of genetic distance of trait location of the total genetic distance of chromosome. In legend, F, G, H and I represent the years 2017, 2018, 2019 and 2020 respectively, and 1, 2 and 3 represent T1, T2 and T3 water treatments, respectively. The ellipse plots the major QTLs (n=20) of WUE and related traits.
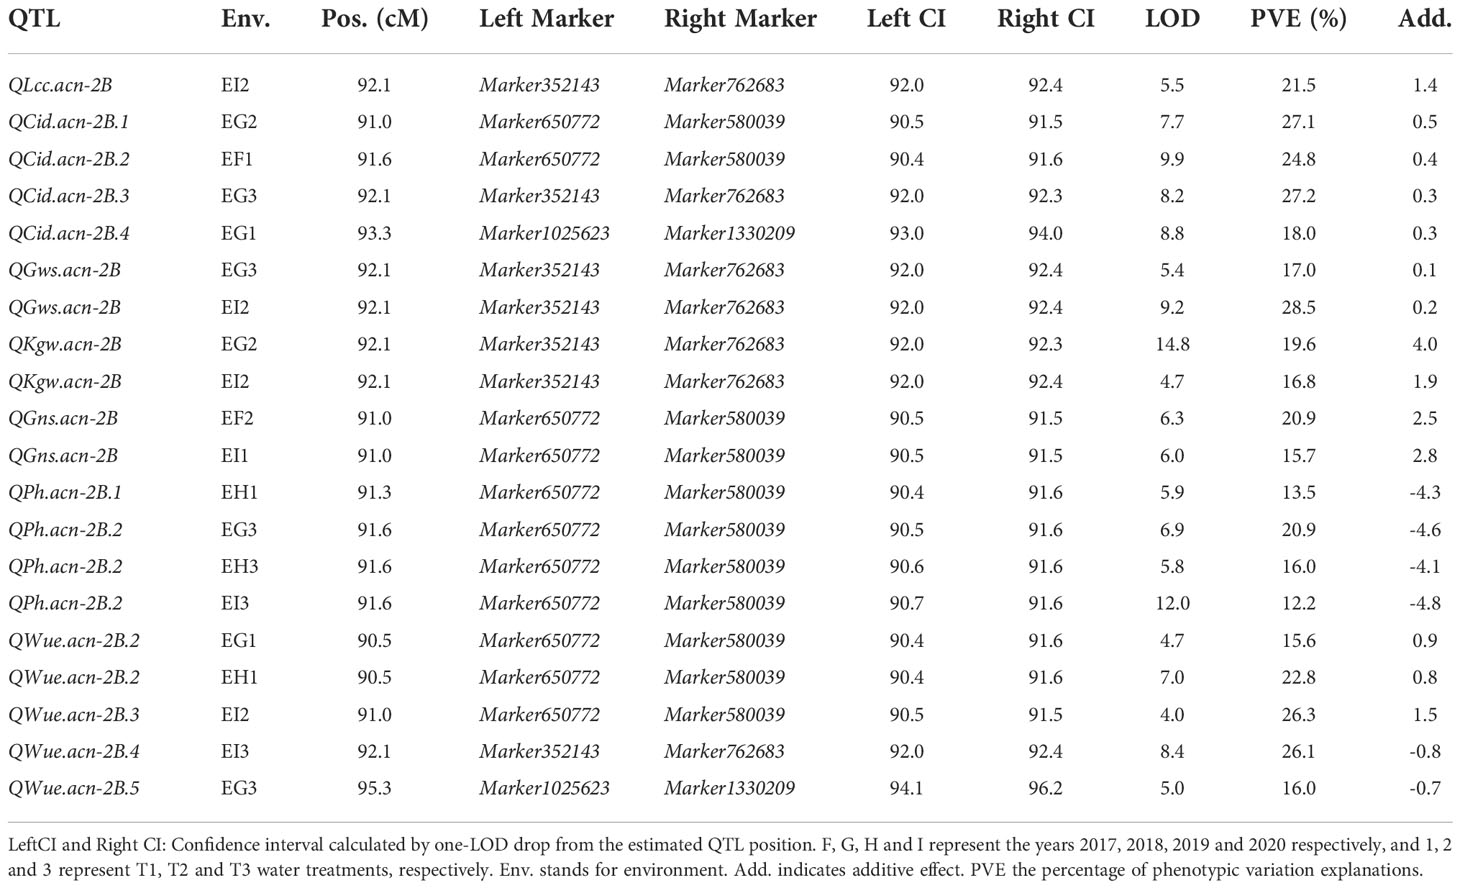
Table 2 Main effect loci for WUE and related traits.
The major QTL QFsn.acn-7A (7A.1, 7A.2, 7A.3, and 7A.4) controlling spikelet number was detected across multiple treatments and years, with a genetic interval of 5 cM, with PVE of 13.0-20.8%. The QCt.acn-1B.1 and QCt.acn-1B.2 were detected at similar positions, and QCt.acn-1B.2 explained more than 20% of canopy temperature variation. The QCid.acn-4D.1 was close to QCT.acn-4D.2, but their additive effects were in the opposite direction. The QCid.acn-5D.1 and QCid.acn-5D.2 were adjacent, but their additive effects were in the opposite direction.The QGws-3B was detected in the same water treatment in two years, which explained more than 20% of the grain weight per ear variation. In addition, stable QTL that control plant height were also detected on 1B, 4B, 2D, 4D, and 5D. Among these, the QPh.acn-2D interval contains the Reduced Height (Rht) dwarfing gene, and QPh.acn-4D is adjacent to TaTD1. Outside of chromosome 2B, with the exception of QPh.acn-4D.1, QCid.acn-4D.2 and QWue.acn-4D (EF1) which are similar in position, no co-localization of WUE QTL with those of related traits was found. For the locus, QWue.acn-4D (LOD of 3.8) with a PVE of 11.6%, the allele for increased WUE, decreased canopy temperature, and decreased plant height was from Ningchun 4 (Figure 5, Table 2, Supplementary Table S4).
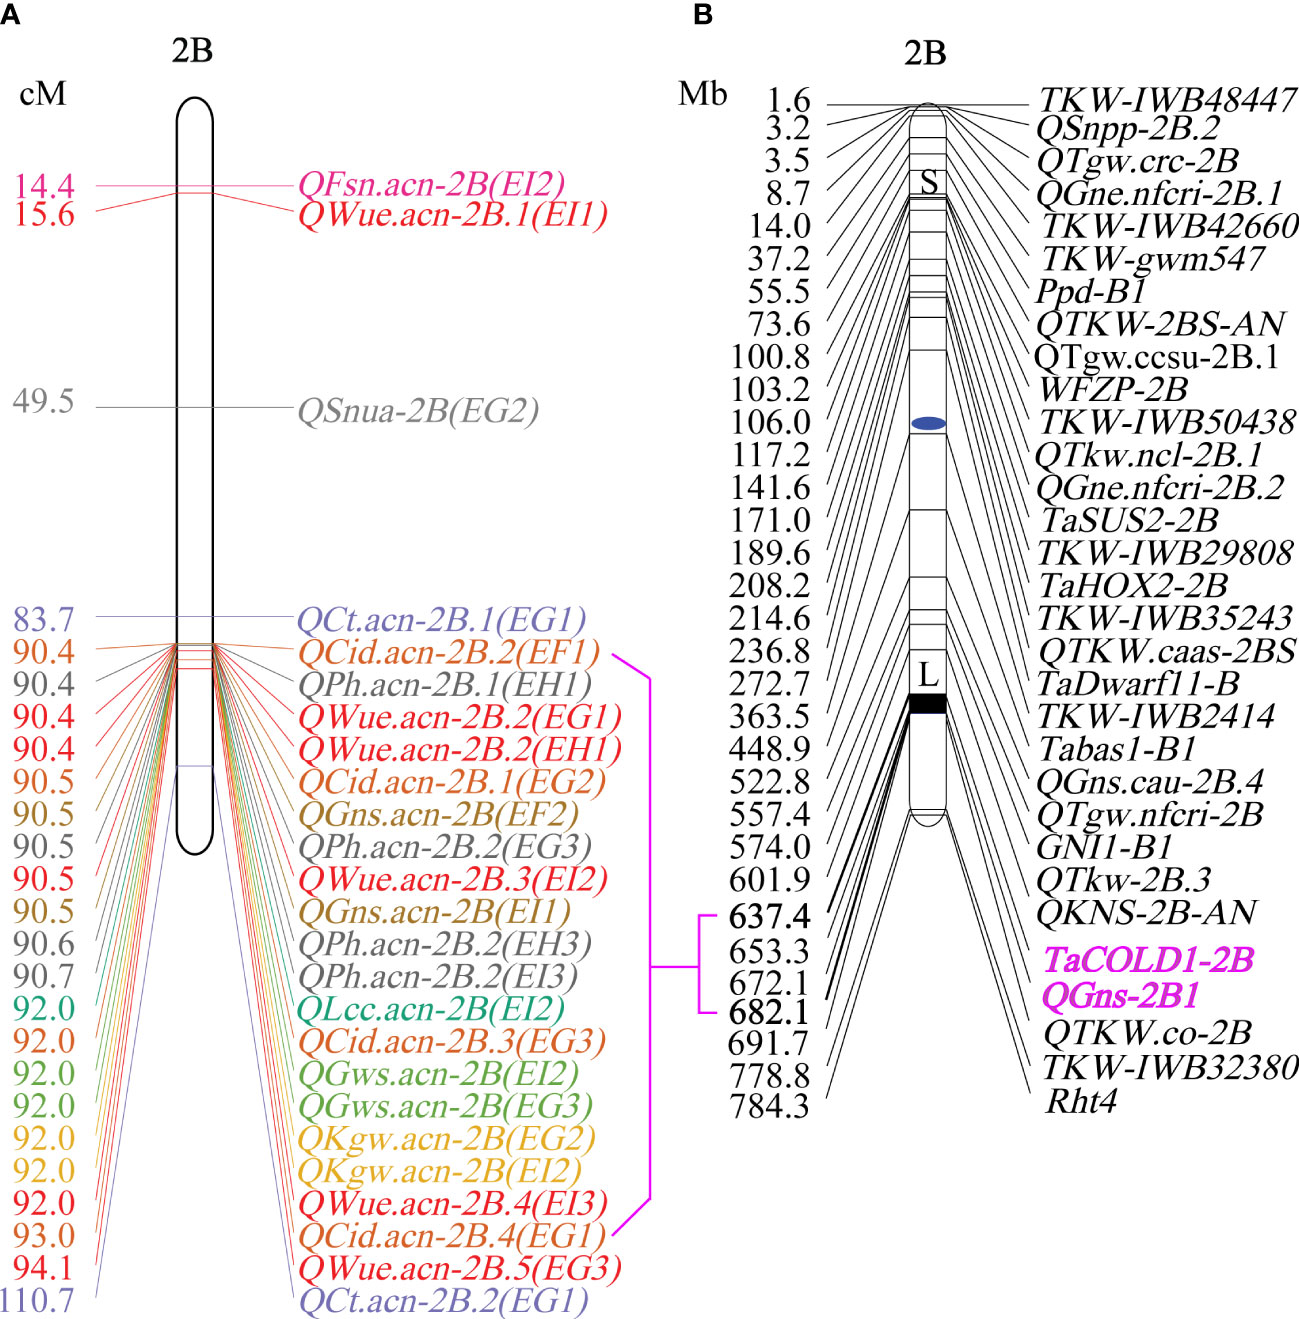
Figure 5 The map of WUE and related traits on chromosome 2B. (A) Genetic position of WUE and related traits on chromosome 2B. (B) Physical map of yield component traits on chromosome 2B (Dong et al., 2019; Cao et al., 2020).
Effects of different alleles of Qwue.acn-2B on WUE and related traits
We then grouped RILs as type B, having Ningchun 27 allele at QWue.acn-2B (QWue.acn-2BNingchun 27), or type N, having the Ningchun 4 allele (QWue.acn-2BNingchun 4), according to the flanking markers. Overall, the two groups responded consistently across environments for both WUE, T2 > T1 > T3, and yield, T1 > T2 > T3 (Figure 6). The effect of QWue.acn-2B was consistent across T1 and T2 environments, with type B being associated with significantly higher yield than type N, but this relationship was opposite in the T3 treatment (Figure 6). The performances of the other 9 traits (KGW, GWS, GNS, PH, CID, SNUA, LCC, CT and FSN) related to QWue.acn-2B under different treatments were compared, and the direction of the additive effect was consistent with that of parental phenotypic difference. In specific analysis, compared with type N, type B had higher grain CID, KGW, GWS, more GNS and FSN, and lower PH across treatments. Under the T2 treatment, type B LCC was higher than that of type N, CT was the opposite, whereas LCC or CT was little changed between types under T3 treatment (Figure 7).
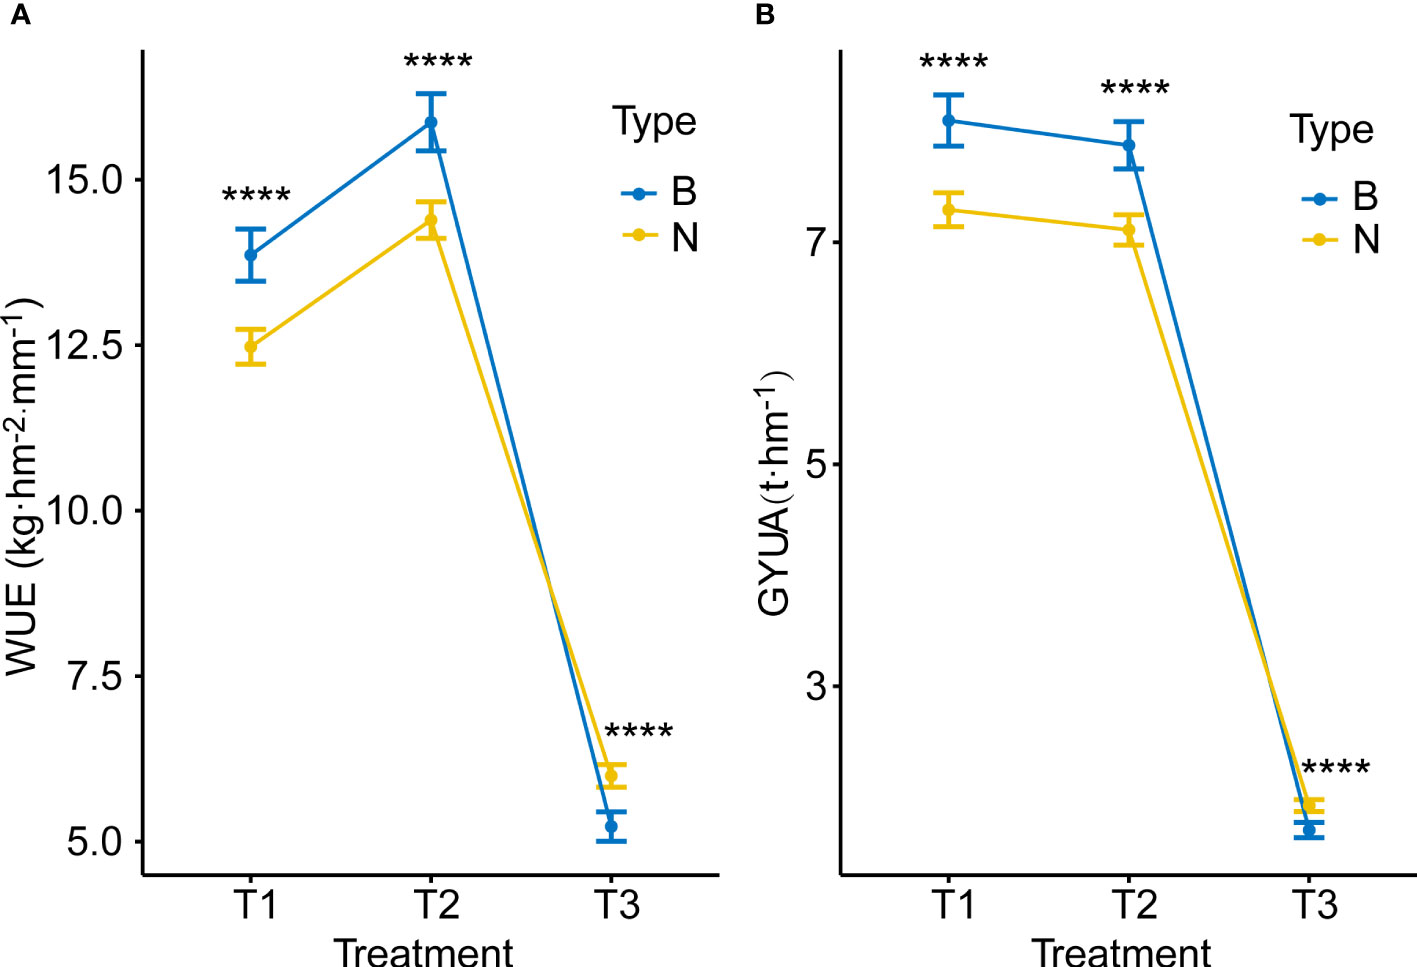
Figure 6 Allele effects for WUE and GYUA under different treatments (A) WUE of type B (QWue.acn-2BNingchun 27) and type N (QWue.acn-2BNingchun 4) lines under different treatments. (B) GYUA of type B and type N lines under different treatments. **** P < 0.0001.
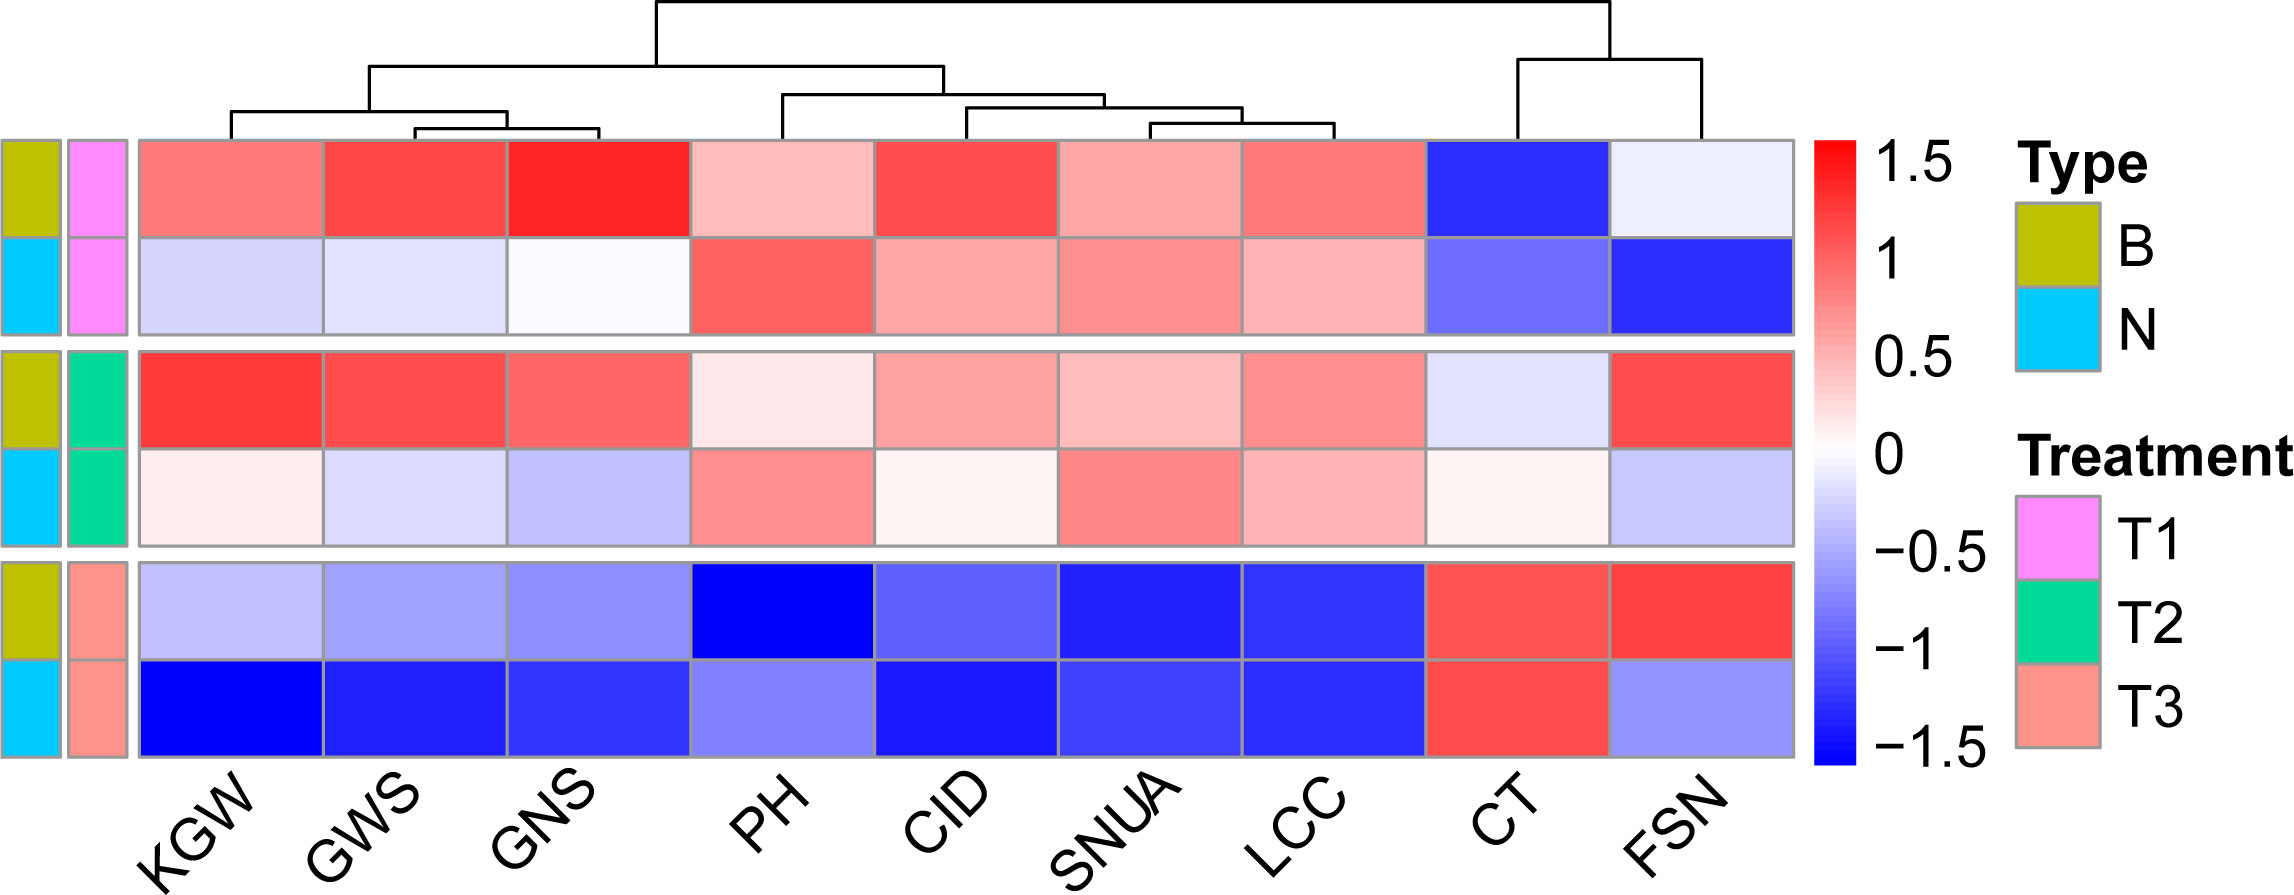
Figure 7 The performance of WUE related traits in different QWue.acn-2B genotypes.
The differences in yield and WUE were finally reflected in the difference in the dominant components of yield composition under the same water conditions. The analysis of the yield components of genotypes with different WUE shows that under T1 and T2 treatments, KGW and GWS are the main factors influencing WUE. Genotypes with higher KGW and GWS tend to have higher WUE, and under T3 treatment, SNUA is the main factor influencing WUE, and genotypes with fewer ears tend to have lower WUE (Table 3). Therefore, without water stress before flowering (T1&T2), type B with high grain weight was more dominant than type N in WUE and yield, but under rain-fed conditions (T3) type B had less harvest spikes and had lower WUE and yield.
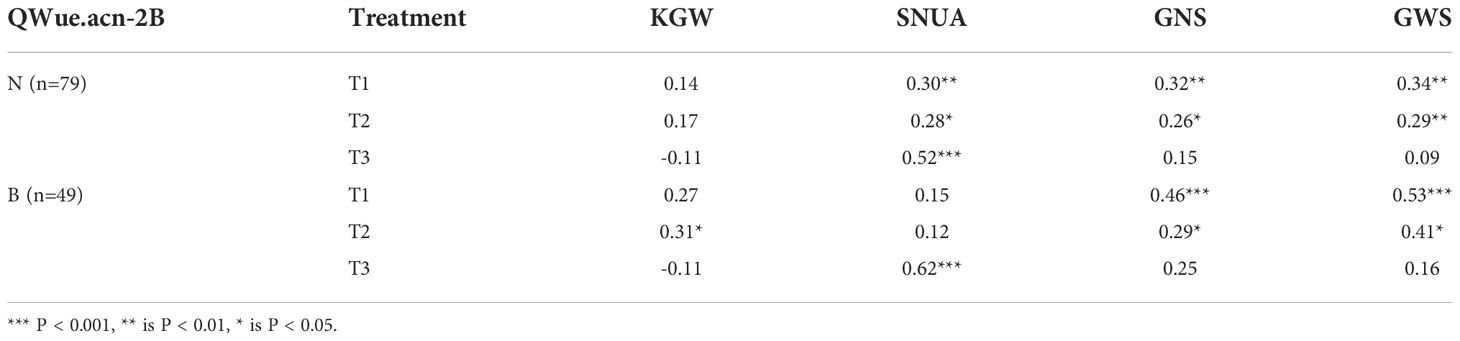
Table 3 Correlation of WUE related traits in different QWue.acn-2B genotypes.
Discussion
In this study, the loci controlling WUE and its main related traits were found to be scattered across the 21 wheat chromosomes. Most loci were environment-specific, and only a few loci were stable across environments, suggesting the quantitative inheritance of WUE and its related traits and the complexity of regulation of trait formation. QWue.acn-2B and some sites controlling CID, grain weight per ear, chlorophyll content, 1000 grain weight and plant height mapped to the same or similar positions to form gene clusters, showing pleiotropic effect, demonstrating that t high WUE materials can at the same time increase yield. The QWue.acn-2B locus has different effects on maintaining or increasing WUE or yield under different water use conditions. In the Yellow River irrigation area of Ningxia, the water-saving and yield increasing effect of families of the QWue.acn-2BNingchun 27 allele is stronger than that of families with QWue.acn-2BNingchun 4. In the rain fed area of Southern Ningxia, QWue.acn-2BNingchun 27 no longer contributes to water-saving and yield, and even reduces WUE. These opposing effects need to be further dissected through examining the trait changes closely related to WUE.
In the process of modern variety breeding, the number of grains per ear and 1000 grain weight often show a negative correlation. Finding the balance between the two is often the key to increasing yield. In the past 10 years (up to 2020), 205 QTLs related to yield component traits of wheat have been found in a multi repeat environments, most of which are QTLs for 1000 grain weight and grain number per ear. Through homology comparison, 33 and 9 yield component genes confirmed to be functional in wheat have been isolated from rice and wheat related species, respectively (Cao et al., 2020), but few genes/QTLs have positive effects on two or more yield components at the same time. In our study, QKgw.acn-2B and QGns.acn-2B loci overlapped, and the phenotypic variance explained was more than 15%. The direction of additive effect was the same, showing the coordination and unity of grain number per ear and 1000 grain weight, which promoted increased yield and high WUE under favorable conditions and showed great application potential and value.
The SPAD value of wheat varieties is positively correlated with the total nitrogen content in leaves (Zhu et al., 2005), which can accurately reflect the transpiration efficiency (TE) under drought conditions (Fotovat et al., 2007). Major SPAD QTLs were found in 2B and 3B of the durum wheat dihaploid population, with a contribution rate of about 14% (Knox, 2013). QTLs controlling SPAD were detected on chromosomes 6A, 7A, 1B and 1D of common wheat, with a contribution rate of 11.4-30.8% (Talukder et al., 2014). SPAD QTLs play an important role in drought resistance and heat tolerance. Lower leaf temperature is related to the adaptability of stomatal conductance and higher photosynthetic rate (Lu et al., 1998; Siddique et al., 2000). The colder canopy distributes assimilates to deeper roots to adapt to drought conditions and increase yield (Lopes and Reynolds, 2010). It is reported that the air crown temperature difference (CTD) and economic yield are similar to each other in 3BL and 5DL, which produce lower crop canopy temperature and higher economic yields (Mason et al., 2013). Consistent with the previous research results, this study found that the locus controlling SPAD/LCC and CT on chromosome 2B overlaps or is adjacent to QWue.acn-2B. The favorable allele has the effect of increasing chlorophyll content and reducing canopy temperature, and can promote the formation of high WUE traits.
Plant height has an important impact on yield components. Several studies have implicated Rht in yield (Tshikunde et al., 2019; Gao et al., 2020; Wen et al., 2022). For example, plant yield was increased by 16.4 and 8.2% in the Rht12 dwarf lines (Chen et al., 2018), Rht25b showed significant pleiotropic effects on yield components (Mo et al., 2018), Rht4 and Rht8 could reduce plant height to a desirable level and improve yield related traits in the rainfed environment (Du et al., 2018). It was shown that Rht-B1b(4BS) + Rht4(2BL) gene can increase the number of grains per ear and reduce 1000 grain weight (Liu et al., 2017). Similarly, was it was shown that Rht14 can reduce 1000 grain weight (Duan et al., 2020), and Rht24(6A) gene can increase 1000 grain weight (Tian et al., 2017). In this study, QPh.acn-2B overlaps QWue.acn-2B, but is not in the same position as Rht-B1b, Rht4, and Rht24. Although TaCOLD1-2B and QGns-2B1 are included in the QPh.acn-2B region, they are not related to QPh.acn-2B in this study, so it may be a new dwarf gene. QWue.acn-2B leads to higher grain number per ear, 1000 grain weight and grain weight per ear. We speculate that QPh.acn-2B may also make an important contribution to the increase of grain number per ear, 1000 grain weight and grain weight per ear, which needs to be further verified.
CID (Δ) is often used to indicate WUE and yield status of crops in arid and semi-arid areas. Many field experiments show that it is usually positively correlated with grain yield under both drought and sufficient water conditions (Condon et al., 1987; Craufurd et al., 1991; Morgan et al., 1993; Sayre et al., 1995). Especially when the soil water supply is sufficient in the early stage of growth, CID has a positive correlation with aboveground dry matter. When the soil is seriously dry in the late stage, the wheat yield of low CID genotype is often higher (Condon et al., 1993). Higher grain CID genotypes tend to have higher harvest index (HI), reflecting that grain filling is more dependent on pre anthesis dry matter reserves, which are obtained when the early growth of plants is not under water stress (Condon et al., 2004). This study found that under the condition of good soil water supply before anthesis (T1), grain CID was significantly positively correlated with yield. This relationship was maintained even if the soil water decreased after anthesis (T2), while under rain fed conditions (T3), grain CID was significantly negatively correlated with yield, consistent with previous findings. This can be explained by the fact that QCid.acn-2B and QWue.acn-2B are at the same or similar position, and the direction of their additive effects is the same under T1&T2, but opposite under T3. High CID is related to high CO2 concentration in the intercellular space which is caused by high stomatal conductance (Farquhar and Richards, 1984). When soil water content is very limited, the high-yield genotype (high CID) will be at a disadvantage due to its high stomatal conductance. In arid environments with deep soil water supplies, the high-yield genotype (high CID) will show the greatest advantage (Blum, 1993; Blum, 1996).
In this study, the economic yield or WUE of type B carrying many good traits in different environments (T1&T2 vs T3) were quite the opposite. This is because under the condition of good soil water supply before flowering, ear grain weight and 1000 grain weight are the main factors determining the height of WUE. The high CID genotype (B) tends to have higher WUE and yield because of its better filling characteristics (higher 1000 grain weight and ear grain weight). The number of ears harvested under rain-fed conditions is the main factor affecting the degree of WUE, and the high CID genotype will produce less ears. The reason why the number of harvested spikes is less may be that high CID induces greater stomatal conductance and transpiration dissipation, which intensifies the competition for limited soil water among individuals and makes it difficult for those individuals to form spikes in this adverse microenvironment. Based on the above analysis, for areas with good soil water storage or supply before flowering, the selection of characters for higher grain CID, 1000 grain weight and ear grain weight is helpful to improve economic yield and WUE. In rain fed areas, especially in areas with very limited soil water before flowering, the selection of characters for lower grain CID and more harvested ears is helpful to increase the economic yield and WUE. In conclusion, type B is suitable for use in irrigation areas, and type N is suitable for use in rain-fed areas.
Although QWue.acn-2B was identified as the main effect loci in the initial mapping, the physical interval is still large. In the future, it is necessary to construct a secondary segregating population for fine mapping. In addition, as multiple traits are located at similar or overlapping positions, it is also necessary to decompose the genetic effects based on the further segregation of traits to clarify the relationship between them. As QWue.acn-2B itself comes from the main varieties and is closely linked with many favorable traits, its flanking molecular markers can be used to introduce excellent chromosome fragments into other materials through molecular marker assisted technology in the future. This effort will verify the effectiveness of QWue.acn-2B and speed up the cultivation of high-yield, high-efficiency, and water-saving varieties.
Data availability statement
The datasets presented in this study can be found in online repositories. The names of the repository/repositories and accession number(s) can be found in the article/Supplementary Material.
Author contributions
SL conceived the project and constructed the recombinant inbred line population (Ningchun 4 x Ningchun 27). HB, XL, SM, and XC performed field tests. JH mapped the traits, analyzed the data and wrote the manuscript. All authors contributed to the article and approved the submitted version.
Funding
National Natural Science Foundation of China (31660394), Ningxia Special Program of Wheat Breeding (2018NYYZ0202).
Conflict of interest
The authors declare that the research was conducted in the absence of any commercial or financial relationships that could be construed as a potential conflict of interest.
Publisher’s note
All claims expressed in this article are solely those of the authors and do not necessarily represent those of their affiliated organizations, or those of the publisher, the editors and the reviewers. Any product that may be evaluated in this article, or claim that may be made by its manufacturer, is not guaranteed or endorsed by the publisher.
Supplementary material
The Supplementary Material for this article can be found online at: https://www.frontiersin.org/articles/10.3389/fpls.2022.1067590/full#supplementary-material
Abbreviations
ACN, Agricultural Biotechnology Research Center of Ningxia; CID, Carbon isotope discrimination (%); CT, Canopy temperature (°C); FSN, Fertile spikelet number per spike; GNS, Grain number per spike; GWS, Grain weight per spike (g); GYUA, Grain yield per unit area (t·hm-2); KGW, Kilo-grain weight (g); LCC, Leaf chlorophyll content; PH, Plant height (cm); SLAF-seq, Specific locus amplified fragment sequencing; SNUA, Spike number per unit area (thousand·hm-2); WUE, Water use efficiency of economic yield (kg·hm-2·mm-1).
References
Acevedo, E. (1993). “Potential of carbon isotope discrimination as a selection criterion in barley breeding,” in Stable isotopes and plant carbon-water relations. Eds. Ehleringer, J. R., Hall, A. E., Farquhar, G. D. (New York: Academic Press), 399–417.
Acevedo, M., Zurn, J. D., Molero, G., Singh, P., He, X., Aoun, M., et al. (2018). “The role of wheat in global food security,” in Agricultural development and sustainable intensification. Ed. Nagothu, U. S. (London, UK: Routledge), 81–110.
Amani, I., Fischer, R. A., Reynolds, M. P. (2010). Canopy temperature depression association with yield of irrigated spring wheat cultivars in a hot climate. J. Agron. Crop Sci. 176, 119–129. doi: 10.1111/j.1439-037x.1996.tb00454.x
Balota, M., Sowinska, M., Buschmann, C., Lichtenthaler, H. K., Babani, F. (1999). Fluorescence techniques as suitable methods to discriminate wheat genotypes under drought and high-temperature conditions. Proc. SPIE Int. Soc Opt. Eng. Proc. 3707, 103–113. doi: 10.1117/12.351334
Blum, A. (1993). “Selection for sustained production in water-deficit environments,” in International crop science. I. Eds. Buxton, D. R., Forsberg, R. A., Blad, B. L., Asay, K. H., Paulsen, G. M., Wilson, R. F., CSSA, Madison. WI, 343–347.
Blum, A. (1996). “Yield potential and drought resistance: are they mutually exclusive?,” in Yield potential in wheat: breaking the barriers. Eds. Reynolds, M. P., Rajaram, S., McNab, A. (Mexico, D. F: CIMMYT), 76–89.
Cao, S., Xu, D., Hanif, M., Xia, X., He, Z. (2020). Genetic architecture underpinning yield component traits in wheat. Theor. Appl. Genet. 133, 1811–1823. doi: 10.1007/s00122-020-03562-8
Chao, J., Li, Z., Sun, Y., Aluko, O. O., Wu, X., Wang, Q., et al. (2021). MG2C: a user-friendly online tool for drawing genetic maps. Mol. Hortic. 1, 16. doi: 10.1186/s43897-021-00020-x
Chen, L., Du, Y., Lu, Q., Chen, H., Meng, R., Cui, C., et al. (2018). The photoperiod-insensitive allele ppd-D1a promotes earlier flowering in Rht12 dwarf plants of bread wheat. Front. Plant Sci. 9. doi: 10.3389/fpls.2018.01312
Condon, A. G., Farquhar, G. D., Richards, R. A. (1990). Genotypic variation in carbon isotope discrimination and transpiration efficiency in wheat-leaf gas exchange and whole plant studies. Aust. J. Plant Physiol. 17, 9–22. doi: 10.1071/PP9900009
Condon, A. G., Richards, R. A., Farquhar, G. D. (1987). Carbon isotope discrimination is positively correlated with grain yield and dry matter production in field-grown wheat. Crop Sci. 27, 996–1001. doi: 10.2135/CROPSCI1987.0011183X002700050035X
Condon, A. G., Richards, R. A., Farquhar, G. D. (1993). Relationships between carbon isotope discrimination, water use efficiency and transpiration efficiency for dryland wheat. Crop Pasture Sci. 44, 1693–1711. doi: 10.1071/AR9931693
Condon, A. G., Richards, R. A., Rebetzke, G. J., Farquhar, G. D. (2002). Improving intrinsic water-use efficiency and crop yield. Crop Sci. 42, 122–131. doi: 10.2135/cropsci2002.1220
Condon, A. G., Richards, R. A., Rebetzke, G. J., Farquhar, G. D. (2004). Breeding for high water-use efficiency. J. Exp. Bot. 55, 2447–2460. doi: 10.1093/jxb/erh277
Craufurd, P. Q., Austin, R. B., Acevedo, E., Hall, M. A. (1991). Carbon isotope discrimination and grain yield in barley. Field Crops Res. 27, 301–313. doi: 10.1016/0378-4290(91)90038-W
Dong, H., Yan, S., Liu, J., Liu, P., Sun, J. (2019). TaCOLD1 defines a new regulator of plant height in bread wheat. Plant Biotechnol. J. 17, 687–699. doi: 10.1111/pbi.13008
Duan, S., Zhao, Z. C., Qiao, Y., Cui, C. G., Morgunov, A., Condon, A. G., et al. (2020). GAR dwarf gene Rht14 reduced plant height and affected agronomic traits in durum wheat (Triticum durum). Field Crops Res. 248, 107721. doi: 10.1016/j.fcr.2020.107721
Du, Y., Chen, L., Wang, Y., Yang, Z., Saeed, I., Daoura, B. D., et al. (2018). The combination of dwarfing genes Rht4 and Rht8 reduced plant height, improved yield traits of rainfed bread wheat (Triticum aestivum L.). Field Crops Res. 215, 149–155. doi: 10.1016/j.fcr.2017.10.015
Ehdaie, B., Waines, J. G. (1993). Variation in water-use efficiency and its components in wheat: I. well-watered pot experiment. Crop Sci. 33, 294–299. doi: 10.2135/cropsci1993.0011183X003300020016x
Ehdaie, B., Waines, J. G. (1994). Growth and transpiration efficiency of near-isogenic lines for height in a spring wheat. Crop Sci. 34, 1443–1451. doi: 10.2135/cropsci1994.0011183X003400060004x
Farquhar, G. D., Ehleringer, J. R., Hubick, K. T. (1989). Carbon isotope discrimination and photosynthesis. Annu. Rev. Plant Physiol. Plant Mol. Biol. 40, 503–537. doi: 10.1146/annurev.pp.40.060189.002443
Farquhar, G. D., Richards, P. A. (1984). Isotopic composition of plant carbon correlates with water-use efficiency of wheat genotypes. Aust. J. Plant Physiol. 11, 539–552. doi: 10.1071/PP9840539
Fischer, R. A., Turner, N. C. (1978). Plant productivity in the arid and semiarid zones. Annu. Rev. Plant Biol. 29, 277. doi: 10.1146/annurev.pp.29.060178.001425
Fotovat, R., Valizadeh, M., Toorchi, M. (2007). Association between water-use efficiency components and total chlorophyll content (SPAD) in wheat (Triticum aestivum L.) under well-watered and drought stress conditions. J. Food Agric. Environ. 5, 225–227. Available at: http://www.world-food.net/scientificjournal.php.
Franks, P. J., Doheny-Adams, T., Britton-Harper, Z. J., Gray, J. E. (2015). Increasing water-use efficiency directly through genetic manipulation of stomatal density. New Phytol. 207, 188–195. doi: 10.1111/nph.13347
Gago, J., Douthe, C., Florez-Sarasa, I., Escalona, J. M., Galmes, J., Fernie, A. R., et al. (2014). Opportunities for improving leaf water use efficiency under climate change conditions. Plant Sci. 226, 108–119. doi: 10.1016/j.plantsci.2014.04.007
Gao, Z., Wang, Y., Tian, G., Zhao, Y., Li, C., Cao, Q., et al. (2020). Plant height and its relationship with yield in wheat under different irrigation regime. Irrig. Sci. 38, 365–371. doi: 10.1007/s00271-020-00678-z
Gorny, A. G. (1999). Effects of d-genome substitutions on the water use efficiency and of the langdon durum wheat to reduced nitrogen nutrition. Cereal Res. Commun. 27, 83–90. doi: 10.1007/BF03543923
Hall, A. E., Mutters, R. G., Farquhar, G. D. (1992). Genotypic and drought-induced differences in carbon isotope discrimination and gas exchange of cowpea. Crop Sci. 32, 1–6. doi: 10.2135/cropsci1992.0011183X003200010002x
Hall, A. E., Mutters, R., Hubick, K. T., Farquhar, G. D. (1990). Genotypic differences in carbon isotope discrimination bycowpea under wet and dry field conditions. Crop Sci. 30, 300–305. doi: 10.2135/cropsci1990.0011183X003000020011x
Handley, L. L., Nevo, E., Raven, J. A., Martínez-Carrasco, R., Scrimgeour, C. M., Pakniyat, H., et al. (1994). Chromosome 4 controls potential water use efficiency (δ13C) in barley. J. Exp. Bot. 45, 1661–1663. doi: 10.1093/jxb/45.11.1661
Henry, R. J., Furtado, A., Rangan, P. (2018). Wheat seed transcriptome reveals genes controlling key traits for human preference and crop adaptation. Curr. Opin. Plant Biol. 45, 231–236. doi: 10.1016/j.pbi.2018.05.002
Hsiao, T. C. (2000). Sensitivity of growth of roots versus leaves to water stress: biophysical analysis and relation to water transport. J. Exp. Bot. 51, 1595–1616. doi: 10.1093/jexbot/51.350.1595
Hubick, K. T., Farquhar, G. D. (1989). Carbon isotope discrimination and the ratio of carbon gained to water lost in barley cultivars. Plant Cell Environ. 12, 795–804. doi: 10.1111/j.1365-3040.1989.tb01641.x
Hubick, K. T., Farquhar, G. D., Shorter, R. (1986). Correlation between water-use efficiency and carbon isotope discrimination in diverse peanut (Arachis) germplasm. Aust. J. Plant Physiol. 13, 803–816. doi: 10.1071/PP9860803
Hu, M. J., Zhang, H. P., Liu, K., Cao, J. J., Wang, S. X., Hao, J., et al. (2016). Cloning and characterization of TaTGW-7A gene associated with grain weight in wheat via SLAF-seq-BSA. Front. Plant Sci. 7. doi: 10.3389/fpls.2016.01902
Islam, M. R., Haque, K., Akter, N., Karim, M. A. (2014). Leaf chlorophyll dynamics in wheat based on SPAD meter reading and its relationship with grain yield. Sci. Agric. 8, 13–18. doi: 10.15192/PSCP.SA.2014.4.1.1318
Ismail, A. M., Hall, A. E. (1992). Correlation between water-use efficiency and carbon isotope discrimination in diverse cowpea genotypes and isogenic lines. Crop Sci. 32, 7–12. doi: 10.2135/cropsci1992.0011183X003200010003x
Khazaei, H., Mohammady, S. (2010). Relationships between carbon isotope discrimination(Ä), grain yield and dry matter production in durum wheat. Pajouhesh. Sazandegi 86, 20–27. Available at: https://agris.fao.org/agris-search/search.do?recordID=IR2011005190.
Khler, I. H., Macdonald, A. J., Schnyder, H. (2015). Last-century increases in intrinsic water-use efficiency of grassland communities have occurred over a wide range of vegetation composition, nutrient inputs, and soil pH. Plant Physiol. 170, 881–890. doi: 10.1104/pp.15.01472
Knox, R. E. (2013). “Quantitative trait loci for chlorophyll content in durum wheat,” at the XXI International Conference on Plant & animal genome: San Diego, CA. Available at: https://pag.confex.com/pag/xxi/webprogram/Paper7122.html.
Kole, C., Muthamilarasan, M., Henry, R., Edwards, D., Sharma, R., Abberton, M., et al. (2015). Application of genomics-assisted breeding for generation of climate resilient crops: progress and prospects. Front. Plant Sci. 6. doi: 10.3389/fpls.2015.00563
Kuneg, A., Naz, A., Dedeck, O. (2007). AB-QTL analysis in winter wheat: I. synthetic hexaploid wheat ( t.turgidum ssp.dicoccoides × t.tauschii ) as a source of favorable alleles for milling and baking quality traits. Theor. Appl. Genet. 115, 683–695. doi: 10.1007/s00122-007-0600-7
Lambrides, C. J., Chapman, S. C., Shorter, R. (2004). Genetic variation for carbon isotope discrimination in sunflower: Association with transpiration efficiency and evidence for cytoplasmic inheritance. Crop Sci. 44, 1642–1653. doi: 10.2135/cropsci2004.1642
Li, R., Li, Y., Kristiansen, K., Wang, J. (2008). Soap: short oligonucleotide alignmentprogram. Bioinformatics 24, 713–714. doi: 10.1093/bioinformatics/btn025
Li, X. J., Pan, Z. D. (2005). A study on the grain-filling characteristic of different weight wheat. Rev. China Agric. Sci. Technol. 7, 26–30. Available at: http://en.cnki.com.cn/Article_en/CJFDTotal-NKDB200501007.htm.
Liu, Y. X., Zhang, J. L., Hu, Y. G., Chen, J. L. (2017). Dwarfing genes Rht4 and rht-B1b affect plant height and key agronomic traits in common wheat under two water regimes. Field Crop Res. 204, 242–248. doi: 10.1016/j.fcr.2017.01.020
Lopes, M. S., Reynolds, M. P. (2010). Partitioning of assimilates to deeper roots is associated with cooler canopies and increased yield under drought in wheat. Funct. Plant Biol. 37, 147–156. doi: 10.1071/FP09121
Lu, Z., Percy, R. G., Qualset, C. O., Eduardo, Z. (1998). Stomatal conductance predicts yields in irrigated pima cotton and bread wheat grown at high temperatures. J. Exp. Bot., 49, 453–460. doi: 10.1093/jxb/49.Special_Issue.453
Masle, J., Gilmore, S. R., Farquhar, G. D. (2005). The ERECTA gene regulates plant transpiration efficiency in arabidopsis. Nature 10, 1–5. doi: 10.1038/nature03835
Mason, R. E., Hays, D. B., Mondal, S., Ibrahim, A., Basnet, B. R. (2013). QTL for yield, yield components and canopy temperature depression in wheat under late sown field conditions. Euphytica, 194, 243–259. doi: 10.1007/s10681-013-0951-x
Mcintosh, R. A., Yamazaki, Y. Y., Dubcovsky, J., Rogers, J., Morris, C., Appels, R., et al. (2013). “Catalogue of gene symbols for wheat,” Agronomy Journal. (Yokohama, Japan: 12th international wheat genetics symposium).
Merah, O., Deléens., E., Monneveux, P. (2001). Relationships between carbon isotope discrimination, dry matter production, and harvest index in durum wheat. J. Plant Physiol. 158, 723–729. doi: 10.1078/0176-1617-00273
Monneveux, P., Reynolds, M. P., Trethowan, R., Gonzalez-Santoyo, H., Pena, R. J., Zapata, F. (2005). Relationship between grain yield and carbon isotope discrimination in bread wheat under four water regimes. Eur. J. Agron. 22, 231–242. doi: 10.1016/j.eja.2004.03.001
Morgan, J. A., LeCain, D. R., McCaig, T. N., Quick, J. S. (1993). Gas exchange, carbon isotope discrimination and productivity in winter wheat. Crop Sci. 33, 178–186. doi: 10.2135/cropsci1993.0011183X003300010032x
Mo, Y., Vanzetti, L. S., Hale, I., Spagnolo, E. J., Guidobaldi, F., Al-Oboudi, J., et al. (2018). Identification and characterization of Rht25, a locus on chromosome arm 6AS affecting wheat plant height, heading time, and spike development. Theor. Appl. Genet. 131, 2021–2035. doi: 10.1007/s00122-018-3130-6
Narasimhamoorthy, B., Gill, B. S., Fritz, A. K. (2006). Advanced backcross QTL analysis of a hard winter wheat × synthetic wheat population. Theor. Appl. Genet. 112, 787–796. doi: 10.1007/s00122-005-0159-0
Pinto, R. S., Reynolds, M. P., Mathews, K. L., McIntyre, C. L., Olivares-Villegas, J. J., Chap-man, S. C. (2010). Heat and drought adaptive QTL in a wheat population designed to minimize con-founding agronomic effects. Theor. Appl. Genet. 121, 1001–1021. doi: 10.1007/s00122-010-1351-4
Rebetzke, G. J., Condon, A. G., Richards, R. A., Farquhar, G. D. (2002). Selection for reduced carbon isotope discrimination increases aerial biomass and grain yield of rainfed bread wheat. Crop Sci. 42, 739–745. doi: 10.2135/cropsci2002.7390
Rebetzke, G. J., Rattey, A. R., Farquhar, G. D., Richards, R. A., Condon, A. G. (2013). Genomic regions for canopy temperature and their genetic association with stomatal conductance and grain yield in wheat. Funct. Plant Biol. 40, 14–33. doi: 10.1071/FP12184
Richards, R. A. (1992). The effect of dwarfing genes in spring wheat in dry environments. II. growth, water use and water-use efficiency. Aust. J. Agr. Res. 43, 529–539. doi: 10.1071/AR9920529
Rytter, R. M. (2005). Water use efficiency, carbon isotope discrimination and biomass production of two sugar beet varieties under well-watered and dry conditions. J. Agron. Crop Sci. 191, 426–438. doi: 10.1111/j.1439-037X.2005.00162.x
Sayre, K. D., Acevedo, E., Austin., R. B. (1995). Carbon isotope discrimination and grain yield for three bread wheat germplasm groups grown at different levels of water stress. Field Crops Res. 41, 45–54. doi: 10.1016/0378-4290(94)00105-L
Siddique, M., Hamid, A., Islam, M. S. (2000). Drought stress effects on water relation of wheat. Bot. Bull. Acad. Sinica. 41, 35–39. Available at: https://ejournal.sinica.edu.tw/bbas/content/2000/1/bot11-06.html.
Sivamani, E., Bahieldin, A., Wraith, J. M., Al-Niemi, T., Dyer, W. E., Ho, T., et al. (2000). Improved biomass productivity and water use efficiency under water deficit conditions in transgenic wheat constitutively expressing the barley HVA1 gene. Plant Sci. 155, 1–9. doi: 10.1016/s0168-9452(99)00247-2
Srivastava, A., Srivastava, P., Sharma, A., Sarlach, R. S. (2017). Canopy temperature an effective measure of drought stress tolerance in RIL population of wheat. Int. J. Plant Sci. 30, 59. doi: 10.5958/2229-4473.2017.00011.8
Sun, X., Liu, D., Zhang, X., Li, W., Liu, H., Hong, W., et al. (2013). SLAF-seq: an efficient method of large-scale de novo SNP discovery and genotyping using high-throughput sequencing. PloS One 8, e58700. doi: 10.1371/journal.pone.0058700
Sun, C., Zhang, F., Yan, X., Zhang, X., Dong, Z., Cui, D., et al. (2017). Genome-wide association study for 13 agronomic traits reveals distribution of superior alleles in bread wheat from the yellow and huai valley of China. Plant Biotechnol. J. 15, 953–969. doi: 10.1111/pbi.12690
Talukder, S. K., Babar, M. A., Vijayalakshmi, K., Poland, J., Prasad, P., Bowden, R., et al. (2014). Mapping QTL for the traits associated with heat tolerance in wheat (Triticum aestivum L.). BMC Genet. 15, 1–13. doi: 10.1371/journal.pone.0058700
Tian, X. L., Wen, W. E., Xie, L., Fu, L. P., Xu, D. A., Fu, C., et al. (2017). Molecular mapping of reduced plant height gene Rht24 in bread wheat. Front. Plant Sci. 8, 1379. doi: 10.3389/fpls.2017.01379
Tshikunde, N. M., Mashilo, J., Shimelis, H., Odindo, A. (2019). Agronomic and physiological traits, and associated quantitative trait loci (QTL) affecting yield response in wheat (Triticum aestivum L.): A review. Front. Plant Sci. 10. doi: 10.3389/fpls.2019.01428
Wei, Q., Wang, W., Hu, T., Hu, H., Bao, C. (2020). Construction of a SNP-based genetic map using SLAF-seq and QTL analysis of morphological traits in eggplant. Front. Genet. 11, 178. doi: 10.3389/fgene.2020.00178
Wei, Q., Wang, Y., Qin, X., Zhang, Y., Zhang, Z., Jing, W., et al. (2014). An SNP-based saturated genetic map and QTL analysis of fruit-related traits in cucumber using specific-length amplified fragment (SLAF) sequencing. BMC Genomics 15, 1158. doi: 10.1186/1471-2164-15-1158
Wen, S., Zhang, M., Tu, K., Fan, C., Tian, S., Bi, C., et al. (2022). A major quantitative trait loci cluster controlling three components of yield and plant height identified on chromosome 4B of common wheat. Front. Plant Sci. 12, 799520. doi: 10.3389/fpls.2021.799520
Xing, X., Yuan, H., Li, S., Trethowan, R., Monneveux, P. (2007). Relationship between carbon isotope discrimination and, grain yield in spring wheat cultivated under different water regimes. J. Integr. Plant Biol. 49, 1497–1507. doi: 10.1111/j.1672-9072.2007.00562.x
Yadav, M. R., Choudhary, M., Singh, J., Lal, M. K., Jha, P. K., Udawat, P. (2022). Impacts, tolerance, adaptation, and mitigation of heat stress on wheat under changing climates. Int. J. Mol. Sci. 23, 2838. doi: 10.3390/ijms23052838
Yan, J. K., Zhang, S. Q. (2017). Effects of dwarfing genes on water use efficiency of bread wheat. Front. Agri. Sci. Eng. 4, 126–134. doi: 10.15302/J-FASE-2017134
Yin, J. L., Fang, Z. W., Sun, C., Zhang, P., Zhang, X., Lu, C., et al. (2018). Rapid identification of a stripe rust resistant gene in a space-induced wheat mutant using specific locus amplified fragment (SLAF) sequencing. Sci. Rep. 8, 3086. doi: 10.1038/s41598-018-21489-5
Zhang, Z. B., Shan, L. (2000). Background analysis of genes controling water use efficiency of triticum. Acta Genet. Sinica. 27, 240–246.
Zhang, Y., Wang, L., Xin, H., Li, D., Ma, C., Ding, X., et al. (2013). Construction of a high-density genetic map for sesame based on large scale marker development by specific length amplified fragment (SLAF) sequencing. BMC Plant Biol. 13, 141. doi: 10.1186/1471-2229-13-141
Zhang, X. J., Yang, Y., Li, F. H., Xiang, J. H., Liu, D. Y. (2020). Construction of a high-density SNP genetic map for pacific white shrimp (Litopenaeus vannamei). Front. Genet 11, 571880. doi: 10.3389/fgene.2020.571880
Zhu, W. Y., Huang, L., Chen, L., Yang, J. T., Wu, J. N., Qu, M. L., et al. (2016). A high-density genetic linkage map for cucumber (cucumis sativus l.): Based on specific length amplified fragment (SLAF) sequencing and QTL analysis of fruit traits in cucumber. Front. Plant Sci. 7. doi: 10.3389/fpls.2016.00437
Zhu, X. K., Sheng, H. J., Gu, J., Zhang, R., Li, C. Y. (2005). Primary study on application of SPAD value to estimate chlorophyll and nitrogen content in wheat leaves. J. Triticeae Crops. 25, 46–50. Available at: https://en.cnki.com.cn/Article_en/CJFDTOTALMLZW200502011.htm.
Keywords: water use efficiency of economic yield, carbon isotope discrimination, QTL, recombinant inbred lines, bread wheat (Triticum aestivum L.)
Citation: Hui J, Bai H, Lyu X, Ma S, Chen X and Li S (2023) A pleiotropic QTL increased economic water use efficiency in bread wheat (Triticum aestivum L.). Front. Plant Sci. 13:1067590. doi: 10.3389/fpls.2022.1067590
Received: 12 October 2022; Accepted: 25 November 2022;
Published: 04 January 2023.
Edited by:
Diaa Abd El Moneim, Arish University, EgyptReviewed by:
Mian Arif, Nuclear Institute for Agriculture and Biology, PakistanToi J. Tsilo, Agricultural Research Council of South Africa (ARC-SA), South Africa
Dhruba Thapa, Nepal Agricultural Research Council, Nepal
Copyright © 2023 Hui, Bai, Lyu, Ma, Chen and Li. This is an open-access article distributed under the terms of the Creative Commons Attribution License (CC BY). The use, distribution or reproduction in other forums is permitted, provided the original author(s) and the copyright owner(s) are credited and that the original publication in this journal is cited, in accordance with accepted academic practice. No use, distribution or reproduction is permitted which does not comply with these terms.
*Correspondence: Jian Hui, huijian101@163.com; Shuhua Li, shuhua.l@163.com