 Claudia Allan1†
 Volker Nock
 Claudia-Nicole Meisrimler
- 1School of Biological Sciences, University of Canterbury, Christchurch, New Zealand
- 2Department of Electrical and Computer Engineering, University of Canterbury, Christchurch, New Zealand
- 3MacDiarmid Institute for Advanced Materials and Nanotechnology, Wellington, New Zealand
- 4imec Netherlands, Holst Centre, Eindhoven, Netherlands
One sentence summary: Bi-directional-dual-flow-RootChip to track calcium signatures in Arabidopsis primary roots responding to osmotic stress.
Plant growth and survival is fundamentally linked with the ability to detect and respond to abiotic and biotic factors. Cytosolic free calcium (Ca2+) is a key messenger in signal transduction pathways associated with a variety of stresses, including mechanical, osmotic stress and the plants’ innate immune system. These stresses trigger an increase in cytosolic Ca2+ and thus initiate a signal transduction cascade, contributing to plant stress adaptation. Here we combine fluorescent G-CaMP3 Arabidopsis thaliana sensor lines to visualise Ca2+ signals in the primary root of 9-day old plants with an optimised dual-flow RootChip (dfRC). The enhanced polydimethylsiloxane (PDMS) bi-directional-dual-flow-RootChip (bi-dfRC) reported here adds two adjacent inlet channels at the base of the observation chamber, allowing independent or asymmetric chemical stimulation at either the root differentiation zone or tip. Observations confirm distinct early spatio-temporal patterns of salinity (sodium chloride, NaCl) and drought (polyethylene glycol, PEG)-induced Ca2+ signals throughout different cell types dependent on the first contact site. Furthermore, we show that the primary signal always dissociates away from initially stimulated cells. The observed early signaling events induced by NaCl and PEG are surprisingly complex and differ from long-term changes in cytosolic Ca2+ reported in roots. Bi-dfRC microfluidic devices will provide a novel approach to challenge plant roots with different conditions simultaneously, while observing bi-directionality of signals. Future applications include combining the bi-dfRC with H2O2 and redox sensor lines to test root systemic signaling responses to biotic and abiotic factors.
1. Introduction
Physiological processes in eukaryotic organisms rely on a functional signal transduction system to coordinate external and internal signals resulting in appropriated response. External signals, including abiotic and biotic stress, depend on initial perception by cell-surface receptors, cellular transmission and translation that allow plants to balance external fluctuations in an ever-changing environment. Calcium (Ca2+) is an essential macronutrient in plants, where it is a component of cell walls, membranes, proteins and finally, yet importantly, a key messenger involved in signal transduction (Bergey et al., 2014). Changes in cytosolic free Ca ion ([Ca2+]cyt) concentrations serve as a signal, which translates into downstream responses (McAinsh and Pittman, 2009; Dodd et al., 2010; Thor and Peiter, 2014). These signals are known to be associated with different patterns of transient, sustained, or oscillatory rises in [Ca2+]cyt – comparable to a Morse code (De Koninck and Schulman, 1998; McAinsh & Pittman, 2009). Commonly, a message is converted into a Ca2+ signal (transmissible form), followed by diverse transmission and transduction of the signal, which associates with a decoding machinery allowing the cell to interpret Ca2+ signatures generated under different environmental stresses (Allan et al., 2022a). The coding function relies on maintaining constantly low levels of [Ca2+]cyt around 0.1 μM. Buffers, H+/Ca2+ antiporters and Ca2+-ATPases, actively remove Ca2+ from the cytosol into the apoplast or intracellular stores (Connorton et al., 2012; Bonza et al., 2016). In tandem, Ca2+ can move down the concentration gradient into the cytosol through channel proteins, subsequently generating a signal. In order to code for downstream pathways, like gene (de-) activation, the signal must be interpreted and communicated into a cellular response via calcium binding proteins (CBPs), e.g. Ca2+-Dependent Protein Kinases (CPKs) and Calcineurin-B Like proteins (CBLs) (Bergey et al., 2014; Wagner et al., 2015; Thoday-Kennedy et al., 2015; Zhang et al., 2016; Zhu et al., 2016).
So far, the majority of [Ca2+]cyt measurements and experiments have been accomplished in Arabidopsis thaliana (Arabidopsis). In recent years a variety of approaches have been used for this, including the luminescent Ca2+-interacting aequorin protein, (Knight et al., 1991), G-CaMP3 (Toyota et al., 2018), as well as ratiometric biosensors like the MatryoshCaMP6s calcium sensors (Ast et al., 2017). The visualisation of cytosolic calcium transients using luminescent or fluorescent sensors has revealed stimulus‐specific calcium signatures and long‐distance communication in roots (Knight et al., 1997; Kiegle et al., 2000; Krebs et al., 2012; Choi et al., 2014; Xiong et al., 2014; Behera et al., 2015; Keinath et al., 2015). However, mimicking complex soil environments that roots are exposed to, whilst being able to control these conditions and quantify the effects, has been technically challenging. To overcome these challenges, microfluidic approaches have been combined with advanced microscopy in recent years. The use of microfluidics has been shown to allow for dynamic experiments that mimic environmental complexity found in the soil in a high spatio-temporal resolution on organismal and cellular level for force sensing and flow stream shaping of tip growing organisms (Bhatia & Ingber, 2014; Nezhad, 2014; Zheng et al., 2016; Tayagui et al., 2017; Sun et al., 2020). Particularly significant breakthroughs have been made by the introduction of ‘soil‐on‐a‐chip’ microfluidic technologies to investigate root-microbe interactions and the dual-flow-RootChip (dfRC) platform, the latter which allows for the cultivation of Arabidopsis roots in asymmetric microenvironments (Stanley and van der Heijden, 2017; Stanley et al., 2018). Building on this platform, we have previously reported the basic chip design (Allan et al., 2022b) and operation of a bi-directional-dual-flow-RootChip (bi-dfRC). In the following we expand on the platform and demonstrate the use of the bi-dfRC to study the directionality and role of Ca2+ signaling in plant roots in response to stress factors. The bi-dfRC expands on conventional dfRCs (Stanley et al., 2018) by adding bi-directional flow capabilities for guided root growth and controlled exposure of the root to independent or asymmetric solute gradients. To probe for Ca2+ directional localisation in Arabidopsis root systems, a G-CaMP3 line (Toyota et al., 2018) was combined with the polydimethylsiloxane (PDMS) root chip technology. We demonstrate that a bi-directional flow system allows for studying directionality of Ca2+ signals upon selective application of stresses from adjacent directions. These findings are discussed in context with existing literature on varying Ca2+ sensing machinery in plant roots that may allow to distinguish local stress application and elicit downstream long-distance systemic signaling as a response, thus fine-tuning adaptation processes.
2. Methods
2.1. Bi-directional-dual-flow-RootChip fabrication
Microfluidic chips were fabricated using photolithography and replica molding (Orcheston-Findlay et al., 2018). In brief, designs were created using software (Mentor Graphics, v2020.1), and transferred to photo-masks (Nanofilm) using a laser mask writer (Heidelberg μPG101) and wet-etching. Single-side polished silicon wafers (4”, Prime grade, WaferPro) were dehydrated in an oven (Hearatherm) at 180°C for 24 hours and cleaned in a O2-plasma cleaner (PIE Scientific Tergeo) at 100 W for 10 min. After cleaning, dry-film, negative-tone photoresist (SUEX 100, DJMicrolaminates) was laminated (Sky-335R6) onto the wafer. The chip design was then transferred into the photoresist by exposure of the prepared photomask in a mask aligner (MA-6, SUSS MicroTec). After exposure to UV light, the wafer was baked on a hot plate (HS40, Torrey Pines Scientific) for 5 min at 65°C and 20 min at 95°C. Transferred chip structures were developed in propylene glycol methyl ether acetate (PGMEA) developer for 30 min and rinsed with isopropanol for 5 min. Lastly, the wafer was hard-baked on the hot plate for 1 hour at 125°C, yielding a mold ready for replica-molding (Xia and Whitesides, 1998).
Prior to molding, the silicon wafer was pre-treated with an anti-adhesion agent (Trichloro (1H,1H,2H,2H-perfluorooctyl) silane, Sigma-Aldrich) to prevent sticking of the elastomer cast during the subsequent replica-molding. This step was repeated after 10 subsequent uses of the wafer as mold master. For replica-molding, PDMS (Sylgard 184, Electropar) pre-polymer silicone elastomer base was mixed thoroughly with silicone elastomer curing agent at a 10:1 (w/w) ratio and degassed to remove air bubbles. Once cast onto the wafer mold, the PDMS was degassed again and placed on a hot plate at 80°C for 2 hours to cure. Subsequently, the PDMS was carefully peeled off from the wafer and cured on the hot plate for a further 2 hours at 80°C. Following the second curing bake, inlet and outlet holes were core-punched (Ø1 mm & 3 mm, ProSciTech) and the PDMS was cut into individual bi-dfRC chips using a guillotine or scalpel. Chips were then O2-plasma activated (PIE Scientific Tergeo) at 15 W power for 1 minute and bonded to pre-cleaned microscope slides (26×60 mm, Lab Supply) by lightly pressing the exposed surfaces of the PDMS and glass together. Bonded chips were then baked for 2 hours on a hot plate at 80°C to strengthen the bond.
To permanently retain the hydrophilicity of microfluidic channels (Hemmilä et al., 2012; Hashemi et al., 2017) and reduce diffusion of small molecules into PDMS, assembled chips were placed in the plasma cleaner (PIE Scientific Tergeo) and exposed to 30 W power for 3 min. Following activation, 22% w/v polyvinylpyrrolidone (PVP, Sigma-Aldrich) in DI water was pipetted into the microchannels for 1 minute to permanently alter the hydrophilic retention of PDMS. Microchannels were then washed with DI water and dried using a pressurised nitrogen gun. For storage, chips were placed in a vacuum desiccator for 3 hours, then sealed shut using vacuum-sealable food storage bags (Sunbeam). In order to obtain high-quality images of the microfluidic device microchannels an epoxy dye protocol was used (Soffe et al., 2020). For this, Sudan dye (Sigma-Aldrich) was added to 1 mL of toluene (Sigma-Aldrich) and Norland Optical Adhesive (NOA72, Norland Products). After toluene evaporated, 60 µL of the dye was added to the inlet and outlet channels of the bi-dfRC using a pipette. The dye entered the inlet channels via passive pumping (Hosokawa et al., 2004) and was cured using a spot UV curing system (OmniCure® S2000).
2.2. Asymmetric co-flowing solutions
A dual-pressure syringe pump system (NE-1010, New Era Pump Systems Inc) was used to deliver singular or dual treatment into the bi-dfRC observation chamber (OC). The pump system holds syringes (BD, MediRay) connected to the chip via 1/16” OD ethylene tetrafluoroethylene (ETFE) tubing (Kinesis), primed with a silicone tubing sleeve (Darwin Microfluidics) and short 1.5 mm OD metal tubes. Flow rate was set to 20 μL per minute.
2.3. Seed vernalisation and germination on the bi-directional-dual-flow-RootChip
In this study, Col-0 and G-CaMP3 Arabidopsis lines (originating from Toyota et al., 2018) were treated similarly throughout all experiments. Seeds were sterilised in 0.1% Triton X-100 for 3 min, followed by 70% ethanol (EtOH) for 2 min, subsequently washed 4 times with sterile Milli-Q® water (Merck). Pre-sterilised seeds were vernalised in water at 4°C for approximately 12 hours. Seeds were cultured onto half-strength Murashige and Skoog (½ MS) medium (Duchefa), 0.31 mM MES (Sigma-Aldrich) and 8% agarose. Plants on plates were grown for 4-days at a short-day cycle (8 h light, 16 h dark) with 65% humidity and 150 µmol m-2 s-1 per µA light intensity. On chip sub-culturing was achieved by transferring 4-day old Arabidopsis plants directly onto the pre-sterilised bi-dfRCs. Prior to sub-culturing, microchannels and inlets were pre-sterilised with 70% ethanol, and then washed with ½ MS/0.31 mM MES liquid medium. Agarose squares (4×4 mm) were oriented above the root inlet channel. Plants were aligned with the agarose squares and primary roots were carefully situated into the root inlet channel. Chips were stored in plastic incubation chambers (Nunc OmniTray single-well plates; Thermo Fisher Scientific), surrounded by sterile Milli-Q water, for humidity. The set-up was incubated for 5-days under the pre-alluded short-day cycle (8 h light; 16 h dark). The set up was tilted at a 45-degree angle to promote root growth into the bi-dfRC microchannel.
2.4. Fluorescence microscopy, image editing and quantification analysis
For epifluorescence microscopy, all images and videos were obtained with a Zeiss (AX10) 5x lens (EC Plan-Neofluar 5x/0.15 M27) (Supplemental Figure 1A). Ca2+ fluorescence was observed with an eGFP filter (38 HE Green Fluorescent Prot BP 450-590) and bright field (BF) was set to 2.7 ms exposure, TL lamp 30%. Images and videos were analysed either in in Fiji-ImageJ (Schindelin et al., 2012) or ZEN Blue software (Zeiss). Arabidopsis root tip quantification was accomplished utilising the freehand selection tool. Treatments were applied as either a control solution (½ Murashige and Skoog (MS) medium, plus 0.31 mM 2-(N-morpholino) ethanesulfonic acid (MES) dissolved in Milli-Q® water) or stress solution (100 mM sodium chloride (NaCl) or 20% polyethylene glycol dissolved in ½ MS/0.31mM MES media). For raw data collection fluorescence intensity was measured in the original raw video frames. Linear section 1 was sampled at the root tip columella cells, while linear sections 2 and 3 represent meristematic and elongation zone 1 and 2(ME1 and ME2) of the root, respectively, and linear sections 4 and 5 represent elongation and differentiation zone 1 and 2 (ED1 and ED2) of the root, respectively (Supplemental Figure 1B). Linear quantification was carried out with the straight-segmented tool. Five linear sections were aligned adjacently per sample, with an intersection space of 290 µm between sites 1 to 4, and 580 µm between site 4 and 5 (Supplemental Figure 1B). An analogue-to-digital conversion in ImageJ (Fiji) was used to convert evenly spaced values into a signal. Additionally, the ROI Manager, Multi Measure tool was used for a rapid semi-automatic measurement of all frames in the video. Fluorescent plot profiles at each linear section and time interval were analysed into raw data files in Excel (16.61.1 (22052000), Microsoft). Statistical analysis and graphs were conducted in Prism (V8.4.3, GraphPad). Original videos have been compressed to reduce size below 30 MB/video. Videos were exported as AVI M-JPEG compression with 100% quality and set to 30 fps, in Zen blue. Original videos are 568 images taken over 3 minutes and 3.3 fps.
2.5. Kymograph generation
Kymographs were used to show spatial intensity over time for exemplified roots. For this, original.czi files were converted into.avg video formats using Zen blue software, without compression. Every picture frame was defined as a time-point. The fluorescence intensity (corresponds to cytosolic Ca2+) of transverse pixel sections was summed up for each spatio-temporal position.
An in-house python script was developed with PyCharm (www.jetbrains.com) in Python ver. 3.6 (https://www.python.org/downloads/release/python-360/) to generate kymographs. The main functionalities were provided by the open-source computer vision library OpenCV (https://pypi.org/project/opencv-python/). The script reads out every picture within the video and applies a summation longitudinal or across the root in a manually predefining region of interest (ROI). Operation of the script is controlled via command line interface using the standard library argparse (https://docs.python.org/3/library/argparse.html).
3. Results and discussion
Site-specific exposure of environmental stress to plant roots has the potential to yield new insight into how plants detect and respond to abiotic and biotic factors. To study the role of Ca2+ signals, existing dfRC technology was adapted and extended in this research to enable bi-directional stimulation. The enhanced bi-dfRC allows for the cultivation of Arabidopsis roots to capture root elongation, cellular localisation and dispersion patterns of fluorescent signals of any kind. We used G-CaMP3 expressing Arabidopsis plants to observe NaCl and PEG-induced Ca2+ signals in the primary root. The need to modify a bi-dfRC design became apparent during initial experiments related to Ca2+ quantification with the conventional dfRC based on the design by Stanley et al., 2018 (data not shown). During these early NaCl treatment experiments, it became evident that a chip, which also enables probing from the root tip, would be of significant advantage. Such a device would allow users to quantify the signal in a spatio-temporal manner, in dependence on the first contact site, as well as with different solutions on each side of a root. This is of importance when elucidating difference in signal dispersion within the system, which can then be used as the basis for modelling approaches. By utilising G-CaMP3 lines for this, results can be compared to prior observations found with varying intensiometric calcium indicators, including R-GECO1 lines (Stanley et al., 2018). In particular, two different osmolytes, NaCl and PEG, were used in comparison to control treatment to explore Ca2+ responses in roots within 180 s post-treatment application.
3.1. Bi-directional-dual-flow-RootChip design
Identical in dimension to the conventional dfRC design (Stanley et al., 2018), the bi-dfRC adds a second adjacent set of externally accessible microchannels (Allan et al., 2022b), which are connected to the base of the root observation chamber (OC) for flow reversal (Figure 1A). As shown in Figure 1A, the root OC itself contains 34 pairs of triangular elastomeric micropillars for root guidance and force sensing. Connected to each OC are a singular media port and plant seeding area for root growth (Figure 1B), as well as the four media inlets/outlets (A & B top, C & D bottom) for chemical treatment application. As indicated in Figure 1C, using these extra inlets/outlets, chemical treatment can either be applied through inlets A and B for application of solutions from the differentiation (shoot) site or through inlets C and D for application of solution from the root tip (root) site. In either case, the other inlets then become the outlets, thus adding bi-directional treatment capabilities for targeted application of stress conditions in varying local root tissues. Independent bi-dfRCs were combined into one PDMS device to yield one to five parallel OCs on a single glass substrate (Figure 1B). Following sub-culture of 4-day old Arabidopsis roots from plant culture into the bi-dfRC, the roots grow into the OCs over another 5-days (Figure 1B), upon which stress treatments can be applied at the differentiation zone or tip (Figure 1C).
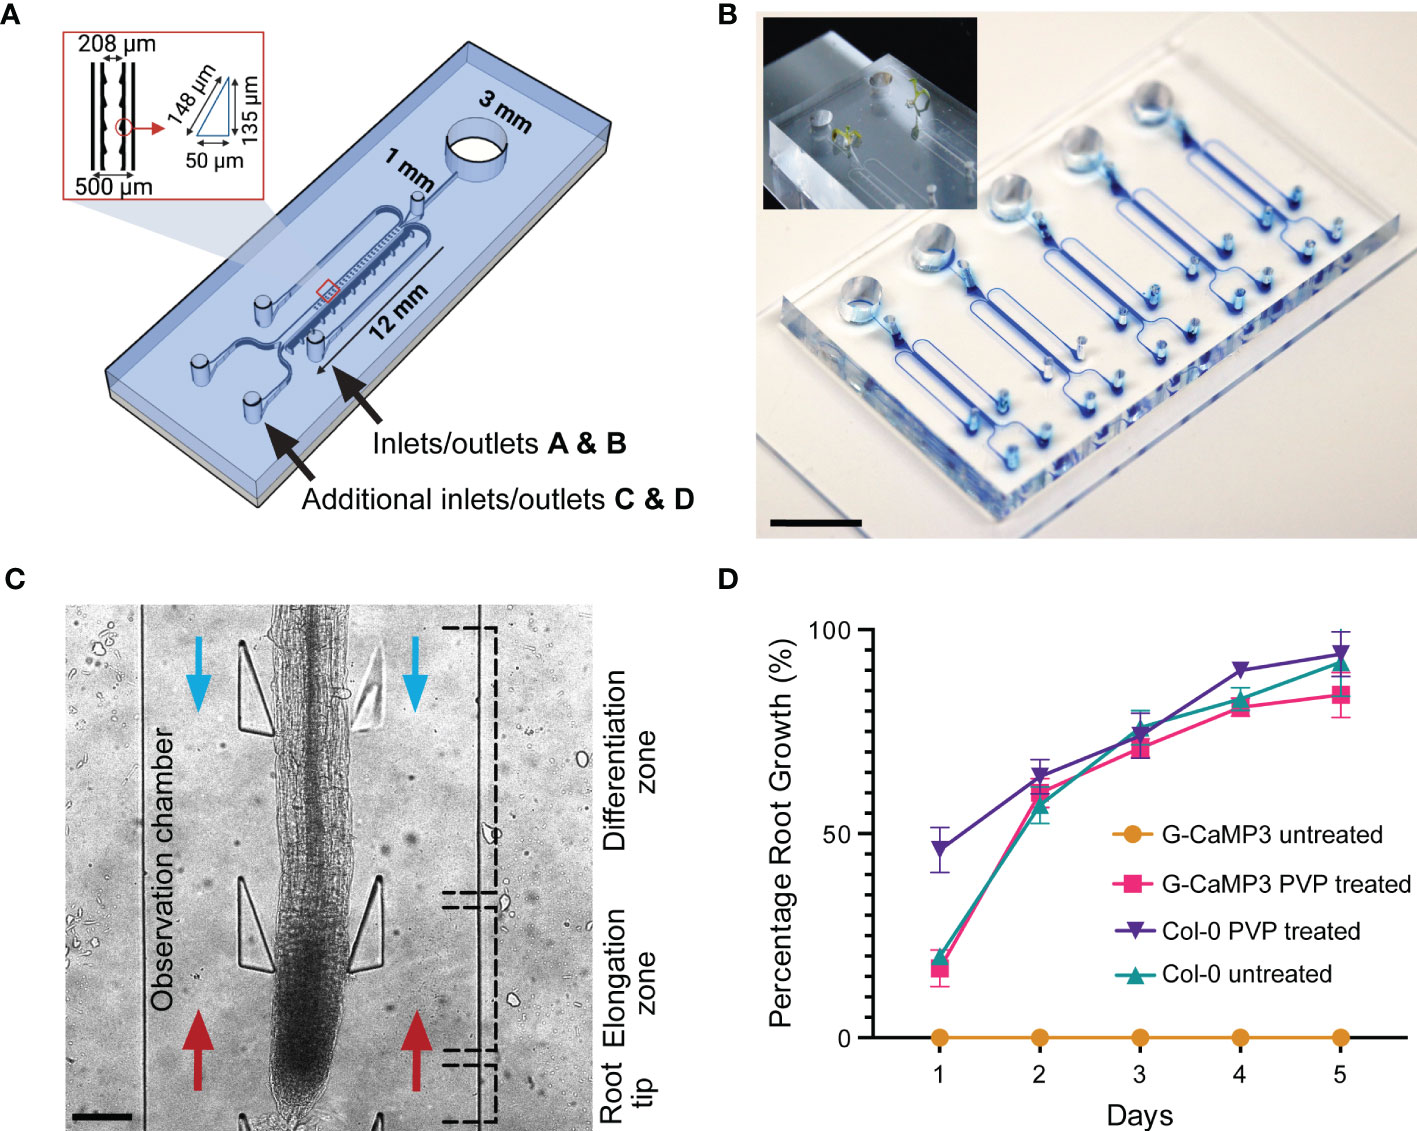
Figure 1 Bi-directional dual-flow-RootChip (Bi-dfRC) for laminar flow perfusion of stress treatments at the tip and differentiation zone of Arabidopsis roots. (A) Schematic diagram of the bi-dfRC including pillar array dimensions (identical to the conventional dfRC) in addition to a second set of inlets/outlets C & D for bi-directional stress application at the tip or differentiation zone. (B) Image of epoxy dye (blue) filled microchannels for visualisation of root observation chamber joining 4 inlet/outlets. 9-day old Arabidopsis G-CaMP3 plants cultured into the root inlet of the bi-dfRC depicted top left (scale bar 10 mm). (C) Arabidopsis G-CaMP3 root situated in the bi-dfRC observation chamber highlighting key zones (tip, elongation, and differentiation zone) and treatment orientation (blue arrows from top inlets A & B, red arrows from bottom inlets C & D, scale bar 200 µm). (D) Average percentage of Arabidopsis G-CaMP3 and Col-0 root growth into PVP-treated and untreated microchannels over 5-days (n= 100).
3.2. Hydrophilic retention of microchannels
Many PDMS microfluidic systems require hydrophilic retention or water retention to promote protrusion of tip growing organisms into fluidic microchannels (Halldorsson et al., 2015). PDMS chips however, naturally exhibit hydrophobic or water repelling surface properties in their native form (Hemmilä et al., 2012). This is in contrast to the glass base of the bi-dfRC, which typically has hydrophilic surface properties. By combining the two materials during chip fabrication, the resulting devices and OCs present a partially hydrophobic environment without further treatment (Guckenberger et al., 2014). We observed that devices with exposed hydrophobic PDMS surfaces directly hindered the root growth of the G-CaMP3 sensor line into bi-dfRC devices. Interestingly, the same surface properties had no impact on the growth of wild type Col-0 roots in our work (Figure 1D) and no growth inhibition for the R-GECO1-expressing Arabidopsis roots has been reported (Stanley et al., 2018). This difference in behavior may relate to sensing mechanisms of hydrophobic, hydrophilic, ionic and non-ionic surfaces by roots. The fully impaired protrusion of roots from G-CaMP3 lines into partially hydrophobic and hydrophilic surfaces points to a disturbance of surface sensing and charge in these lines, and the involvement of Ca2+ in this process. A known property of G-CaMP3 sensor lines is enhanced kinetics for high-speed Ca2+ imaging (Russell, 2011). Hence, G-CaMP3 may quench free cytosolic Ca2+ away from other essential physiological processes including stomatal closure, water-sensing mechanisms and sensing of varying surfaces (Cho et al., 2017). It has been reported that hydrophobic soil increases with lower pH, whereas hydrophilic soils are retained at a pH of approximately 6.5 and higher (Vogelmann et al., 2013). While, together with our observation of growth inhibition, this suggests that a fully hydrophilic microchannel should re-initiate G-CaMP3 root growth, further insight is needed to understand the details of how roots sense surface charge, hydrophobicity and other properties, as well as the role of Ca2+ in these important processes.
To test whether modified surface properties would facilitate G-CaMP3 root growth, partially hydrophobic microchannels were initially made temporarily hydrophilic via plasma activation, a method which exposes given surfaces to oxygen plasma (Jokinen et al., 2012). However, PDMS only retains this plasma-activated surface modification for minutes to hours, which severely limits its use for long-term culture (Plegue et al., 2018). To permanently preserve the hydrophilic surface, PVP - a polymer that reduces the hydrophobicity of surface particles (Kao et al., 2003), was reacted with the plasma-activated PDMS (Hashemi et al., 2017). This rendered the PDMS, and thus the bi-dfRC device OCs, permanently hydrophilic. As is demonstrated by Figure 1D, plasma-activated but PVP untreated G-CaMP3 root growth did not grow into the bi-dfRC OCs. In contrast, devices treated with PVP did not exhibit any growth limitations on G-CaMP3 roots.
3.3. Mechanics underpinning fluid flow control
While increasing functionality, adding additional inlets/outlets to a microfluidic device has the potential to increase the complexity for flow control (Figure 2A). This may lead to air bubble formation in the bi-dfRC microchannel during pressurised, controlled and active syringe pumping (Figure 2B). Backflow and leakage are a common cause of air bubble formation in microfluidic devices, a consequence of fluid flow resistance and limited flow rate control (Nakayama et al., 2006). This phenomenon is commonly caused by PDMS tearing at the inlet/outlet channels, varying circuit components or the defined size and length of circuit tubing (Xue et al., 2012). Air bubble formation in the bi-dfRC also has the potential to disrupt asymmetric profusion of two test solutions at the same time, thus leading to the mixing of these (Olanrewaju et al., 2018).
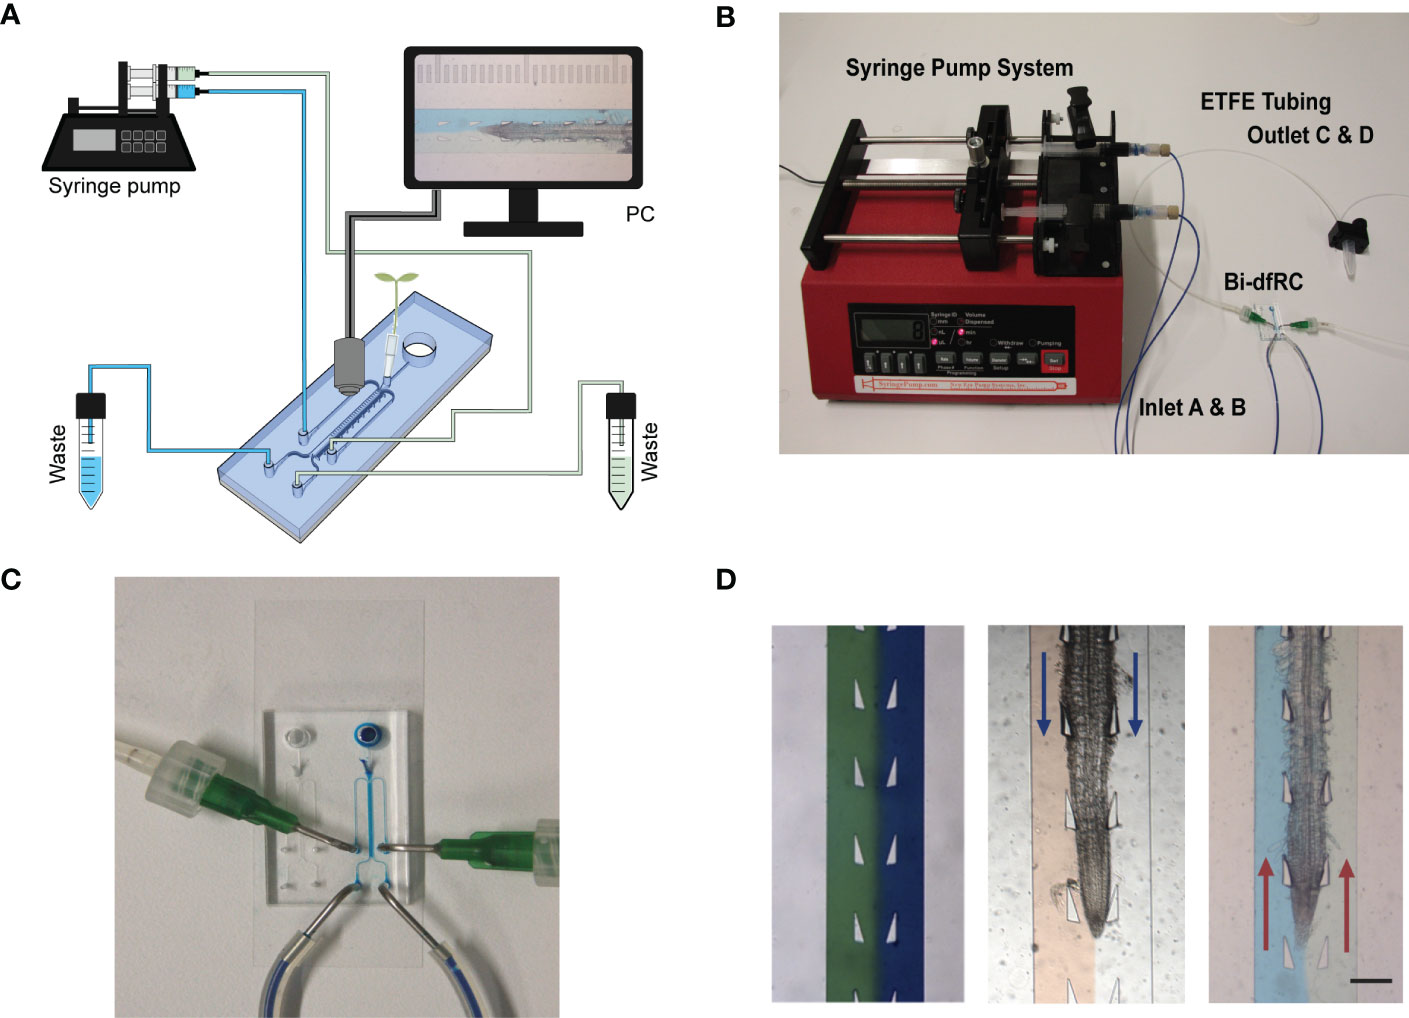
Figure 2 Bi-directional dual-flow-RootChip (Bi-dfRC) imaging set up. (A) Schematic diagram of the bi-dfRC set up with syringe pump system and tubing array for imaging. (B) Photograph of the syringe pump system, tubing and chip adapter used for the delivery of asymmetric test solutions into the bi-dfRC microchannels. (C) Close-up depicting the fluid flow into the observation chamber delivered by tubing network into the bi-dfRC in the absence of a root using blue dye (scale bar 5 mm). (D) Arabidopsis 9-day old G-CaMP3 root under asymmetric fluidic flow visualised using coloured dye in the absence and presence (flow direction indicated with blue arrows for differentiation zone and red arrows for tip) of a root (scale bar 350 μm).
To prevent the aforementioned issues, and achieve optimal fluid-flow rate control, air bubble generation was actively minimised using the following optimisations. To prevent cracking of PDMS inlets and subsequent open-loop circulation/backflow and leakage, ‘flexible ends’ for the low compliance ETFE tubing networks were constructed. Short sections of flexible tubing (Masterflex Tygon, DO-06409-16; L= 1 cm) were used to connect the stiffer tubing to pre-made 1 mm × 1 cm metal tubes with a 90-degree bend (Dispensing Tips, Nordson), as shown in Figure 2C. To expel air bubbles and dry out microchannels during fabrication, each chip was degassed for two hours (Karlsson et al., 2013; Asghar et al., 2016). Prior to on-chip root sub-culture, microchannels were pre-wetted with control media via passive pumping. To expel any air bubbles retained in the microchannels after this, negative pressure was generated via active syringe pump back pumping into the syringes, thus further reducing the size of any air bubble (Liu & Li, 2015). Lastly, to avoid air bubble introduction upon media injection via the tubing array, microchannels harboring roots were pre-flushed with control media and inlets were primed with media droplets. In tandem, the tubing was primed with desired treatment by pre-pumping the media through the tubing array. Both droplets were touched together, creating a wet seal, avoiding bubble introduction.
Fine tuning flow rate control, air bubble formation and system set up presented a dual process to optimise steady laminar flow perfusion of test solutions. In order to observe successful asymmetric flow of simultaneous test solutions in the bi-dfRC OCs, coloured dyes were first pumped into the microchannel (Figure 2D). Flow rate control and tubing array maintain the delivery of asymmetric flow at the same constant speed of 20 µl/min for both sites. As observed in Figure 2D, solution(s) injected on each side of the root remain on the initial side without observed diffusion. Hence, two different stimulation solutions do not cross-mix when applied on different sides of the root. This highlighted the retention of co-flow in the bi-dfRC microchannels in the presence of an Arabidopsis root (Figure 2D).
3.4. NaCl and PEG induce an early calcium burst in the primary root
Calcium signals have been shown to be involved in early plant defence sensing, and response to salt and drought stress (Knight et al., 1997; Kiegle et al., 2000; Li et al., 2022). Prior studies tracked Ca2+ signals utilising various green fluorescent sensors including R-GECO1 (Stanley et al., 2018), YCNano-65 (Choi et al., 2014) and MatryoshCaMP6s (Ast et al., 2017). Based on refined spatio-temporal resolution and sensitivity, G-CaMP3 expressing Arabidopsis lines (Bi et al., 2021), with fast responsiveness towards Ca2+ oscillations were chosen to study the early Ca2+ response upon NaCl-induced salinity stress and PEG-induced drought stress. It should be noted that limitations exist with Ca2+ sensor technology, including Ca2+ quenching (Ca2+ sensor binding to Ca2+) and buffering the Ca2+ response (Granqvist et al., 2012). Additionally, it has been reported that some Ca2+ sensors are more sensitive towards physiological response mechanisms, such as G-CaMP6 reporting Ca2+ bursts from single action potentials (Cho et al., 2017). Moreover, variations of such factors may have an underlying effect on the observable physiological response of the root towards various stressors, limiting spatiotemporal resolution of the Ca2+ signal. As such, comparison of experimental observations using different sensors can be difficult at times due to the varying kinetics. Consequently, differences in observed Ca2+ spatio-temporal transmission within the literature is expected and will be further discussed in the sections below.
3.4.1. The initial contact site with NaCl and PEG affect Ca2+ signal direction
Ca2+ signals primarily initiated in root tissue directly exposed to NaCl or PEG, then dispersed shoot or root ward depending on the first contact site of the stressor. The solution moves through the channel with a constant flow rate of 20 µL/min, due to the known dimensions of the channel and the root we can calculate that the solution needs ~1.76 sec to fill the 12 mm channel, when the root has grown 6 mm (50%) into the channel. Hence, the solution moves through the bi-dfRC with a speed of ~6.84*103 µm/s. In contrast, the observed Ca2+ signal in the root induced by NaCl or PEG move at a speed of 4-14 µm/s, which is far slower than the solution. Therefore, it can be excluded that the flow of the solution in the channel of the chip is responsible for the movement of the Ca2+ signal within the root. NaCl-induced salinity stress and PEG-induced drought stress both reduce water absorption and obstruct water movement, inducing downstream osmotic and oxidative stress pathways (Ma et al., 2020). Here, we show differences in signal heterogeneity during local cellular and systemic Ca2+ signaling in roots responding to alternative types of osmotic stress inducing compounds.
The spatio-temporal Ca2+ signals responding to environmental stress are shared between many organisms, including animals and plants (Clapham, 2007; Manishankar et al., 2018). In plant leaves and root tissues, increase of cytosolic Ca2+ has previously shown local osmotic stress applications (Liu et al., 2010; Choi et al., 2014; Ast et al., 2017; Huang et al., 2017; Stanley et al., 2018; Zhang et al., 2020). The signal has been documented as a ‘wave’ that initiated from site-specific NaCl stress at the lateral root (Choi et al., 2014). Specifically, the signal observed in Choi et al., 2014 initiated at the tip, emanated through cortical and endodermal cells of the lateral root, yet was not observed in epidermal cells. The Ca2+ wave then traversed through the primary root, splitting bi-directionally shoot and tip-ward, at a speed of 400 µm/s. The signal also systemically transmitted to above regions of the plant, moving through the hypocotyl (Choi et al., 2014) and leaves (Xiong et al., 2014). We show Ca2+ signal localisation and orientation in primary roots responding to a full or one-sided NaCl and PEG solution at the tip or differentiation zone. Based on former literature that observed Ca2+ signaling in response to NaCl treatment, 100 mM NaCl was chosen for the presented experiments (Choi et al., 2014; Stanley et al., 2018). Effects of 100 mM NaCl treatment on Arabidopsis has been well studied in the past, which allows integration of our insights into the existing knowledge (Yang et al., 2019; Cackett et al., 2022). PEG-6000 is known to induce drought stress via lowering plants water potential as a result of osmotic stress (Sevindik et al., 2022). Prior observations revealed a strong physiological drought inducing response at a concentration of 20% (Hellal et al., 2018; Huang et al., 2021). In complement, preliminary data detailed in Allan, 2021 showed 20% PEG induced the strongest Ca2+ response compared to lower fluorescence intensities observed at 0%, 5%, 10% and 40% concentrations. All G-CaMP3 and Col-0 control figures and videos are provided in the supplemental material (Supplemental Figure 2; Supplemental Videos 9, 10). Ca2+ increased at epidermal cells of the differentiation zone upon first contact with the NaCl stressor applied at the shoot site. The propagating Ca2+ signal increased in intensity 1.5-fold and transmitted from the initial site, moving through the cortical and endodermal cells on both sides of the root, to the stele tissue. The signal also dispersed tip-ward through the epidermal, cortical and stele tissue, followed by a systemic increase of Ca2+ at the tip (P-value ≤ 0.02). The signal transferred longitudinally through the cortical and stele tissues, at a speed of 6.8 μm/s (SD = 0.9, n = 10) (Figures 3A, B, 4A; Supplemental Figures 3A, B, 5; Supplemental Video 1). The same Ca2+ signal was observed following PEG treatment at the differentiation zone, increasing in intensity 1.5-fold. Opposingly to the signal observed under salt, Ca2+ propagated from the endodermis/cortex into adjacent tissues, then traveled tip-ward at a faster speed of 11.6 µm/s (SD =1.6, n = 5) (Figures 5A, B, 6A; Supplemental Figures 4A, B, 5; Supplemental Video 2).
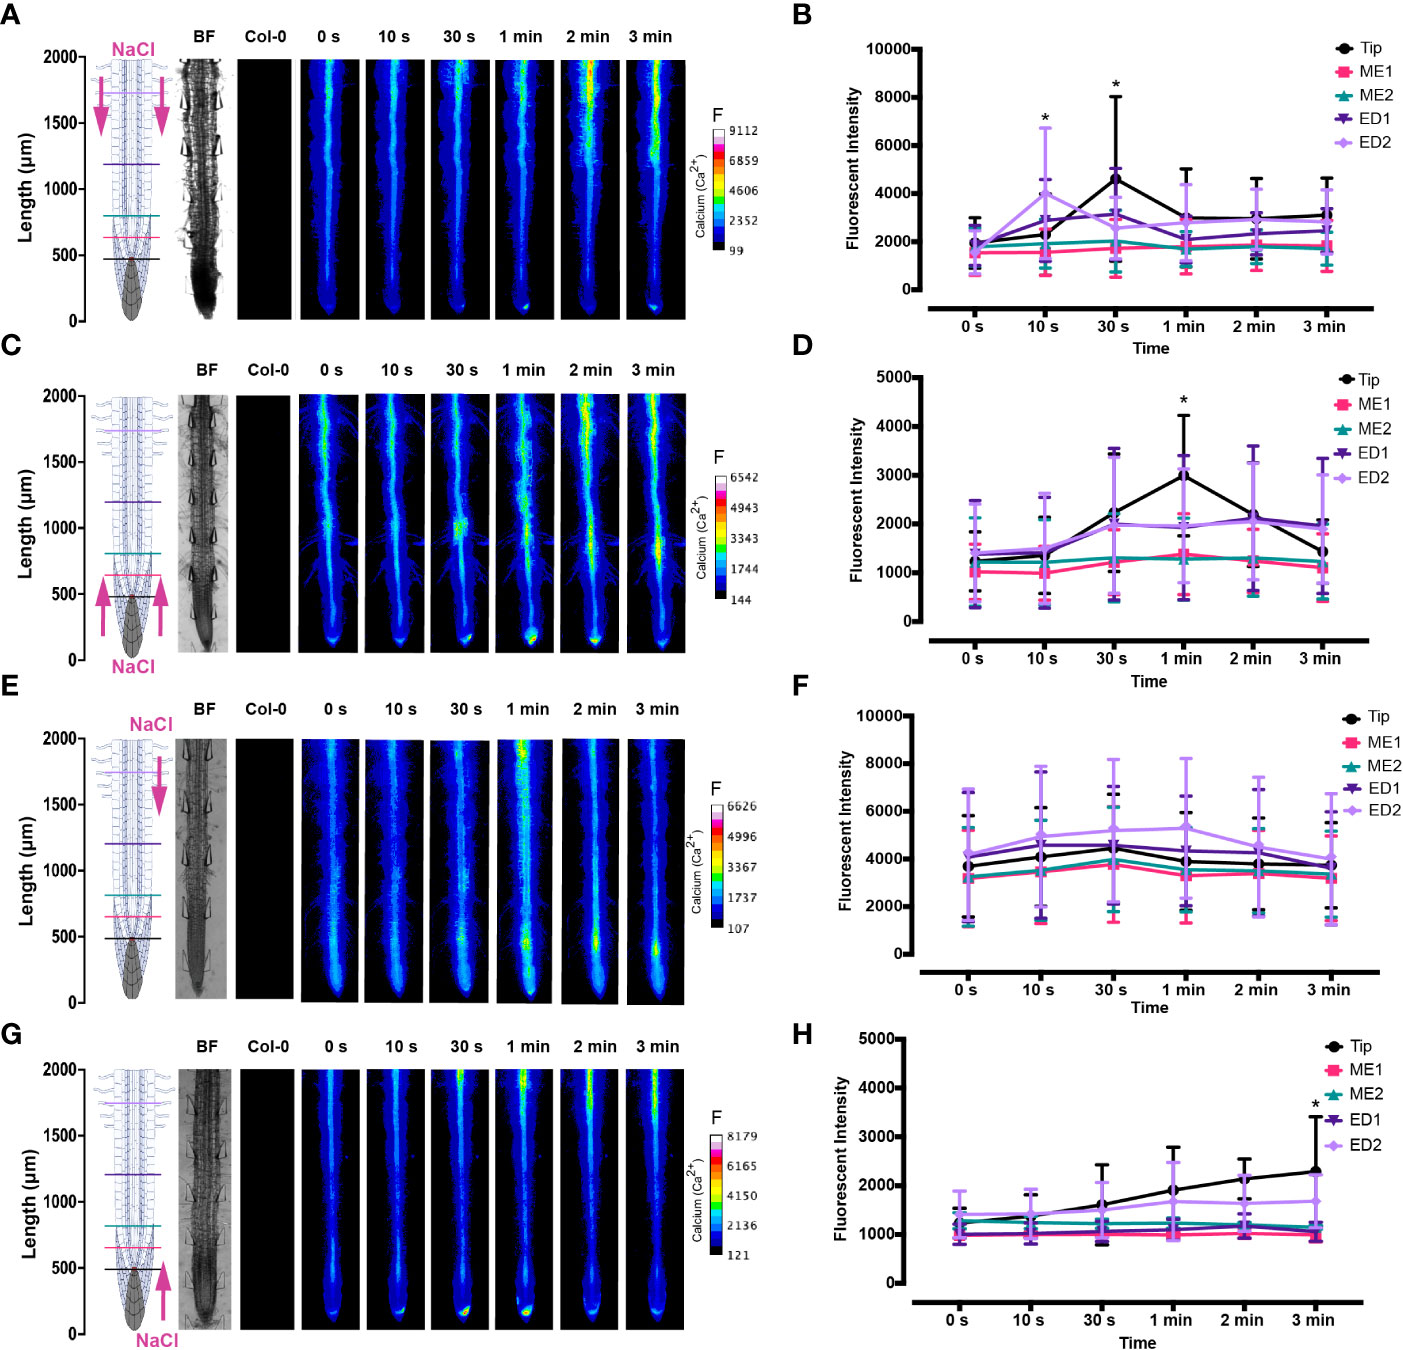
Figure 3 Fluorescence intensity of Ca2+ in Arabidopsis G-CaMP3 roots exposed to NaCl (100 mM). Fluorescence was observed for 180 s post NaCl treatment. (A) Heat map depicting Ca2+ release, corresponding to increase in G-CaMP3 fluorescence. Five linear sections used for fluorescence quantification upon targeted application of NaCl treatment through inlets A (left) & B (right) at the differentiation zone (DZ) are shown (n= 10). Colour change indicates an increase in Ca2+ fluorescence. Root schematic depicting treatment application, orientation (salt; NaCl and control; MS media) and linear sections (refer to key), bright field (BF) and control (wild type Col-0) roots displayed on the left. Scale; F= fluorescence intensity. (B) Line graph with two-way ANOVA multiple comparisons Tukey’s honestly significant difference (HSD) mean comparison test (P-value ≤ 0.05) depicting average fluorescence intensity (ADU; analogue digital units) of Ca2+ across five linear sections (Tip, ME1, ME2, ED1 & ED2) upon targeted exposure of salt treatment through inlets A & B at the DZ (n = 10). Asterisks (*) indicate statistical significance. (C) Heat map depicting Ca2+ release, and corresponding increase in G-CaMP3 fluorescence, upon salt treatment through inlets C (left) & D (right) at the tip (n= 10). (D) Line graph depicting average fluorescence intensity of Ca2+ across five linear sections following salt treatment through inlets C & D at the tip (n= 10). (E) Heat map depicting Ca2+ release, and corresponding increase in G-CaMP3 fluorescence, upon salt treatment through inlet B and control media through inlet A at the DZ (n= 10). (F) Line graph depicting average fluorescence intensity of Ca2+ across five linear sections following salt treatment through inlet B and control treatment through inlet A at the DZ (n= 10). (G) Heat map depicting Ca2+ release, and corresponding increase in G-CaMP3 fluorescence, upon salt treatment through inlet D and control treatment through inlet C at the tip (n= 5). (H) Line graph depicting average fluorescence intensity of Ca2+ across five linear sections upon salt treatment through inlet D and control through inlet C at the tip (n= 5).
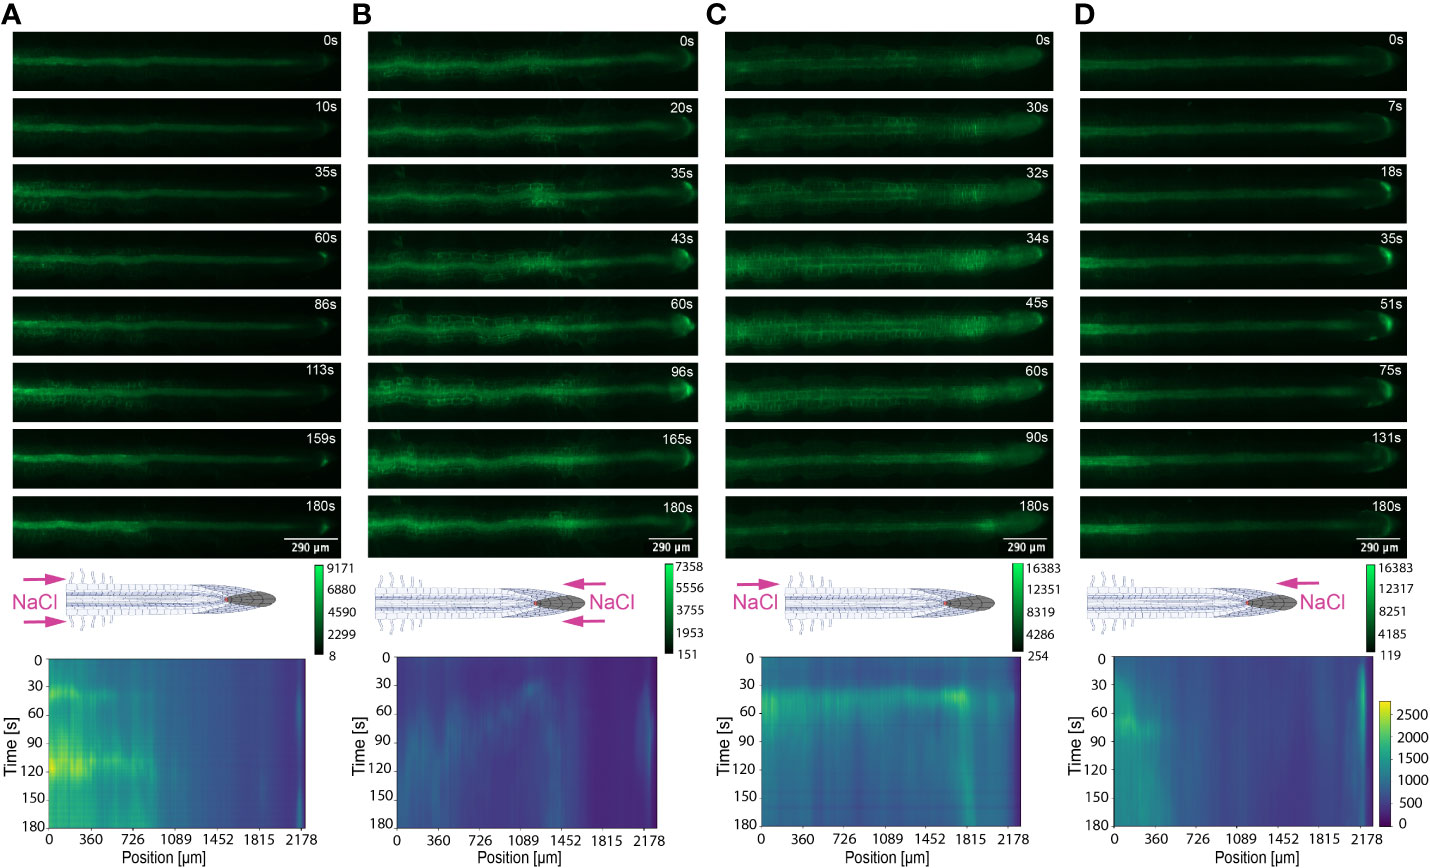
Figure 4 Key Ca2+ signal localisation in Arabidopsis roots exposed to 100 mM NaCl. Schematic diagrams depict treatment localisation and orientation at the root within the bi-dfRC with fluorescent intensity calibration bars. Kymographs depict the spatial fluorescense of GFP corresponding to Ca2+ in the root over time, in dependence of treatment orientation and localisation. GFP fluorescence in kymographs is color coded, ranging from dark blue to yellow (normalized for all samples). (A) Key Ca2+ localisation pattern upon NaCl treatment through inlets A & B of the bi-dfRC at the differentiation zone. (B) Key Ca2+ localisation pattern upon NaCl treatment through inlets C & D of the bi-dfRC at the tip. (C) Key Ca2+ localisation pattern upon NaCl treatment through inlet B (top) and control treatment through inlet A (base) of the bi-dfRC at the differentiation zone. (D) Key Ca2+ localisation pattern upon NaCl treatment through inlet D (top) and control treatment through inlet C (base) of the bi-dfRC at the tip.

Figure 5 Fluorescence intensity of Ca2+ in Arabidopsis G-CaMP3 roots exposed to PEG (20%). Fluorescence was observed for 180 s post PEG treatment. (A) Heat map view depicting Ca2+ release, corresponding to increase in G-CaMP3 fluorescence. Five linear sections used for fluorescence quantification upon targeted application of PEG treatment through inlets A (left) & B (right) at the differentiation zone (DZ) are shown (n= 5). Colour change indicates an increase in Ca2+ fluorescence. Root schematic depicting treatment application, orientation (Polyethylene glycol; PEG and control; MS media) and linear sections (refer to colour key), bright field (BF) and control (wild type Col-0) roots displayed on the left. Scale; F= fluorescence intensity. (B) Line graph with two-way ANOVA multiple comparisons Tukey’s honestly significant difference (HSD) mean comparison test (P-value ≤ 0.05) depicting average fluorescence intensity (ADU; analogue digital units) of Ca2+ across 5 linear sections (Tip, ME1, ME2, ED1 & ED2) upon targeted exposure of PEG treatment through inlets A & B at the DZ (n = 5). Asterisks (*) indicate statistical significance. (C) Heat map depicting Ca2+ release, and corresponding increase in G-CaMP3 fluorescence, upon PEG treatment through inlets C (left) & D (right) at the tip (n= 5). (D) Line graph depicting average fluorescence intensity of Ca2+ across 5 linear sections following PEG treatment through inlets C & D at the tip (n= 5). (E) Heat map depicting Ca2+ release, and corresponding increase in G-CaMP3 fluorescence, upon PEG treatment through inlet B and control media through inlet A at the DZ (n= 5). (F) Line graph depicting average fluorescence intensity of Ca2+ across 5 linear sections following PEG treatment through inlet B and control treatment through inlet A at the DZ (n= 5). (G) Heat map depicting Ca2+ release, and corresponding increase in G-CaMP3 fluorescence, upon PEG treatment through inlet D and control treatment through inlet C at the tip (n= 5). (H) Line graph depicting average fluorescence intensity of Ca2+ across 5 linear sections upon PEG treatment through inlet D and control through inlet C at the tip (n= 5).
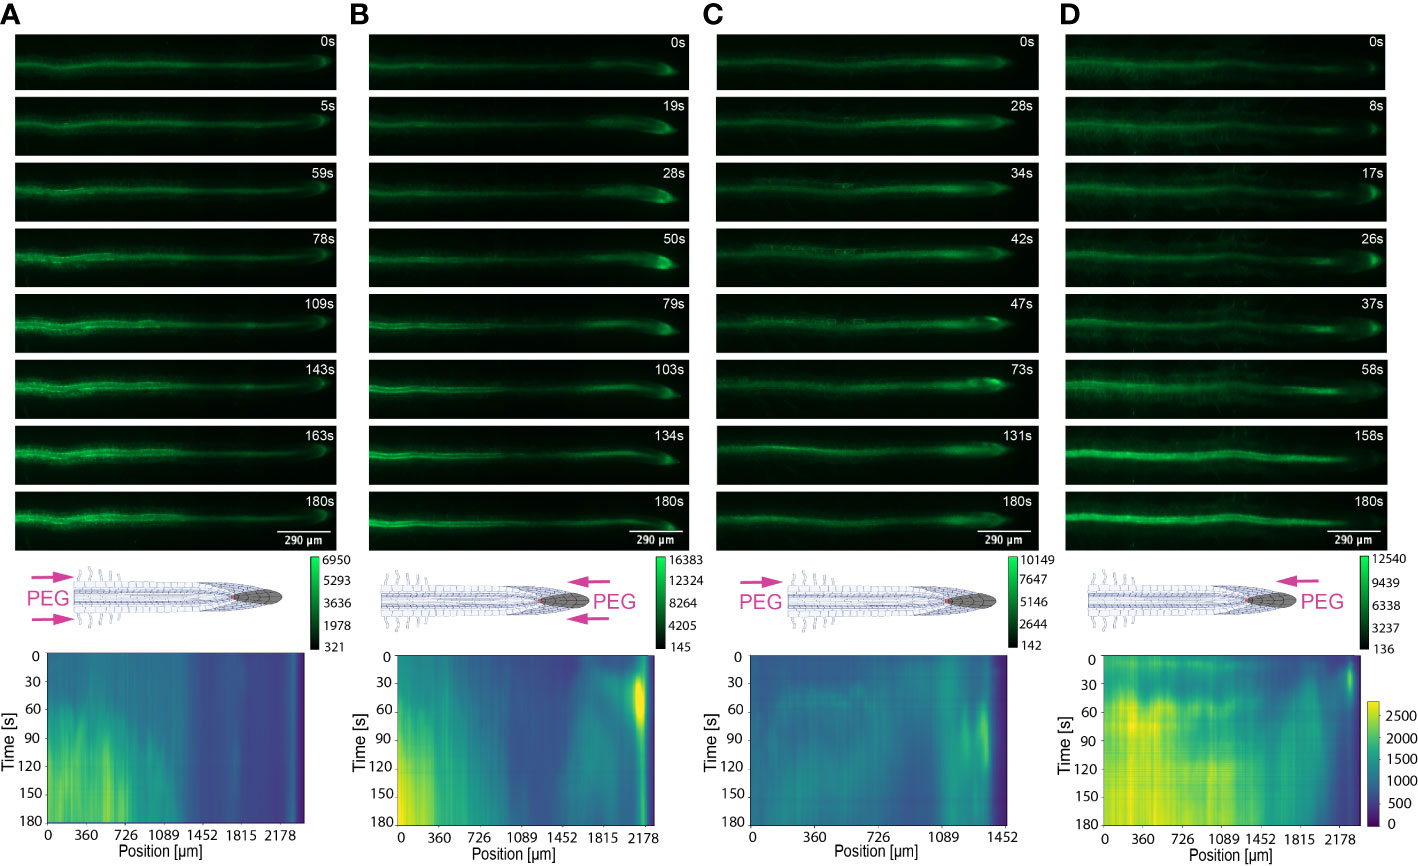
Figure 6 Key Ca2+ signal localisation in Arabidopsis roots exposed to 20% PEG. Schematic diagrams depict treatment localisation and orientation at the root within the bi-dfRC with fluorescent intensity calibration bars. Kymographs depict the spatial fluorescense of GFP corresponding to Ca2+ in the root over time, in dependence of treatment orientation and localisation. GFP fluorescence in kymographs is color coded, ranging from dark blue to yellow (normalized for all samples). (A) Key Ca2+ localisation pattern upon PEG treatment through inlets A & B of the bi-dfRC at the differentiation zone. (B) Key Ca2+ localisation pattern upon PEG treatment through inlets C & D of the bi-dfRC at the tip. (C) Key Ca2+ localisation pattern upon PEG treatment through inlet B (top) and control treatment through inlet A (base) of the bi-dfRC at the differentiation zone. (D) Key Ca2+ localisation pattern upon PEG treatment through inlet D (top) and control treatment through inlet C (base) of the bi-dfRC at the tip.
Conversely, following full NaCl treatment at the tip, Ca2+ upregulated at the columella cells, then increased in intensity 2.5-fold (P-value ≤ 0.05). This was followed by a Ca2+ wave that traveled shoot-ward throughout the stele tissue of the elongation zone to the differentiation zone at a speed of 5.9 µm/s (SD = 0.4, n = 10) (Figures 3C, D, 4B; Supplemental Figures 3C, D, 5; Supplemental Video 3). The same signal was observed following PEG treatment at the tip, whereby the signal increased 4-fold at the columella cells (p-value ≤ 0.0017). This signal was stronger in the endodermis and cortex, yet traveled shoot-ward at an increased speed of 10.5 µm/s (SD =1.6, n = 5) (Figures 5C, D, 6B; Supplemental Figures 4C, D, 5; Supplemental Video 4). Summarising, different root tissues are involved in local and systemic transmission of early Ca2+ signals in response to two different types of osmolyte. The resulting temporal signal patterns depended on the first contact site (differentiation zone or tip) and the inducing stressor. Early studies showed Ca2+ release, and corresponding increase in G-CaMP3 fluorescence, initiated in the root system upon immersion of entire 6 to 7-day old plantlets in NaCl (Knight et al., 1997; Kiegle et al., 2000). Patch clamp studies utilising protoplasts from maize root tips also showed cytosolic Ca2+ increased following PEG treatment (Liu et al., 2010). Later studies on the spatio-temporal NaCl induced-Ca2+ burst in lateral roots showed signal heterogenicity in the tissue and cell specificity (Choi et al., 2014; Ast et al., 2017). In roots expressing the ratiometric MatryoshCaMP6s transgenic detector, Ca2+ initially upregulated within defined cells of the root cap 4 s following NaCl application at the tip, then increased in intensity, while travelling through lateral root cap, epidermis and cortex within 39 s (Ast et al., 2017). Prior observations also showed a Ca2+ burst in different cells of P. edulis root tips, induced by submerging the planets in PEG for 10 minutes (Jing et al., 2019). Site specifically applying NaCl at the region where the lateral root protruded from the primary root revealed Ca2+ signaling originated at the localised cells of the cortical and endodermal cell layers (Choi et al., 2014). As discussed, this was followed by fast systemic signal propagation throughout the root expressing FRET based YCNano-65 sensor, depending on the conductance of Ca2+ through the ion channel protein Two Pore Channel 1 (TPC1) (Choi et al., 2014). A much slower Ca2+ signal was observed compared to Choi et al., 2014. This discrepancy may be due to the use of a bi-dfRC system combined with the G-CaMP3 sensor, compared to an agarose gel-based system incorporated with the FRET based YCNano-65 sensor (Choi et al., 2014). Moreover, YCNano-65 has been shown to have a dissociation constant (Kd) of 64.8 nM (Horikawa et al., 2010), compared to 660 nM in G-CaMP3 (Tian et al., 2009), which may lead to a faster documented signal, but also different physiological effects on the sensor line overall.
Interestingly, the initial Ca2+ release, and corresponding increase in G-CaMP3 fluorescence, and longitudinal dispersion of Ca2+ following primary root tip exposure to NaCl and PEG in G-CaMP3 transgenic roots reported here was slower, yet comparable to observations in Ast et al., 2017, utilising ratiometric MatryoshCaMP6s expressing roots. Additionally, the systemic transmission of Ca2+ through varying tissues following initial Ca2+ release, and corresponding increase in G-CaMP3 fluorescence, at both the differentiation zone or tip treatment sites showed a similar tissue-specific dispersion pattern.
3.4.2. Different transverse and longitudinal tissue specific Ca2+ signals arise following one-sided NaCl and PEG treatment
The NaCl and PEG-induced Ca2+ signals initiated on the treated side of the root. Observations showed varying cell types and tissues were involved in the spatio-temporal dispersion of Ca2+, in dependence on the initial stress site. A one-sided NaCl or PEG treatment at the differentiation zone always led to a transversely moving signal, from the contact to the non-contact side. The signal then moved longitudinally to the tip. Upon NaCl treatment at the differentiation zone, the Ca2+ burst emanated from epidermal cells spanning the elongation and differentiation zone on the treatment side of the root, in addition to the root tip. The signal increased 1.5-fold in intensity and transversely moved from the treated to untreated side of the root at a speed of 9.4 μm/s. A secondary Ca2+ wave was observed, which moved longitudinally to the root tip through stele tissue at a speed of 5.2 μm/s (SD = 0.57, n= 10) (Figures 3E, F, 4C; Supplemental Figures 3E, F, 5; Supplemental Video 5). PEG induced the same transverse signal response yet this was faster, less intense and did not transmit to the untreated side of the root. Additionally, the secondary longitudinal Ca2+ signal transmitted not only tip-ward, but bi-directionally, root and shoot ward at a speed of 11 μm/s (SD = 1.4, n= 5) through cortical and stele tissue. (Figures 5E, F, 6C; Supplemental Figures 4E, F, 5; Supplemental Video 6). Prior observations show the NaCl-induced Ca2+ signal traveled transversely at a comparable rate 14.1 μm/s (Stanley et al., 2018). This traversing Ca2+ wave is only observed following one-side osmolyte treatment at the differentiation zone and not the tip. This suggests that the traversing Ca2+ signal observed is due to the Ca2+ signal itself, rather than the diffusion of NaCl or PEG into the root.
Excitingly, for the first time we show a one-side NaCl and PEG treatment from the tip. The Ca2+ burst localised on the right side of the columella cells, which then increased in intensity on the right side of the tip by 2.5-fold. Next, the Ca2+ signal dispersed shoot-ward through stele tissue and cortical tissue of the differentiation zone, at a speed of 4.2 μm/s (SD = 0.51, n= 5) (Figures 3G, H, 4D; Supplemental Figures 3G, H, 5; Supplemental Video 7). PEG induced a similar signal response (P-value ≤ 0.0441), however traveled faster at a speed of 14.2 µm/s (SD = 1.9, n= 5), and reaching a 0.5-fold higher intensity (Figures 5G, H, 6D; Supplemental Figures 3G, H, 5; Supplemental Video 8).
The associated kymographs show that Ca2+ signals can orient in different directions based on the initial NaCl or PEG treatment site. Moreover, both PEG and NaCl induced a strong Ca2+ burst at the tip if the stress is applied locally. However, PEG induced a stronger signal throughout the differentiation zone in all treatments (Figures 4A, B). Plant root responses to environmental stress are highly sensitive and differ at the cellular, tissue, and organ level (Duan et al., 2015). Moreover, site specific localisation of osmotic stress to varying tissues at the primary root suggests plants are well adapted to sense environmental stress directly in affected tissues. Building on early observations, we show the initial Ca2+ signal in the primary root is not only site-specific to cells exposed to locally applied osmotic stressors, but also systemically transmits away from initially stimulated cells, at the tip and differentiation zone. Additionally, the Ca2+ wave passed through different root tissues and cells depending on the initial site of Ca2+ release, and corresponding increase in G-CaMP3 fluorescence. Osmotic stress inhibits plant root growth and development via redistribution of the stress hormone auxin from the quiescent center (QC) and root cap to the epidermal and cortical cells of the elongation zone, causing the root to bend away from high salt concentrations (Smolko et al., 2021). Additionally, when cells are exposed to auxin, membrane-bound proton pumps export H+, decreasing apoplastic pH and ultimately leading to cell wall loosening – known as the acid growth hypothesis (Arsuffi & Braybrook, 2018). Prior studies showed that Ca2+ signaling participated in root growth and stress sensing via modulating auxin responses to abiotic stress (Shih et al., 2015; Dindas et al., 2018; Leitão et al., 2019).
The different Ca2+ signal patterns responding to NaCl and PEG in varying orientations and localisations observed here may be intrinsically linked to auxin movement and root growth under osmotic stress. Further studies will be needed to clearly link the exact signaling mechanisms.
We also observed varying rates of longitudinal Ca2+ transmission depending on the localisation and orientation of NaCl or PEG treatment. Prior observations showed that signal cross-talk exists between extracellular reactive oxygen species (ROS) hydrogen peroxide (H2O2), and intracellular Ca2+ for systemic propagation of the signal between varying cells and tissue (Gilroy et al., 2014; Stanley et al., 2018). Longitudinal signal transmission rates can vary based on the number of cell boundaries present within varying root tissues (Gilroy et al., 2014). Moreover, the different longitudinal tissue specific signals observed between full and one-sided NaCl or PEG treatment may generate varying signal speeds. Such findings suggest that differences in cell types and tissues may regulate how the Ca2+ signals are sensed, transmitted over space and time and decoded into a response. This includes the existence of 1085 distinct proteins associated with Ca2+ binding and/or calcium ion sensor activity (Allan et al., 2022a). Employment of such cell or stimulus specific decoders and responders in roots may impact the transmission pattern of Ca2+ transient signatures across varying tissues for long distance signaling, in dependence of the exact localisation of an external stress in the soil. Overall, the presented research focused on optimising a bi-dfRC microfluidic device that allowed precise tracking of root Ca2+ signal directionality in response to stress solution in varying orientations and localisations. Summarising, we reported novel insights into the traverse and longitudinal directionality of osmolyte induced-Ca2+ signals. These signals were transmitted root or shoot-ward in depends of on the first contact site with the stress solution. Results presented here suggest that plants may use different sensing machinery in response to abiotic stress conditions. However, more research is required to confirm that the varying signal responses may fine tune adaptation processes.
4. Conclusion
Advances in bi-dfRC technology have revealed fascinating Ca2+ signal patterns in response to osmotic stress in varying localisations and orientations in the primary root. We show both NaCl and PEG treatments induced a Ca2+ signal that initially upregulated at the cells in first contact with the stressor. Following osmolyte treatment at the root tip, the Ca2+ signal initiated at the columella cells. Whereas, osmolyte treatment at the shoot site resulted primarily in cytosolic Ca2+ increase in the epidermal and cortical tissues of the differentiation zone. The following systemic transmission of Ca2+ is always oriented away from the initial contact site, and propagated faster in PEG than NaCl treated roots. Interestingly the signal moved longitudinally through different cell types depending on the localisation and orientation of the stress. Additionally, a one-sided NaCl or PEG treatment at the shoot site induced a Ca2+ signal that primarily traveled transversely through the root. The signal patterns observed here are complex, given that the root is a cylindrical 3D object compared to leaves, which can be simplified as a cuboid object. Hence, present results are limited by our 2D observations, due to the given speed limit of imaging processes to date.
Many Ca2+ sensors are now implemented in research, so it is important to note that their kinetics widely vary (Mertes et al., 2022). The G-CaMP3 sensor uitilised here harbours increased sensitivity and binding affinity compared to prior G-CaMP family sensors (Tian et al., 2009). However, more recently engineered Ca2+ sensors, including FRET-based MatryoshCaMP6s, exhibit superior fluorescence, dynamic range and sensitivity (Ast et al., 2017). Consequently, limitations of spatiotemporal resolution still exist using the G-CaMP3 sensor, as the signal speed and intensity observed may vary in prior and future studies, depending on the system and fluorescence indicator chosen. Moving forward, there is a need to be thoughtful about the side effects fluorescent sensors may have on plant physiological stress responses towards varying environmental stressors. The presented bi-dfRC application is not restricted to NaCl and PEG-induced Ca2+ stress signaling. We propose the asymmetric laminar flow capabilities of the bi-dfRC will present a broad application basis to investigate defence signaling in response to abiotic osmolytes and biotic peptides, and the combinatory effects of both. Future applications will also provide insight into possible paralleled signaling between Ca2+ and the ROS H2O2, in addition to downstream signaling including nitric oxide (NO) and lipids, while observing and tracking RNA and protein movement within root cells. We believe that this technology will position us better for future studies that will potentially lead to novel insights into mechanisms of molecular adaptations that underlie improved tolerance and survival of crop plants to challenges imposed by climate and pathogens.
Data availability statement
The raw data supporting the conclusions of this article will be made available by the authors, without undue reservation.
Author contributions
C-NM and VN supervised the experiments. CA performed and designed the experiments and analysed the data. R.H. wrote the script for Ca2+ quantification and Kymogram analysis. VN designed and prepared the wafer for the chips. AT provided technical assistance to CA. C-NM and VN conceived the project. CA wrote the article with contributions of all the authors. C-NM and VN supervised and completed the writing. C-NM agrees to serve as the author responsible for contact and ensures communication. All authors contributed to the article and approved the submitted version.
Funding
PhD student C. Allan receives a scholarship from the Biomolecular Interaction Centre, Christchurch. Furthermore, research was supported by funding to Meisrimler by the Faculty of Science, University of Canterbury and Royal Society Te Apārangi Catalyst funding CSG-UOC1902 and to V. Nock by the Rutherford Discovery Fellowship RDF-19-UOC-019 and Biomolecular Interaction Centre funding.
Acknowledgment
The authors thank R. Morris and S. Eccersall for proof reading the manuscript and critical feedback. We are grateful to M. Toyota for sharing G-CaMP3 lines used in this study.
Conflict of interest
The authors declare that the research was conducted in the absence of any commercial or financial relationships that could be construed as a potential conflict of interest.
Publisher’s note
All claims expressed in this article are solely those of the authors and do not necessarily represent those of their affiliated organizations, or those of the publisher, the editors and the reviewers. Any product that may be evaluated in this article, or claim that may be made by its manufacturer, is not guaranteed or endorsed by the publisher.
Supplementary material
The Supplementary Material for this article can be found online at: https://www.frontiersin.org/articles/10.3389/fpls.2022.1040117/full#supplementary-material
Supplementary Video 1 | An Arabidopsis G-CaMP3 root exposed to 100 mM NaCl at the differentiation zone via inlets A & B of the bi-dfRC. At time interval 20 s, mature cells are primarily stimulated (GFP). The playback rate is 30 fps. Scale bar, 290 μm.
Supplementary Video 2 | An Arabidopsis G-CaMP3 root exposed to 20% PEG at the differentiation zone via inlets A & B of the bi-dfRC. At time interval 30 s, mature cells are primarily stimulated (GFP). The playback rate is 30 fps. Scale bar, 290 μm.
Supplementary Video 3 | An Arabidopsis G-CaMP3 root exposed to 100 mM NaCl at the tip via inlets C & D of the bi-dfRC. At time interval 10 s, tip cells are primarily stimulated (GFP). The playback rate is 30 fps. Scale bar, 290 μm.
Supplementary Video 4 | An Arabidopsis G-CaMP3 root exposed to 20% PEG at the tip via inlets C & D of the bi-dfRC. At time interval 10 s, tip cells are primarily stimulated (GFP). The playback rate is 30 fps. Scale bar, 290 μm.
Supplementary Video 5 | An Arabidopsis G-CaMP3 root exposed to 100 mM NaCl through inlet B (top) and control through inlet A (base) of the bi-dfRC at the differentiation zone. At time interval 25 s, mature cells are primarily stimulated (GFP). The playback rate is 30 fps. Scale bar, 290 μm.
Supplementary Video 6 | An Arabidopsis G-CaMP3 root exposed to 20% PEG through inlet A (base) and control through inlet B (top) of the bi-dfRC at the differentiation zone. At time interval 30 s, mature cells are primarily stimulated (GFP). The playback rate is 30 fps. Scale bar, 290 μm.
Supplementary Video 7 | An Arabidopsis G-CaMP3 root exposed to 100 mM NaCl through inlet D (top) and control through inlet C (base) of the bi-dfRC at the tip. At time interval 10 s, tip cells are primarily stimulated (GFP). The playback rate is 30 fps. Scale bar, 290 μm.
Supplementary Video 8 | An Arabidopsis G-CaMP3 root exposed to 20% PEG through inlet D (top) and control through inlet C (base) of the bi-dfRC at the tip. At time interval 10 s, tip cells are primarily stimulated (GFP). The playback rate is 30 fps. Scale bar, 290 μm.
Supplementary Video 9 | An Arabidopsis G-CaMP3 root exposed to control ½ MS/0.31 mM MES media through inlet A & B of the bi-dfRC at the differentiation zone. No Ca2+ burst is observed. The playback rate is 30 fps. Scale bar, 290 μm.
Supplementary Video 10 | An Arabidopsis G-CaMP3 root exposed to control ½ MS/0.31 mM MES media through inlet C & D of the bi-dfRC at the differentiation zone. No Ca2+ burst is observed. The playback rate is 30 fps. Scale bar, 290 μm.
References
Allan, C. (2021). Implementation of a novel bi-directional dual-flow-RootChip to investigate the effects of osmotic stress on calcium signalling in Arabidopsis thaliana roots. (University of Canterbury MSc thesis). doi: 10.26021/11069
Allan, C., Morris, R. J., Meisrimler, C. N. (2022a). Encoding, transmission, decoding, and specificity of calcium signals in plants. J. Exp. Bot. 73 (11), 3372–3385. doi: 10.1093/jxb/erac105
Allan, C., Tayagui, A., Nock, V., Meisrimler, C. N. (2022b). “Novel bi-directional dual-flow-RootChip to study effects of osmotic stress on calcium signalling in Arabidopsis roots,” in 2022 IEEE 35th International Conference on Micro Electro Mechanical Systems Conference (MEMS), 2022, 896–899. doi: 10.1109/MEMS51670.2022.9699700
Arsuffi, G., Braybrook, S. A. (2018). Acid growth: an ongoing trip. J. Exp. Bot. 69 (2), 137–146. doi: 10.1093/jxb/erx390
Asghar, W., Yuksekkaya, M., Shafiee, H., Zhang, M., Ozen, M. O., Inci, F., et al. (2016). Engineering long shelf life multi-layer biologically active surfaces on microfluidic devices for point of care applications. Sci. Rep. 6 (1), 1–10. doi: 10.1038/srep21163
Ast, C., Foret, J., Oltrogge, L. M., De Michele, R., Kleist, T. J., Ho, C. H., et al. (2017). Ratiometric matryoshka biosensors from a nested cassette of green-and orange-emitting fluorescent proteins. Nat. Commun. 8 (1), 431. doi: 10.1038/s41467-017-00400-2
Behera, S., Wang, N., Zhang, C., Schmitz-Thom, I., Strohkamp, S., Schültke, S., et al. (2015). Analyses of Ca2+ dynamics using a ubiquitin-10 promoter-driven yellow cameleon 3.6 indicator reveal reliable transgene expression and differences in cytoplasmic Ca2+ responses in Arabidopsis and rice (Oryza sativa) roots. New Phytol. 206 (2), 751–760. doi: 10.1111/nph.13250
Bergey, D. R., Kandel, R., Tyree, B. K., Dutt, M., Dhekney, S. A. (2014). The role of calmodulin and related proteins in plant cell function: an ever-thickening plot. Springer Sci. Rev. 2 (1), 145–159. doi: 10.1007/s40362-014-0025-z
Bhatia, S. N., Ingber, D. E. (2014). Microfluidic organs-on-chips. Nat. Biotechnol. 32 (8), 760–772. doi: 10.1038/nbt.2989
Bi, X., Beck, C., Gong, Y. (2021). Genetically encoded fluorescent indicators for imaging brain chemistry. Biosensors 11 (4), 116. doi: 10.3390/bios11040116
Bonza, M. C., Luoni, L., Olivari, C., De Michelis, M. I. (2016). “Plant type 2B Ca2+-ATPases: the diversity of isoforms of the model plant Arabidopsis thaliana,” in Regulation of Ca2+-ATPases, V-ATPases and f-ATPases. Advances in Biochemistry in Health and Disease. Springer, Cham. vol 14, 227–241. doi: 10.1007/978-3-319-24780-9_13
Cackett, L., Cannistraci, C. V., Meier, S., Ferrandi, P., Pěnčík, A., Gehring, C., et al. (2022). Salt-specific gene expression reveals elevated auxin levels in Arabidopsis thaliana plants grown under saline conditions. Front. Plant Sci. 13, 804716. doi: 10.3389/fpls.2022.804716
Choi, W. G., Toyota, M., Kim, S. H., Hilleary, R., Gilroy, S. (2014). Salt stress-induced Ca2+ waves are associated with rapid, long-distance root-to-shoot signaling in plants. Proc. Natl. Acad. Sci. 111 (17), 6497–6502. doi: 10.1073/pnas.1319955111
Cho, J. H., Swanson, C. J., Chen, J., Li, A., Lippert, L. G., Boye, S. E., et al. (2017). The gcamp-r family of genetically encoded ratiometric calcium indicators. ACS Chem. Biol. 12 (4), 1066–1074. doi: 10.1021/acschembio.6b00883
Connorton, J. M., Webster, R. E., Cheng, N., Pittman, J. K. (2012). Knockout of multiple Arabidopsis cation/H+ exchangers suggests isoform-specific roles in metal stress response, germination and seed mineral nutrition. PloS One 7(10), e47455. doi: 10.1371/journal.pone.0047455
De Koninck, P., Schulman, H. (1998). Sensitivity of CaM kinase II to the frequency of Ca2+ oscillations. Science 279 (5348), 227–230. doi: 10.1126/science.279.5348.22
Dindas, J., Scherzer, S., Roelfsema, M. R. G., von Meyer, K., Müller, H. M., Al-Rasheid, K. A. S., et al. (2018). AUX1-mediated root hair auxin influx governs SCFTIR1/AFB-type Ca2+ signaling. Nat. Commun. 9 (1), 1–10. doi: 10.1038/s41467-018-03582-5
Dodd, A. N., Kudla, J., Sanders, D. (2010). The language of calcium signaling. Annu. Rev. Plant Biol. 61, 593–620. doi: 10.1146/annurev-arplant-070109-104628
Duan, L., Sebastian, J., Dinneny, J. R. (2015). Salt-stress regulation of root system growth and architecture in Arabidopsis seedlings. Plant Cell Expans. Methods in Molecular Biology. Humana Press, New York, NY. vol 1242, 105–122. doi: 10.1007/978-1-4939-1902-4_10
Gilroy, S., Suzuki, N., Miller, G., Choi, W.-G., Toyota, M., Devireddy, A. R., et al. (2014). A tidal wave of signals: calcium and ROS at the forefront of rapid systemic signaling. Trends Plant Sci. 19, 623–630. doi: 10.1016/j.tplants.2014.06.013
Granqvist, E., Wysham, D., Hazledine, S., Kozlowski, W., Sun, J., Charpentier, M., et al. (2012). Buffering capacity explains signal variation in symbiotic calcium oscillations. Plant Physiol. 160, 2300–2310. doi: 10.1104/pp.112.205682
Guckenberger, D. J., Berthier, E., Young, E. W., Beebe, D. J. (2014). Fluorescence-based assessment of plasma-induced hydrophilicity in microfluidic devices via Nile red adsorption and depletion. Analytical Chem. 86 (15), 7258–7263. doi: 10.1021/ac501259n
Halldorsson, S., Lucumi, E., Gómez-Sjöberg, R., Fleming, R. M. (2015). Advantages and challenges of microfluidic cell culture in polydimethylsiloxane devices. Biosensors Bioelectronics 63, 218–231. doi: 10.1016/j.bios.2014.07.029
Hashemi, A., de Decker, F., Orcheston-Findlay, L., Ali, M. A., Alkaisi, M. M., Nock, V. (2017). Enhanced pattern resolution, swelling-behaviour and biocompatibility of bioimprinted casein microdevices. AIP Adv. 7 (11), 115019. doi: 10.1063/1.4991783
Hellal, F. A., El-Shabrawi, H. M., Abd El-Hady, M., Khatab, I. A., El-Sayed, S. A. A., Abdelly, C. (2018). Influence of PEG induced drought stress on molecular and biochemical constituents and seedling growth of Egyptian barley cultivars. J. Genet. Eng. Biotechnol. 16 (1), 203–212. doi: 10.1016/j.jgeb.2017.10.009
Hemmilä, S., Cauich-Rodríguez, J. V., Kreutzer, J., Kallio, P. (2012). Rapid, simple, and cost- effective treatments to achieve long-term hydrophilic PDMS surfaces. Appl. Surface Sci. 258 (24), 9864–9875. doi: 10.1016/j.apsusc.2012.06.044
Horikawa, K., Yamada, Y., Matsuda, T., Kobayashi, K., Hashimoto, M., Matsu-ura, T., et al. (2010). Spontaneous network activity visualized by ultrasensitive Ca2+ indicators, yellow cameleon-nano. Nat. Methods 7 (9), 729–732. doi: 10.1038/nmeth.1488
Hosokawa, K., Sato, K., Ichikawa, N., Maeda, M. (2004). Power-free poly (dimethylsiloxane) microfluidic devices for gold nanoparticle-based DNA analysis. Lab. Chip 4 (3), 181–185. doi: 10.1039/b403930k
Huang, J., Chen, Q., Rong, Y., Tang, B., Zhu, L., Ren, R., et al. (2021). Transcriptome analysis revealed gene regulatory network involved in PEG-induced drought stress in tartary buckwheat (Fagopyrum tararicum). PeerJ 9, e11136. doi: 10.7717/peerj.11136
Huang, F., Luo, J., Ning, T., Cao, W., Jin, X., Zhao, H., et al. (2017). Cytosolic and nucleosolic calcium signaling in response to osmotic and salt stresses are independent of each other in roots of Arabidopsis seedlings. Front. Plant Sci. 8, 1648. doi: 10.3389/fpls.2017.01648
Jing, X., Cai, C., Fan, S., Wang, L., Zeng, X. (2019). Spatial and temporal calcium signaling and its physiological effects in moso bamboo under drought stress. Forests 10 (3), 224. doi: 10.3390/f10030224
Jokinen, V., Suvanto, P., Franssila, S. (2012). Oxygen and nitrogen plasma hydrophilization and hydrophobic recovery of polymers. Biomicrofluidics 6 (1), 016501. doi: 10.1063/1.3673251
Kao, C. Y., Lo, T. C., Lee, W. C. (2003). Influence of polyvinylpyrrolidone on the hydrophobic properties of partially porous poly (styrene–divinylbenzene) particles for biological applications. J. Appl. Polymer Sci. 87 (11), 1818–1824. doi: 10.1002/app.11653
Karlsson, J. M., Gazin, M., Laakso, S., Haraldsson, T., Malhotra-Kumar, S., Mäki, M., et al. (2013). Active liquid degassing in microfluidic systems. Lab. Chip 13 (22), 4366–4373. doi: 10.1039/c3lc50778e
Keinath, N. F., Waadt, R., Brugman, R., Schroeder, J. I., Grossmann, G., Schumacher, K., et al. (2015). Live cell imaging with r-GECO1 sheds light on flg22-and chitin-induced transient [Ca2+] cyt patterns in Arabidopsis. Mol. Plant 8 (8), 1188–1200. doi: 10.1016/j.molp.2015.05.006
Kiegle, E., Moore, C. A., Haseloff, J., Tester, M. A., Knight, M. R. (2000). Cell-type-specific calcium responses to drought, salt and cold in the Arabidopsis root. Plant J. 23 (2), 267–278. doi: 10.1046/j.1365-313x.2000.00786.x
Knight, M. R., Campbell, A. K., Smith, S. M., Trewavas, A. J. (1991). Transgenic plant aequorin reports the effects of touch and cold-shock and elicitors on cytoplasmic calcium. Nature 352, 524–526. doi: 10.1038/352524a0
Knight, H., Trewavas, A. J., Knight, M. R. (1997). Calcium signalling in Arabidopsis thaliana responding to drought and salinity. Plant J. 12 (5), 1067–1078. doi: 10.1046/j.1365-313X.1997.12051067.x
Krebs, M., Held, K., Binder, A., Hashimoto, K., Den Herder, G., Parniske, M., et al. (2012). FRET-based genetically encoded sensors allow high-resolution live cell imaging of Ca2+ dynamics. Plant J. 69 (1), 181–192. doi: 10.1111/j.1365-313X.2011.04780.x
Leitão, N., Dangeville, P., Carter, R., Charpentier, M. (2019). Nuclear calcium signatures are associated with root development. Nat. Commun. 10 (1), 1–9. doi: 10.1038/s41467-019-12845-8
Li, Y., Liu, Y., Jin, L., Peng, R. (2022). Crosstalk between Ca2+ and other regulators assists plants in responding to abiotic stress. Plants 11 (10), 1351. doi: 10.3390/plants11101351
Liu, J., Li, S. (2015). “Numerical analysis of air bubble formation in PDMS micro-channels in negative pressure-driven flow,” in 2015 International Conference on Fluid Power and Mechatronics (FPM), 2015, pp. 686–690. doi: 10.1109/FPM.2015.7337202
Liu, Z., Ma, Z., Guo, X., Shao, H., Cui, Q., Song, W. (2010). Changes of cytosolic Ca2+ fluorescence intensity and plasma membrane calcium channels of maize root tip cells under osmotic stress. Plant Physiol. Biochem. 48 (10-11), 860–865. doi: 10.1016/j.plaphy.2010.08.008
Ma, Y., Dias, M. C., Freitas, H. (2020). Drought and salinity stress responses and microbe-induced tolerance in plants. Front. Plant Sci. 11, 591911. doi: 10.3389/fpls.2020.591911
Manishankar, P., Wang, N., Köster, P., Alatar, A. A., Kudla, J. (2018). Calcium signaling during salt stress and in the regulation of ion homeostasis. J. Exp. Bot. 69 (17), 4215–4226. doi: 10.1093/jxb/ery201
McAinsh, M. R., Pittman, J. K. (2009). Shaping the calcium signature. New Phytol. 181 (2), 275–294. doi: 10.1111/j.1469-8137.2008.02682.x
Mertes, N., Busch, M., Huppertz, M. C., Hacker, C. N., Wilhelm, J., Gürth, C. M., et al. (2022). Fluorescent and bioluminescent calcium indicators with tuneable colors and affinities. J. Am. Chem. Soc. 144 (15), 6928–6935. doi: 10.1021/jacs.2c01465
Nakayama, T., Kurosawa, Y., Furui, S., Kerman, K., Kobayashi, M., Rao, S. R., et al. (2006). Circumventing air bubbles in microfluidic systems and quantitative continuous- flow PCR applications. Analytical Bioanalytical Chem. 386 (5), 1327–1333. doi: 10.1007/s00216-006-0688-7
Nezhad, A. S. (2014). Microfluidic platforms for plant cells studies. Lab. Chip 14 (17), 3262–3274. doi: 10.1039/C4LC00495G
Olanrewaju, A., Beaugrand, M., Yafia, M., Juncker, D. (2018). Capillary microfluidics in microchannels: from microfluidic networks to capillaric circuits. Lab. Chip 18 (16), 2323–2347. doi: 10.1039/C8LC00458G
Orcheston-Findlay, L., Hashemi, A., Garrill, A., Nock, V. (2018). A microfluidic gradient generator to simulate the oxygen microenvironment in cancer cell culture. Microelectronic Eng. 195, 107–113. doi: 10.1016/j.mee.2018.04.011
Plegue, T. J., Kovach, K. M., Thompson, A. J., Potkay, J. A. (2018). Stability of polyethylene glycol and zwitterionic surface modifications in PDMS microfluidic flow chambers. Langmuir 34 (1), 492–502. doi: 10.1021/acs.langmuir.7b03095
Russell, J. T. (2011). Imaging calcium signals in vivo: a powerful tool in physiology and pharmacology. Br. J. Pharmacol. 163 (8), 1605–1625. doi: 10.1111/j.1476-5381.2010.00988.x
Schindelin, J., Arganda-Carreras, I., Frise, E., Kaynig, V., Longair, M., Pietzsch, T., et al. (2012). Fiji: an open-source platform for biological-image analysis. Nat. Methods 9 (7), 676–682. doi: 10.1038/nmeth.2019
Sevindik, B., Sevindik, O., Selli, S. (2022). Effect of drought stress induced by PEG 6000 on Ocimum basilicum L. aroma profile. J. Food Process. Preservation 46 (6), e15948. doi: 10.1111/jfpp.15948
Shih, H.-W., DePew, C. L., Miller, N. D., Monshausen, G. B. (2015). The cyclic nucleotide-gated channel CNGC14 regulates root gravitropism in Arabidopsis thaliana. Curr. Biol. 25, 3119–3125. doi: 10.1016/j.cub.2015.10.025
Smolko, A., Bauer, N., Pavlović, I., Pěnčík, A., Novák, O., Salopek-Sondi, B. (2021). Altered root growth, auxin metabolism and distribution in Arabidopsis thaliana exposed to salt and osmotic stress. Int. J. Mol. Sci. 22 (15), 7993. doi: 10.3390/ijms22157993
Soffe, R., Mach, A. J., Onal, S., Nock, V., Lee, L. P., Nevill, J. T. (2020). Art-on-a-Chip: Preserving microfluidic chips for visualization and permanent display. Small 16 (34), 2002035. doi: 10.1002/smll.202002035
Stanley, C. E., Shrivastava, J., Brugman, R., Heinzelmann, E., van Swaay, D., Grossmann, G. (2018). Dual-flow-RootChip reveals local adaptations of roots towards environmental asymmetry at the physiological and genetic levels. New Phytol. 217 (3), 1357–1369. doi: 10.1111/nph.14887
Stanley, C. E., van der Heijden, M. G. (2017). Microbiome-on-a-chip: new frontiers in plant–microbiota research. Trends Microbiol. 25 (8), 610–613. doi: 10.1016/j.tim.2017.05.001
Sun, Y., Tayagui, A., Garrill, A., Nock, V. (2020). Microfluidic platform for integrated compartmentalization of single zoospores, germination and measurement of protrusive force generated by germ tubes. Lab. Chip 20 (22), 4141–4151. doi: 10.1039/D0LC00752H
Tayagui, A., Sun, Y., Collings, D. A., Garrill, A., Nock, V. (2017). An elastomeric micropillar platform for the study of protrusive forces in hyphal invasion. Lab. Chip 17 (21), 3643–3653. doi: 10.1039/C7LC00725F
Thoday-Kennedy, E. L., Jacobs, A. K., Roy, S. J. (2015). The role of the CBL–CIPK calcium signalling network in regulating ion transport in response to abiotic stress. Plant Growth Regul. 76 (1), 3–12. doi: 10.1007/s10725-015-0034-1
Thor, K., Peiter, E. (2014). Cytosolic calcium signals elicited by the pathogen-associated molecular pattern flg22 in stomatal guard cells are of an oscillatory nature. New Phytol. 204 (4), 873–881. doi: 10.1111/nph.13064
Tian, L., Hires, S. A., Mao, T., Huber, D., Chiappe, M. E., Chalasani, S. H., et al. (2009). Imaging neural activity in worms, flies and mice with improved GCaMP calcium indicators. Nat. Methods 6 (12), 875–881. doi: 10.1038/nmeth.1398
Toyota, M., Spencer, D., Sawai-Toyota, S., Jiaqi, W., Zhang, T., Koo, A. J., et al. (2018). Glutamate triggers long-distance, calcium-based plant defense signaling. Science 361 (6407), 1112–1115. doi: 10.1126/science.aat7744
Vogelmann, E. S., Reichert, J. M., Prevedello, J., Awe, G. O. (2013). Hydro-physical processes and soil properties correlated with origin of soil hydrophobicity. Ciec. Rural 43 (9), 1582–1589. doi: 10.1590/S0103-84782013005000107
Wagner, S., Behera, S., De Bortoli, S., Logan, D. C., Fuchs, P., Carraretto, L., et al. (2015). The EF-hand Ca2+ binding protein MICU choreographs mitochondrial Ca2+ dynamics in Arabidopsis. Plant Cell 27 (11), 3190–3212. doi: 10.1105/tpc.15.00509
Xia, Y., Whitesides, G. M. (1998). Soft lithography. Annu. Rev. Materials Sci. 28 (1), 153–184. doi: 10.1146/annurev.matsci.28.1.153
Xiong, T. C., Ronzier, E., Sanchez, F., Corratgé-Faillie, C., Mazars, C., Thibaud, J. B. (2014). Imaging long distance propagating calcium signals in intact plant leaves with the BRET-based GFP-aequorin reporter. Front. Plant Sci. 5, 43. doi: 10.3389/fpls.2014.00043
Xue, X., Patel, M. K., Kersaudy-Kerhoas, M., Desmulliez, M. P., Bailey, C., Topham, D. (2012). Analysis of fluid separation in microfluidic T-channels. Appl. Math. Model. 36 (2), 743–755. doi: 10.1016/j.apm.2011.07.009
Yang, Y., Zhang, C., Tang, R. J., Xu, H. X., Lan, W. Z., Zhao, F., et al. (2019). Calcineurin b-like proteins CBL4 and CBL10 mediate two independent salt tolerance pathways in Arabidopsis. Int. J. Mol. Sci. 20 (10), 2421. doi: 10.3390/ijms20102421
Zhang, S., Wu, Q. R., Liu, L. L., Zhang, H. M., Gao, J. W., Pei, Z. M. (2020). Osmotic stress alters circadian cytosolic Ca2+ oscillations and OSCA1 is required in circadian gated stress adaptation. Plant Signaling Behav. 15 (12), 1836883. doi: 10.1080/15592324.2020.1836883
Zhang, K., Yue, D., Wei, W., Hu, Y., Feng, J., Zou, Z. (2016). Characterization and functional analysis of calmodulin and calmodulin-like genes in Fragaria vesca. Front. Plant Sci. 7, 1820. doi: 10.3389/fpls.2016.01820
Zheng, W., Huang, R., Jiang, B., Zhao, Y., Zhang, W., Jiang, X. (2016). An early-stage atherosclerosis research model based on microfluidics. Small 12 (15), 2022–2034. doi: 10.1002/smll.201503241
Keywords: abiotic stress, calcium, signalling, Arabidopsis, microfluidics, root, osmotic stress
Citation: Allan C, Tayagui A, Hornung R, Nock V and Meisrimler C-N (2023) A dual-flow RootChip enables quantification of bi-directional calcium signaling in primary roots. Front. Plant Sci. 13:1040117. doi: 10.3389/fpls.2022.1040117
Received: 08 September 2022; Accepted: 13 December 2022;
Published: 10 January 2023.
Edited by:
Sabine Lüthje, University of Hamburg, GermanyReviewed by:
Won-Gyu Choi, University of Nevada, Reno, United StatesHartwig Luethen, University of Hamburg, Germany
Copyright © 2023 Allan, Tayagui, Hornung, Nock and Meisrimler. This is an open-access article distributed under the terms of the Creative Commons Attribution License (CC BY). The use, distribution or reproduction in other forums is permitted, provided the original author(s) and the copyright owner(s) are credited and that the original publication in this journal is cited, in accordance with accepted academic practice. No use, distribution or reproduction is permitted which does not comply with these terms.
*Correspondence: Claudia-Nicole Meisrimler, claudia.meisrimler@canterbury.ac.nz
†ORCID: Claudia Allan, orcid.org/0000-0002-1604-2737
Ayelen Tayagui, orcid.org/0000-0002-7537-2285
Volker Nock, orcid.org/0000-0001-5452-3083
Claudia-Nicole Meisrimler, orcid.org/0000-0002-3571-245X