 Renxue Fan
 Mingyu Sun
 Xianjin Zhu
 Qiufeng Wang
- 1College of Agronomy, Shenyang Agricultural University, Shenyang, China
- 2School of Earth System Science, Tianjin University, Tianjin, China
- 3Synthesis Research Center of Chinese Ecosystem Research Network, Key Laboratory of Ecosystem Network Observation and Modeling, Institute of Geographic Sciences and Natural Resources Research, Chinese Academy of Sciences, Beijing, China
- 4College of Resources and Environment, University of Chinese Academy of Sciences, Beijing, China
Annual evapotranspiration (AET), the total water vapor loss to the atmosphere during a year, is a vital process of global water cycles and energy cycles. Revealing the differences in AET values and spatial variations between forests and grasslands would benefit for understanding AET spatial variations, which serves as a basis for regional water management. Based on published eddy covariance measurements in China, we collected AET values from 29 forests and 46 grasslands, and analyzed the differences in AET values and spatial variations between forests and grasslands in China. The results showed that forests had a significant higher AET (645.98 ± 232.73 kgH2O m-2 yr-1) than grasslands (359.31 ± 156.02 kgH2O m-2 yr-1), while the difference in AET values between forests and grasslands was not significant after controlling mean annual precipitation (MAP) relating factors. The effects of latitude and mean annual air temperature (MAT) on AET spatial variations differed between forests and grassland, while AET of forests and grasslands both exhibited increasing trends with similar rates along the increasing MAP, aridity index (AI), soil water content (SW), and leaf area index. The comprehensive effects of multiple factors on AET spatial variations differed between forests and grasslands, while MAP both played a dominating role. The effects of other factors were achieved through their close correlations with MAP. Therefore, forests and grasslands under similar climate had comparable AET values. AET responses to MAP were comparable between ecosystem types. Our findings provided a data basis for understanding AET spatial variation over terrestrial ecosystems of China or globally.
Introduction
Evapotranspiration (ET), the water loss to the atmosphere as water vapor, is a vital process of global water cycles and energy cycles (Wang and Dickinson, 2012; Douville et al., 2013), which also serves as a key parameter in hydrology and ecology (Wang and Dickinson, 2012; Zhu et al., 2015). Annual evapotranspiration (AET) is the accumulated evapotranspiration during a year. AET spatial variation, resulted from the adaption of an ecosystem to the local environment, serves as the basis for regional water management (Wang et al., 2013; Kool et al., 2014). Revealing AET spatial variation and its affecting factors would benefit for the reasonable utilization of limited regional water resources (Li et al., 2018; Sun et al., 2021).
Based on network eddy covariance measurements (Baldocchi, 2008; Baldocchi, 2014), many works have analyzed AET spatial variations (Brümmer et al., 2012; Krishnan et al., 2012; Xiao et al., 2013; Zheng et al., 2016; Yue et al., 2022). Results found that AET showed a significant declining latitudinal pattern in China (Zheng et al., 2016) resulting from the joint effects of climatic and biological factors (Brümmer et al., 2012; Krishnan et al., 2012; Xiao et al., 2013; Zheng et al., 2016; Yue et al., 2022). However, most previous works investigated the AET spatial variation with all kinds of ecosystem types and ignored the differences in the effects of ecosystem types on AET spatial variations (Brümmer et al., 2012; Xiao et al., 2013; Zheng et al., 2016; Yue et al., 2022), which inhibits our fully understanding of AET spatial variations as different ecosystem types showed divergent environmental statuses. For example, wetlands and some croplands suffered from external water sources (Ding et al., 2010; Zhao et al., 2010), while forests and grasslands seldom had external water supplement.
As the main components of global terrestrial ecosystems, forests and grasslands accounted for more than half of the land surface (O’Mara, 2012; Chen et al., 2020; Hill and Guerschman, 2020; Guo et al., 2022). Revealing the differences in AET spatial variations between forests and grasslands would thus benefit for understanding the AET spatial variations over terrestrial ecosystems. In addition, Chinese forests and grasslands played an important role in global forests and grasslands, respectively (Miao et al., 2013). Furthermore, China experiences a unique climate as the comprehensive effects of Asian monsoon and the uplift of the Qinghai-Tibet Plateau (Wu et al., 2007). Therefore, revealing the differences in AET spatial variations between forests and grasslands in China will help to improve our understanding of AET spatial variations. The widely conducting eddy covariance measurements in divergent ecosystems of China (Yu et al., 2006; Yu et al., 2013; Yu et al., 2016; Zhu et al., 2022; Zhu et al., 2023) accumulated a great deal of AET values thus provided a solid basis for analyzing AET spatial variations, which made it possible to illustrate the differences in AET spatial variations between forests and grasslands.
Therefore, based on eddy covariance measuring AET of forests and grasslands in China, we analyzed the differences in AET values and spatial variations between forests and grasslands to clarify: 1) the differences in AET values between forests and grasslands, 2) the differences in AET spatial variations between forests and grasslands, and 3) the main drivers of the differences in AET values and spatial variations. Our results will improve our understanding on the spatial variation of AET, which also provides a data basis for regional water balance assessment.
Materials and methods
Acquisition of measured AET
In this study, all measured AET sourced from the published literatures. Using “eddy covariance” and “grassland” or “forest” as the keyword, we searched the published works during 2000–2021 through the core collection of Web of Science (www.isiknowledge.com) and China National Knowledge Infrastructure (www.cnki.net). Each searched result was thoroughly read to extract in-situ AET measurements. As we focused on the spatial variations of AET, only measurements with more than 1 year observing AET available were collected. In addition, if an ecosystem had more than 1 year measurements, the mean value of multiyear measurements was calculated to represent its AET value (Yu et al., 2013; Zheng et al., 2016). When collecting AET values, their ecosystem types were simultaneously recorded. The ecosystem types were classified into forests and grasslands, where shrub and desert ecosystems were classified into grasslands. Based on the published data, an AET dataset was constructed containing 75 ecosystems, including 29 forests and 46 grasslands (Figure 1). The detailed information of each ecosystem was listed in Supplementary Table S1.
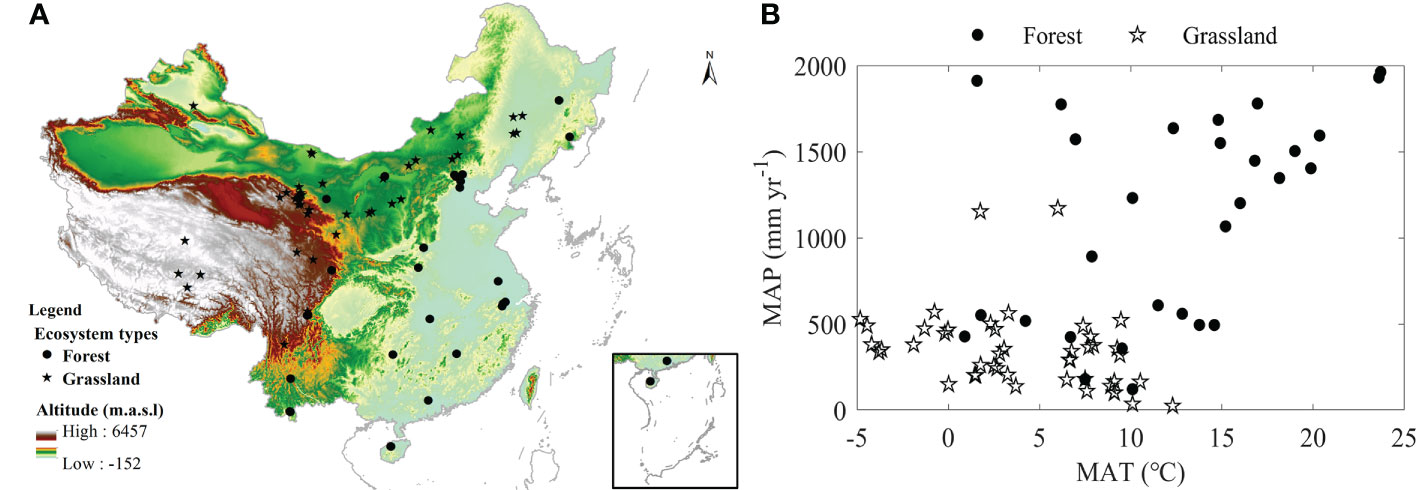
Figure 1 Spatial distribution (A) and Climate distribution (B) of ecosystems used in this study.
Acquisition of auxiliary data
When collecting measured AET values from literatures, we simultaneously gathered other information, such as the geographical information (latitude, longitude, and altitude) and climatic factors (mean annual air temperature (MAT) and mean annual precipitation (MAP)). However, some ecosystems missed reporting climatic factors, which made the climatic factors incomplete. We extracted the missed climatic factors with geographical information of each ecosystem from their corresponding grid products (Zhu et al., 2022; Zhu et al., 2023), which downscaled from time series data of Climatic Research Unit (CRU) (Harris et al., 2020) to the 30 arc sec (~ 1 km) with the delta spatial downscaling (Peng et al., 2019).
Besides MAT and MAP, we also employed other climatic factors like aridity index (AI), annual mean vapor pressure deficit (VPD), annual photosynthetic active radiation (PAR), annual mean CO2 mass concentration (ρc,yr) to illustrate their effects on AET spatial variations and their differences between ecosystem types, while those climatic factors were seldom reported in literatures. Therefore, we also extracted those factors from their corresponding grid products with the geographical information of each ecosystem. AI was calculated as the ratio of MAP to annual potential evapotranspiration (PET), where PET sourced from the downscaled CRU time series data (Zhu et al., 2022; Zhu et al., 2023). VPD was calculated from MAT and water vapor pressure, which was also downscaled from CRU time series data (Zhu et al., 2022; Zhu et al., 2023). PAR was summed from the daily PAR extracted from Global Land Surface Satellite (GLASS) data at a spatial resolution of 0.05° (Liang et al., 2013; Cheng and Liang, 2014). ρc,yr was calculated from the CO2 concentration (bc), CO2 molar mass (Mc, 44 g mol−1), and gas molar volume at its current state(V), where bc was replaced by the observed value of Mauna Roa and V was calculated by the ideal gas state equation combining local pressure and MAT (Zhu et al., 2016b).
Besides climatic factors, we also employed other factors like soil variables and leaf area index, which were all extracted from their corresponding grid products with geographical information of each ecosystem. Soil variables included annual mean soil moisture (SM), soil organic carbon content (SOC), and soil total nitrogen content (STN). SM was extracted from the soil moisture grid at a spatial resolution of 30 arc sec (~ 1 km) downscaled from the remote sensing retrieving data at a spatial resolution of 0.1° and a temporal resolution of 10 day (Chen et al., 2021). SOC and STN were both extracted from a global soil dataset used for earth system models with a spatial resolution of 30 arc sec (~ 1 km) (Shangguan et al., 2014). Leaf area index included mean annual leaf area index (LAI) and the maximum leaf area index (MLAI), which were both extracted from an improved Moderate Resolution Imaging Spectroradiometer (MODIS) product with a spatial resolution of 500 m and a temporal resolution of 8 days (Yuan et al., 2011) (http://globalchange.bnu.edu.cn/research/lai).
Data analysis
Our analysis focused on the differences in AET values and spatial variations between forests and grasslands. The difference in AET values between ecosystem types was conducted with the one-way analysis of variance (ANOVA). Given some factors affected AET values, we employed the analysis of covariance (ANCVA) by fixing some important factors (MAT, MAP, MAP/PET, SW) to reveal the difference in AET values. Before analyzing the difference in AET values, we investigated the difference in environmental factors between forests and grasslands. The differences in AET spatial variations included those in the geographical patterns and the effects of environmental factors on AET spatial variations, which were all conducted with the generalized linear model. In addition, ANCVA was also employed to reveal the difference in AET spatial variations between forests and grasslands.
Considering the ecosystems used in this study covered different measuring period, the interannual variation in AET may introduce some uncertainties by using the mean AET value of measuring period. Therefore, we conducted an uncertainty analysis by randomly adding a within 10% error to the mean values, which was repeated 100 times. The error adding AET were used to analyze AET spatial variations with the generalized linear model. The mean statistics of the 100 repeated regressions were compared to the regression statistics to verify whether AET spatial variations varied with the uncertainties in AET values.
Furthermore, to quantify the comprehensive effects of environmental factors on AET spatial variations and their difference between forests and grasslands, we applied the stepwise analysis to construct the multiple regression equations considering all significant variables. In addition, we employed independence effect analysis to disentangle the relative roles of each factor in AER spatial variations and their difference between forests and grasslands (Murray and Conner, 2009; Chu et al., 2016; Zhu et al., 2022).
Statistical analysis
In this study, all analyses were conducted using MATLAB software (Math Works Inc., Natick, MA, USA). The differences in environmental factors and AET values were analyzed with ANOVA using the function of “anova1”. The difference in AET values was further investigated with ANCVA by fixing main factors as the covariates using the function of “aoctool”. The spatial variations of AET were analyzed with the generalized linear model using the function of “regstats”. The differences in AET spatial variations were also detected with the ANCVA using the function of “aoctool”. The stepwise analysis was employed to reveal the joint effects of environmental factors on AET spatial variations using the function of “stepwise”. The minimum P value for introducing into or removing out the regression model was set to 0.10. All significance levels were set to 0.05.
Results
Differences in environmental factors and AET values
Forests and grasslands had divergent environmental factors and AET values, while the significance levels differed among factors (Figure 2).
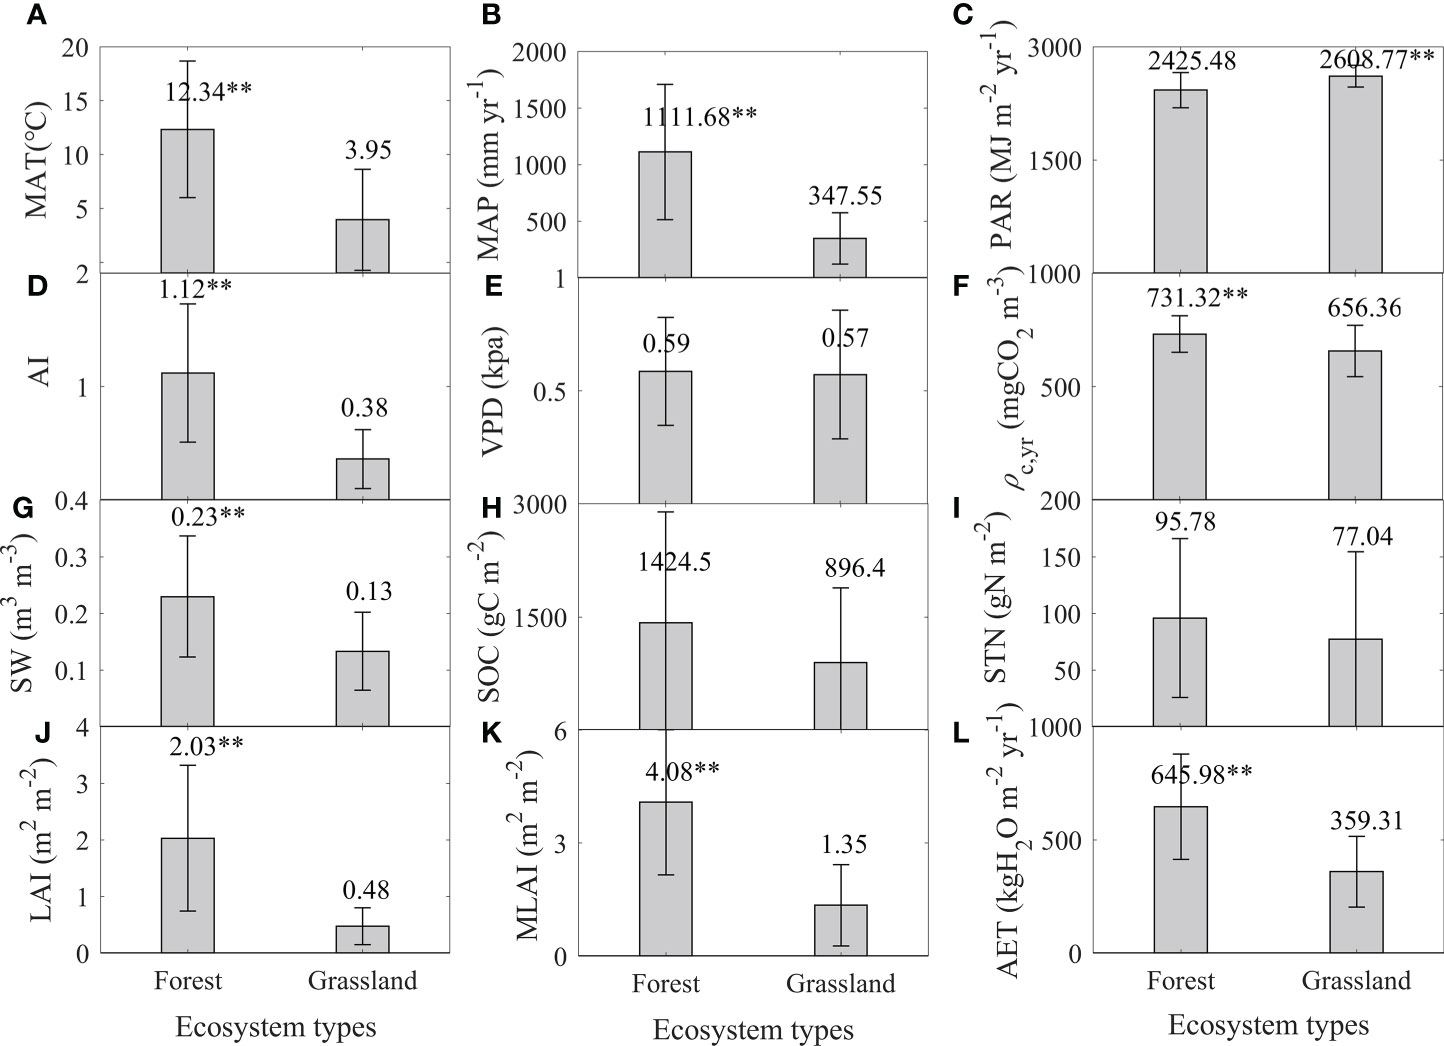
Figure 2 Differences in environmental factors and annual evapotranspiration (AET, L) between forests and grasslands. Environmental factors include mean annual air temperature (MAT, A), mean annual precipitation (MAP, B), annual total photosynthetic effective radiation (PAR, C), aridity index (AI, D), annual mean water vapor pressure difference (VPD, E), annual mean CO2 mass concentration (ρc,yr, F), soil water content (SW, G), soil organic carbon content (SOC, H), soil total nitrogen content (STN, I), mean annual leaf area index (LAI, J), and maximum leaf area index (MLAI, K). *P<.05, **P<.01, ***P<.001.
Major climatic factors, including MAT, MAP, and PAR, significantly differed between forests and grasslands, while the differing directions varied among factors (Figures 2A–C). Forests had a higher MAT (12.34 ± 6.33 °C) and MAP (1111.68 ± 597.19 mm yr -1) than those of grasslands (F = 43.29 and 61.51, P< 0.01), while the PAR of forests (2425.48 ± 232.99 MJ m-2 yr-1) was significantly lower than that of grasslands (2608.77 ± 143.03 MJ m-2 yr-1) (F = 17.86, P< 0.01).
Other climatic factors showed divergent differences between forests and grasslands (Figures 2D–F). Forests and grasslands had similar VPD values (Figure 2E), while the ρc,yr of forests was significantly lower than that of grasslands (F = 9.67, P< 0.01). In addition, the aridity index (AI), defined as the ratio of MAP to PET, significantly differed between forests and grasslands. Forests took a significant higher AI (1.12 ± 0.61) than grasslands (0.38 ± 0.26) (F = 52.72, P< 0.01).
Soil variables also exhibited divergent differences between forests and grasslands (Figures 2G–I). Forests had a significant higher SW (0.23 ± 0.11 m3 m-3) than grasslands (F = 22.6, P<0.01), while there was no significant difference in SOC and STN between forests and grasslands (P > 0.05).
Forests took higher leaf area index (LAI and MLAI) than grasslands (Figures 2J, K). The LAI of forests reached to 2.03 ± 1.29 m2 m-2, which was significantly higher than that of grasslands (0.48 ± 0.33 m2 m-2) (F = 61.1, P< 0.01). The difference in MLAI also showed a similar trend (F = 61.9, P< 0.01).
Forests took a significant higher AET than grasslands, whereas their differences were primarily attributed to the differences in the receiving water amount as MAP (Figure 2L). Forests took an AET value of (645.98 ± 232.73 kgH2O m-2 yr-1), which was significantly higher than that of grassland (359.31 ± 156.02 kgH2O m-2 yr-1) (F = 40.85, P< 0.01). After fixing the effects of MAP or AI, the differences in AET values between forests and grasslands were not significant (P > 0.05). However, setting MAT or SW as the covariant, forests still had a significant higher AET than grasslands (P< 0.01). Considering the dominating role of MAP in AI, the difference in AET values between forests and grasslands primarily sourced from that in the receiving water amount as MAP.
Differences in AET geographical patterns
Both forests and grasslands showed significant decreasing latitudinal patterns, while the decreasing rates of AET significantly differed between forests and grasslands (Figure 3). With the increasing latitude, forest AET significant decreased, with a decreasing rate of 27.71 kgH2O m-2 yr-1. The equation containing latitude explained 77% AET spatial variation in forest, with an RMSE of 113.01 kgH2O m-2 yr-1 (Figure 3A). The increasing latitude also significantly decreased AET in grasslands, while its decreasing rate was only 11.92 kgH2O m-2 yr-1, with an R2 of 0.11 and an RMSE of 148.75 kgH2O m-2 yr-1 (Figure 3B). Forests took a significant higher decreasing rate than grasslands (F = 7.37, P< 0.01). In addition, the decreasing latitudinal patterns of AET and their difference between forests and grasslands did not vary with the uncertainties in AET, indicated by the similar regression statistics from the error adding AET (Figure 3).
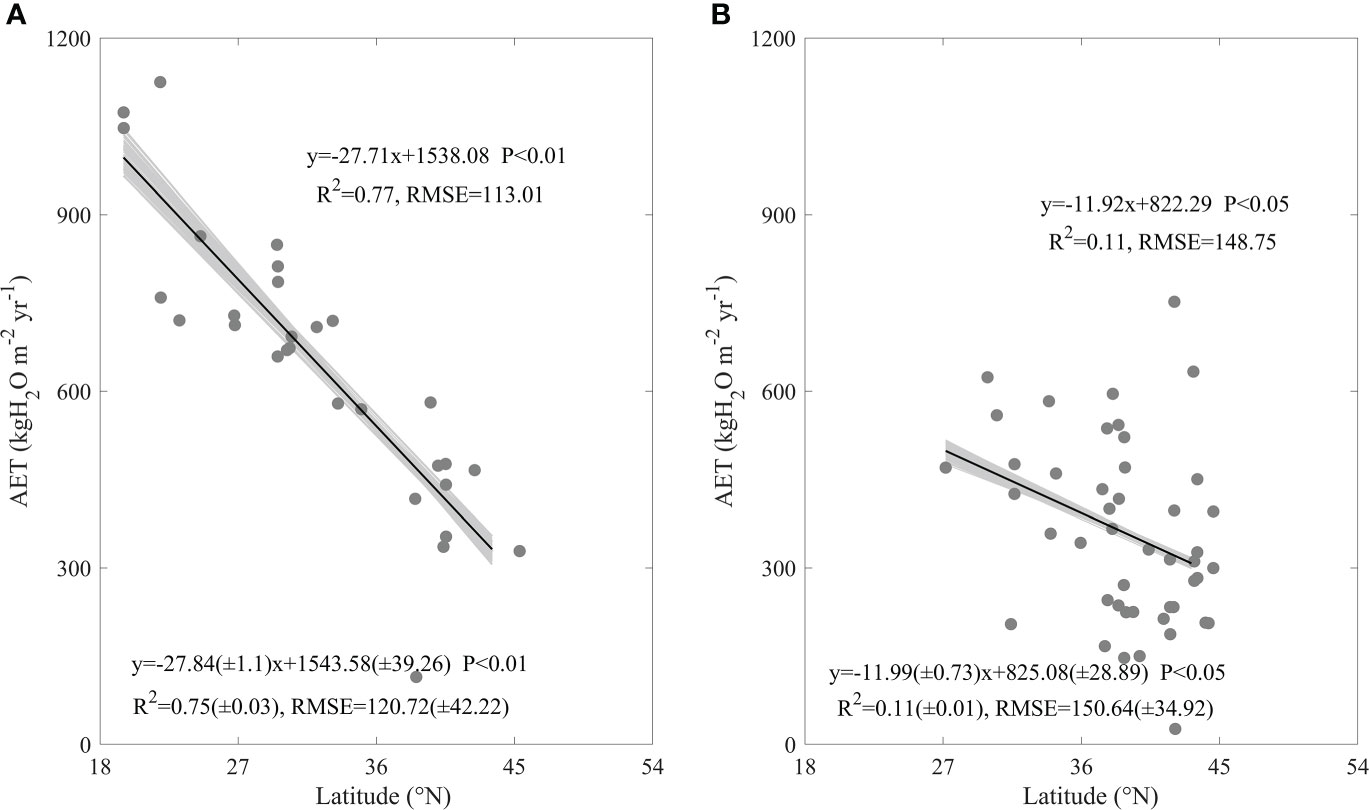
Figure 3 The annual evapotranspiration (AET) latitudinal patterns of forests (A) and grasslands (B) in China. The grey lines are regression lines generated from the random error adding AET, whose statistics are presented in the left bottom of each panel.
In contrast to the significant decreasing latitudinal patterns, AET of forests and grasslands both did not exhibit significant longitudinal and altitudinal patterns (data not shown).
Differences in the effects of environmental factors on AET spatial variations
Divergent environmental factors exerted different effects on AET spatial variations, only MAT, MAP, AI, SW, LAI, and MLAI exhibited strong effects on AET spatial variations, while the differences in their effects between forests and grasslands varied among factors.
MAT significantly affected the spatial variations of AET both in forests and grasslands, while its effects differed in directions between forests and grasslands (Figures 4A, B). With increasing MAT, AET of forests showed a significant increasing trend at a rate of 22.88 kgH2O m-2 yr-1, with an R2 of 0.39 and an RMSE of 185.51 kgH2O m-2 yr-1 (Figure 4A). However, the increasing MAT significantly decreased AET in grasslands. Each increase in MAT decreased the grassland AET by 13.29 kgH2O m-2 yr-1. The equation containing MAT explained 16% of the spatial variation in grassland AET, with an RMSE of 144.65 kgH2O m-2 yr-1 (Figure 4B). The effects of MAT on AET spatial variations significantly differed between forests and grasslands (F = 26.41, P< 0.01). The effects of MAT and their differences between ecosystem types varied little with the error adding AET (Figures 4A, B).
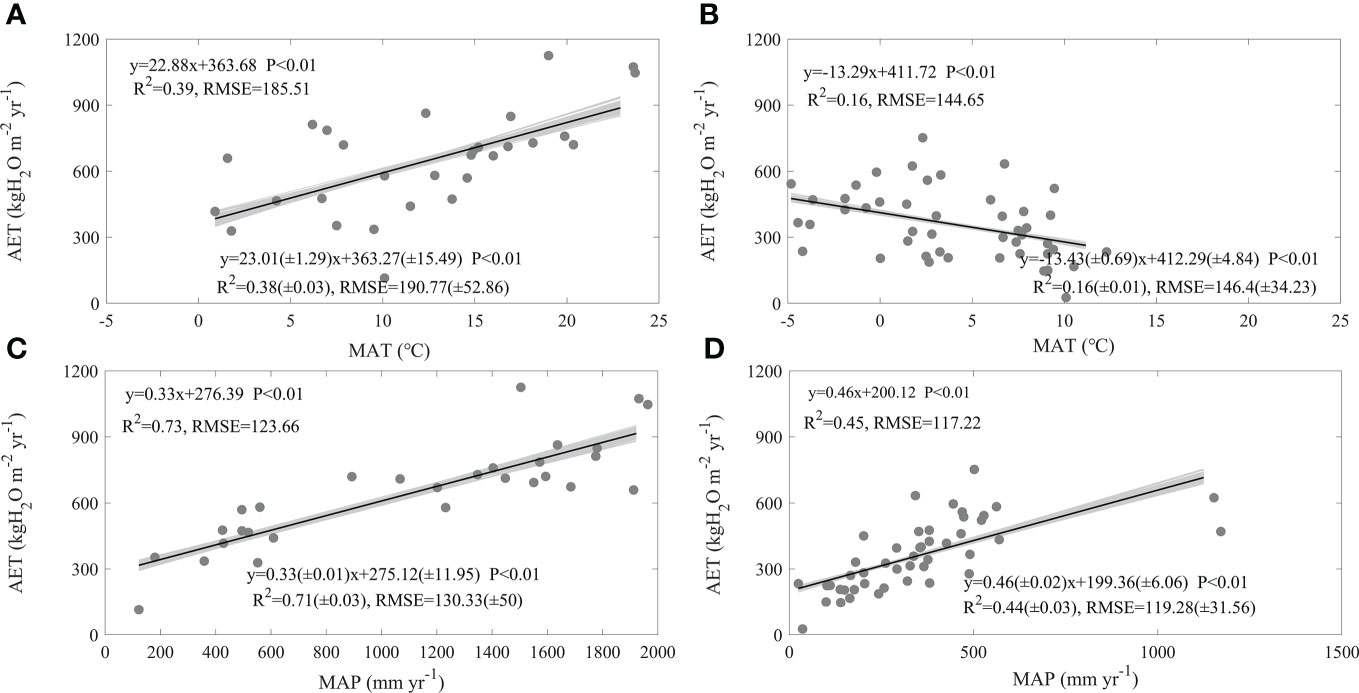
Figure 4 Effects of mean annual air temperature (MAT, A, B) and mean precipitation (MAP, C, D) on the spatial variations of annual evapotranspiration (AET) in forests (A, C) and grasslands (B, D) in China. The grey lines are regression lines generated from the random error adding AET, whose statistics are presented in the right bottom of each panel.
MAP exerted similar promotions on AET spatial variations both in forests and grasslands (Figures 4C, D). The increasing MAP significantly increased forest AET at a rate of 0.33 kgH2O m-2 yr-1, with an R2 of 0.73 and an RMSE of 123.66 kgH2O m-2 yr-1 (Figure 4C). The increasing MAP raised grassland AET at a rate of 0.46 kgH2O m-2 yr-1. The equation containing MAP explained 45% AET spatial variation in grasslands, with an RMSE of 117.22 kgH2O m-2 yr-1 (Figure 4D). The increasing rates of AET induced by MAP showed no significant difference between forests and grasslands (F = 2.09, P > 0.05). In addition, the effects of MAP on AET spatial variations and their differences between ecosystem types did not vary with the error adding AET (Figures 4C, D).
AI also exerted significant positive effects on AET spatial variations both in forests (Figure 5A) and grasslands (Figure 5B), with no significant difference appearing between ecosystem types (Figure 5). The increasing AI made forest AET significantly increase at a rate of 289.59 kgH2O m-2 yr-1, with an R2 of 0.58 and an RMSE of 154.11 kgH2O m-2 yr-1 (Figure 5A). Grassland AET was also raised by the increasing AI at a rate of 397.82 kgH2O m-2 yr-1, with an R2 of 0.45 and an RMSE of 117.18 kgH2O m-2 yr-1(Figure 5B). Though the increasing rates differed in values between forests and grasslands, their difference was not statistically different (F = -1.26, P > 0.05) (Figure 5). In addition, the errors in AET calculation indicated by the error adding AET seldom varied the effects of AI on AET spatial variations and their differences between ecosystem types (Figure 5).
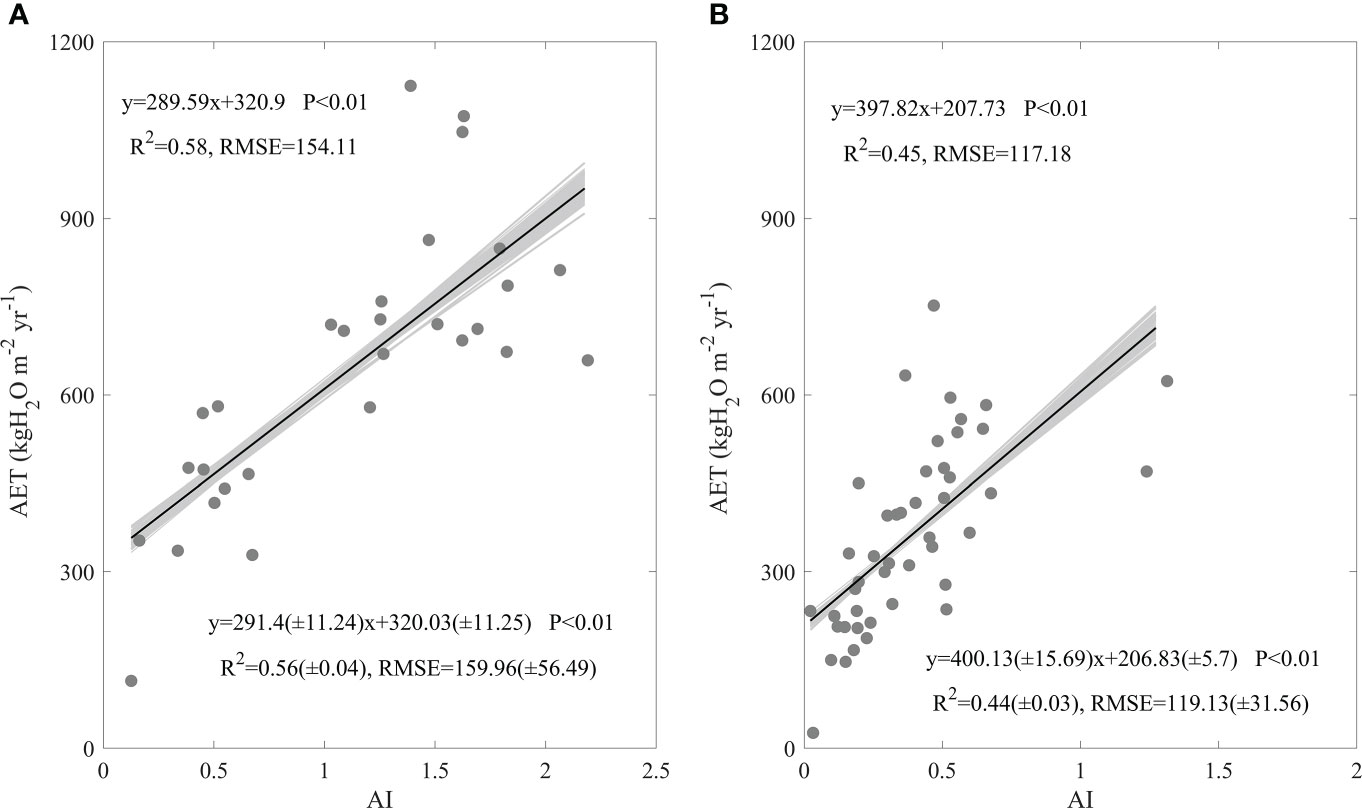
Figure 5 Effects of aridity index (AI) on the spatial variations of annual evapotranspiration (AET) in forests (A) and grasslands (B) in China. The grey lines are regression lines generated from the random error adding AET, whose statistics are presented in the right bottom of each panel.
The increasing SW significantly increased AET in forests and grasslands at similar rates (Figure 6). With the increasing SW, Forest AET significantly increased at a rate of 1437.93 kgH2O m-2 yr-1. The equation containing SW explained 43% of AET spatial variation in forests, with an RMSE of 178.18 kgH2O m-2 yr-1 (Figure 6A). Grassland AET increased with the increasing SW at a rate of 1160.6 kgH2O m-2 yr-1, with an R2 of 0.26 and an RMSE of 135.31 kgH2O m-2 yr-1(Figure 6B). The increasing rates of AET along the increasing SW showed no significant difference between forests and grasslands (F = 0.42, P > 0.05). Meanwhile, the potential errors in calculating AET seldom varied the effects of SW on AET spatial variations and their difference between forests and grasslands (Figure 6).
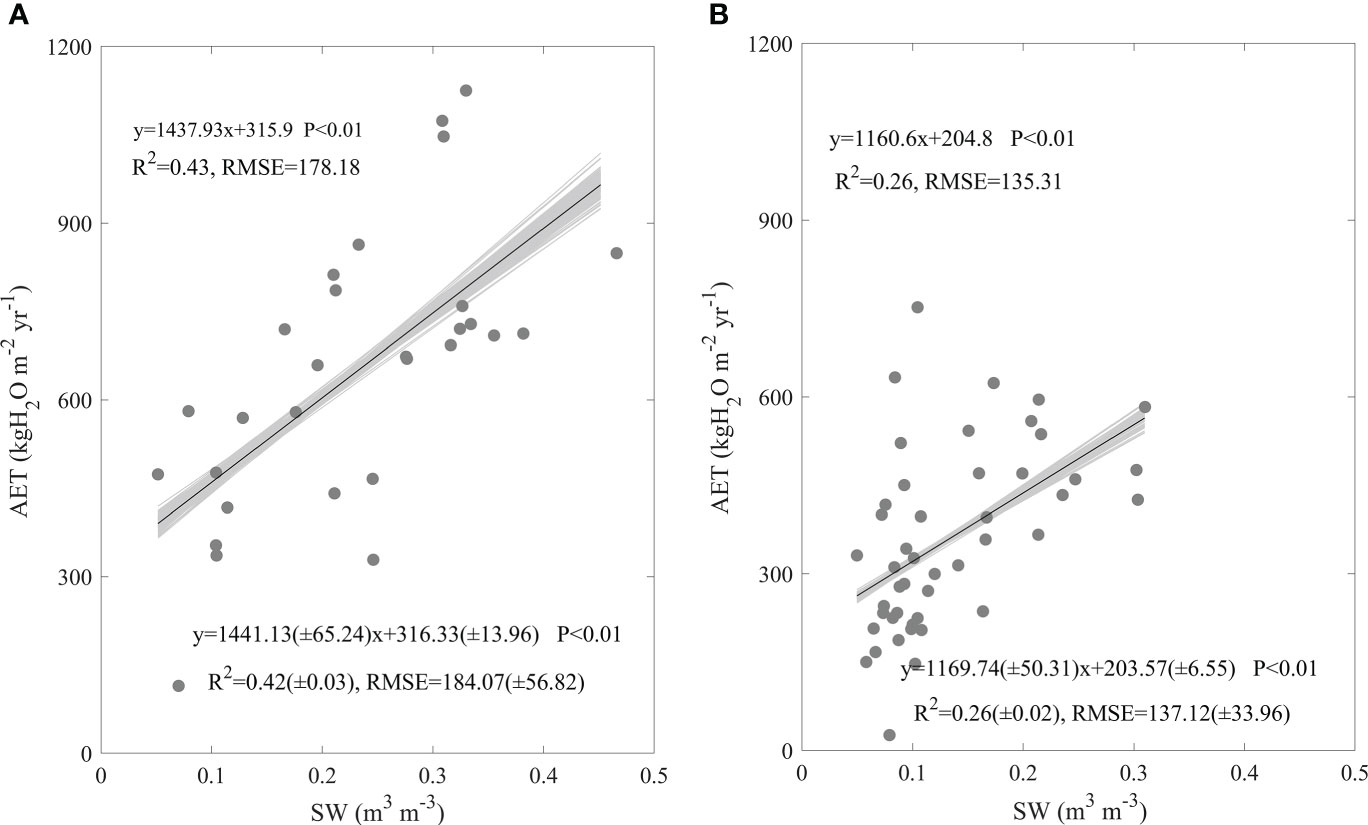
Figure 6 Effects of soil water content (SW) on the spatial variations of annual evapotranspiration (AET) in forests (A) and grasslands (B) in China. The grey lines are regression lines generated from the random error adding AET, whose statistics are presented in the right bottom of each panel.
Leaf area index exerted significant and positive effects on AET spatial variations, but their effects differed between forests and grasslands (Figure 7). The increasing LAI made forest AET increase at a rate of 109.58 kgH2O m-2 yr-1, with an R2 of 0.37and an RMSE of 188.48 kgH2O m-2 yr-1 (Figure 7A). The increasing LAI also made grassland AET increase, while the increasing rate was 280.18 kgH2O m-2 yr-1, with an R2 of 0.34 and an RMSE of 127.98 kgH2O m-2 yr-1 (Figure 7B). Forests took a significant higher AET increasing rate than grasslands (F = 5.33, P< 0.05). With increasing MLAI, forest AET increased at a rate of 57.71 kgH2O m-2 yr-1, with an R2 of 0.23 and an RMSE of 208.08 kgH2O m-2 yr-1 (Figure 7C), while grassland AET increased at a rate of 81.06 kgH2O m-2 yr-1, with an R2 of 0.31 and an RMSE of 130.63 kgH2O m-2 yr-1 (Figure 7D). Though the increasing rates along the increasing MLAI differed in values between forests and grasslands, their difference was not statistically significant (F = 0.7, P > 0.05). In addition, the uncertainties in calculating AET seldom affected the effects of leaf area index on AET spatial variations and their differences between forests and grasslands (Figure 7).
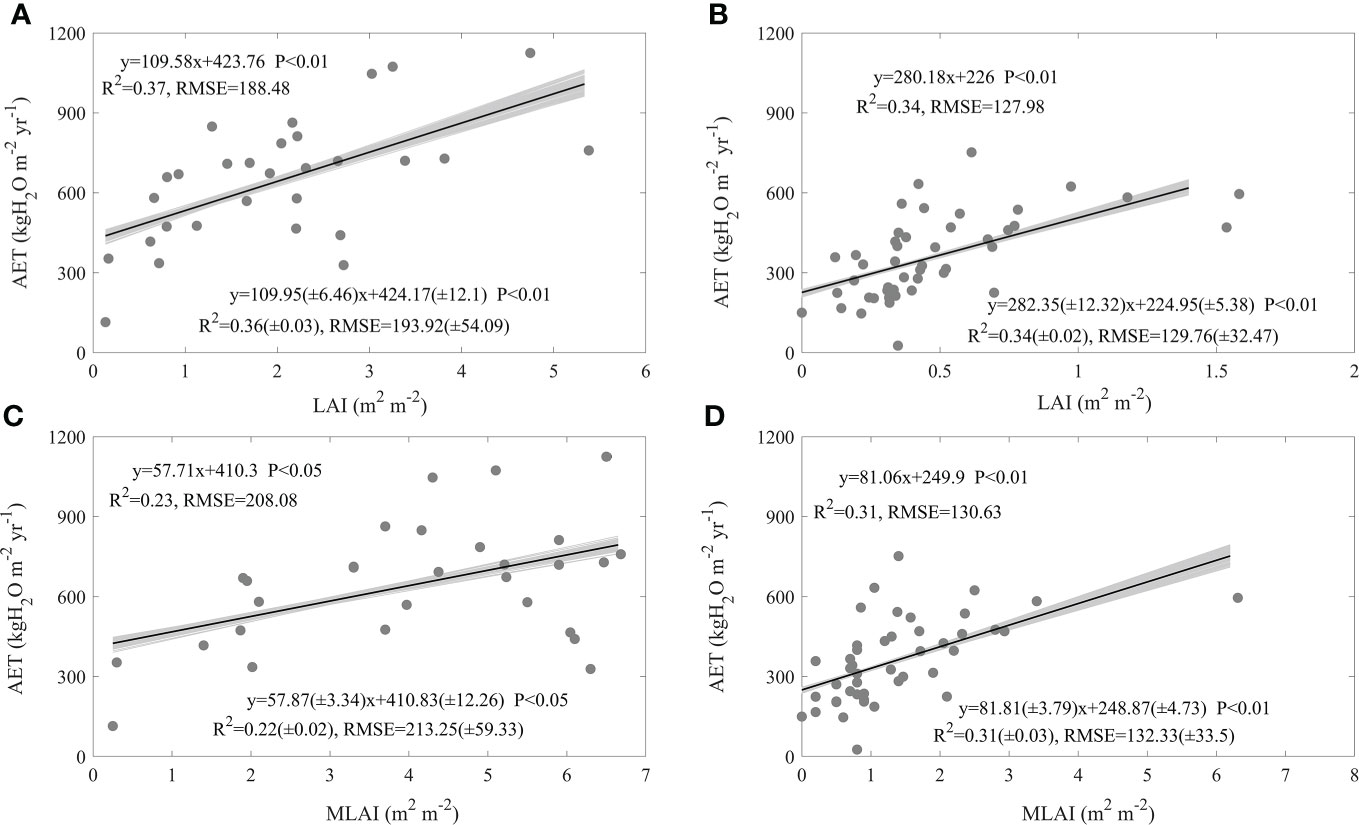
Figure 7 Effects of mean annual leaf area index (LAI, A, B) and maximum leaf area index (MLAI, C, D) on the spatial variations of annual evapotranspiration (AET) in forests (A, C) and grasslands (B, D) in China. The grey lines are regression lines generated from the random error adding AET, whose statistics are presented in the right bottom of each panel.
Based on the unique effects of each factors, we obtained their comprehensive effects on AET spatial variations in forests and grasslands and their difference between ecosystem types. Results showed that climatic factors dominated the spatial variation of AET in forests, with the dominating role of MAP. The equation containing MAP, AI, and ρc,yr explained 83% of AET spatial variation in forests, with an RMSE of 104.40 kgH2O m-2 yr-1 (Eq. (1)). MAP had a higher independent effect accounting for 48% of AET spatial variation. AI accounted for 33% of AET spatial variation, while the independent effect of ρc,yr was only 2%. However, the spatial variation of AET was jointly affected by MAP and leaf area index with the dominating role of MAP. The equation containing MAP, LAI, and MLAI explained 56% of AET spatial variation in forests, with an RMSE of 106.87 kgH2O m-2 yr-1 (Eq. (2)). MAP had a higher independent effect accounting for 28% of AET spatial variation, while LAI and MLAI both accounted for 14% of AET spatial variation. Therefore, MAP exerted a stronger effect on AET spatial variations both in forests and grasslands.
Discussions
The differences in AET values
In this study, we found that AET values significantly differed between forests and grasslands (Figure 2L), while the difference in AET values was not significant after controlling MAP relating factors as the covariant. Our results indicate that the differences in AET values between forests and grasslands may primarily source from the difference in MAP, which mainly resulted from the spatial distribution of forests and grasslands used in this study. Forests employed in this study primarily distributed in eastern China, while grasslands were mainly located in the western China (Figure 1) (Guo et al., 2022), which made forests have a higher MAP than grasslands (Figure 2B). A higher MAP meant more water were available for an ecosystem to evaporate as the energy arriving at the land surface were much larger than that an ecosystem required for evaporation (Jin et al., 2011; Chapin et al., 2012; Williams et al., 2012; Zhu et al., 2016a; IPCC, 2021). Under similar MAP, both forests and grasslands had similar amounts of available water for evaporating, which made AET values of forests and grasslands comparable. Therefore, the spatial distribution of forests and grasslands induced the difference in MAP, which shaped the significant difference in AET values between forests and grasslands. The fact that forests had a higher AET than grasslands was widely found in direct measurements (Brümmer et al., 2012; Xiao et al., 2013; Zheng et al., 2016; Feltrin et al., 2017) or modeling results (Li et al., 2014; Li et al., 2018; Fang et al., 2020; Sun et al., 2021), while our results originally found that forests and grasslands had similar AET values after controlling MAP relating factors as the covariant. This phenomenon meant that forests and grasslands had comparable AET values under similar MAP, which may indicate that different ecosystem types under similar climate had comparable AET values. Therefore, MAP gradient may be more important than ecosystem types in determining AET values, which meant that selecting parameters for modeling ET thus AET may take MAP as a reference but not only ecosystem types.
Differences in AET spatial variations
In this study, we found factors shaping AET spatial variations differed between forests and grasslands, while MAP played a dominating role both in forests and grasslands (Eqs. (1-2)). In addition, the AET increasing rates along the increasing MAP showed no significant difference between ecosystem types (Figures 4C, D). AI (Figure 5), SW (Figure 6), and leaf area index (Figure 7) all exhibited similar effects with MAP. However, MAT exerted divergent effects on AET spatial variations between forests and grasslands (Figures 4A, B), so did latitude (Figure 3). As an annual value at a relative long time scale, AET reflected the comprehensive adaption of an ecosystem to local environment, which compromised between water supply and energy demand. MAP directly provided the available water for evaporation (Chapin et al., 2012; Wang and Dickinson, 2012). Considering the available energy used for evapotranspiration represented by net radiation was much higher than that evapotranspiration required (Jin et al., 2011; Chapin et al., 2012; Williams et al., 2012; Zhu et al., 2016a; IPCC, 2021), MAP played a dominating role in AET spatial variations. However, the post processes after water arriving at the land surface like runoff or infiltration and vegetation metabolism limited the representativeness of MAP as water supply, which made AET not respond to MAP in a direct linear way (Figures 4C, D) (Williams et al., 2012). The similar effects of AI, SW, and leaf area index on AET spatial variations with MAP may source from their close correlation with MAP (Supplementary Table S2). MAP showed high correlation coefficients with those factors, which were found both in forests and grasslands (Supplementary Table S2). In addition, MAP showed divergent correlation coefficients with MAT between forests and grasslands (Supplementary Table S2) as the site spatial distribution (Figure 1), which induced the divergent effects of MAT on AET spatial variations between forests and grasslands (Figures 4A, B). The negative correlation coefficients between latitude and MAP made AET show significant decreasing latitudinal pattern (Figure 3). However, the MAP decreasing rates along the increasing latitude significantly differed between forests and grasslands (F = -3.93, P<0.01, data were not shown), which induced the significant difference in AET latitudinal patterns between forests and grasslands (Figure 3). Therefore, it was well known that MAP affected the spatial variation of AET, while we originally revealed the dominating role of MAP in AET spatial variations. In addition, we originally found the similar increasing rates of AET along the increasing MAP between forests and grasslands, which indicates that AET of different ecosystem types responded similar to MAP.
Conclusions
Based on published eddy covariance measurements in China, we collected annual evapotranspiration (AET) data from 29 forests and 46 grasslands, and analyzed the differences in AET values and spatial variations between forests and grasslands in China. Results showed that forests had a higher AET than grasslands, while similar AET values occurred between forests and grasslands after controlling mean annual precipitation (MAP) relating factors as the covariant. Factors shaping AET spatial variations differed between forests and grasslands, while MAP played a dominating role both in forests and grasslands. Along the increasing MAP, AET increased at the similar rates between forests and grasslands. Therefore, different ecosystem types under similar climate had comparable AET values. AET responses to MAP were comparable between ecosystem types. Our findings provided a data basis for understanding AET spatial variation over terrestrial ecosystems of China or globally.
Data availability statement
The original contributions presented in the study are included in the article/Supplementary material. Further inquiries can be directed to the corresponding authors.
Author contributions
RF, analysis of data and drafts the manuscript; MS, acquisition of data and designs MATLAB program; XZ, propose the design of the manuscript and makes suggestions for revision; QW, approves the final manuscript. All authors contributed to the article and approved the submitted version.
Funding
The work was jointly supported by the CAS Strategic Priority Research Program (XDA19020302), the National Natural Science Foundation of China (32071585, 32071586, and 31500390), and Special Foundation for National Science and Technology Basic Research Program of China (2019FY101303-2).
Acknowledgments
We gratefully acknowledge the reviewers for spending their valuable time to provide constructive comments. Special thanks to data provider from the FLUXNET community especially ChinaFLUX and USCCC networks.
Conflict of interest
The authors declare that the research was conducted in the absence of any commercial or financial relationships that could be construed as a potential conflict of interest.
Publisher’s note
All claims expressed in this article are solely those of the authors and do not necessarily represent those of their affiliated organizations, or those of the publisher, the editors and the reviewers. Any product that may be evaluated in this article, or claim that may be made by its manufacturer, is not guaranteed or endorsed by the publisher.
Supplementary material
The Supplementary Material for this article can be found online at: https://www.frontiersin.org/articles/10.3389/fpls.2022.1030929/full#supplementary-material
References
Baldocchi, D. (2008). Breathing of the terrestrial biosphere: Lessons learned from a global network of carbon dioxide flux measurement systems. Aust. J. Bot. 56 (1), 1–26. doi: 10.1071/BT07151
Baldocchi, D. (2014). Measuring fluxes of trace gases and energy between ecosystems and the atmosphere - the state and future of the eddy covariance method. Glob. Change Biol. 20 (12), 3600–3609. doi: 10.1111/gcb.12649
Brümmer, C., Black, T. A., Jassal, R. S., Grant, N. J., Spittlehouse, D. L., Chen, B., et al. (2012). How climate and vegetation type influence evapotranspiration and water use efficiency in Canadian forest, peatland and grassland ecosystems. Agric. For. Meteorol. 153, 14–30. doi: 10.1016/j.agrformet.2011.04.008
Chapin, F. S., Matson, P. A., Mooney, H. A. (2012). Principles of terrestrial ecosystem ecology (New York: Springer).
Chen, Y., Feng, X., Fu, B. (2021). An improved global remote-sensing-based surface soil moisture (RSSSM) dataset covering 2003–2018. Earth Syst. Sci. Data 13 (1), 1–31. doi: 10.5194/essd-13-1-2021
Cheng, J., Liang, S. (2014). Estimating the broadband longwave emissivity of global bare soil from the MODIS shortwave albedo product. J. Geophys. Res.-Atmos. 119 (2), 614–634. doi: 10.1002/2013JD020689
Chen, H., Zeng, Z. Z., Wu, J., Peng, L. Q., Lakshmi, V., Yang, H., et al. (2020). Large Uncertainty on forest area change in the early 21st century among widely used global land cover datasets. Remote Sens. 12 (21), 3502. doi: 10.3390/rs12213502
Chu, C., Bartlett, M., Wang, Y., He, F., Weiner, J., Chave, J., et al. (2016). Does climate directly influence NPP globally? Glob. Change Biol. 22 (1), 12–24. doi: 10.1111/gcb.13079
Ding, R., Kang, S., Li, F., Zhang, Y., Tong, L., Sun, Q. (2010). Evaluating eddy covariance method by large-scale weighing lysimeter in a maize field of northwest China. Agric. Water Manage. 98 (1), 87–95. doi: 10.1016/j.agwat.2010.08.001
Douville, H., Ribes, A., Decharme, B., Alkama, R., Sheffield, J. (2013). Anthropogenic influence on multidecadal changes in reconstructed global evapotranspiration. Nat. Clim. Change 3 (1), 59–62. doi: 10.1038/nclimate1632
Fang, B., Lei, H., Zhang, Y., Quan, Q., Yang, D. (2020). Spatio-temporal patterns of evapotranspiration based on upscaling eddy covariance measurements in the dryland of the north China plain. Agric. For. Meteorol 281 (C), 107844. doi: 10.1016/j.agrformet.2019.107844
Feltrin, R. M., Dias de Paiva, J. B., Cauduro Dias de Paiva, E. M., Meissner, R., Rupp, H., Borg, H. (2017). Use of lysimeters to assess water balance components in grassland and atlantic forest in southern Brazil. Water Air Soil pollut. 228 (7), 247. doi: 10.1007/s11270-017-3423-4
Guo, J., Zhu, Z. L., Gong, P. (2022). A global forest reference set with time series annual change information from 2000 to 2020. Int. J. Remote Sens. 43 (9), 3152–3162. doi: 10.1080/01431161.2022.2088256
Harris, I., Osborn, T. J., Jones, P., Lister, D. (2020). Version 4 of the CRU TS monthly high-resolution gridded multivariate climate dataset. Sci. Data 7 (1), 109. doi: 10.1038/s41597-020-0453-3
Hill, M. J., Guerschman, J. P. (2020). The MODIS global vegetation fractional cover product 2001-2018: Characteristics of vegetation fractional cover in grasslands and savanna woodlands. Remote Sens 12 (3), 406. doi: 10.3390/rs12030406
IPCC (2021). Climate change 2021: The physical science basis. (New York, NY, USA: Cambridge University Press, Cambridge, United Kingdom.
Jin, Y., Randerson, J. T., Goulden, M. L. (2011). Continental-scale net radiation and evapotranspiration estimated using MODIS satellite observations. Remote Sens. Environ. 115 (9), 2302–2319. doi: 10.1016/j.rse.2011.04.031
Kool, D., Ben-Gal, A., Agam, N., Šimůnek, J., Heitman, J. L., Sauer, T. J., et al. (2014). Spatial and diurnal below canopy evaporation in a desert vineyard: measurements and modeling. Water Resour. Res. 50 (8), 7035–7049. doi: 10.1002/2014wr015409
Krishnan, P., Meyers, T. P., Scott, R. L., Kennedy, L., Heuer, M. (2012). Energy exchange and evapotranspiration over two temperate semi-arid grasslands in north America. Agric. For. Meteorol. 153, 31–44. doi: 10.1016/j.agrformet.2011.09.017
Liang, S., Zhao, X., Liu, S., Yuan, W., Cheng, X., Xiao, Z., et al. (2013). A long-term global LAnd surface satellite (GLASS) data-set for environmental studies. Int. J. Digit. Earth 6 (1), 5–33. doi: 10.1080/17538947.2013.805262
Li, X. Y., He, Y., Zeng, Z. Z., Lian, X., Wang, X. H., Du, M. Y., et al. (2018). Spatiotemporal pattern of terrestrial evapotranspiration in China during the past thirty years. Agric. For. Meteorol. 259, 131–140. doi: 10.1016/j.agrformet.2018.04.020
Li, X., Liang, S., Yuan, W., Yu, G., Cheng, X., Chen, Y., et al. (2014). Estimation of evapotranspiration over the terrestrial ecosystems in China. Ecohydrology 7 (1), 139–149. doi: 10.1002/eco.1341
Miao, L., Zhu, F., He, B., Ferrat, M., Liu, Q., Cao, X., et al. (2013). Synthesis of china’s land use in the past 300 years. Glob. Planet. Change 100, 224–233. doi: 10.1016/j.gloplacha.2012.10.021
Murray, K., Conner, M. M. (2009). Methods to quantify variable importance: implications for the analysis of noisy ecological data. Ecology 90 (2), 348–355. doi: 10.1890/07-1929.1
O’Mara, F. P. (2012). The role of grasslands in food security and climate change. Ann. Bot. 110 (6), 1263–1270. doi: 10.1093/aob/mcs209
Peng, S., Ding, Y., Liu, W., Li, Z. (2019). 1~km monthly temperature and precipitation dataset for China from 1901 to 2017. Earth Syst. Sci. Data 11 (4), 1931–1946. doi: 10.5194/essd-11-1931-2019
Shangguan, W., Dai, Y., Duan, Q., Liu, B., Yuan, H. (2014). A global soil data set for earth system modeling. J. Adv. Model. Earth Syst. 6 (1), 249–263. doi: 10.1002/2013MS000293
Sun, R. C., Duan, Q. Y., Wang, J. H. (2021). Understanding the spatial patterns of evapotranspiration estimates from land surface models over China. J. Hydrol. 595, 126021. doi: 10.1016/j.jhydrol.2021.126021
Wang, K., Dickinson, R. E. (2012). A review of global terrestrial evapotranspiration: observation, modeling, climatology, and climatic variability. Rev. Geophys. 50 (2), RG2005. doi: 10.1029/2011rg000373
Wang, S., Yang, Y., Luo, Y., Rivera, A. (2013). Spatial and seasonal variations in evapotranspiration over canada’s landmass. Hydrol. Earth Syst. Sci. 17 (9), 3561–3575. doi: 10.5194/hess-17-3561-2013
Williams, C. A., Reichstein, M., Buchmann, N., Baldocchi, D., Beer, C., Schwalm, C., et al. (2012). Climate and vegetation controls on the surface water balance: synthesis of evapotranspiration measured across a global network of flux towers. Water Resour. Res. 48 (6), W06523. doi: 10.1029/2011wr011586
Wu, G. X., Liu, Y. M., Wang, T. M., Wan, R. J., Liu, X., Li, W. P., et al. (2007). The influence of mechanical and thermal forcing by the Tibetan plateau on Asian climate. J. Hydrometeorol. 8 (4), 770–789. doi: 10.1175/jhm609.1
Xiao, J., Sun, G., Chen, J., Chen, H., Chen, S., Dong, G., et al. (2013). Carbon fluxes, evapotranspiration, and water use efficiency of terrestrial ecosystems in China. Agric. For. Meteorol. 182, 76–90. doi: 10.1016/j.agrformet.2013.08.007
Yuan, H., Dai, Y., Xiao, Z., Ji, D., Shangguan, W. (2011). Reprocessing the MODIS leaf area index products for land surface and climate modelling. Remote Sens. Environ. 115 (5), 1171–1187. doi: 10.1016/j.rse.2011.01.001
Yue, P., Zhang, Q., Ren, X. Y., Yang, Z. S., Li, H. Y., Yang, Y. (2022). Environmental and biophysical effects of evapotranspiration in semiarid grassland and maize cropland ecosystems over the summer monsoon transition zone of China. Agric. Water Manage. 264, 107462. doi: 10.1016/j.agwat.2022.107462
Yu, G. R., Fu, Y. L., Sun, X. M., Wen, X. F., Zhang, L. M. (2006). Recent progress and future directions of ChinaFLUX. Sci. China Ser. D-Earth Sci. 49 (2), 1–23. doi: 10.1007/s11430-006-8001-3
Yu, G., Ren, W., Chen, Z., Zhang, L., Wang, Q., Wen, X., et al. (2016). Construction and progress of Chinese terrestrial ecosystem carbon, nitrogen and water fluxes coordinated observation. J. Geogr. Sci. 26 (7), 803–826. doi: 10.1007/s11442-016-1300-5
Yu, G.-R., Zhu, X.-J., Fu, Y.-L., He, H.-L., Wang, Q.-F., Wen, X.-F., et al. (2013). Spatial patterns and climate drivers of carbon fluxes in terrestrial ecosystems of China. Glob. Change Biol. 19 (3), 798–810. doi: 10.1111/gcb.12079
Zhao, W., Liu, B., Zhang, Z. (2010). Water requirements of maize in the middle heihe river basin, China. Agric. Water Manage. 97 (2), 215–223. doi: 10.1016/j.agwat.2009.09.011
Zheng, H., Yu, G. R., Wang, Q. F., Zhu, X. J., He, H. L., Wang, Y. F., et al. (2016). Spatial variation in annual actual evapotranspiration of terrestrial ecosystems in China: results from eddy covariance measurements. J. Geogr. Sci. 26 (10), 1391–1411. doi: 10.1007/s11442-016-1334-8
Zhu, X.-J., Qu, F.-Y., Fan, R.-X., Chen, Z., Wang, Q.-F., Yu, G.-R. (2022). Effects of ecosystem types on the spatial variations in annual gross primary productivity over terrestrial ecosystems of China. Sci. Total Environ. 833, 155242. doi: 10.1016/j.scitotenv.2022.155242
Zhu, P., Wild, M., van Ruymbeke, M., Thuillier, G., Meftah, M., Karatekin, O. (2016a). Interannual variation of global net radiation flux as measured from space. J. Geophys. Res.-Atmos. 121 (12), 6877–6891. doi: 10.1002/2015jd024112
Zhu, X.-J., Yu, G.-R., Chen, Z., Zhang, W.-K., Han, L., Wang, Q.-F., et al. (2023). Mapping Chinese annual gross primary productivity with eddy covariance measurements and machine learning. Sci. Total Environ. 857, 159390. doi: 10.1016/j.scitotenv.2022.159390
Zhu, X.-J., Yu, G.-R., Hu, Z.-M., Wang, Q.-F., He, H.-L., Yan, J.-H., et al. (2015). Spatiotemporal variations of T/ET (the ratio of transpiration to evapotranspiration) in three forests of Eastern China. Ecol. Indic. 52, 411–421. doi: 10.1016/j.ecolind.2014.12.030
Keywords: evapotranspiration, eddy covariance, spatial variability, climate change, vegetation area
Citation: Fan R, Sun M, Zhu X and Wang Q (2022) Eddy covariance measurement-based differences in annual evapotranspiration between forests and grasslands in China. Front. Plant Sci. 13:1030929. doi: 10.3389/fpls.2022.1030929
Received: 29 August 2022; Accepted: 10 November 2022;
Published: 25 November 2022.
Edited by:
Xiaoping Xin, National Hulunber Grassland Ecosystem Observation and Research Station & Institute of Agricultural Resources and Regional Planning (CAAS), ChinaReviewed by:
Changliang Shao, National Hulunber Grassland Ecosystem Observation and Research Station & Institute of Agricultural Resources and Regional Planning (CAAS), ChinaJingbin Zhu, Zaozhuang University, China
Copyright © 2022 Fan, Sun, Zhu and Wang. This is an open-access article distributed under the terms of the Creative Commons Attribution License (CC BY). The use, distribution or reproduction in other forums is permitted, provided the original author(s) and the copyright owner(s) are credited and that the original publication in this journal is cited, in accordance with accepted academic practice. No use, distribution or reproduction is permitted which does not comply with these terms.
*Correspondence: Xianjin Zhu, xianjin1985@163.com; Qiufeng Wang, qfwang@igsnrr.ac.cn