 Shuya Liu1,2,3
 Qing Xu
 Nansheng Chen
- 1CAS Key Laboratory of Marine Ecology and Environmental Sciences, Institute of Oceanology, Chinese Academy of Sciences, Qingdao, China
- 2Functional Laboratory of Marine Ecology and Environmental Science, Qingdao National Laboratory for Marine Science and Technology, Qingdao, China
- 3Center for Ocean Mega-Science, Chinese Academy of Sciences, Qingdao, China
- 4College of Life Science and Technology, Huazhong Agricultural University, Wuhan, China
- 5College of Marine Science, University of Chinese Academy of Sciences, Beijing, China
- 6Jiaozhou Bay National Marine Ecosystem Research Station, Institute of Oceanology, Chinese Academy of Sciences, Qingdao, China
- 7Department of Molecular Biology and Biochemistry, Simon Fraser University, Burnaby, BC, Canada
Skeletonema species are cosmopolitan coastal diatoms that exhibit important roles in ecological system. The chloroplast genomes (cpDNAs) have been proven to be important in the study of molecular evolution and genetic diversity. However, cpDNA of only a single Skeletonema species (S. pseudocostatum) has been constructed, hindering in-depth investigation on Skeletonema species. In this study, complete cpDNAs of five Skeletonema species were constructed with cpDNAs of four species S. marinoi, S. tropicum, S. costatum, and S. grevillea constructed for the first time. These cpDNAs had similar sizes and same numbers of genes. These cpDNAs were highly syntenic with no substantial expansions, contractions, or inversions. Interestingly, two copies of petF, which encodes ferredoxin with critical role in iron dependency, were found in all five Skeletonema species, with one copy in the cpDNA and another copy in the nuclear genome of each species. Selection analysis revealed that all PCGs of cpDNAs were undergoing purifying selection. Despite the high conservation of these cpDNAs, nine genomic regions with high sequence divergence were identified, which illustrated substantial variations that could be used as markers for phylogenetic inference and for tracking Skeletonema species in the field. Additionally, the numbers of simple sequence repeats varied among different cpDNAs, which were useful for detecting genetic polymorphisms. The divergence times estimated using PCGs of cpDNAs revealed that most of these species were established within ∼33 Mya, consistent with that estimated using mtDNAs. Overall, the current study deepened our understanding about the molecular evolution of Skeletonema cpDNAs.
Introduction
The chloroplasts are organelles for photosynthesis and other biochemical pathways in plants and algae (Halliwell, 1984). Chloroplast genomes (cpDNAs) represent maternal inheritance. A typical cpDNA has a highly conserved circular DNA arrangement with a quadripartite structure with a pair of inverted repeats (IRs: IRA and IRB), which are separated from the large-single copy (LSC) region and the small-single copy (SSC) region (Sabir et al., 2014; Liu and Pang, 2016; Yu et al., 2018; Abdullah et al., 2021; Kim et al., 2021). Research on cpDNAs complements researches on mitochondrial genomes (mtDNAs), which also present uniparental inheritance, and the nuclear genomes (Gould et al., 2008; Garg and Gould, 2016; Xu et al., 2017). Complete cpDNA sequences have been widely accepted as an informative and valuable source for understanding evolutionary biology and ecological applications (Hamsher et al., 2019; Song et al., 2020).
As one of the most diverse and ecologically important groups in phytoplankton, diatoms (Bacillariophyta) contribute about one-fifth of the total photosynthesis on earth (Armbrust, 2009; Malviya et al., 2016). The plastids of Bacillariophyta were derived by a second endosymbiosis in which red algae were taken up by a eukaryotic heterotroph (Armbrust et al., 2004; Armbrust, 2009). With time, genes from the red algae were transferred to the host nuclear genomes and many photosynthetic proteins were now encoded in the nuclear genomes, synthesized in the cytoplasm and imported into the chloroplast (Gould et al., 2008; Garg and Gould, 2016). Such endosymbiotic gene transfers (EGTs) may be critical in evolution. For example, the transfer of the petF gene, which encodes for ferredoxin with critical role in iron dependency was found to be transferred from the cpDNA to the nuclear genome in the diatom Thalassiosira oceanica (Lommer et al., 2010; Roy et al., 2020). This transfer may be critical for this diatom species to adapt to the low-iron ocean regions (Strzepek and Harrison, 2004).
The phylum Bacillariophyta is estimated to have 12,000 - 30,000 species (Malviya et al., 2016). In contrast, cpDNAs of only 55 Bacillariophyta species have been constructed, hindering further research on the evolution of Bacillariophyta species. Thus, construction and analysis of more Bacillariophyta cpDNAs are urgently needed for understanding their evolutionary history.
The genus Skeletonema, which belongs to Skeletonemataceae family, Thalassiosirales order, Mediophyceae class in Bacillariophyta, consisted of 21 taxonomically accepted species (Sarno et al., 2005, 2007; Guiry and Guiry, 2021). Skeletonema species have a cosmopolitan distribution and are usually dominant phytoplankton in the coastal seawaters and estuaries (Kooistra et al., 2008; Liu et al., 2020; Cui et al., 2021). As an important primary producer, Skeletonema species provide food source for the higher trophic levels (Kooistra et al., 2008). Many Skeletonema species, including S. marinoi, S. costatum, and S. pseudocostatum, can form harmful algae blooms (HABs) with negative impact on environments (Godhe et al., 2006; Shuya and Nansheng, 2021). For example, high concentrations of Skeletonema species utilize nutrients necessary for other species, and also could cause hypoxia or anoxia (Mohamed, 2018). For their easy survival, fast growth, and absence of toxins, Skeletonema species are often used as food source for aquaculture (Hemaiswarya et al., 2011). Because of high ecological relevance, Skeletonema species are also used as the model phytoplankton species for genetic diversity and physiological adaptation studies (Johansson et al., 2019). For example, Haernstroem et al. (2011) used S. marinoi as a model organism, and studied the genetic structure and diversity of S. marinoi in sediment core accumulated over a 100 years. However, genomic resources of Skeletonema species are limited. For example, cpDNA of only a single Skeletonema species, S. pseudocostatum, has been constructed (Hamedi et al., 2019).
The aims of our study are: (1) to provide complete cpDNA sequences in Skeletonema genus for further comparative analysis; (2) to find suitable molecular markers to distinguish Skeletonema species in species level for ecological application; (3) to understand the genetic and evolutionary characteristics in cpDNAs of Skeletonema species. In this study, we successfully constructed complete cpDNAs of five Skeletonema species (total six Skeletonema strains) and analyzed their genomic structures, phylogenetic relationships, nucleotide substitutions, simple sequence repeats (SSRs), and divergence times, as well as the duplicative transfer of petF gene to the nucleus.
Materials and Methods
Strain Isolation, DNA Sequencing, cpDNA Construction and Annotation
In this study six Skeletonema strains were analyzed, and they were isolated from the coastal waters of China including the Bohai Sea (CNS00100), the Jiaozhou Bay (CNS00166), the Yellow Sea (CNS00243), the Changjiang Estuary (CNS00303), the Beibu Gulf (CNS00342), and the South China Sea (CNS00438), respectively, using single-cell capillary method. They were cultured in the L1 medium (Guillard and Hargraves, 1993). The DNA extraction and sequencing were same as described previously (Wang et al., 2021).
The complete cpDNAs were assembled using GetOrganelle (Jin et al., 2020) using MK372941 (S. pseudocostatum) as a reference. The cpDNAs were then validated by aligning sequencing reads against the cpDNAs using BWA (Li and Durbin, 2009) and SAMtools (Li et al., 2009), and the alignments were inspected using IGV (Thorvaldsdottir et al., 2013). After validation, the cpDNAs were annotated using MFannot1 with genetic code of 11 Bacterial, Archaeal and Plant Plastid, and were then validated using ORF Finder2. To compare with published cpDNAs accurately, we have also inspected and re-annotated the 55 cpDNAs in Bacillariophyta from NCBI. The physical maps of the circular cpDNAs of six Skeletonema species were generated with Organellar Genome DRAW (OGDRAW) (Greiner et al., 2019). The quadripartite structures of Skeletonema cpDNAs were analyzed using Annotation of Organellar Genomes (GeSeq) (Tillich et al., 2017). The AT-skew and GC-skew were calculated according to the formulae: AT-skew = (A − T)/(A + T) and GC-skew = (G − C)/(G + C).
Synteny Analysis and Sequence Divergence Analysis
Synteny analysis of six cpDNAs was carried out using Mauve (Darling et al., 2010). Gene arrangements of IR regions were plotted using the R package gggenes (David, 2020). Alignments of six Skeletonema cpDNA sequences were visualized using mVISTA in the Shuffle-LAGAN mode (Frazer et al., 2004) with the S. marinoi cpDNA (MW679506) as a reference sequence. Nucleotide diversity analysis of cpDNAs was conducted using the DnaSP (Rozas et al., 2017) by sliding window (step size = 200 bp, window length = 600 bp).
Based on the results of nucleotide diversity, nine regions with high sequence divergence were identified. The primers of these regions were designed using the Primer Premier 5.0 (Supplementary Table 1) (Singh et al., 1998). PCRs were performed in volumes of 50 μL containing 2 μL diluted template DNA (about 50 ng), 1 μL forward primer (10 μmol/L), 1 μL reverse primer (10 μmol/L), 25 μL mix (Tiangen, China) and 21 μL ddH2O. The reactions were denatured at 94°C for 4 min. Then, the reactions were run for 32 cycles at 94°C for 1 min, 52°C for 1 min 50 s, and 72°C for 2 min and a final extension at 72°C for 10 min. These PCR products were run on 1% agarose gels for checking amplicon lengths.
Phylogenetic Analysis
The phylogenetic trees of the nine regions were generated using the Maximum Likelihood (ML) method with 1000 bootstrap replicates in megaX (Kumar et al., 2018). The best-fit models were Tamura 3-parameter (T92 + G) for all regions except for CpVIII with General Time Reversible (GTR + G) model, which were obtained by Models.
Phylogenetic relationships within the 61 Bacillariophyta cpDNAs (six cpDNAs were constructed in this study and 55 cpDNAs were downloaded from NCBI) and one outgroup (Triparma laevis) were analyzed based on the 86 shared protein-coding genes (PCGs) among them. Amino acid sequence of 86 genes, including atpA, atpB, atpD, atpE, atpF, atpG, atpI, ccs1, ccsA, chlI, clpC, dnaB, ftsH, groEL, petA, petB, petD, petG, petL, petM, petN, psaA, psaB, psaD, psaF, psaJ, psbB, psbC, psbD, psbE, psbF, psbH, psbI, psbJ, psbK, psbL, psbN, psbT, psbV, psbX, psbY, rbcL, rbcS, rpl11, rpl12, rpl13, rpl14, rpl16, rpl18, rpl19, rpl1, rpl20, rpl23, rpl24, rpl29, rpl2, rpl31, rpl34, rpl35, rpl3, rpl4, rpl5, rpl6, rpoA, rpoB, rpoC1, rpoC2, rps10, rps11, rps12, rps13, rps14, rps16, rps17, rps18, rps20, rps2, rps3, rps4, rps5, rps7, rps9, secA, secY, tatC, and ycf3, were individually aligned by MAFFT (Katoh and Standley, 2013), trimmed by trimAl (Capella-Gutierrez et al., 2009), and concatenated by Phyutility (Smith and Dunn, 2008). The model for the phylogenetic tree was LG + F + R10, which was obtained by ModelFinder (Kalyaanamoorthy et al., 2017). Phylogenetic tree was constructed by IQ-TREE (Trifinopoulos et al., 2016) with SH-aLRT support (%)/aBayes support/ultrafast bootstrap support (%) and displayed by FigTree3.
Simple Sequence Repeat Analysis and Selection Analysis
MISA (Beier et al., 2017) was used to search for SSRs in the cpDNA of Skeletonema species. The minimum number repeats were 10, 5, 4, 3, 3, and 3 for mono-, di-, tri-, tetra-, penta-, and hexa-nucleotides, respectively.
To estimate selection pressure, the rates of non-synonymous (Ka) and synonymous (Ks) substitutions were analyzed by KaKs_calculator2 (Wang et al., 2010). Ka/Ks values > 1 indicated positive selection; and Ka/Ks < 1 indicated purifying selection. Each PCG was calculated pairwise between two Skeletonema species, respectively. The results divided into different functional groups (same to Figure 1 generated by OGDRAW) were visualized by the box charts using the R package ggpubr (Kassambara, 2020).
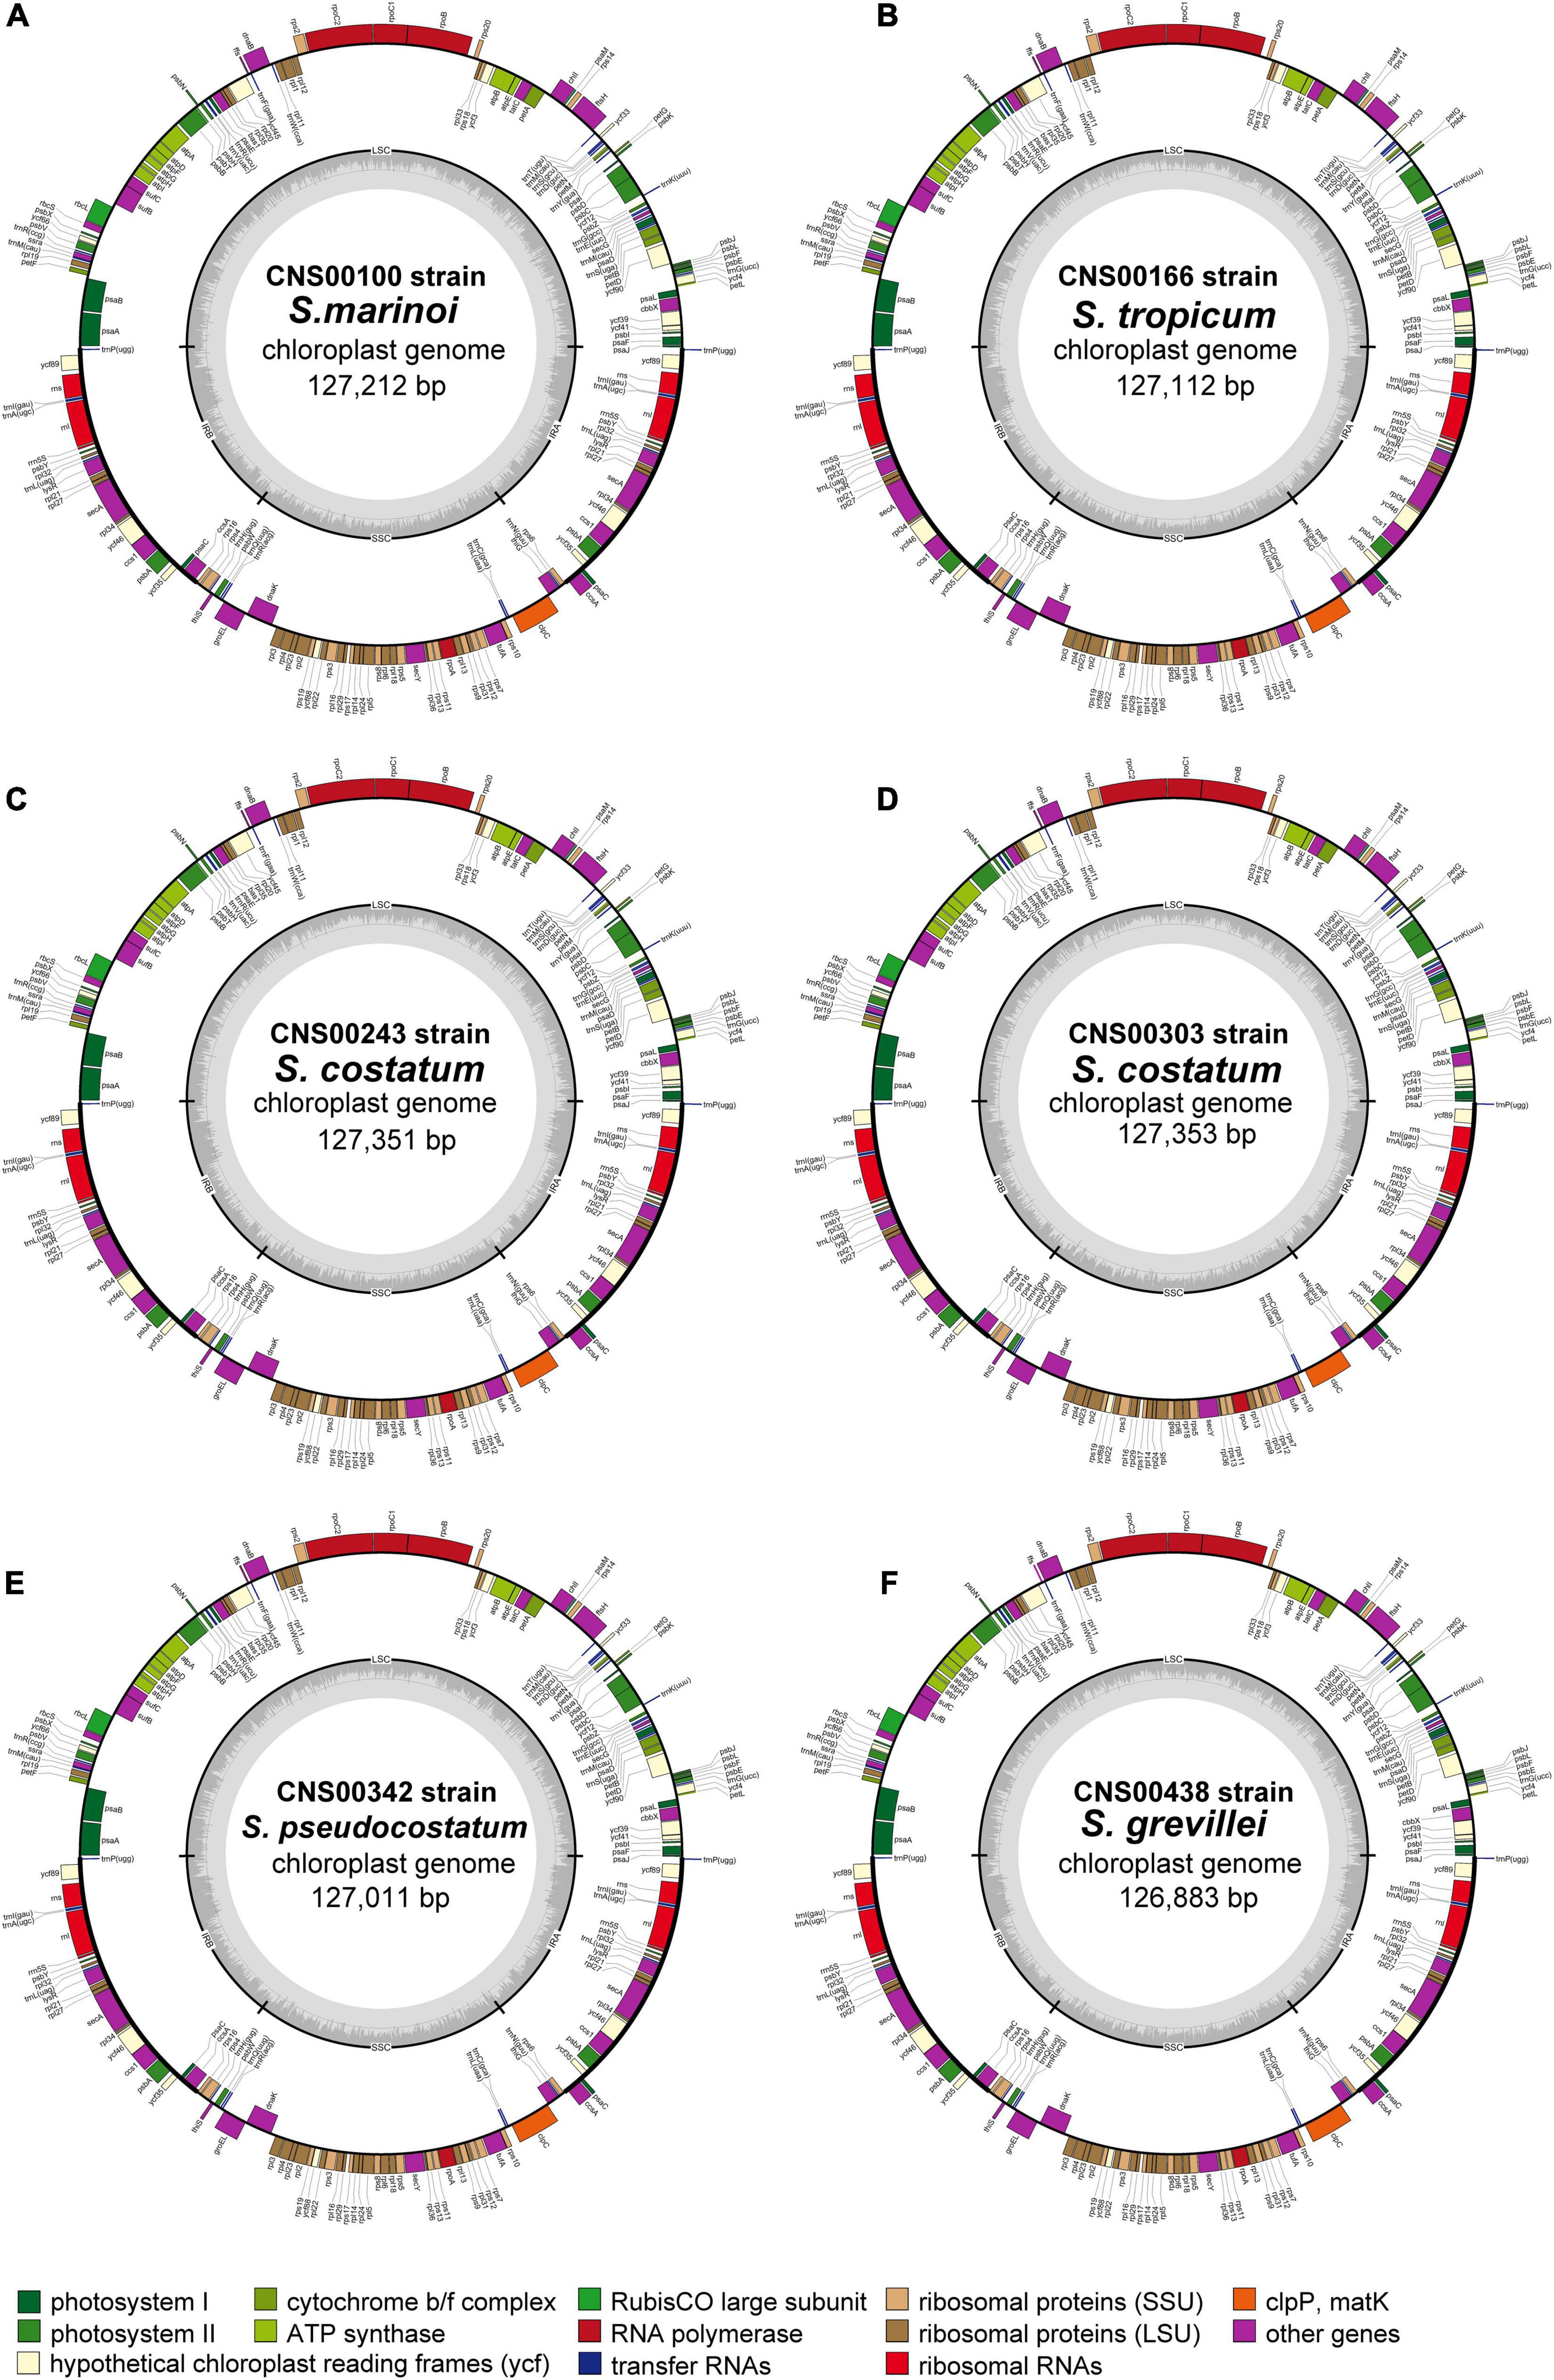
Figure 1. Chloroplast genomes of six Skeletonema strains (A–F) constructed in this study. Genes inside and outside of the circle are transcribed clockwise and counterclockwise, respectively. Genes belonging to different functional groups are shown in different colors. The LSC and SSC regions are separated by the inverted repeats (IRA and IRB). Dark and light gray colors in the inner circle correspond to the GC and AT content, respectively.
Divergence Time Estimations
Molecular dating analysis was conducted by 96 cpDNA PCGs with DNA sequences in the Class Mediophyceae. The 96 PCGs were atpA, atpB, atpD, atpE, atpF, atpG, atpH, atpI, ccs1, ccsA, chlI, clpC, dnaB, dnaK, ftsH, groEL, petA, petB, petD, petG, petL, petM, petN, psaA, psaB, psaC, psaD, psaF, psaJ, psaL, psbB, psbC, psbD, psbE, psbF, psbH, psbI, psbJ, psbK, psbL, psbN, psbT, psbV, psbW, psbX, psbY, rbcL, rbcS, rpl1,rpl2,rpl3,rpl4,rpl5,rpl6,rpl11, rpl12, rpl13, rpl14, rpl16, rpl18, rpl19, rpl20, rpl23, rpl24,rpl29,rpl31,rpl34,rpl35, rpoA, rpoB, rpoC1, rpoC2, rps2, rps3, rps4, rps5, rps7, rps8, rps9, rps10, rps11, rps12, rps13, rps14, rps16, rps17, rps18, rps19, rps20, secA, secY, tatC, ycf3, ycf4, ycf39, and ycf41. These genes were analyzed in the PhyloSuite (Zhang et al., 2020), including alignment by Mafft, concatenation by Concatenate Sequence, finding the best-fit evolutionary model by PartitionFinder2 and phylogenetic trees construction using MrBayes methods. Molecular dating was performed using the PAML package (Yang, 2007). Two calibration points were used in the analysis (Supplementary Table 2), including Synedra and Fragilaria (Nakov et al., 2018), Ectocarpus siliculosus and Bacillariophyta (Armbrust, 2009). The phylogenetic tree was visualized in the FigTree with 95% highest posterior density interval (HPD).
Gene Structure and Phylogenetic Analysis of petF Gene Among Skeletonema Species
To obtain scaffolds, clean data were assembled independently using Platanus (Kajitani et al., 2019), SPAdes (Bankevich et al., 2012), and ABySS (Jackman et al., 2017). To find petF genes encoded in the nuclear genome, sequences of petF of published Skeletonema species (Roy et al., 2020) were used as references to find the target scaffolds using BLAST (tblastn). Because some software failed to assemble the target scaffolds or the assembly was too fragmented, we combined and compared results of tree assembly software. The target scaffolds were further annotated using genewise4 (GeneWise, 2008). Phylogenetic analysis of petF genes from cpDNAs and nuclear genomes of Skeletonema species were analyzed based on peptide sequences using the Maximum Likelihood (ML) method with 1000 bootstrap replicates in megaX (Kumar et al., 2018). The best-fit model was WAG + G selected by Models. petF gene structures were visualized using Gene Structure Display Server (Hu et al., 2015). Four Thalassiosira species were added for comparison: The petF genes of T. pseudonana (EF067921) and T. weissflogii (KJ958485) were encoded in cpDNA, and the petF genes of T. oceanica (EJK54785) and T. rotula (MMETSP0913) were encoded by the nuclear genomes (Roy et al., 2020).
Results
General Characteristics of Chloroplast Genomes
In this study, we constructed complete cpDNAs of six Skeletonema strains (CNS00100, CNS00166, CNS00243, CNS00303, CNS00342, and CNS00438) isolated from Chinese coastal seawaters. These six Skeletonema strains were annotated as S. marinoi, S. tropicum, S. costatum, S. costatum, S. pseudocostatum, and S. grevillei, respectively, based on their morphological features and similarity to corresponding reference molecular markers (Liu et al., 2021). Although CNS00243 and CNS00303 were identified as different Skeletonema species originally, both the strains were proved to be S. costatum by our recent study (Liu et al., 2021). By now, the cpDNA of only a single Skeletonema species, which is S. pseudocostatum, has been constructed (Hamedi et al., 2019). The cpDNAs of all Skeletonema species analyzed in this study showed the typical quadripartite structure in which LSC and SSC regions were separated by a pair of inverted repeats (IRA and IRB) (Figure 1). The sizes of these cpDNAs were very similar, ranging from 126,883 bp (S. grevillei) to 127,353 bp (S. costatum of CNS303 strain) (Table 1). The sizes of LSCs varied from 63,849 bp (S. grevillei) to 64,143 bp (S. costatum of both CNS00243 and CNS00303 strains), the sizes of SSCs varied from 26,508 bp (S. pseudocostatum) to 26,707 bp (S. costatum of CNS303 strain), and the sizes of IRs varied from 18,210 bp (S. grevillei) to 18,252 bp (S. costatum of both CNS00243 and CNS00303 strains). The AT contents of these cpDNAs were also very similar, ranging from 68.42 to 69.29% (Table 1).
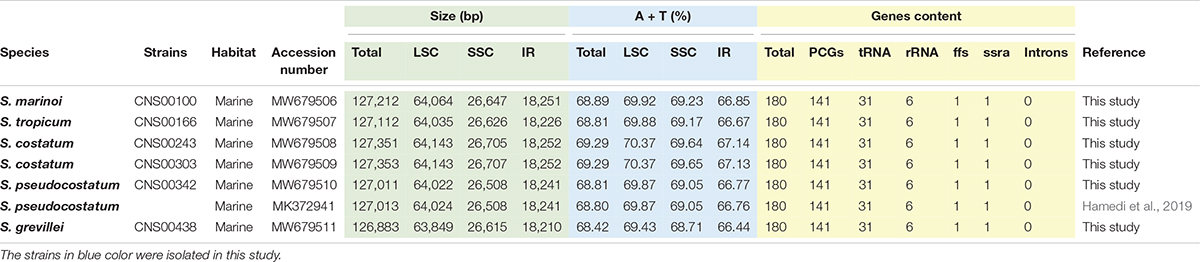
Table 1. The Summary of complete cpDNA feature of the Skeletonema species.
Consistent with the high similarity of genome sizes and AT contents of these Skeletonema species, their gene contents were identical, including 141 PCGs, 31 tRNAs, six rRNAs, one non-coding RNA (ncRNA), and one transfer-messenger RNA (tmRNA) (Table 1). No introns were identified in these six cpDNAs. As expected, the combined lengths corresponding to PCGs were the largest, followed by that corresponding to rRNAs, intergenic spacer regions (ISRs), tRNAs, tmRNAs and ncRNAs (Supplementary Table 3). The sizes of 141 PCGs were rather different, ranging from 90 bp (petN) to 4338 bp (rpoC2) (Figure 2A). The AT contents did not show much differences among these categories (Figure 2B). The nucleotide skew analysis showed that all the Skeletonema cpDNAs exhibited a moderate positive GC-skew (0.0012–0.0047) and a more prominent AT-skew (0.029–0.032) (Figures 2C,D).
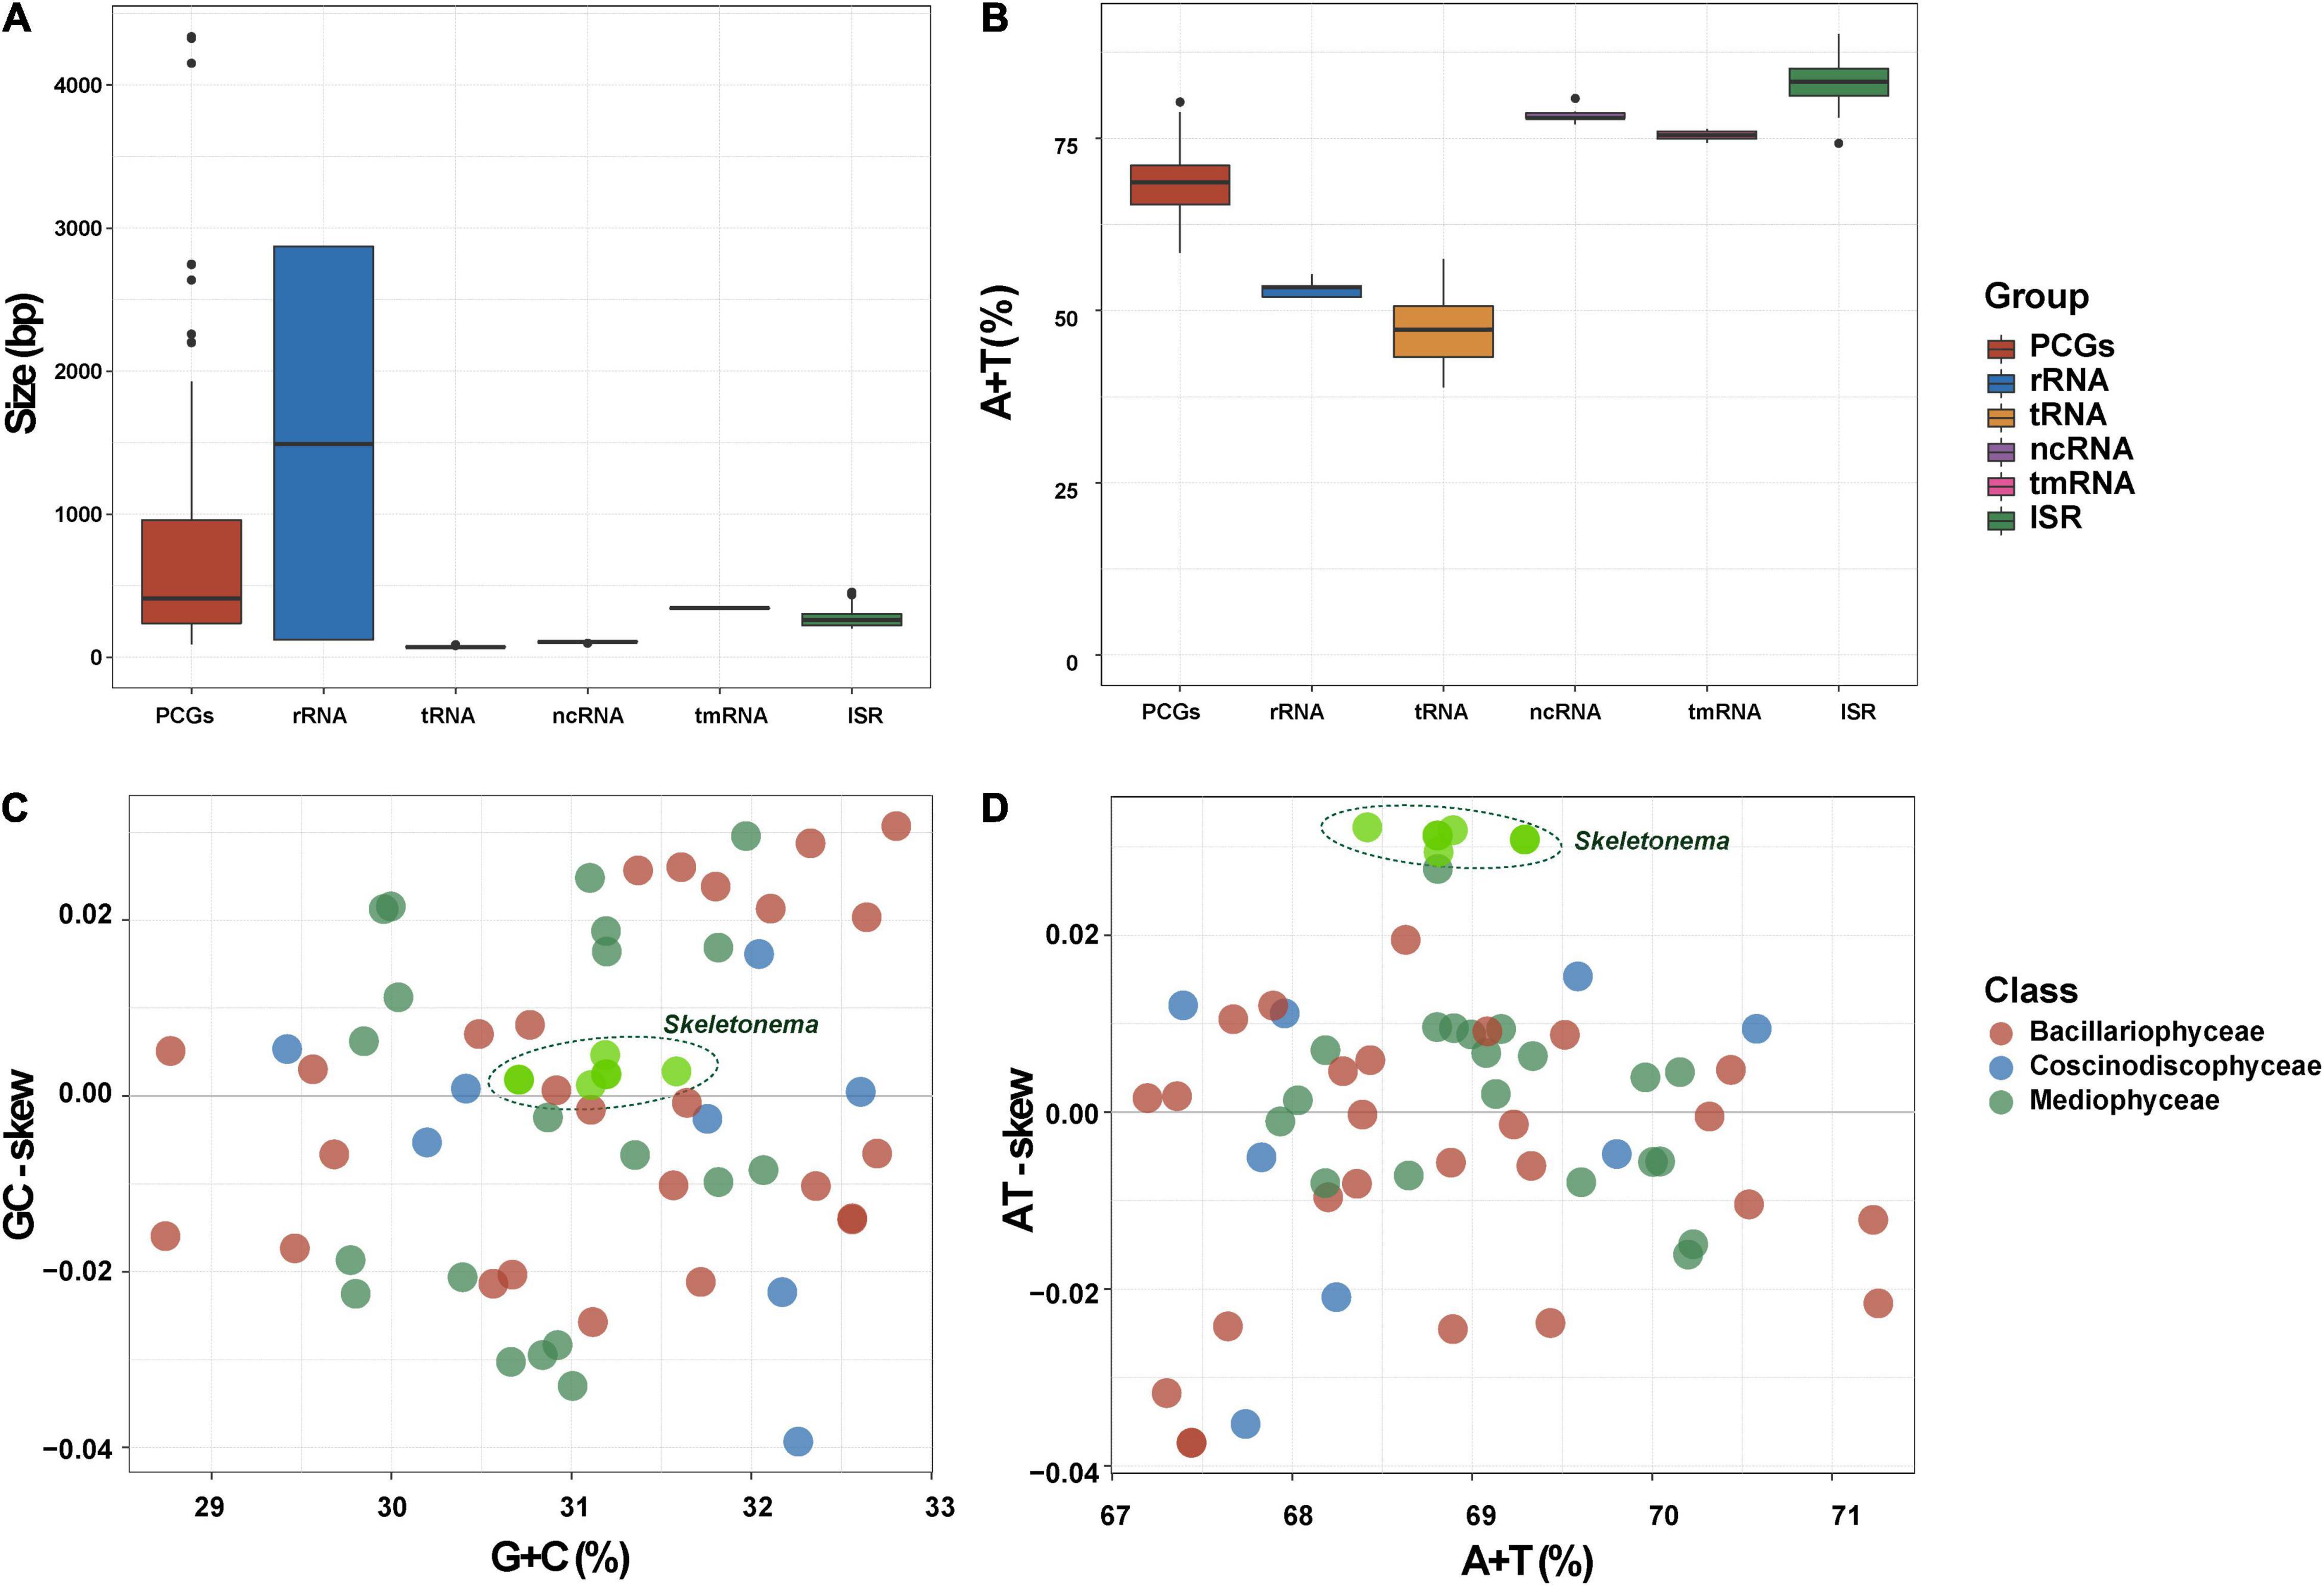
Figure 2. General features of the Skeletonema cpDNAs. (A) Sizes and (B) AT contents of PCG, rRNA, tRNA, ncRNA, tmRNA, and intergenic spacer region (ISR) for the six Skeletonema cpDNAs. (C) Relationships between G + C contents and GC skews, (D) Relationships between A + T contents and AT skews of Skeletonema cpDNAs and other 55 published Bacillariophyta cpDNAs.
Synteny Analysis and Nucleotide Diversity Analysis
Alignment of six Skeletonema cpDNAs using Mauve revealed highly similar gene arrangements (Figure 3A). No expansion or contraction of IR was observed among these Skeletonema cpDNAs (Figure 3B). Sequence identity analysis by mVISTA (Figure 3C) also revealed high similarity across the cpDNAs, with higher conservation observed for PCGs than non-coding regions. The nucleotide diversity exhibited different patterns in the quadripartite structures (Figure 3D), with higher conservation of the IR regions than the LSC and SSC regions.
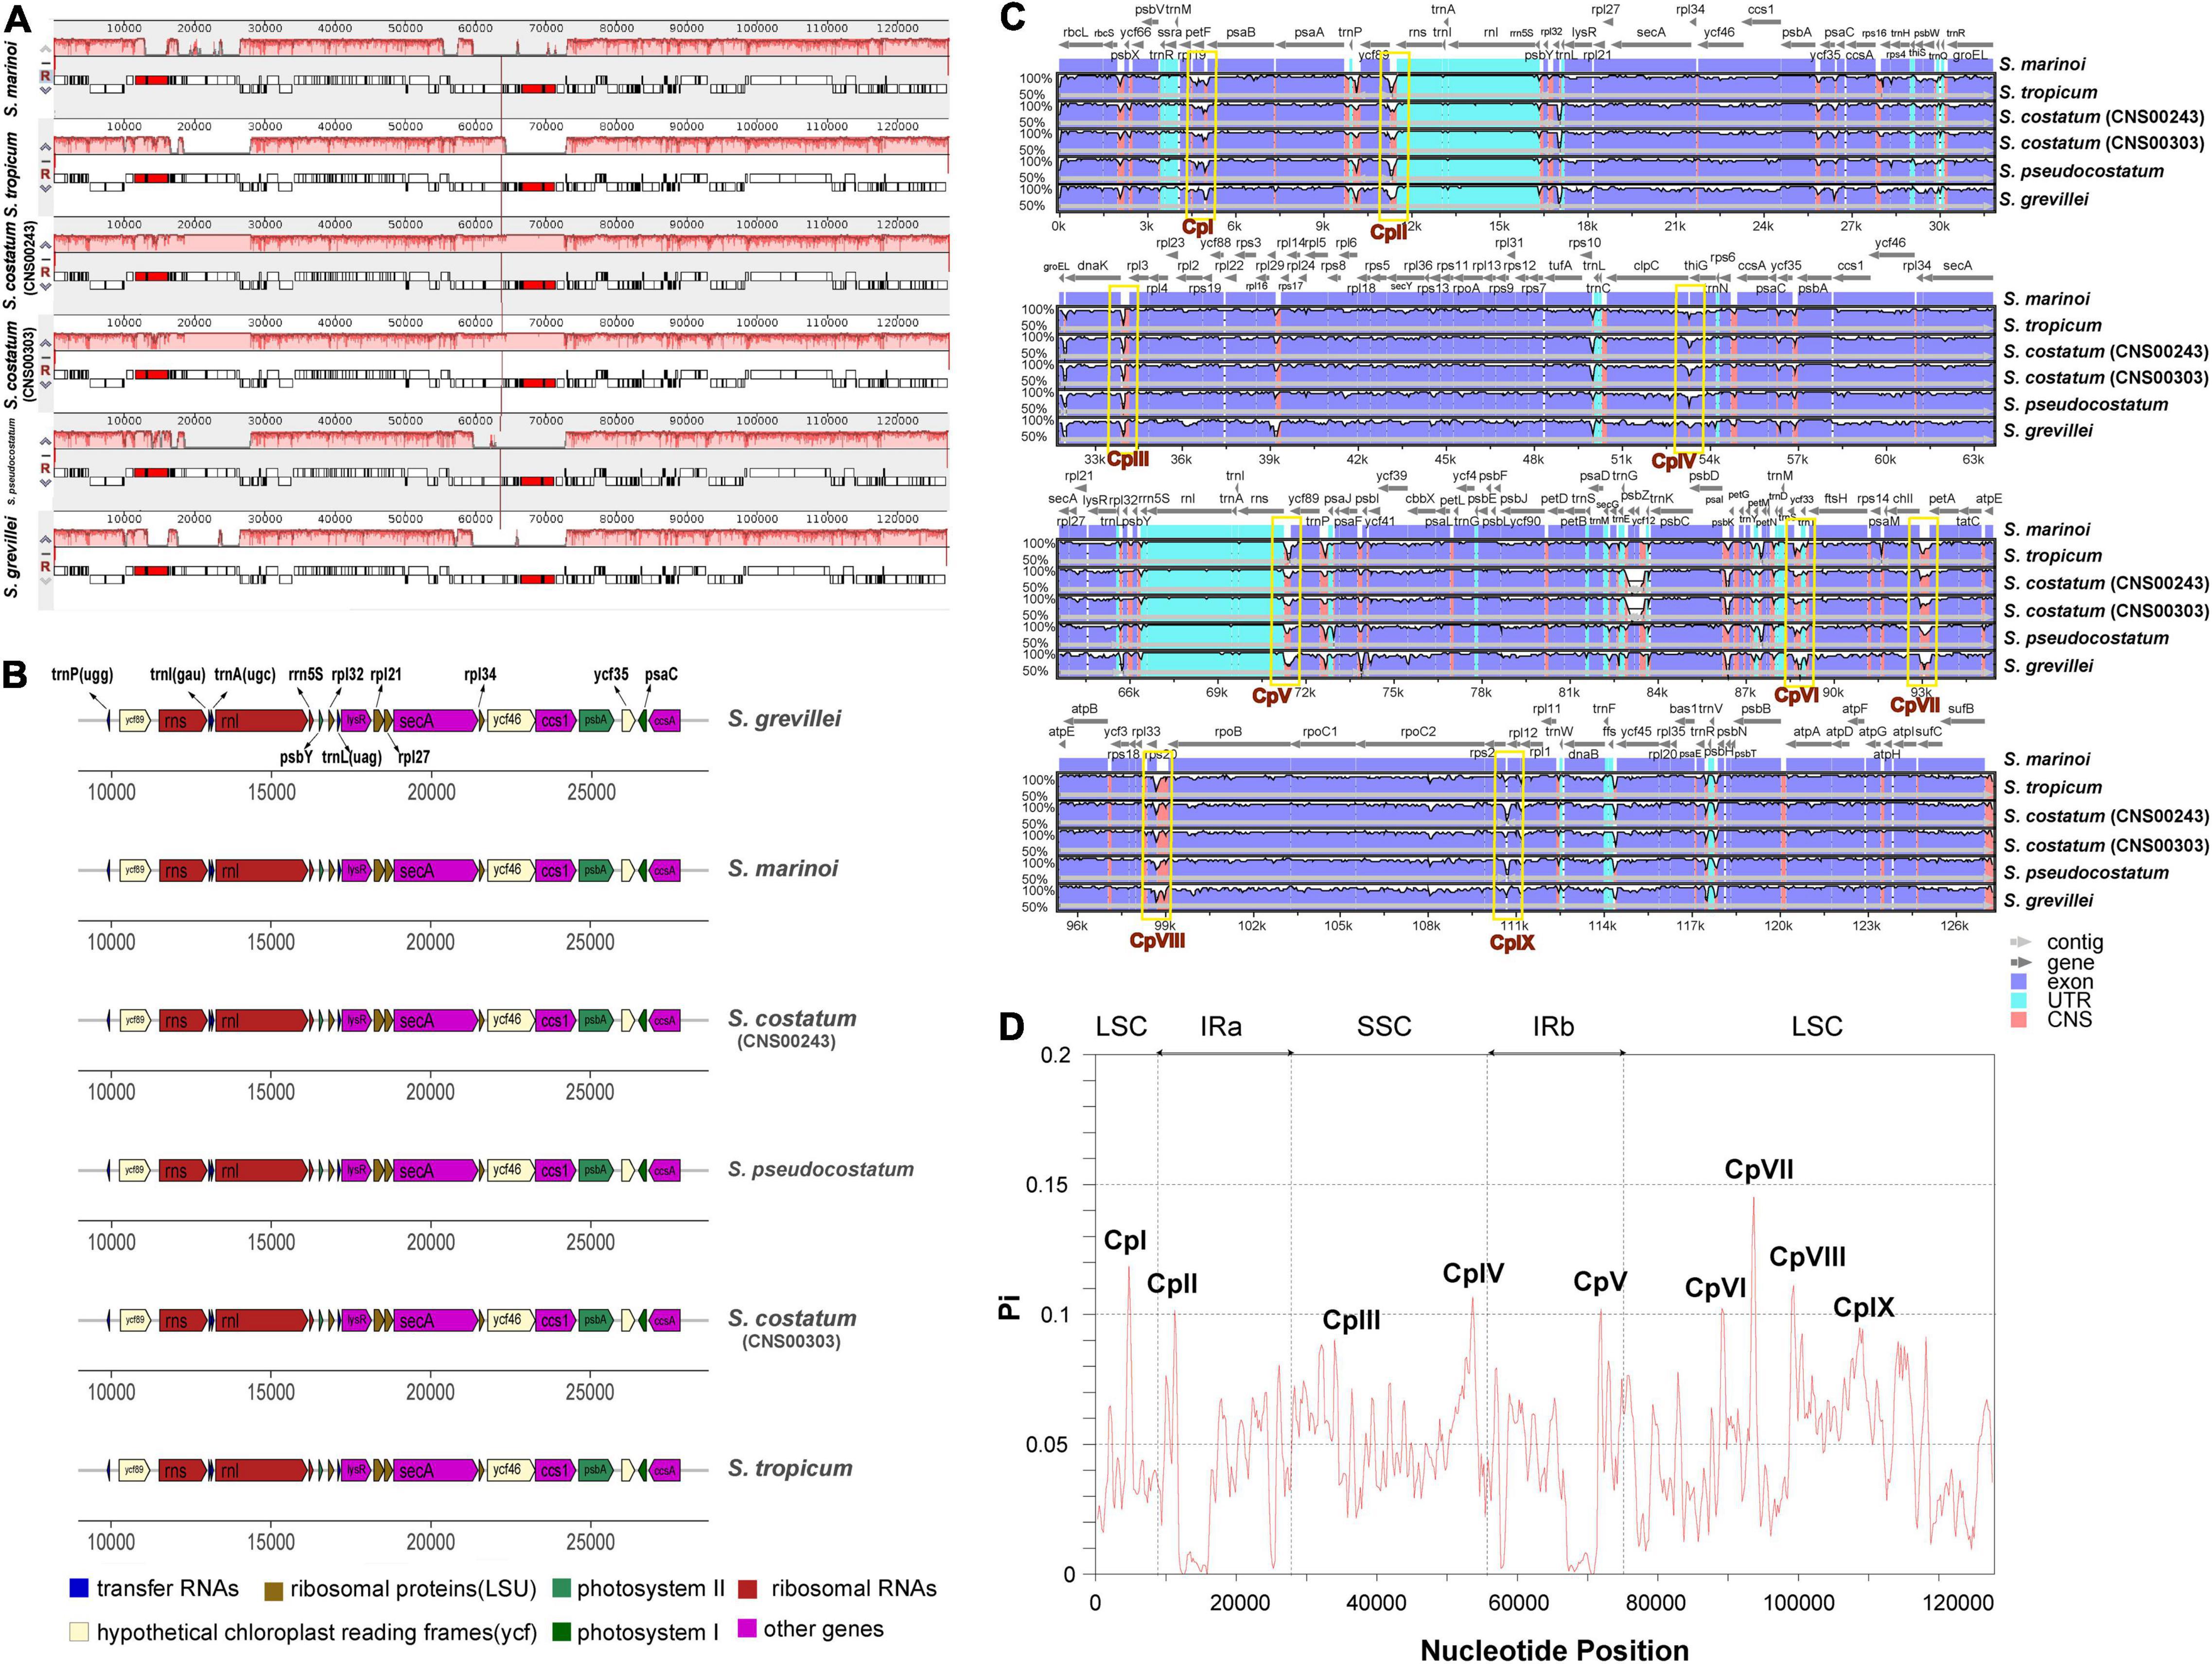
Figure 3. Gene order comparison and the sequence divergence analysis of six Skeletonema chloroplast genomes. (A) Synteny comparison of the six Skeletonema cpDNAs using Mauve analysis. Rectangular blocks of the same color indicate collinear regions. (B) Gene arrangements in the inverted repeats (IR) regions of Skeletonema cpDNAs. The colors of genes are same with that in the Figure 1, indicating the different functional groups. (C) Identity plot comparing the cpDNA of six Skeletonma strains using mVISTA. The S. marinoi cpDNA (MW679506) is selected as the reference sequence. The vertical scale on the left indicated the identity percentages (range shown: 50–100%). The arrow with light gray named contig on the horizontal axis indicate the cpDNAs of Skeletonema. The dark gray arrows above the alignments indicate gene orientation. Genome regions are colored as exon, untranslated region (UTR) and conserved non-coding sequences (CNS). (D) Nucleotide diversity (Pi) of the Skeletonema cpDNA sequences based on sliding window analysis. The window length is 600 bp and the step size is 200 bp. The horizontal axis indicate the position of the midpoint of a window. The vertical axis indicate the nucleotide diversity of each window. The nine regions with great sequence divergence are also shown in the (C,D), named CpI, CpII, to CpIX.
Despite the well-conserved genomic structure, we identified nine regions with enhanced variations based on the sequence divergence analysis (Figures 3C,D). These regions, which were named CpI, CpII, CpIII, CpIV, CpV, CpVI, CpVII, CpVIII and CpIX, located in rpl19 - petF- psaB, ycf89 - rns (IRA), dnaK - rpl3, clpC - thiG - trnN, rns - ycf89 (IRB), ycf33 - trnT, chlI - petA, rpl33 - rps20 - rpoB, rpl12 - rpl1, respectively. The sequences of CpII and CpV regions are identical because they are symmetrically arranged in the IR. To evaluate the divergence of the nine regions, we carried out phylogenetic analysis of these DNA sequences, which showed that these nine regions could all successfully separate all five Skeletonema species (Figure 4A). Thus, all of these divergent regions can be used as specific molecular markers for distinguishing different Skeletonema species (Figures 4B,C). To test this idea, we have designed primers for amplifying the CpIII region and have successfully amplified this region in all strains (Supplementary Figure 1 and Table 1).
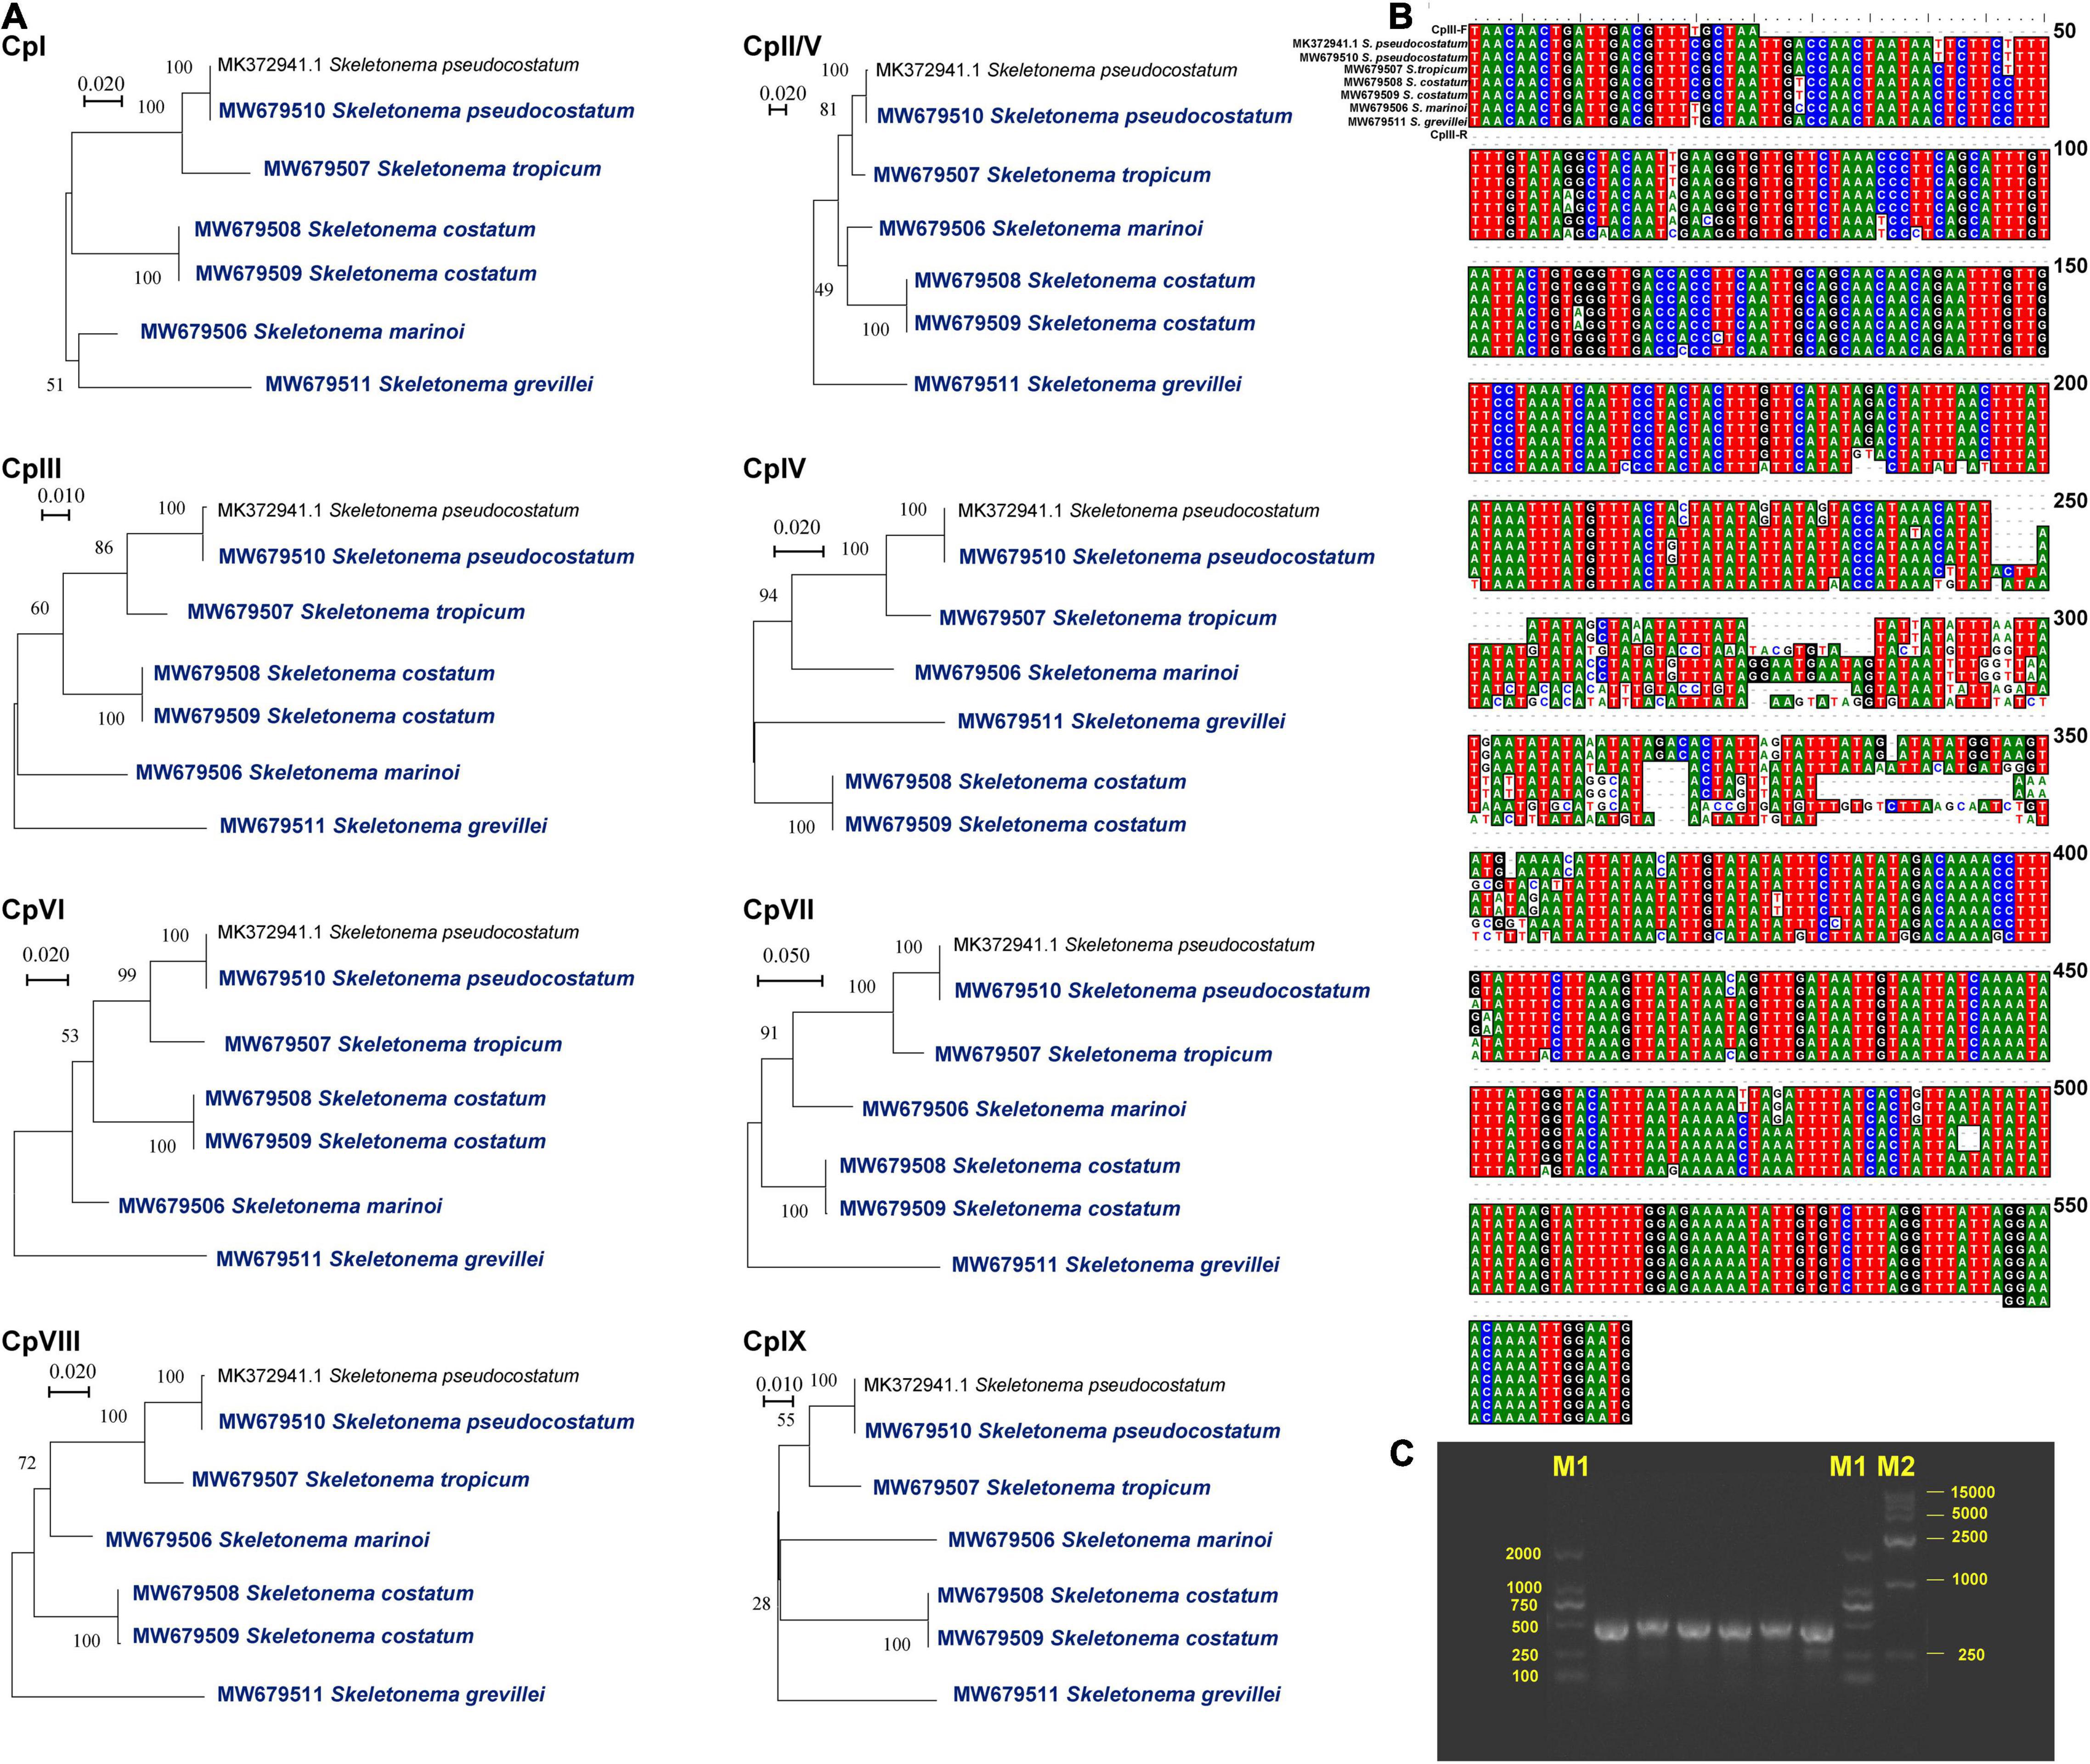
Figure 4. Nine suitable regions were suitable as barcodes or molecular markers. (A) Phylogenetic analysis of the nine regions among Skeletonema species. DNA alignment information (B) and agarose gels image of PCR products (C) for CpIII region among the Skeletonema species. The bands sequences are S. marinoi, S. tropicum, S. costatum (CNS00243 strain), S. costatum (CNS00303 strain), S. pseudocostatum, and S. grevillea, respectively. The bands of Marker M1 and M2 are shown on both sides. The sequence of CpII region is equal to the CpV region.
Phylogenetic Analysis of Skeletonema Species
To explore the evolutionary relationships of Skeletonema among the Bacillariophyta species, the phylogenetic tree was constructed using a set of 86 chloroplast PCGs shared by 62 cpDNAs (Figure 5). The phylogenetic tree showed the species in Bacillariophyta were divided into three distinct taxa, which generally corresponded to three classes Bacillariophyceae, Mediophyceae and Coscinodiscophyceae with one exception. Leptocylindrus danicus split from other species at the base of the phylogenetic tree and clustered with Coscinodiscophyceae species, suggesting that it was a member of the class Coscinodiscophyceae (Figure 5). This annotation of L. danicus was consistent with the previous study (Yu et al., 2018), but was inconsistent with Algaebase (Guiry and Guiry, 2021), which indicated that this species belonged to the class Mediophyceae. Astrosyne radiata (MG755807) belonging to Bacillariophyceae was found to have the longest branch, which was consistent with the previous study (Yu et al., 2018) and also reported A. radiata exhibited a high level of gene order rearrangement.
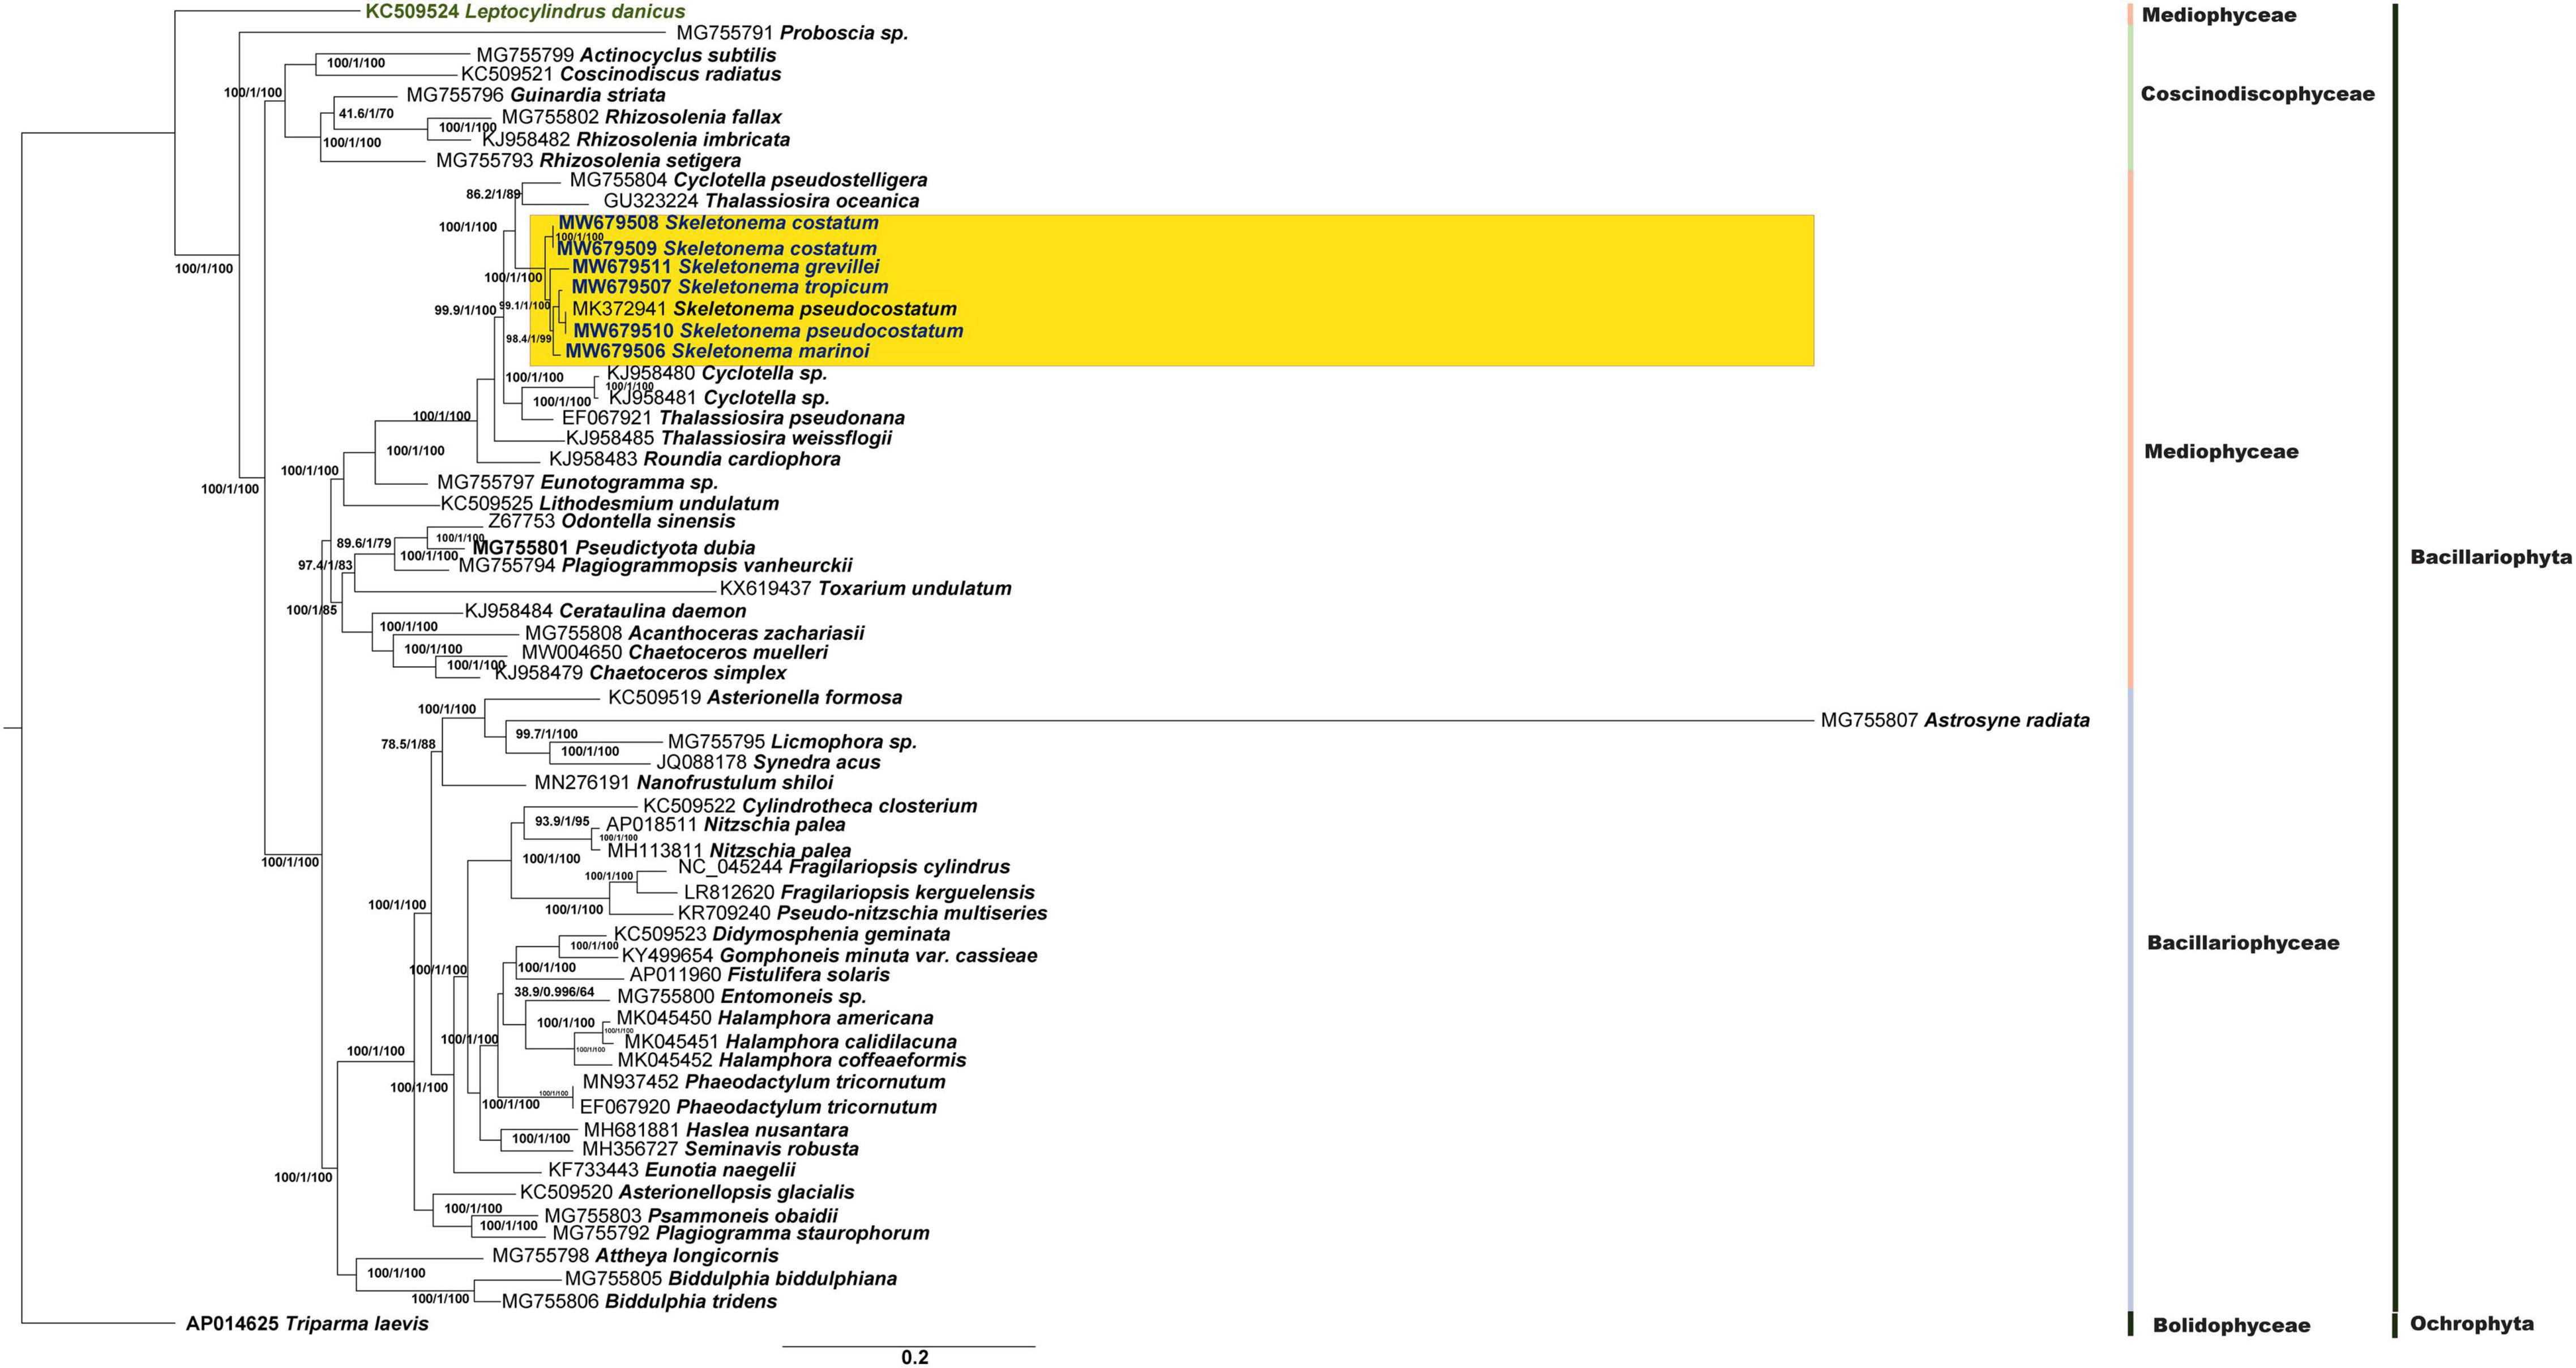
Figure 5. Phylogenetic tree based on concatenated amino acid sequences of 86 chloroplast PCGs. The six Skeletonema strains (in blue color) and other 55 Bacillariophyta species, which have been reported the cpDNAs, are included. Triparma laevis is used as outgroup taxa.
As expected, Skeletonema species clustered together and formed a monophyletic group close to Thalassiosira species. Within Skeletonema, the two S. costatum strains (MW679508 and MW679509) formed an independent clade, which was sister to the rest of the Skeletonema species with 100% bootstrap support. The two S. pseudocostatum strains (MW679510 and MK372942), which were isolated from China and Algeria, respectively, clustered together as expected. The clade of S. pseudocostatum and S. tropicum clustered with the S. marinoi (MW679506). The clade including S. pseudocostatum, S. tropicum and S. marinoi was a sister to the clade with a single species: S. grevillei (MW679511).
Selection Analysis and SSR Analysis of the Skeletonema cpDNAs
The pairwise substitution rates (Ka/Ks) between the Skeletonema species were calculated using PCGs of cpDNA. In this study, the Ka/Ks ratio for all PCGs of all pairwise species comparison was below 1 (Supplementary Figure 2), suggesting purifying selection. Interestingly, the rbcL and rbcS genes encoding to RubisCO subunit showed higher Ka/Ks ratio than genes belonging to other functional groups.
The distributions of SSRs among Skeletonema cpDNAs were analyzed using MISA (Supplementary Table 4). The lengths of SSRs ranged from 10 bp to 22 bp. Most SSRs are A/T type rather than the G/C type. Among the six detected categories, the most abundant were tetra-nucleotide repeats for all Skeletonema cpDNAs, accounting for 33.33% (S. marinoi)–41.38% (S. costatum). The penta-nucleotide repeat was only found in the cpDNAs of S. costatum. The number of SSRs located in the ISRs (52.17–63.89%) was slightly higher than that located within the genes (36.11–47.83%). Among the quadripartite structure of Skeletonema cpDNAs, SSRs were mainly located in the LSC regions (47.83–53.33%). We found that there was one more SSR (i.e., tetra-nucleotide repeat) in the S. pseudocostatum cpDNA (MW679510) of the Chinese strain than that in S. pseudocostatum cpDNA (MK372941) of the Algerian strain.
Divergence Time Estimation Based on the cpDNAs
The divergence times of Skeletonema species was estimated based on 96 PCGs shared by cpDNAs of 33 species (Figure 6). The divergence time of the Skeletonema genus, which formed an independent clade apart from the Thalassiosira genus, was estimated to be 46 Million years ago (Mya; 95% HPD: 32.50–59.23 Mya). Within the Skeletonema genus, S. grevillei diverged from other Skeletonema species around 33 Mya (95% HPD: 18.54–47.83 Mya). The two HAB species S. marinoi and S. pseudocostatum diverged approximately 16 Mya (95% HPD 5.66–29.85 Mya).
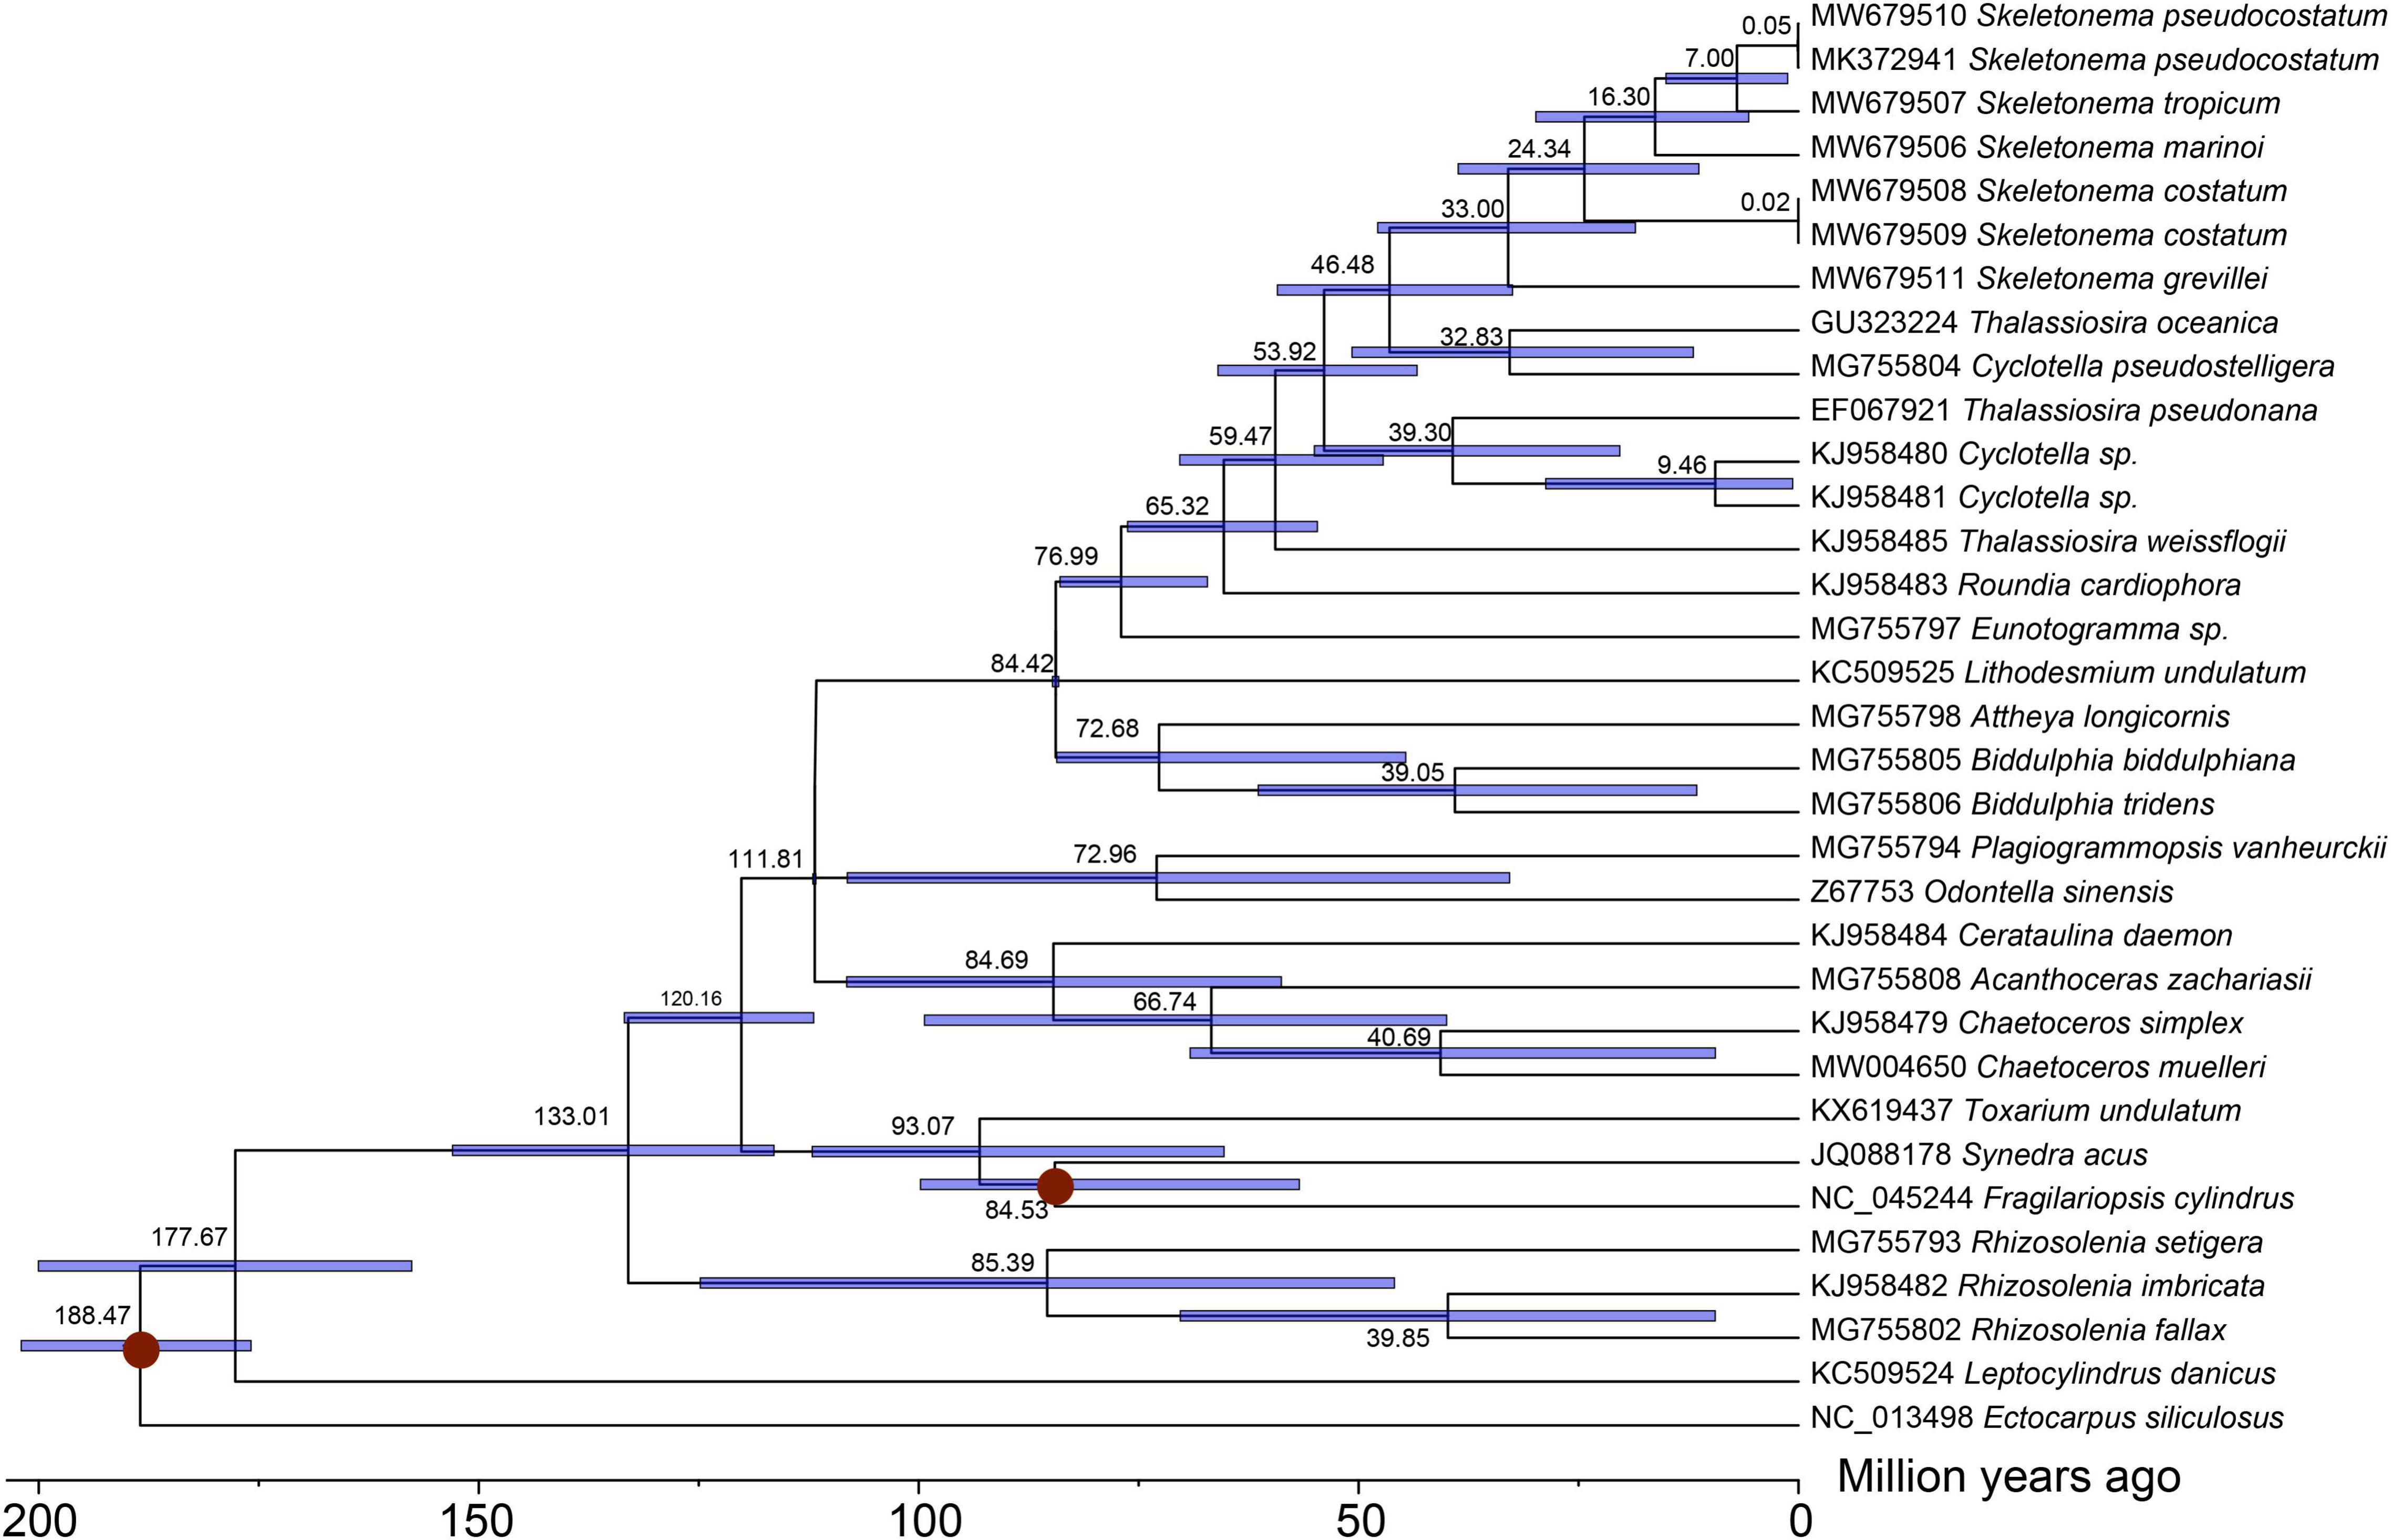
Figure 6. Time-calibrated phylogeny of 33 diatom taxa based on 96 chloroplast genes with PAML. The red dots represented calibration point and translucent blue bars represented the 95% highest posterior density interval of each node ages.
Co-existence of Two Copies of petF in Skeletonema Species
The cpDNA gene petF has been frequently found to be transferred from cpDNA to nuclear genomes in diatom species (Lommer et al., 2010; Roy et al., 2020). The transfer of petF has been proposed as a molecular mechanism underlying iron intake efficacy (Strzepek and Harrison, 2004). A copy of the petF gene was found in each of the Skeletonema cpDNA (Figure 7A). However, gene annotation of assembled nuclear genomes of all five Skeletonema species revealed that the petF genes were also found in all of these Skeletonema nuclear genomes (Figure 7A), suggesting that petF gene transfer did occur in evolution. A typical signal peptide was found at the N-terminal of each nuclear petF-encoded peptide, suggesting their role in chloroplast (Figure 7B). Phylogenetic analysis of petF genes found in the cpDNAs and nuclear genomes uncovered that all cpDNA-encoded petF genes clustered together in one clade (including T. pseudonana and T. weissflogii), while nuclear petF gene clustered together in another clade (including T. oceanica and T. rotula) (Figure 7B), suggesting that the transfer of petF gene occurred before the speciation of these Skeletonema species.
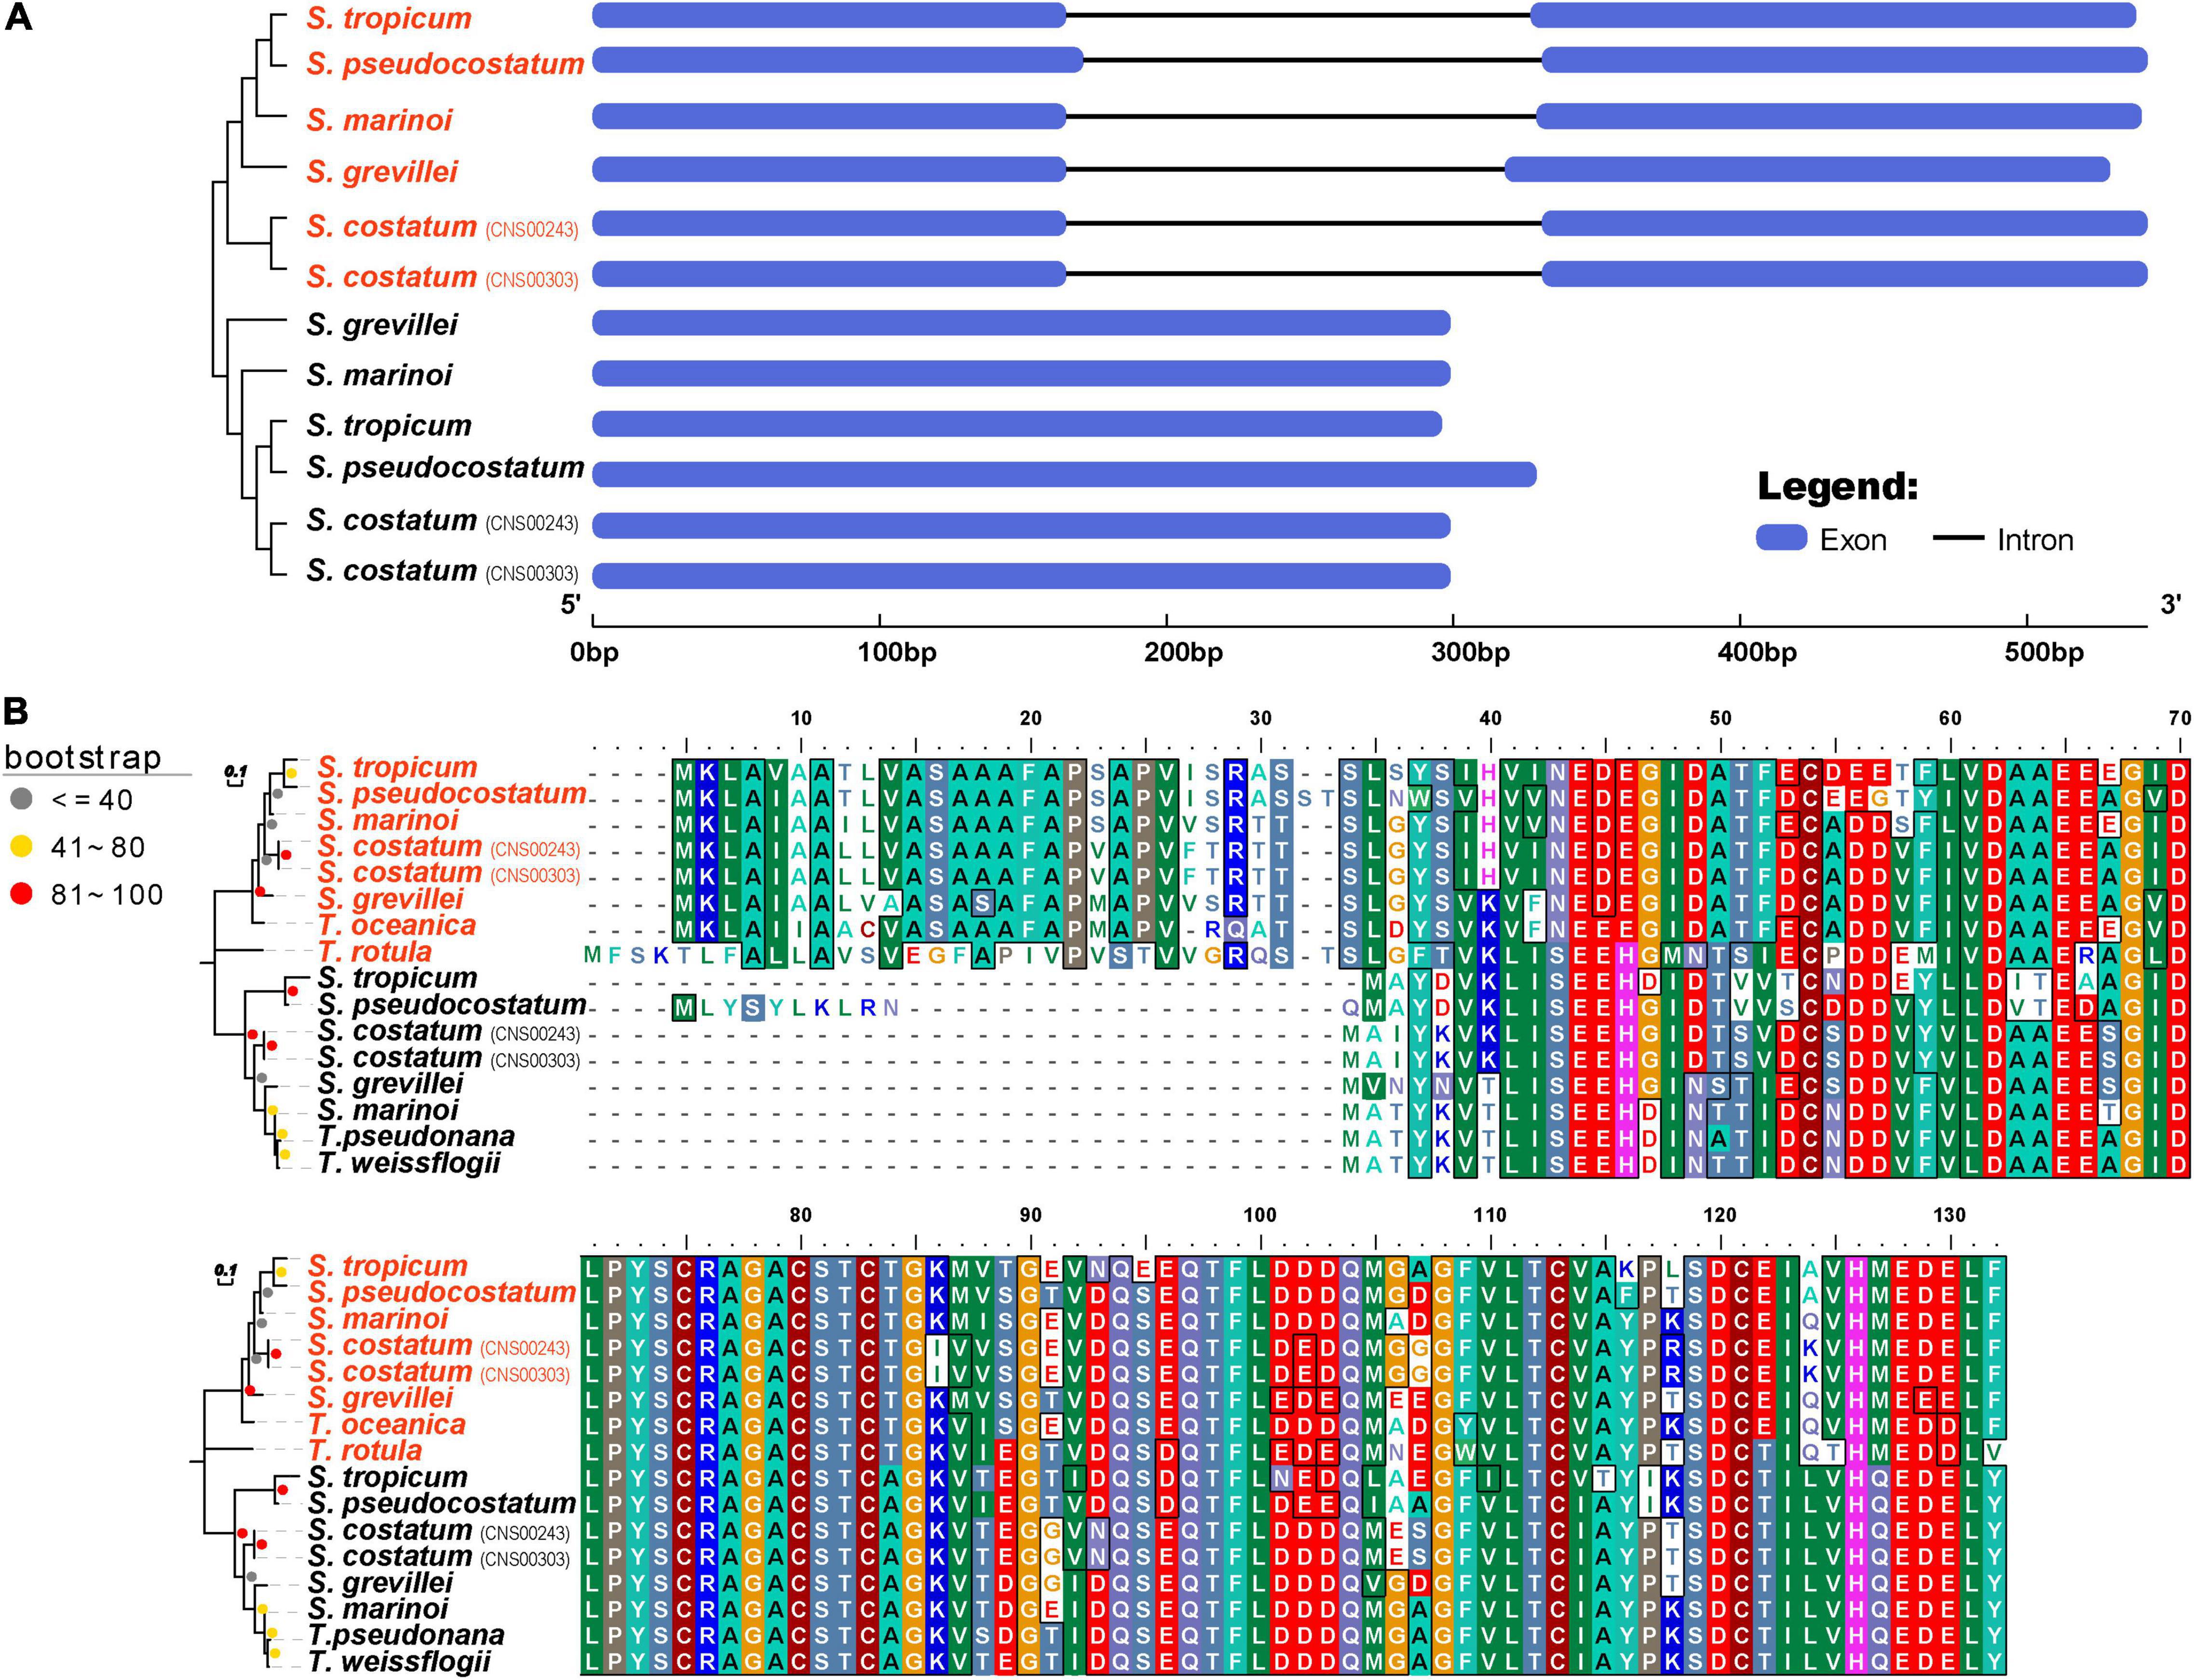
Figure 7. The characteristics of petF gene among Skeletonema species. (A) The phylogenetic analysis and genetic structure and (B) the alignment of amino acid sequences. Four Thalassiosira species are added for comparison. The petF genes of Skeletonema strains in red are identified from nuclear genome and these in black are identified from cpDNAs.
Discussion
Skeletonema species have been attracting extensive attention because they frequently dominate the phytoplankton composition along the coastal regions and play important role in primary production. Members of Skeletonema species, such as S. marinoi, S. costatum and S. pseudocostatum, can cause blooms with negative impact on environment. While the cpDNA sequences have been proven to be informative for genetic diversity evaluation, cpDNA of only a single species S. pseudocostatum has been constructed.
Conserved cpDNAs and Sequence Divergence Analysis Among Skeletonema Species
In this study, we reported cpDNAs of five Skeletonema species, S. marinoi, S. tropicum, S. costatum (with two strains), S. pseudocostatum and S. grevillei, increasing the number of cpDNAs of Skeletonema species from one to five. These cpDNAs showed remarkable similarities in sizes (Table 1), gene composition, and gene organization (Figures 1, 3). In contrast, cpDNAs of other intra-genus species belonging to the Bacillariophyceae class showed great difference. For example, the cpDNAs of three Halamphora species were not conserved, i.e., cpDNAs size (difference up to 28,811 bp), gene order (inversion and translocation), and gene contents (presence/absence of serC and tryC) (Hamsher et al., 2019).
Among the previously reported cpDNAs of 55 Bacillariophyta species, the sizes varied greatly, ranging from 111,539 bp (KR709240, Pseudo-nitzschia multiseries) to 201,816 bp (MG755792, Plagiogramma staurophorum). Comparative analysis of these cpDNAs revealed that the main factors contributing to variation of cpDNAs sizes included expansion or contraction of IR regions, gene loss or gain, presence or absence of introns and the length of ISR (Sabir et al., 2014; Yu et al., 2018). The largest cpDNA size of P. staurophorum so far discovered was mainly due to the expansion of IR regions (34,888 bp) and a large intron (2971 bp) in petD gene (Yu et al., 2018). During evolution, the IR regions have expanded and contracted under various stress condition. It was found that the large sizes of cpDNAs in the order of Thalassiosirales species were mainly contributed by the large size of IR regions (Sabir et al., 2014). The sizes of Skeletonema cpDNAs were above average among the reported Bacillariophyta cpDNAs and the lengths of IR regions were above 18,000 bp, which were congruent with the previous study (Sabir et al., 2014).
Loss of genes in the Thalassiosirales order including petF, petJ, acpP1, ilvB, ilvH, tsf, syfB, serC, syfB, and tyrC from cpDNAs had been previously reported (Ruck et al., 2014; Sabir et al., 2014; Yu et al., 2018). Analysis of cpDNAs of the five Skeletonema species confirmed that all of these genes except petF were lost from the cpDNAs of these five Skeletonema species. The petF gene was identified in the cpDNA of all five Skeletonema species. The loss of petF was found to be caused by the transfer of this gene from chloroplast to nucleus in many species including T. oceanica, which may play a role in iron utilization (Lommer et al., 2010; Roy et al., 2020). Interestingly, copies of the petF genes were also identified in the nuclear genomes of these five Skeletonema species (Figure 7), indicating that each of these five Skeletonema species harbor at least two copies of petF. The nuclear-encoded petF genes of five Skeletonema species clustered together in the phylogenetic tree and had one intron in each gene structure (Figure 7), suggesting that petF gene transfer from cpDNA to nuclear genome took place before the diversification of these Skeletonema species, and intron in the nuclear-encoded petF gene had already formed in their common ancestor.
Despite of the high synteny and conserved structure among Skeletonema cpDNAs, nine regions with enhanced divergences were detected. These regions with enhanced divergences were proved to be suitable as molecular markers for distinguishing Skeletonema species.
Simple sequence repeats can be highly variable at the intra-specific level and were often used as genetic markers in the population genetics studies (Kaur et al., 2015). The SSRs in cpDNAs of the seven Skeletonema taxa (including S. pseudocostatum of Algerian strain) represented abundant variation, especially for the same species (S. pseudocostatum) isolated from different seawaters. Thus, they are useful for detecting genetic polymorphisms among Skeletonema species.
Phylogeny and Selection Patterns Within Skeletonema cpDNAs
Phylogenetic tree based on the concatenated amino acid sequences of 86 shared cpDNA PCGs of 62 species showed that Skeletonema species formed an independent clade (Figure 5). The phylogenetic analysis supported that S. pseudocostatum and S. tropicum could clustered into sister clade in agreement with the topology in recent studies using 18S rDNA, 28S rDNA, and cox1 gens (Kooistra et al., 2008; Yamada et al., 2017). However, the topologies of the phylogenetic trees were not identical, the tree using the cpDNA PCGs obtained in this study was very similar with the tree based on 28S rDNA (Kooistra et al., 2008; Yamada et al., 2017), and was almost identical with the cox1 tree (except the positions of S. costatum and S. grevillei) (Liu et al., 2021), but was different from the tree based on 18S rDNA (Yamada et al., 2017), confirming that these different genes can have incongruent histories.
Pairwise substitution rate (Ka/Ks) between cpDNAs of Skeletonema species was below 1, indicating all the PCGs of cpDNAs were under purifying selection. The purifying selection was also found in similar analysis performed in other species, such as Dracunculus (Abdullah et al., 2021) and Lagerstroemia (Xu et al., 2017).
Skeletonema Species Divergence Time Estimation Based on cpDNAs
The Skeletonema species were nested within the paraphyletic genus Thalassiosira as supported by previous studies (Sorhannus, 2007; Alverson, 2014; Roy et al., 2020). The Skeletonema species diverged from Thalassiosira oceanica (the nearest species in Figure 6) approximately 46 Mya in the Eocene period, which was slightly later than that estimated using two nuclear genes and two plastid genes (about 55 Mya) (Alverson, 2014). The two HAB species S. marinoi and S. pseudocostatum diverged approximated 16 Mya (95% HPD 5.66–29.85 Mya), which was consistent with results estimated previously using 18S rDNA (about 14 Mya) (Sorhannus, 2007). The divergence time estimated in this study among Skeletonema species was generally similar or slight large than that estimated based on the mtDNA PCGs, indicating the clock rate was similar across the two organelles (Liu et al., 2021). This study provided the divergence time among the Skeletonema species based on the cpDNAs for the first time.
Conclusion
In this study, we constructed complete cpDNAs for five Skeletonema species (two strains for S. costatum), including cpDNAs of four Skeletonema species for the first time. Comparative analysis of the cpDNA sizes, structure, gene number and gene arrangement showed high similarity among Skeletonema species. Variations of the IR regions among Skeletonema cpDNAs was low, suggesting the IR regions were highly conserved for cpDNAs of Skeletonema species, compared with those of other genera, such as the genus Thalassiosira. Nine regions with enhanced sequence divergence were obtained, which could be used to distinguish Skeletonema species. The PCGs of cpDNAs exhibited depressed Ka/Ks ratios, suggesting that their genes had experienced strong purifying selection to eliminate deleterious mutations. Further information from the whole genome data of Skeletonema species is needed to explore their ecological adaptability of different seawaters.
Data Availability Statement
The datasets presented in this study can be found in online repositories. The names of the repository/repositories and accession number(s) can be found below: The sequencing results (raw data) have been submitted to NCBI and the BioProject number is PRJNA695365. The cpDNAs of six Skeletonema strains have been submitted to NCBI and the accession numbers were MW679506–MW679511.
Author Contributions
NC conceived of the study. YZ helped the sampling from the Jiaozhou Bay. SL, KL, and QX performed analysis. SL and NC interpreted the data and wrote the manuscript. All authors contributed to the editing and gave final approval for publication.
Funding
This work was supported by the Strategic Priority Research Program of Chinese Academy of Sciences (XDB42000000), the Natural Science Foundation of China (41906118), the Chinese Academy of Sciences Pioneer Hundred Talents Program (to NC), the Taishan Scholar Project Special Fund (to NC), the Qingdao Innovation and Creation Plan (Talent Development Program - 5th Annual Pioneer and Innovator Leadership Award to NC, 19-3-2-16-zhc), and the National Key Research and Development Program of China (2017YFC1404300).
Conflict of Interest
The authors declare that the research was conducted in the absence of any commercial or financial relationships that could be construed as a potential conflict of interest.
Publisher’s Note
All claims expressed in this article are solely those of the authors and do not necessarily represent those of their affiliated organizations, or those of the publisher, the editors and the reviewers. Any product that may be evaluated in this article, or claim that may be made by its manufacturer, is not guaranteed or endorsed by the publisher.
Acknowledgments
We are grateful to colleagues from the Jiaozhou Bay Marine Ecosystem Research Station for the opportunity to participate in the investigation expeditions and for their help with field sampling. We are also thankful to the open research cruise (NORC2019-01, NORC2019-03-02, and NORC2019-07) supported by the NSFC shiptime sharing Project (41849901, U1606404, and 41849007).
Supplementary Material
The Supplementary Material for this article can be found online at: https://www.frontiersin.org/articles/10.3389/fpls.2021.774617/full#supplementary-material
Footnotes
- ^ https://github.com/BFL-lab/Mfannot
- ^ https://www.ncbi.nlm.nih.gov/orffinder/
- ^ http://tree.bio.ed.ac.uk/software/figtree/
- ^ https://www.ebi.ac.uk/Tools/psa/genewise/
References
Abdullah Henriquez, C. L., Mehmood, F., Hayat, A., Sammad, A., Waseem, S., et al. (2021). Chloroplast genome evolution in the Dracunculus clade (Aroideae, Araceae). Genomics 113, 183–192. doi: 10.1016/j.ygeno.2020.12.016
Alverson, A. J. (2014). Timing marine–freshwater transitions in the diatom order Thalassiosirales. Paleobiology 40, 91–101. doi: 10.1666/12055
Armbrust, E. V. (2009). The life of diatoms in the world’s oceans. Nature 459, 185–192. doi: 10.1038/nature08057
Armbrust, E. V., Berges, J. A., Bowler, C., Green, B. R., Martinez, D., Putnam, N. H., et al. (2004). The genome of the diatom thalassiosira pseudonana: ecology, evolution, and metabolism. Science 306, 79–86. doi: 10.1126/science.1101156
Bankevich, A., Nurk, S., Antipov, D., Gurevich, A. A., Dvorkin, M., Kulikov, A. S., et al. (2012). SPAdes: a new genome assembly algorithm and its applications to single-cell sequencing. J. Comput. Biol. 19, 455–477. doi: 10.1089/cmb.2012.0021
Beier, S., Thiel, T., Münch, T., Scholz, U., and Mascher, M. (2017). MISA-web: a web server for microsatellite prediction. Bioinformatics 33, 2583–2585. doi: 10.1093/bioinformatics/btx198
Capella-Gutierrez, S., Silla-Martinez, J., and Gabaldon, T. (2009). trimAl: a tool for automated alignment trimming in large-scale phylogenetic analyses. Bioinformatics 25, 1972–1973.
Cui, Z., Xu, Q., Gibson, K., Liu, S., and Chen, N. (2021). Metabarcoding analysis of harmful algal bloom species in the Changjiang Estuary, China. Sci. Total Environ. 782:146823. doi: 10.1016/j.scitotenv.2021.146823
Darling, A., Mau, B., and Perna, N. (2010). progressiveMauve: multiple genome alignment with gene gain, loss and rearrangement. Plos One 5:e11147. doi: 10.1371/journal.pone.0011147
Frazer, K., Pachter, L., Poliakov, A., Rubin, E., and Dubchak, I. (2004). VISTA: computational tools for comparative genomics. Nucleic Acids Res. 32, W273–W279. doi: 10.1093/nar/gkh458
Garg, S. G., and Gould, S. B. (2016). The role of charge in protein targeting evolution. Trends Cell Biol. 26, 894–905. doi: 10.1016/j.tcb.2016.07.001
GeneWise (2008). GeneWise in Encyclopedia of Genetics, Genomics, Proteomics and Informatics. Dordrecht: Springer, 783–783.
Godhe, A., McQuoid, M. R., Karunasagar, I., Karunasagar, I., and Rehnstam-Holm, A. S. (2006). Comparison of three common molecular tools for distinguishing among geographically separated clones of the diatom Skeletonema marinoi Sarno et Zingone (bacillariophyceae). J. Phycol. 42, 280–291. doi: 10.1111/j.1529-8817.2006.00197.x
Gould, S. B., Waller, R. F., and McFadden, G. I. (2008). Plastid evolution. Annu. Rev. Plant Biol. 59, 491–517. doi: 10.1146/annurev.arplant.59.032607.092915
Greiner, S., Lehwark, P., and Bock, R. (2019). OrganellarGenomeDRAW (OGDRAW) version 1.3.1: expanded toolkit for the graphical visualization of organellar genomes. Nucleic Acids Res. 47, W59–W64.
Guillard, R. R. L., and Hargraves, P. E. (1993). Stichochrysis immobilis is a diatom, not a chrysophyte. Phycologia 32, 234–236. doi: 10.2216/i0031-8884-32-3-234.1
Haernstroem, K., Ellegaard, M., Andersen, T. J., and Godhe, A. (2011). Hundred years of genetic structure in a sediment revived diatom population. Proc. Nat. Acad. Sci. USA 108, 4252–4257. doi: 10.1073/pnas.1013528108
Halliwell, B. (1984). Chloroplast metabolism: The structure and function of chloroplasts in green leaf cells. Oxford: Oxford University Press.
Hamedi, C., Gastineau, R., Lemieux, C., Turmel, M., Witkowski, A., and Baba Hamed, M. B. (2019). Complete chloroplast genome of the diatom Skeletonema pseudocostatum from the western mediterranean coast of algeria. Mitochondrial DNA Part B 4, 1091–1092. doi: 10.1080/23802359.2019.1586481
Hamsher, S. E., Keepers, K. G., Pogoda, C. S., Stepanek, J. G., Kane, N. C., and Kociolek, J. P. (2019). Extensive chloroplast genome rearrangement amongst three closely related Halamphora spp. (Bacillariophyceae), and evidence for rapid evolution as compared to land plants. PLoS One 14:e0217824. doi: 10.1371/journal.pone.0217824
Hemaiswarya, S., Raja, R., Kumar, R. R., Ganesan, V., and Anbazhagan, C. (2011). Microalgae: a sustainable feed source for aquaculture. World J. Microbiol. Biotechnol. 27, 1737–1746. doi: 10.1007/s11274-010-0632-z
Hu, B., Jin, J., Guo, A.-Y., Zhang, H., Luo, J., and Gao, G. (2015). GSDS 2.0: an upgraded gene feature visualization server. Bioinformatics 31, 1296–1297. doi: 10.1093/bioinformatics/btu817
Jackman, S. D., Vandervalk, B. P., Mohamadi, H., Chu, J., Yeo, S., Hammond, S. A., et al. (2017). ABySS 2.0: resource-efficient assembly of large genomes using a Bloom filter. Genome Res. 27, 768–777. doi: 10.1101/gr.214346.116
Jin, J.-J., Yu, W.-B., Yang, J.-B., Song, Y., dePamphilis, C. W., Yi, T.-S., et al. (2020). GetOrganelle: a fast and versatile toolkit for accurate de novo assembly of organelle genomes. Genome Biol. 21:21545. doi: 10.1186/s13059-020-02154-5
Johansson, O. N., Töpel, M., Pinder, M. I. M., Kourtchenko, O., Blomberg, A., Godhe, A., et al. (2019). Skeletonema marinoi as a new genetic model for marine chain-forming diatoms. Sci. Rep. 9:5391. doi: 10.1038/s41598-019-41085-5
Kajitani, R., Yoshimura, D., Okuno, M., Minakuchi, Y., Kagoshima, H., Fujiyama, A., et al. (2019). Platanus-allee is a de novo haplotype assembler enabling a comprehensive access to divergent heterozygous regions. Nat. Commun. 10:1702. doi: 10.1038/s41467-019-09575-2
Kalyaanamoorthy, S., Minh, B. Q., Wong, T. K. F., von Haeseler, A., and Jermiin, L. S. (2017). ModelFinder: fast model selection for accurate phylogenetic estimates. Nat. Methods 14, 587–589. doi: 10.1038/nmeth.4285
Katoh, K., and Standley, D. (2013). MAFFT multiple sequence alignment software version 7: improvements in performance and usability. Mol. Biol. Evol. 30, 772–780.
Kaur, S., Panesar, P. S., Bera, M. B., and Kaur, V. (2015). Simple sequence repeat markers in genetic divergence and marker-assisted selection of rice cultivars: a review. Crit. Rev. Food Sci. Nutr. 55, 41–49. doi: 10.1080/10408398.2011.646363
Kim, S.-C., Lee, J.-W., and Choi, B.-K. (2021). Seven complete chloroplast genomes from symplocos: genome organization and comparative analysis. Forests 12:608.
Kooistra, W., Sarno, D., Balzano, S., Gu, H. F., Andersen, R. A., and Zingone, A. (2008). Global diversity and biogeography of Skeletonema species (Bacillariophyta). Protist 159, 177–193. doi: 10.1016/j.protis.2007.09.004
Kumar, S., Stecher, G., Li, M., Knyaz, C., and Tamura, K. (2018). MEGA X: molecular evolutionary genetics analysis across computing platforms. Mol. Biol. Evol. 35, 1547–1549. doi: 10.1093/molbev/msy096
Li, H., and Durbin, R. (2009). Fast and accurate short read alignment with Burrows-Wheeler transform. Bioinformatics 25, 1754–1760. doi: 10.1093/bioinformatics/btp324
Li, H., Handsaker, B., Wysoker, A., Fennell, T., Ruan, J., Homer, N., et al. (2009). The Sequence Alignment/Map format and SAMtools. Bioinformatics 25, 2078–2079. doi: 10.1093/bioinformatics/btp352
Liu, F., and Pang, S. (2016). Chloroplast genome of Sargassum horneri (Sargassaceae, Phaeophyceae): comparative chloroplast genomics of brown algae. J. Appl. Phycol. 28, 1419–1426. doi: 10.1007/s10811-015-0609-2
Liu, S., Gibson, K., Cui, Z., Chen, Y., Sun, X., and Chen, N. (2020). Metabarcoding analysis of harmful algal species in Jiaozhou Bay. Harmful Algae 92:101772. doi: 10.1016/j.hal.2020.101772
Liu, S., Wang, Y., Xu, Q., Zhang, M., and Chen, N. (2021). Comparative analysis of full-length mitochondrial genomes of five Skeletonema species reveals conserved genome organization and recent speciation. BMC Genomics 22:7999. doi: 10.1186/s12864-021-07999-z
Lommer, M., Roy, A.-S., Schilhabel, M., Schreiber, S., Rosenstiel, P., and LaRoche, J. (2010). Recent transfer of an iron-regulated gene from the plastid to the nuclear genome in an oceanic diatom adapted to chronic iron limitation. BMC Genomics 11:718. doi: 10.1186/1471-2164-11-718
Malviya, S., Scalco, E., Audic, S., Vincent, F., Veluchamy, A., Poulain, J., et al. (2016). Insights into global diatom distribution and diversity in the world’s ocean. PNAS 2016, E1516–E1525.
Mohamed, Z. A. (2018). Potentially harmful microalgae and algal blooms in the Red Sea: Current knowledge and research needs. Marine Environ. Res. 140, 234–242. doi: 10.1016/j.marenvres.2018.06.019
Nakov, T., Beaulieu, J. M., and Alverson, A. J. (2018). Accelerated diversification is related to life history and locomotion in a hyperdiverse lineage of microbial eukaryotes (Diatoms, Bacillariophyta). New Phytol. 219, 462–473. doi: 10.1111/nph.15137
Roy, A. S., Woehle, C., and LaRoche, J. (2020). The transfer of the ferredoxin gene from the chloroplast to the nuclear genome is ancient within the paraphyletic genus thalassiosira. Front. Microbiol. 11:523689. doi: 10.3389/fmicb.2020.523689
Rozas, J., Ferrer-Mata, A., Sánchez-DelBarrio, J. C., Guirao-Rico, S., Librado, P., Ramos-Onsins, S. E., et al. (2017). DnaSP 6: DNA sequence polymorphism analysis of large datasets. Mol. Biol. Evol. 34, 3299–3302. doi: 10.1093/molbev/msx248
Ruck, E. C., Nakov, T., Jansen, R. K., Theriot, E. C., and Alverson, A. J. (2014). Serial gene losses and foreign DNA underlie size and sequence variation in the plastid genomes of diatoms. Genome Biol. Evol. 6, 644–654. doi: 10.1093/gbe/evu039
Sabir, J. S., Yu, M., Ashworth, M. P., Baeshen, N. A., Baeshen, M. N., Bahieldin, A., et al. (2014). Conserved gene order and expanded inverted repeats characterize plastid genomes of Thalassiosirales. PLoS One 9:e107854. doi: 10.1371/journal.pone.0107854
Sarno, D., Kooistra, W. H. C. F., Medlin, L. K., Percopo, I., and Zingone, A. (2005). Diversity in the genusskeletonema(bacillariophyceae). ii. an assessment of the taxonomy ofs. costatum-like species with the description of four new species. J. Phycol. 41, 151–176. doi: 10.1111/j.1529-8817.2005.04067.x
Sarno, D., Kooistra, W., Balzano, S., Hargraves, P. E., and Zingone, A. (2007). Diversity in the genus Skeletonema (Bacillariophyceae): III. Phylogenetic position and morphological variability of Skeletonema costatum and Skeletonema grevillei, with the description of Skeletonema ardens sp nov. J. Phycol. 43, 156–170. doi: 10.1111/j.1529-8817.2006.00305.x
Shuya, L., and Nansheng, C. (2021). Advances in biodiversity analysis of phytoplankton and harmful algal bloom species in the Jiaozhou Bay (with English abstract). Marine Sci. 45, 170–188.
Singh, V. K., Mangalam, A. K., Dwivedi, S., and Naik, S. (1998). Primer premier: Program for design of degenerate primers from a protein sequence. Biotechniques 24, 318–319. doi: 10.2144/98242pf02
Smith, S., and Dunn, C. (2008). Phyutility: a phyloinformatics tool for trees, alignments and molecular data. Bioinformatics 24, 715–716.
Song, H., Liu, F., Li, Z., Xu, Q., Chen, Y., Yu, Z., et al. (2020). Development of a high-resolution molecular marker for tracking Phaeocystis globosa genetic diversity through comparative analysis of chloroplast genomes. Harmful Algae 99:101911. doi: 10.1016/j.hal.2020.101911
Sorhannus, U. (2007). A nuclear-encoded small-subunit ribosomal RNA timescale for diatom evolution. Marine Micropaleontol. 65, 1–12. doi: 10.1016/j.marmicro.2007.05.002
Strzepek, R. F., and Harrison, P. J. (2004). Photosynthetic architecture differs in coastal and oceanic diatoms. Nature 431, 689–692. doi: 10.1038/nature02954
Thorvaldsdottir, H., Robinson, J. T., and Mesirov, J. P. (2013). Integrative Genomics Viewer (IGV): high-performance genomics data visualization and exploration. Brief. Bioinform. 14, 178–192. doi: 10.1093/bib/bbs017
Tillich, M., Lehwark, P., Pellizzer, T., Ulbricht-Jones, E., Fischer, A., Bock, R., et al. (2017). GeSeq – versatile and accurate annotation of organelle genomes. Nucleic Acids Res. 45, W6–W11.
Trifinopoulos, J., Nguyen, L. T., von Haeseler, A., and Minh, B. Q. (2016). W-IQ-TREE: a fast online phylogenetic tool for maximum likelihood analysis. Nucleic Acids Res. 44, W232–W235. doi: 10.1093/nar/gkw256
Wang, D., Zhang, Y., Zhang, Z., Zhu, J., and Yu, J. (2010). KaKs_Calculator 2.0: a toolkit incorporating gamma-series methods and sliding window strategies. Genomics Proteomics Bioinform. 8, 77–80. doi: 10.1016/S1672-0229(10)60008-3
Wang, Y., Chen, Y., Wang, J., Liu, F., and Chen, N. (2021). Mitochondrial genome of the harmful algal bloom species Odontella regia (Mediophyceae, Bacillariophyta). J. Appl. Phycol. 2021:23641. doi: 10.1007/s10811-020-02364-1
Xu, C., Dong, W., Li, W., Lu, Y., Xie, X., Jin, X., et al. (2017). Comparative analysis of six lagerstroemia complete chloroplast genomes. Front. Plant Sci. 8:15. doi: 10.3389/fpls.2017.00015
Yamada, M., Otsubo, M., Tsutsumi, Y., Mizota, C., Nakamura, Y., Takahashi, K., et al. (2017). Utility of mitochondrial-encoded cytochrome c oxidase I gene for phylogenetic analysis and species identification of the planktonic diatom genus Skeletonema. Phycol. Res. 65, 217–225. doi: 10.1111/pre.12179
Yang, Z. H. (2007). PAML 4: Phylogenetic analysis by maximum likelihood. Mol. Biol. Evol. 24, 1586–1591. doi: 10.1093/molbev/msm088
Yu, M., Ashworth, M. P., Hajrah, N. H., Khiyami, M. A., Sabir, M. J., Alhebshi, A. M., et al. (2018). Evolution of the plastid genomes in diatoms. Plastid. Genome Evol. 85, 129–155. doi: 10.1016/bs.abr.2017.11.009
Keywords: Skeletonema species, chloroplast genomes, comparative genomics, divergence time, phylogenetic analysis, PETF
Citation: Liu S, Xu Q, Liu K, Zhao Y and Chen N (2021) Chloroplast Genomes for Five Skeletonema Species: Comparative and Phylogenetic Analysis. Front. Plant Sci. 12:774617. doi: 10.3389/fpls.2021.774617
Received: 12 September 2021; Accepted: 22 November 2021;
Published: 13 December 2021.
Edited by:
Koichiro Awai, Shizuoka University, JapanReviewed by:
Yoshihisa Hirakawa, University of Tsukuba, JapanDenis Baurain, University of Liège, Belgium
Copyright © 2021 Liu, Xu, Liu, Zhao and Chen. This is an open-access article distributed under the terms of the Creative Commons Attribution License (CC BY). The use, distribution or reproduction in other forums is permitted, provided the original author(s) and the copyright owner(s) are credited and that the original publication in this journal is cited, in accordance with accepted academic practice. No use, distribution or reproduction is permitted which does not comply with these terms.
*Correspondence: Nansheng Chen, chenn@qdio.ac.cn