 Sandra Rollar
 Manuel Geyer
 Lorenz Hartl
 Volker Mohler
 Frank Ordon
 Albrecht Serfling
- 1Julius Kühn Institute (JKI) – Federal Research Centre for Cultivated Plants, Institute for Resistance Research and Stress Tolerance, Quedlinburg, Germany
- 2Bavarian State Research Center for Agriculture, Institute for Crop Science and Plant Breeding, Freising, Germany
Stripe rust caused by the biotrophic fungus Puccinia striiformis Westend. is one of the most important diseases of wheat worldwide, causing high yield and quality losses. Growing resistant cultivars is the most efficient way to control stripe rust, both economically and ecologically. Known resistance genes are already present in numerous cultivars worldwide. However, their effectiveness is limited to certain races within a rust population and the emergence of stripe rust races being virulent against common resistance genes forces the demand for new sources of resistance. Multiparent advanced generation intercross (MAGIC) populations have proven to be a powerful tool to carry out genetic studies on economically important traits. In this study, interval mapping was performed to map quantitative trait loci (QTL) for stripe rust resistance in the Bavarian MAGIC wheat population, comprising 394 F6 : 8 recombinant inbred lines (RILs). Phenotypic evaluation of the RILs was carried out for adult plant resistance in field trials at three locations across three years and for seedling resistance in a growth chamber. In total, 21 QTL for stripe rust resistance corresponding to 13 distinct chromosomal regions were detected, of which two may represent putatively new QTL located on wheat chromosomes 3D and 7D.
Introduction
The biotrophic fungus Puccinia striiformis Westend. f. sp. tritici Eriks. is the causal agent of stripe rust and is one of the most important foliar diseases of wheat, which accounted for 25% of global cereal crop production in 2018 (Food and Agriculture Organization of the United Nations (FAO), 2020). Particularly prevalent in the temperate and maritime wheat growing regions, stripe rust can cause yield losses up to 70% mainly by reducing photosynthesis and taking assimilates from the host plant (Chen, 2005; Jagger et al., 2011; Rosewarne et al., 2012). In agricultural production systems, the application of fungicides, as well as the growing of resistant cultivars are currently used to control stripe rust, of which the latter is the most economically safe and environmentally friendly approach to avoid yield losses. To date, about 82 stripe rust resistance genes (Yr genes) have been unequivocally identified, but a lot more temporary designated genes and quantitative trait loci (QTL) have been reported and mapped across the whole wheat genome (McIntosh et al., 2019; Yang et al., 2019a). Of these, Yr5, Yr7, Yr10, Yr15, Yr18, Yr36, Yr46, and YrSP have already been cloned and characterized as intracellular nucleotide-binding leucine-rich-repeat receptors (Yr5, Yr7, and YrSP), putative kinase-pseudokinase protein (Yr15), transporters (Yr18 and Yr46), or wheat kinase start 1 (Yr36) (Fu et al., 2009; Krattinger et al., 2009; Liu et al., 2014; Moore et al., 2015; Klymiuk et al., 2018; Marchal et al., 2018). In addition, resistance genes, such as YrAS2388R derived from Aegilops tauschii and YrU1 derived from Triticum urartu have recently been cloned, encoding a nucleotide oligomerization domain-like receptor (NLR) and a coiled-coil-NBS-leucine-rich repeat protein with N-terminal ankyrin-repeat and C-terminal WRKY domains, respectively (Zhang et al., 2019; Wang et al., 2020).
Mainly two different types of resistance are described based on criteria, such as inheritance, specificity, plant growth stage, and temperature (Chen, 2013; Liu et al., 2018). The so-called all-stage resistance is detected at the seedling stage and is therefore also referred to as seedling resistance. Nevertheless, seedling resistance is in general expressed throughout all growth stages, leading to resistance in the seedling stage as well as in adult plants. It is monogenetically inherited, qualitatively expressed, and the underlying major genes are only effective against a subset of races (Chen, 2005; Feng et al., 2018). Thus, it mainly follows the gene-for-gene concept, in which the resistance depends on a specific genetic interaction between the host-resistance genes and the avirulence genes of the pathogen (Flor, 1971). Effectors produced by the pathogen are recognized by nucleotide binding site-leucine rich repeat (NB-LRR) proteins, predominately encoded by corresponding plant resistance genes (Flor, 1956; Juliana et al., 2018). This results in an effector-triggered immunity that usually initiates a hypersensitive response leading to a localized programmed cell death preventing further colonization, e.g., in the case of Yr5, Yr7, Yr10, and YrSP (Heath, 2000; Jones and Dangl, 2006). The use of race-specific resistance in plants is common in wheat, leading to a breakdown of major resistance genes according to the so-called boom-and-bust cycles (McDonald and Linde, 2002a). To date, most race-specific resistance genes against stripe rust, e.g., Yr10, Yr24, and Yr27 have been overcome by virulent races leading to the demand for more durable resistance (Kolmer, 2005; Hovmøller et al., 2017; Wang and Chen, 2017). Adult plant resistance (APR), effective at later growth stages, is quantitatively inherited and based on minor genes encoding various resistance responses, which are not restricted to specific pathogen races (Krattinger and Keller, 2016). Thus, APR does not follow the gene-for-gene interaction and is generally considered as durable. A special type of APR to stripe rust is the high-temperature adult plant (HTAP) resistance that is additionally affected by temperature (Chen, 2013). However, the mechanisms of such durable resistances include an increased latency period, reduced uredinia size, reduced infection frequency, and reduced spore production to inhibit fungal infestation (Rosewarne et al., 2013). To improve the general stripe rust resistance in commercial cultivars, more genes and useful genetic markers are needed for increasing the level and durability of resistance by combining HTAP resistance with seedling resistance.
In the context of detecting new resistance genes and QTL, molecular markers are no longer the limiting factors due to the availability of high-throughput marker systems (Mammadov et al., 2012; Chen et al., 2014; He et al., 2014; Bayer et al., 2017; Cui et al., 2017), but rather the genetic variation present in the respective experimental populations that merge genomes of diverse founders via designed crosses (Asimit and Zeggini, 2010; Gibson, 2012). Such experimental populations are traditionally derived from crosses of two contrasting parents. Thus, only two alleles at a given locus segregate in such bi-parental populations (Han et al., 2020). In contrast, the strategy of multiparent advanced generation intercross (MAGIC) populations is to interrogate multiple alleles to achieve increased recombination and mapping resolution (Cavanagh et al., 2008). Prior to developing such MAGIC populations, founder lines have to be selected based on genetic and/or phenotypic diversity. The development itself includes three steps: (1) Selected parents are crossed with each other to form a broad genetic base. (2) To increase recombination events, advanced intercrosses among the mixed lines are performed. (3) Recombinant inbred lines (RILs) are created via single seed descent or by doubled haploid production (Huang et al., 2015). This procedure results in a high number of recombination events enhancing the mapping resolution (Han et al., 2020).
The Bavarian MAGIC wheat population (BMWpop) is one of the only two German MAGIC wheat populations, which are mainly based on adapted German elite cultivars (Sannemann et al., 2018; Stadlmeier et al., 2018). It captures 71.7% of the allelic diversity present in the German wheat breeding gene pool (Stadlmeier et al., 2018). Thus, the BMWpop provides a greater potential to detect new QTL for resistance to important fungal pathogens as has been shown for powdery mildew, septoria tritici blotch, tan spot, leaf rust, and additional important agronomic traits (Stadlmeier et al., 2018, 2019; Rollar et al., 2021). The objectives of the present study were to (i) phenotype the BMWpop for quantitative and qualitative stripe rust resistance in multi-environment field trials and an extensive seedling test and to (ii) map QTL for these resistances to develop closely linked molecular markers suitable for marker-assisted selection (MAS).
Materials and Methods
Plant Material
The study is based on the multiparental BMWpop comprising eight elite wheat cultivars (Stadlmeier et al., 2018). It consists of 394 diverse F6 : 8 RILs, which were derived from a simplified eight founder MAGIC mating design with additional eight-way intercrosses. The founders “Event”, “Bayp4535”, “Potenzial”, “Bussard”, “Firl3565”, “Format”, “Julius”, and “Ambition” originated from German and Danish wheat breeding programs and were selected on the criteria described by Stadlmeier et al. (2018). Detailed information about the development and the genetics of the BMWpop were described by Stadlmeier et al. (2018).
Phenotypic Assessment of Stripe Rust Resistance in Field Trials
Six field trials were performed, each using a randomized incomplete block design with two replications at three locations in Germany: Quedlinburg (QLB, 51° 46′ 21.45 ″N 11° 8′ 34.8″ E) in Saxony-Anhalt, Soellingen (SOE, 52° 5′ 45.506 ″N 10° 55′ 41.711″ E) and Lenglern (LEN, 51° 35′ 47.53 ″N 9° 51′ 39.118″ E) in Lower Saxony. The 394 RILs, the eight founders, and the susceptible standard “Akteur” were evaluated for stripe rust resistance in double rows under natural disease epidemics in SOE (2017 and 2018) and LEN (2018 and 2019). In QLB, entries were sown in 2016/2017 and 2017/2018 in double rows of 1 m length with 30 plants per row and a spacing of 0.2 m between rows. Additional spreader plots with susceptible varieties were sown in regular intervals of every third plot. To ensure uniform infestation, the spreader plots were artificially inoculated in spring at the time of stem elongation (BBCH30, Meier, 2018) using the highly virulent Puccinia striiformis isolate Warrior + YR27 (Supplementary Table 1). For this, a spore suspension of 10 mg uredospores in 100 ml Isopar M (ExxonMobil Chemical Company, USA) was applied in a total amount of 10 ml suspension per m2, using a hand-held spinning disc sprayer (Bromyard, UK). Phenotyping of the trials was carried out by scoring the average percentage of infected leaf area of the second and third youngest leaf in two rows at two to four subsequent dates according to Moll et al. (2010). Scoring started at the time of clearly visible disease symptoms on spreader plots and/or when leaves of the susceptible standard “Akteur” showed ≥10% diseased leaf area and was conducted in 1-to-2-week intervals.
Phenotypic Assessment of Stripe Rust Resistance in Seedlings
All RILs, the parental lines, and the susceptible standard “Akteur” were evaluated for resistance at the seedling stage in a detached leaf assay (Lück et al., 2020). Seedlings were grown in 77-cell propagation trays with mixed potting soil (Gebr. Patzer GmbH Co KG, Germany) using a randomized complete block design with four replications. Water agar (7 g L−1) containing 45 mg L−1 benzimidazole (Sigma-Aldrich Chemie GmbH, Germany) for delaying senescence of leaf segments, was dispensed in 4 x 10 mL aliquots into non-sterile 4-well polystyrene plates (8 × 12 × 1 cM, Greiner Bio-One GmbH, Germany). Ten days after sowing, when the second leaf was fully developed, 2.5 cM sections were cut from the middle of the primary leaves and placed into the plates according to the initial randomization. White polytetrafluoroethylene frames (eMachineShop, NJ, USA) were used to fix the leaves. Inoculation was performed by an infection tower with the swirling duration of 3 s and settling time of 3 min (Melching, 1967). Due to space restrictions, the plates were divided into two infection groups per replication. Each group was inoculated with stripe rust isolate Warrior + YR27 using a mixture of 50 mg uredospores and white clay (1:1 w/w, VWR International GmbH, Bruchsal, Germany) after the application of a 0.01% Tween 20 (Sigma-Aldrich) solution to support adhesion. For the first 24 h of incubation, the plates were covered by wet cotton paper, and placed into a climate cabinet at 7°C to support spore germination. Next, inoculated leaf segments were incubated in a growth chamber at night/day temperatures of 16°C/18°C with additional lighting (16 h/8 h day/night) for 15 days. Quantitative scoring was conducted using the high-throughput phenotyping platform “Macrobot” (Lück et al., 2020). Digital images with a resolution of 20 megapixel and four wavelengths between 315 nm and 750 nm (UV, blue, green, and red) were taken automatically from every plate. Subsequently, the leaf area was calculated and compared to the area of uredospore pustules for analyzing the percentage of infected leaf area (Pi) using the software HawkSpex® (Fraunhofer IFF, Germany). Additionally, all entries were visually evaluated for infection type (IT) using a 0–4 scale (McIntosh et al., 1995). To generate metric data, original IT data were converted to a 0–10 linear disease scale, modified according to Zhang et al. (2014), as below: 0, 0, N, −1, 1, +1, −2, 2, +2, −3, 3, +3 were coded as 0, 0.5, 0.75, 1, 2, 3, 4, 5, 6, 7, 8, and 9, respectively. The values IT −4 and 4 were coded as 10.
Data Analysis
The multiple scorings of the percentage of Pi in field trials were taken to calculate the area under the disease progress curve (AUDPC) and the average ordinate (AO) (Moll et al., 1996) for each RIL according to Rollar et al. (2021). For subsequent statistical analysis, only the AO values were used. Different year-location combinations of all trials were referred to as “environment”. The analyses of all phenotypic data were carried out using proc mixed of the software package SAS 9.4 (SAS Institute Inc., NC, USA). To apply a mixed linear model, a log10 data transformation of the AO, IT, and Pi values was performed. The factors, such as genotype, environment, and the genotype × environment interaction of field data, were set as fixed effects, while the design effects of replication and block were set as random. To obtain variance components for calculation of the broad-sense heritability, all model parameters were set as random. Heritability was estimated on a progeny mean basis using the formula according to Hallauer et al. (2010):
Where VG is the genotypic variance, VE is the environmental variance, VGE is the genotype × environment variance, and r and e are the number of replicates and environments, respectively. For analyzing IT and Pi scores from the seedling test, the following formula was used:
Where yijk is the trait observation, μ is the overall mean, gi is the fixed effect of the genotype, rj is the fixed effect of the replication, lk is the random effect of the infection group nested in the replication, and eijk is the random residual error. Variance components were obtained by setting the genotype as random to calculate the repeatability as the ratio of the genotypic variance and the sum of the genotypic and the residual error variance divided by the number of replications. For each trait, least square means (ls means) were calculated and used for subsequent QTL analysis.
QTL Mapping
The BMWpop and the parental lines were genotyped using the 15K + 5K Infinium® iSelect® array (TraitGenetics, Germany) containing 17,267 single nucleotide polymorphisms (SNPs). The preparation of genotypic data and the construction of the linkage map used for QTL mapping were described in detail by Stadlmeier et al. (2018). QTL mapping was performed using the R (x32 3.2.5) package mpMap V2.0.2 (Huang and George, 2011; R Core Team, 2017). To conduct simple interval mapping (SIM), founder probabilities were calculated using the function “mpprob”. To determine the parental origin of an allele, the threshold was set to 0.7. For SIM, a genome-wide significant threshold of α < 0.05 was calculated for each trait. The thresholds were obtained from permutation of phenotypic data with 1,000 simulation runs (Churchill and Doerge, 1994). QTL detection was performed using the function “mpIM”, implemented in the mpMap package (Huang and George, 2011). Phenotypic variance explained by individual QTL and additive QTL effects were estimated separately using the categorical allele information of the founders. A QTL support interval (SI) was defined as the map interval surrounding a QTL peak at a -log10(p) drop of one unit.
To compare QTL identified in the present study with previously described QTL, overlapping QTL were merged based on the support interval. Databases of the Triticeae Toolbox (https://triticeaetoolbox.org/wheat/genotyping/marker_selection.php), GrainGenes (https://wheat.pw.usda.gov/GG3/), as well as CerealsDB (https://www.cerealsdb.uk.net/cerealgenomics/CerealsDB/axiom_download.php) were used to obtain marker information. Physical positions were obtained by nucleotide BLAST (BLAST-n) of the marker sequences against the reference sequence RefSeq v1.0 (Appels et al., 2018) using the database of 10+ Genome Project (https://webblast.ipk-gatersleben.de/wheat_ten_genomes/, Deng et al., 2007). BLAST hits were considered as significant if the percent identity was greater than 95% and only the best hit was taken if multiple BLAST hits were detected (Gao et al., 2016). The start and end positions of peak marker sequences preceded by the chromosome name were taken to the URGI database to obtain functional gene annotations available from IWGSC (https://wheat-urgi.versailles.inra.fr/Seq-Repository/Annotations). Furthermore, a fixed chromosomal region of ± 500 kb on both sides of the QTL peak markers was examined for additional gene annotations and the output retrieved from URGI database was listed. Sequences of the closest related species, Triticum urartu (A-genome donor) and Aegilops tauschii (D-genome donor), were considered for the detection of orthologous genes.
Results
Phenotypic Assessment
Stripe rust infestation of field trials was highly correlated between the year-location combinations (Supplementary Figure 1). Pearson's correlation calculations between the different environments showed only slight differences with high correlations between r = 0.75 and r = 0.86 (p < 0.001). A high heritability of h2 = 0.94 was calculated (Table 1). The mean phenotypic distribution of AOs was right skewed with 266 RILs showing an AO smaller than 5% (Figure 1A). However, the mean distribution ranging between 0.4 and 58.1% (mean 8.0%) diseased leaf area and single maximum AO scores up to 98.1% were observed within the population (Figure 1A, Table 1). Six of eight founders showed mean AOs below 5%, resulting in a nonsignificant difference (p < 0.05) from the progeny mean. Founders “Bayp4535” and “Event” were identified as the most resistant (0.7%) and most susceptible (15.1%) parental lines to stripe rust, respectively. The analysis of variance showed significant differences concerning the genotype, environment, and the interaction between genotype and environment (Table 2).
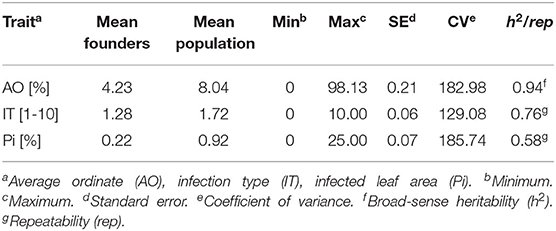
Table 1. Descriptive statistics of raw data and heritability/repeatability for field trials (AO) and seedling test (IT and Pi).
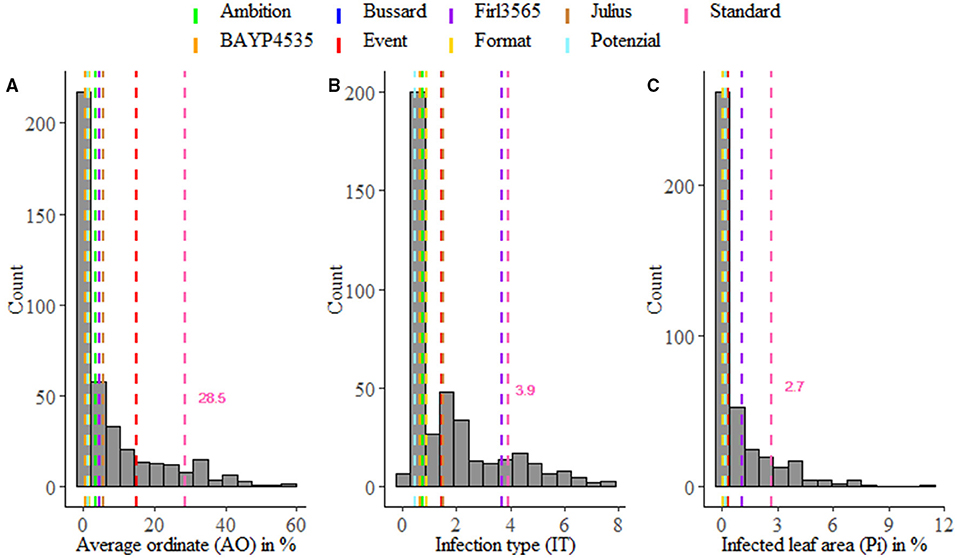
Figure 1. Averaged phenotypic distribution of resistance to Puccinia striiformis for field trials (A) and seedling test (B,C). Performance of the parental lines and the susceptible standard cv. “Akteur” is shown as vertical dashed lines.
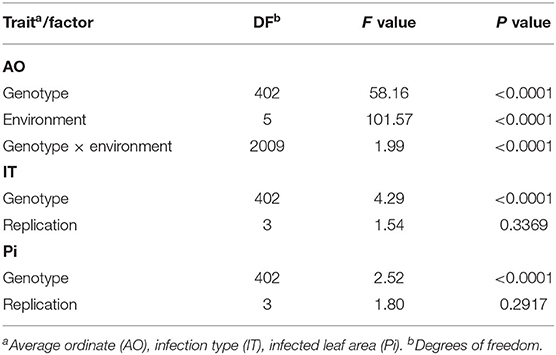
Table 2. Analysis of variance of log10-transformed data for leaf rust severity evaluated in field trials (AO) and seedling test (IT and Pi).
For IT and Pi assessed in the seedling inoculation test, the phenotypic data revealed a high degree of resistance (Figures 1B,C). Phenotypic distributions of IT and Pi were strongly right skewed, with 287 and even 388 RILs showing IT values smaller than 2 and Pi values below 5%, respectively. The average IT ranged from 0.1 to 7.8 (mean 1.7). For Pi, the disease severity was on average between 0 and 11.1% (mean 0.9%). Maximal scores of 10 (IT) and 25% (Pi) were observed (Table 1). The population mean for IT was not significantly different from the mean of the parental lines, while a significant difference between the population and founder mean for Pi was observed. For IT and Pi, respectively, the parental lines “Potenzial” and “Bayp4535” turned out to be the most resistant. “Firl3565” was the most susceptible founder in the seedling inoculation test. Pearson's correlation displayed a high correlation coefficient between both traits (r = 0.82; Supplementary Figure 2C). The traits IT and Pi and the scoring of AO showed moderate correlations of r = 0.63 and r = 0.46 (Supplementary Figures 2A,B). For both traits, a significant effect of the genotype was observed. Repeatability of IT was high with rep(IT) = 0.76, while a moderate repeatability for Pi was calculated (rep(Pi) = 0.58, Table 1).
QTL Mapping
Overall, SIM revealed 21 QTL located on chromosomes 1A, 1D, 2A, 2B, 2D, 3B, 3D, 6A, and 7D. Eight of these were detected based on field data averaged over six environments, seven QTL were found for IT, and six QTL for Pi (Table 3, Supplementary Table 2).
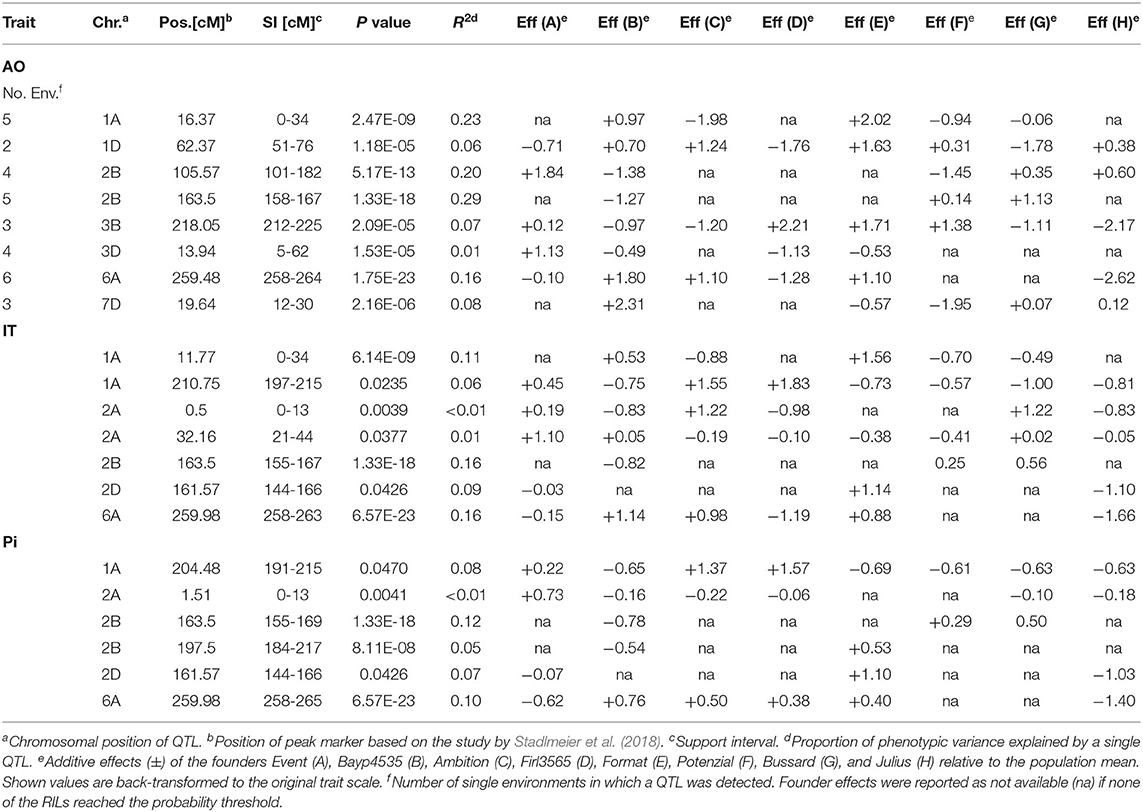
Table 3. QTL for resistance to Puccinia striiformis in the BMWpop detected in field trials (AO) and seedling tests (IT and Pi).
The phenotypic variance (R2) explained by the individual QTL detected in field trials ranged between 1 and 29%, with SI from 6 cM to 81 cM. The three strongest QTL, explaining 23, 20, and 29% of R2, were located on chromosomes 1A and 2B with peak markers at 16 cM, 106 cM and 172 cM, respectively. “Ambition”, “Potenzial”, and “Bayp4535” contributed to the largest allelic effects of these QTL, reducing disease severity (AO) by 2, 1.5, and 1.3%. Another QTL detected on chromosome 6A (at 259 cM) explained 16% of the phenotypic variance with “Julius” as the most resistant founder line, reducing the Pi by 2.6%. On chromosomes 1A, 3B, and 7D, additional three QTL were detected at positions 62, 218, and 20 cM, respectively. The QTL accounted for 6% to 8% of stripe rust variation, while cv. “Bussard”, “Julius”, and “Potenzial” contributed to the largest allelic effects reducing the Pi by 1.8, 2.2, and 2.0%, respectively. The remaining QTL on chromosome 3D (4 cM) explained 1% of the phenotypic variance with “Firl3565” contributing to the highest allelic effect (-1.1%). All QTL detected over the mean of six environments were also identified by analyzing each environment separately (Supplementary Table 2). Hence, QTL located on chromosomes 1A, 1D, 2B, 3B, 3D, 6A, and 7D were identified in five (1A), two (1D), four (2B), five (2B), three (3B), four (3D), six (6A), and three (7D) environments, respectively (Table 3). However, on chromosome 4A, a QTL with a support interval (SI) between 159 cM and 200 cM was detected in LEN19, QLB18, QLB19, and SOE19, which was no longer significant when mean AO values across all environments were used (Supplementary Table 2).
For IT, the phenotypic variance explained by the seven QTL ranged from 1 to 16% with SIs between 5 and 34 cM (Table 3). QTL on chromosomes 2B and 6A accounted for the highest R2, i.e., 16% each with peak markers at 164 cM and 260 cM, respectively. The founders “Bayp4535” and “Julius” reduced disease severity by 0.8 and 1.7 IT scores, respectively, contributing to the largest allelic effects. On chromosome 2D, one QTL was detected at 162 cM, explaining 9% of the phenotypic variance. A maximum effect of −1.1 IT scores was detected for the allele derived from cv. “Julius”. Furthermore, two QTL were detected on chromosome 1A explaining 11% (at 12 cM) and 6% (at 211 cM) of the phenotypic variance. The cv. “Ambition” and “Julius” contributed to the highest allelic effect (−0.9 and −0.8 IT scores). Two QTL located on chromosomes 4D explained only 1% of the phenotypic variance each and were mapped at 1 cM and 32 cM.
QTL analysis of Pi values revealed six individual QTL with R2 ranging from less than 1 to 12%. The SIs varied between 7 and 33 cM. QTL regions on chromosomes 1A, 2A, 2B, 2D, and 6A overlapped with QTL regions detected for IT (Table 3). The R2 values of 12% (2B), 7% (2D), 10% (6A), 8% (1A), and <0.1% (2A) were calculated for individual QTL. The maximum reducing effects of each QTL for Pi ranged from 0.2 to 1.4%, contributed from different founders. Additionally, one QTL was detected on chromosome 2B at 198 cM, accounting for 5% of the phenotypic variance. A maximum effect of −0.5% was detected for the allele derived from the cv. “Bayp4535”.
Based on SIs of 21 QTL detected in total for AO, IT, and Pi, 13 main QTL regions were derived, i.e., those detected for all estimated traits (Supplementary Figure 3, Table 4). In silico annotations of peak markers revealed seven genes with known functions partly involved in resistance. Marker wsnp_Ex_c6488_11266589 on chromosome 1A referred to CRS1-YhbY of A. thaliana, belonging to the chloroplast RNA splicing and ribosome maturation (CRM) domain-containing proteins. A dehydrogenase E1 component and a serine carboxypeptidase-like 19 were identified for peak markers for QYr.jki-2A.1 and QYr.jki-2A.2 on chromosome 2A. Markers RAC875_c1226_652 and AX-94388449 on chromosome 2B referred to BST_chr2B_nlr_143 and a formin-like protein 3, respectively. For the peak markers for QYr.jki-2D on chromosome 2D and QYr.jki-3B on chromosome 3B, GATA transcription factor 28 and a dual specificity phosphatase-catalytic domain were annotated. In addition, a fixed chromosomal region of ± 500 kb around each peak marker was examined. In silico annotations revealed additional gene annotations of different function on both sides of each QTL peak marker (Supplementary Table 4). On average, 24 gene annotations were identified within an interval of ± 500 kb on each side of the peak markers, including leucine-rich repeats for peak markers AX-95080900 and RAC875_c38756_141 of the QTL QYr.jki-1A.1, wsnp_Ex_c28149_37293173 of QTL QYr.jki-1A.2, and BobWhite_c13373_250 of QYr.jki-2A.1. In addition, NB-ARC domains were detected in the interval of peak markers AX-95080900 and wsnp_Ku_c23598_33524490 of QTL QYr.jki-1A.1, wsnp_Ex_c6488_11266589 of QTL QYr.jki-1A.2, BobWhite_c13373_250 and wsnp_Ku_c23598_33524490 of QYr.jki-2A.1, AX-95177447 of QYr.jki-2A.2, RAC875_c1226_652 of QTL QYr.jki-2B.2, AX-94734962 of QYr.jki-2D, and TA005377-1076 of QYr.jki-7D. Furthermore, protein kinase domains and/or ABC transporters were identified in the vicinity of peak markers AX-95080900 and RAC875_c38756_141 of QTL QYr.jki-1A.1, BobWhite_c13373_250 and wsnp_Ku_c23598_33524490 of QYr.jki-2A.1, and AX-94526138 for QTL QYr.jki-6A. However, a minimum of four different resistance related gene annotations were identified in the interval of peak marker AX 94388449 of the QTL QYr.jki-2B.3, while the maximum of 43 respective annotations were detected for BobWhite_c13373_250 being the peak marker of QTL QYr.jki-2A.1 (Supplementary Table 4).
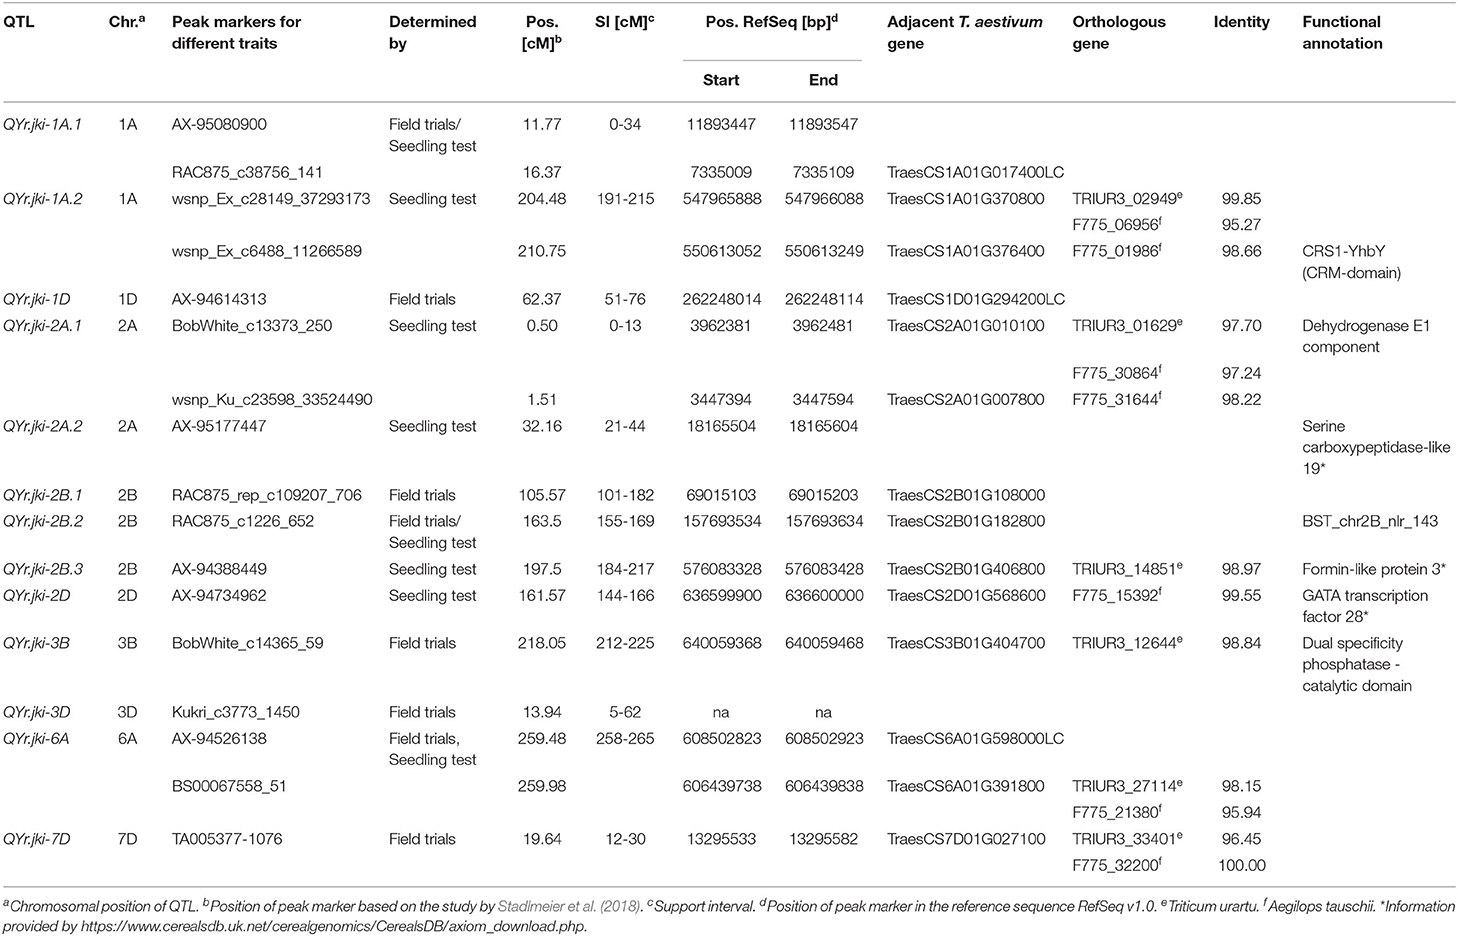
Table 4. Quantitative trait loci (QTL) resistance to Puccinia striiformis merged over all evaluated traits.
Discussion
Stripe rust occurs worldwide and is one of the most important pathogens in wheat cultivation. Known stripe rust resistances are present in many cultivars; however, their effectiveness is limited to certain races within the rust population in accordance with the gene-for-gene hypothesis (Flor, 1971). The emergence and selection of virulent pathotypes and their broad distribution results in considerable intraspecific variations in rust populations (Zetzsche et al., 2019). This in general causes the breakdown of qualitative resistances just a few years after their release (McDonald and Linde, 2002b; Kolmer, 2005). Thus, a continuous effort in wheat breeding programs is required to obtain a high degree of resistance to stripe rust by combining qualitative resistance genes with major effects and more durable APR. In this respect, the use of MAGIC populations in various QTL mapping studies turned out to be a powerful tool to detect both qualitative and quantitative resistance genes to different pathogens and other economically important traits (Pascual et al., 2015; Sallam and Martsch, 2015; Sannemann et al., 2015; Stadlmeier et al., 2019; Rollar et al., 2021).
In this study, more than 68% of the 394 RILs showed resistance to Pucchinia striiformis. A possible explanation for this can be found in the nature of the founder lines, of which almost all showed a high level of resistance to P. striiformis (Figure 1) suitable for the registration of varieties. Phenotypic data with many 0-values can lead to non-normally distributed residuals and thus affect the estimation of QTL effects in a regression-based QTL analysis. However, in this study, the phenotypic data were log10-transformed to ensure a normal distribution of the residuals for interval mapping. Thus, the right skewed distribution of the original phenotypic data did not affect the QTL detection results. With an average correlation coefficient of r = 0.82, minor differences between the disease severities in the six analyzed environments were observed. Additionally, a high broad-sense heritability of h2 = 0.94 was calculated, which is in the range of previously published studies (Feng et al., 2018; Liu et al., 2018; Ma et al., 2019; Yang et al., 2019a). These results indicate that stripe rust resistance is highly heritable and that QTL detected in the different environments were less affected by the occurrence of different P. striiformis races and/or different environmental conditions (Feng et al., 2018). Correlation between field data and seedling test results were as follows: r = 0.63 for IT and r = 0.46 for Pi, which are higher than the already reported correlations for leaf rust (Gao et al., 2016; Rollar et al., 2021). However, this observation may indicate similar scorings for seedling and adult plant resistance.
A method for linkage mapping in a MAGIC population was applied first by Xu (1996) based on the regression methods of Haley and Knott (1992). This method was used and subsequently improved based on parent probabilities by Mott et al. (2000), resulting in HAPPY. On this base, Huang and George (2011) finally developed the “mpMap” package, which was used in this study, by following a mixed-model context and including environmental and pedigree effects in the analysis. There are two main advantages of MAGIC populations: (1) Due to the crossing design of MAGIC populations, an increased genetic variation and recombination rate are achieved and (2) due to the increased genetic variation, QTL detection can be performed with increased precision and resolution (Cavanagh et al., 2008; Bandillo et al., 2013; Holland, 2015; Stadlmeier et al., 2019; and Rollar et al., 2021). This also comes along with smaller linkage blocks, a higher accuracy, and smaller SIs (Li et al., 2005; Stadlmeier et al., 2019). Overall, simple interval mapping in this study detected 21 QTL, of which only one QTL showed SI ≤ 5 cM. Nevertheless, Stadlmeier et al. (2019) successfully demonstrated the detection of QTL with small SIs in the BMWpop, which was supported by similar findings in other advanced intermated populations (Balint-Kurti et al., 2007; Huang et al., 2010). In the present study, 19% of the detected QTL showed SIs < 10 cM, and an average SI of 23 cM was calculated. Compared to double haploid (DH) lines, MAGIC populations are not completely homozygous. This residual heterozygosity can lead to problems, as heterozygotes for some markers cannot be distinguished in genotyping (Huang et al., 2015). This is particularly the case for polyploids and genotyping-by-sequencing (GBS) approaches (Elshire et al., 2011; Cavanagh et al., 2013). However, the mean proportion of heterozygous allele calls per RIL was described as 0.8% in the BMWpop (Stadlmeier et al., 2018).
The 21 QTL detected for AO, IT, and Pi correspond to 13 distinct chromosomal regions (Table 4, Supplementary Figure 3). QTL identified using the ls means across the six environments were also identified in the analyses of single environments (Supplementary Table 2). Additionally, a QTL for AO on chromosome 4A was detected in LEN19, QLB18, QLB19, and SOE19, describing 6% of phenotypic variance on average. Although this QTL was no longer significant by analyzing mean AO values across all environments, it may be of importance since there seems to be a relation to a QTL for leaf rust (QLr.jki-4A.2) mapped in a previous study (Rollar et al., 2021). At 13 distinct chromosomal regions, each of the five QTL was detected at the adult plant and seedling stages only. In contrast, three QTL were common to both growth stages, indicating the presence of effective all-stage stripe rust resistance genes. In total, the 13 QTL regions were located on wheat chromosomes 1A, 1D, 2A, 2B, 2D, 3B, 3D, 6A, and 7D.
Peak markers of QTL were partially annotated to genes, known to be involved in resistance mechanisms of plants. It was described that several serine carboxypeptidase-like proteins (QYr.jki-2A.2) catalyze the production of plant secondary metabolites involved in herbivory defense and UV protection (Fraser et al., 2005). Mugford et al. (2009) also reported a possible contribution of serine carboxypeptidase-like proteins in the synthesis of acylate plant defense compounds (avenacins) in oats. Peak marker wsnp_Ex_c6488_11266589 for QYr.jki-1A.2 was annotated to CRS1-YhbY, with a CRM protein domain. It was shown that CRM domain-containing proteins isolated from maize contribute to RNA binding activity (Barkan et al., 2007). Such RNA binding proteins are involved in various important cellular processes and in posttranscriptional regulation of gene expression, respectively. Thus, the RNA binding proteins play an important role in plant immune response regulation against pathogens, as they allow for a quick response to biotic and abiotic stress stimuli (Woloshen et al., 2011). A similar finding is the GATA transcription factor 28 for marker AX-94734962 on chromosome 2D. The GATA gene family is one of the most conserved families of transcription factors, playing a significant role in different aspects of cellular processes, e.g., in the abiotic stress signaling pathways (Gupta et al., 2017). The pyruvate dehydrogenase (E1) complex annotated for BobWhite_c13373_250 on chromosome 2A is involved in two interacting levels of control in plant cells. The first level is subcellular compartmentation contributing to tricarboxylic acid cycle and fatty acid biosynthesis, while the second level is the control of gene expression (Tovar-Méndez et al., 2003). The mean linkage disequilibrium (LD) decay for the genome in the BMW population is 9.3 cM, thus, considering a fixed interval of ± 5 Mb on both sides of a peak marker resulted in an excessive number of gene annotations (Stadlmeier et al., 2018). In this study, the fixed interval was reduced to ± 500 kb (1 Mb) based on several other studies in which the region on either side of the peak marker of a QTL was reduced to 100 kb (flax) (You and Cloutier, 2020), 2 kb (wheat) (Juliana et al., 2018), 2 kb (wheat) (Muqaddasi et al., 2020), or 100 kb (rice) (Hussain et al., 2020). However, examination of this interval led to the annotation of several leucine-rich repeats, NB-ARC domains, kinase domains, and ABC transporters. While leucine-rich repeats and NB-ARC domains are mainly involved in race-specific resistance responses, quantitative race unspecific resistance genes appear to encode different proteins, such as ABC transporters, protein kinases, and hexose transporters (Ellis et al., 2014; Moore et al., 2015; and Periyannan et al., 2017).
For the majority of the QTL detected in this study, the effect magnitudes were rather small as a high fraction of the population was highly resistant indicating that major stripe rust QTL were common to the founder lines. Two QTL were detected on chromosome 1A based on both field and seedling test data (QYr.jki-1A.1) and on seedling test data (QYr.jki-1A.2) only. QYr.jki-1A.1 is physically located in a region between 1.3 Mb and 12.5 Mb (Supplementary Table 3). To date, only one QTL for all-stage resistance to stripe rust was previously described in a similar region (Liu et al., 2018). QYrMa.wgp-1AS was mapped to the distal part of chromosome 1AS with the closest markers at 7.3 Mb (IWB57448) and 9.1 Mb (IWB5441). IWB57448 was also detected as peak marker for QYr.jki-1A.1 in this study (Table 4, Supplementary Table 3). Thus, the two QTL seem to be identical. QYr.jki-1A.2 was physically located at the distal end of chromosome 1AL between 540 Mb and 593 Mb. In the same region, there are two QTL (QYr.caas-1AL, QRYr1A.1) for APR to stripe rust (Ren et al., 2012; Rosewarne et al., 2012). These QTL were mapped at around 551 Mb and 575 Mb, respectively, but both were inconsistently detected across several environments. Another QTL (QYr.wsu-1A.2) detected at the adult plant stage and associated with marker IWA3215 was closely mapped to the distal end of QYr.jki-1A.2 around 593 Mb (Bulli et al., 2016). However, Jighly et al. (2015) described a QTL for seedling resistance that corresponds to QRYr1A.1 detected by Rosewarne et al. (2012) based on the linked DArT marker wPt-6005. Although QYr.jki-1A.2 was only detected in the seedling test, relationships between the aforementioned QTL previously described and QYr.jki-1A.2 based on physical positions might be possible.
On chromosome 1D, QYr.jki-1D was mapped in a large physical interval between 33 Mb and 366 Mb. However, the peak marker was located at 262 Mb. Furthermore, four QTL have been described at the distal end of chromosome 1DS, but none of these have been physically mapped near the region of QYr.jki-1D (Zwart et al., 2010; Vazquez et al., 2012; Hou et al., 2015; Naruoka et al., 2015). Maccaferri et al. (2015) reported the QTL QYr.ucw-1 D as a novel QTL independent of the aforementioned QTL. Its linked marker IWA980 is physically mapped at 36.3 Mb and is thus within the SI of QYr.jki 1D, but still far away from our peak marker (Supplementary Table 3). Ren et al. (2012) identified a QTL (QYr.caas-1D) flanked by markers Xgwm353 and Xgdm33b on chromosome 1DS in cv. “Naxos”, but no physical marker information is available for a closer comparison (Supplementary Table 3). The resistance gene Yr25 was mapped on chromosome 1D and is one of the common Yr genes identified in European cultivars (McIntosh, 1988; Hovmøller, 2007). The stripe rust race Warrior + Yr27 used for inoculation in this study is virulent to Yr25 (Supplementary Table 1). This may give hint that QYr.jki-1D does not refer to this resistance gene.
QYr.jki-2A.1 and QYr.jki-2A.2 were both detected on chromosome 2AS based on the seedling test. To date, three designated Yr genes (Yr17, Yr56, and Yr69) and several QTL have been described on the short arm of chromosome 2A (Bariana and McIntosh, 1993; Hao et al., 2011; Lowe et al., 2011; Agenbag et al., 2012; Vazquez et al., 2012; McIntosh et al., 2014; Hou et al., 2016; Liu et al., 2018). QYr.jki-2A.1 was mapped between 3.1 Mb and 4.2 Mb, with peak markers at 3.4 Mb (Pi) and 3.9 Mb (IT, Table 4, Supplementary Table 3). Liu et al. (2018) located QYrMa.wgp-2AS around 2.7 Mb, corresponding to the region of Yr17, which was introgressed from Aegilops ventricosa to the hexaploid wheat line “VPM1” (Bariana and McIntosh, 1993). Based on the physical distance to our peak markers, it seems likely that QYr.jki-2A.1 corresponds to QYrMa.wgp-2AS and/or Yr17, respectively (Table 4, Supplementary Table 3). The second QTL QYr.jki-2A.2 was different from QYr.jki-2A.1 as the peak marker was mapped at 18.2 Mb. Nevertheless, QYr.jki-2A.2 was mapped in a large physical region from 5.7 Mb to 36.1 Mb, showing relationships with three QTL (QYr.ufs-2A, QYr.uga-2AS, QYr.ucw-2AS), as described previously. QYr.ufs-2A detected by Agenbag et al. (2012) was located in a region similar to QYr.ucw-2AS (Lowe et al., 2011) and QYr.uga-2AS (Hao et al., 2011). QYr.ucw-2AS was detected in an RIL population (“UC1110” × “PI610750”) and is flanked by markers wPt-5839 and Xwmc177, of which the latter was mapped at 33.7 Mb (Lowe et al., 2011). QYr.uga-2AS, which was derived from cv. “Pioneer26R61”, was flanked by SSR markers Xbarc124 (3.9 Mb) and Xgwm359 (28.2 Mb) (Hao et al., 2011). Hence, all three QTL previously described are located in the chromosomal region of QYr.jki-2A.2, but further investigation is needed (Supplementary Table 3).
On chromosome 2B, QTL were detected based on field (QYr.jki-2B.1) and seedling test data (QYr.jki-2B.3) only, but also based on both data sets (QYr.jki-2B.2). QTL QYr.jki-2B.1 was mapped to a large physical region between 69 Mb to 407 Mb, including the second QTL QYr.jki-2B.2 (110.9 - 216.5 Mb). However, as the peak marker RAC875_rep_c109207_706 was located at 69.0 Mb, QYr.jki-2B.1 was designated separately and is assumed to be independent of QYr.jki-2B.2 (Table 4, Supplementary Table 3). Chromosome 2BS is known to carry HTAP resistance that was detected in several wheat backgrounds (Ramburan et al., 2004; Guo et al., 2008; Carter et al., 2009; Chen et al., 2011). Chen et al. (2011) found QYrid.ui-2B.1, which was flanked by the markers wPt-9668 and Xgwm429. The latter was physically mapped at 4.6 Mb proximal to the peak marker for QYr.jki-2B.1. As described by the authors, QYrid.ui-2B.1 corresponds to two previously reported QTL: QYr.sgi-2B.1 derived from cv. “Kariega” with the closest marker Xgwm148 at 100.8 Mb (Ramburan et al., 2004) and QYrlu.cau-2BS1 flanked by Xwmc154 (36.4 Mb) and Xgwm148 (100.8 Mb) (Guo et al., 2008). Based on these physical positions, QYrid.ui-2B.1, QYr.sgi-2B.1, and QYrlu.cau-2BS1 appear to be located in the same region as QYr.jki-2B.1 (Supplementary Table 3). For QYr.jki-2B.2, a similar conclusion can be drawn. In the study by Chen et al. (2011), a second QTL (QYrid.ui-2B.2) was identified, which was located in the same region as QTL QYrlu.cau-2BS2Q (Guo et al., 2008) and Yrlo.wgp-2BS (Carter et al., 2009). Together, the three QTL spanned a region from around 73.6 Mb to 448.7 Mb. The peak marker for QYr.jki-2B.2 was mapped at 157.7 Mb, and thus is within the region of the three QTL described previously (Supplementary Table 3). The third QTL on chromosome 2BL (QYr.jki-2B.3) was detected for Pi values between 519 Mb and 724.5 Mb. Till date, there are seven designated Yr genes located on chromosome 2BL, of which Yr5, Yr7, and YrSP were already cloned between 615.8 Mb and 773.1 Mb (McIntosh et al., 2014; Marchal et al., 2018). Additionally, several QTL are described to be located at the long arm of chromosome 2B. One QTL was detected in the RIL population, “Camp Remy” × “Michigan Amber”, and flanked by SSR markers Xgwm47 (685.8 Mb) and Xgwm501 (672.1 Mb) (Boukhatem et al., 2002). Another QTL (QYraq.cau-2BL) derived from cv. “Aquileja” was mapped between the markers Xwmc175 and Xwmc332 corresponding to 670.6–739.4 Mb (Guo et al., 2008). Guo et al. (2008) described that QYraq.cau-2BL corresponds to QTL which were previously detected by Mallard et al. (2005) and Christiansen et al. (2006). These QTL in turn were assigned to the first-mentioned QTL detected by Boukhatem et al. (2002) and to resistance genes Yr5 and Yr7, respectively (Supplementary Table 3). Although QYr.jki-2B.3 seems to correspond to the aforementioned regions, the peak marker was mapped at 576.1 Mb, a physical distance of 94.5 Mb to the closest marker interval (Table 4, Supplementary Table 3). Thus, the relationship between QYr.jki-2B.3 and the previously described QTL has still to be discussed. Furthermore, it is not clear whether QYr.jki-2B.3 is related to the Yr5, Yr7, and YrSP.
QYr.jki-2D was mapped at the distal end of chromosome 2DL with the peak marker at 636.6 Mb. To date, there are six Yr genes (Yr8, Yr16, Yr54, Yr55, Yr37, and YrCK) known to be located on chromosome 2D. Unfortunately, no information on the physical positions is available for precise comparison. However, the APR gene Yr16 was located in the centromeric region of chromosome 2D (Worland and Law, 1986; Ren et al., 2012), suggesting that this gene is different from QYr.jki-2D. Ren et al. (2012) reported a QTL on chromosome 2DL, flanked by the SSR marker Xgwm539 (513.1 Mb) and Xcfd44 (608.6 Mb). The authors assumed that this QTL is linked to two QTL as described previously, where both are closely linked to the marker Xgwm349 (Suenaga et al., 2003; Melichar et al., 2008). This SSR marker is 7 bp apart from the peak marker of QYr.jki-2D. Hence, all three QTL may correspond to QYr.jki-2D (Supplementary Table 3).
On chromosome 3B, one QTL (QYr.jki-3B) was detected based on field trial data. The QTL SI spans a physical region from 581.3 Mb to 665.3 Mb, and is located on the long arm of chromosome 3B. There are many QTL previously reported that are partly summarized by Rosewarne et al. (2013) and Chen and Kang (2017). However, most of these are located on the short arm of chromosome 3B and do not correspond to QYr.jki-3B. In addition, the resistance genes Yr4, Yr30, and Yr57 were mapped on chromosome 3BS. Two QTL are detected on the long arm of chromosome 3B, QYrex.wgp-3BL (Lin and Chen, 2009) and QYrid.ui-3B.2 (Chen et al., 2011). For both QTL, the SSR marker Xgwm299 was reported as a flanking marker physically mapped at 804.8 Mb and does not correspond to the identified region of QYr.jki-3B (Supplementary Table 3). Recently, another QTL (QYr-3BL) was discovered in the durum wheat RIL population “Stewart” x “Bansi” flanked by the marker IWB9451 (660.3 Mb) (Li et al., 2020). The authors associated this QTL with Yr80, a gene that is flanked by markers KASP65624 and KASP53113 spanning a physical region between 550.3 Mb and 605.4 Mb (Nsabiyera et al., 2018). Based on the physical positions, QYr.jki 3B may correspond to the resistance gene Yr80.
The quantitative trait locus QYr.jki-3D was mapped based on field data only. It is located at the distal end of chromosome 3DS between 19.8 Mb and 22.0 Mb. The two resistance genes Yr49 linked to Xgwm161 at 7.1 Mb, and Yr66 linked to IWB47165 at 2.6 Mb, as well as five QTL are described to be located on the arm of this chromosome (McIntosh et al., 2011, 2014; Basnet et al., 2013; Rosewarne et al., 2013). However, less marker information of QTL locations is available for precise comparison between QYr.jki-3D and QTL identified on chromosome 3DS by Boukhatem et al. (2002), Singh et al. (2000), and Basnet et al. (2013). Dedryver et al. (2009) found one QTL in cv. “Recital” flanked by the markers Xbarc125 (174.8 Mb) and Xgwm456 (282.5 Mb). Another QTL was mapped between 309.9 Mb and 357.1 Mb, far away from the region identified in this study (Yang et al., 2013). Thus, neither the QTL nor the Yr genes correspond to QYr.jki-3D, which therefore seems to be novel.
Based on the field and seedling test data conducted in this study, a QTL (QYr.jki-6A) was detected on chromosome 6AL, with peak markers at 606.4 and 608.5 Mb. There are three regions conferring resistance to stripe rust which are all closely linked to SSR marker Xgwm617 (William et al., 2006; Lillemo et al., 2008; Vazquez et al., 2012), which is 2.1 and 4.2 Mb away from our peak markers. William et al. (2006) reported the presence of QYr.cimmyt-6A, which corresponds to the QTL found by Lillemo et al. (2008), both contributed by the cv. “Avocet”. It is likely that this QTL was derived from Agropyron elongatum due to a translocation in cv. “Avocet” (Lillemo et al., 2008). However, the third QTL (QYrpl.orr-6A) previously reported by Vazquez et al. (2012) was found in the RIL population “Stephens” × “Platte” and was also assigned to the QTL detected by Lillemo et al. (2008). A close relationship between these QTL and QYr.jki-6A can be assumed (Supplementary Table 3). Several additional QTL and major genes are reported to be located on chromosome 6A, including the resistance genes Yr38, Yr42, and Yr81 (Marais et al., 2006, 2009; Prins et al., 2010; Cao et al., 2012; Rosewarne et al., 2012; Gessese et al., 2019). Unfortunately, the information provided was not sufficient to allow for further comparison.
The quantitative trait locus QYr.jki-7D based on data from field trials was located on the short arm of chromosome 7D. The QTL was physically mapped between 5.4 Mb and 29.4 Mb, with a position of the peak marker at 13.3 Mb. The five closest QTL already reported were linked to the SSR marker Xgwm295 (53.6 Mb), which is 40.3 Mb apart from our peak marker (Ramburan et al., 2004; Navabi et al., 2005; Bariana et al., 2010; Yang et al., 2013). Xgwm295 was found to be the closest microsatellite marker to the resistance complex Lr34/Yr18 (Suenaga et al., 2003). In addition, Jighly et al. (2015) identified a QTL on chromosome 7DS linked to DaRT marker wPt-668026. The authors associated this QTL with the 7DS locus near the marker Xbcd1438 described by Singh et al. (2000), which in turn was again associated with Lr34/Yr18 (Jighly et al., 2015). This resistance gene has been functionally characterized and is already sequenced (Krattinger et al., 2009). However, due to the large distance between these QTL and the one detected in the present study, QYr.jki-7D seems to be a novel QTL (Supplementary Table 3).
The aim of this study was to use the Bavarian MAGIC wheat population to identify new sources of resistance to stripe rust, a fungal disease that causes devastating yield losses in wheat worldwide. The analyses resulted in 21 stripe rust resistance QTL that were confined to 13 distinct chromosomal regions. Eleven of these regions corresponded to QTL already described in previous studies. The increasing information on the physical map position of many stripe rust QTL, helped to infer the identity of the QTL found in the present study. Two putatively new QTL were identified on chromosomes 3D (QYr.jki-3D) and 7D (QYr.jki-7D). SNP markers linked to these regions may be converted into KASP markers suitable for MAS in wheat breeding programs (Wu et al., 2017; Yang et al., 2019b). This will enable stacking of the detected resistance loci to breed new varieties with an improved resistance to stripe rust. Additionally, data and information generated in the present study can be used for weighted selection (Bernardo, 2014).
Data Availability Statement
The raw data supporting the conclusions of this article will be made available by the authors, without undue reservation.
Author Contributions
LH and FO planned and managed the project. LH and MG provided and characterized all RILs. MG contributed to the analyses of the results. AS, FO, MG, LH, and VM contributed to the interpretation and discussion of the results. SR conducted the field screenings and seedling test, analyzed the data, and wrote the manuscript. All authors contributed to the article and approved the submitted version.
Conflict of Interest
The authors declare that the research was conducted in the absence of any commercial or financial relationships that could be construed as a potential conflict of interest.
Publisher's Note
All claims expressed in this article are solely those of the authors and do not necessarily represent those of their affiliated organizations, or those of the publisher, the editors and the reviewers. Any product that may be evaluated in this article, or claim that may be made by its manufacturer, is not guaranteed or endorsed by the publisher.
Acknowledgments
The Federal Ministry for Food and Agriculture (BMEL) supported this research (FKZ 2818200515). We deeply thank all project partners from Strube Research and Breun Saatzucht for conducting and scoring the field trials in Söllingen and Lenglern. We also gratefully thank Melanie Stadlmeier for providing the genotypic data and the genetic map of the BMWpop. We thank NIAB for the provision of MAGIC analysis script.
Supplementary Material
The Supplementary Material for this article can be found online at: https://www.frontiersin.org/articles/10.3389/fpls.2021.684671/full#supplementary-material
Supplementary Figure 1. Pearson's correlation of stripe rust severity between different field trials. Diagonals are histograms for each environment (Lenglern LEN 2018-2019, Quedlinburg QLB 2017 2018, Söllingen SOE 2017 2018). *** denotes significance at α = 0.001.
Supplementary Figure 2. Pearson's correlation (r) between averaged infection type (IT), infected leaf area (Pi) of seedling test and average ordinate (AO) of field trials (A,B), as well as correlation between IT and Pi (C). *** denotes significance at α = 0.001.
Supplementary Figure 3. Simple interval mapping of resistance to Puccinia striiformis in field trials (A) and seedling test (B,C). The x-axis shows the 21 wheat chromosomes. Positions are based on the genetic map, and the -log10(p) values of each marker are displayed on the y-axis (black line). The red horizontal line represents the significance thresholds. The seed index (SI) of the significant QTL detected in this study are colored in blue.
Supplementary Table 1. List of virulences and avirulences of Puccinia striiformis isolate, Warrior + Yr27 used in field trials and seedling test. Brackets indicate ambiguous results due to the differing symptom ratings between replications or moderate susceptibility (based on Zetzsche et al., 2019).
Supplementary Table 2. Complete information of the quantitative trait loci (QTL) for stripe rust resistance in BMW population, evaluated in field trials (AO) and seedling test (IT and Pi).
Supplementary Table 3. Comparison of the physical positions of the QTL identified in the present study (bold) with those reported previously.
Supplementary Table 4. List of gene annotations for peak markers ± 500,000 bp, shown as output retrieved from URGI database (https://wheat-urgi.versailles.inra.fr/Seq-Repository/Annotations).
References
Agenbag, G. M., Pretorius, Z. A., Boyd, L. A., Bender, C. M., and Prins, R. (2012). Identification of adult plant resistance to stripe rust in the wheat cultivar Cappelle-Desprez. Theor. Appl. Genet. 125, 109–120. doi: 10.1007/s00122-012-1819-5
Appels, R., Eversole, K., Feuillet, C., Keller, B., Rogers, J., Stein, N., et al. (2018). Shifting the limits in wheat research and breeding using a fully annotated reference genome. Science. 361, eaar7191. doi: 10.1126/science.aar7191
Asimit, J., and Zeggini, E. (2010). Rare variant association analysis methods for complex traits. Ann. Rev. Genet. 44, 293–308. doi: 10.1146/annurev-genet-102209-163421
Balint-Kurti, P. J., Zwonitzer, J. C., Wisser, R. J., Carson, M. L., Oropeza-Rosas, M. A., Holland, J. B., et al. (2007). Precise mapping of quantitative trait loci for resistance to southern leaf blight, caused by Cochliobolus heterostrophus race O, and flowering time using advanced intercross maize lines. Genetics 176, 645–657. doi: 10.1534/genetics.106.067892
Bandillo, N., Raghavan, C., Muyco, P. A., Sevilla, M. A. L., Lobina, I. T., Dilla-Ermita, C. J., et al. (2013). Multi-parent advanced generation inter-cross (MAGIC) populations in rice: progress and potential for genetics research and breeding. Rice (N Y) 6, 11. doi: 10.1186/1939-8433-6-11
Bariana, H. S., Bansal, U. K., Schmidt, A., Lehmensiek, A., Kaur, J., Miah, H., et al. (2010). Molecular mapping of adult plant stripe rust resistance in wheat and identification of pyramided QTL genotypes. Euphytica. 176, 251–260. doi: 10.1007/S10681-010-0240-X
Bariana, H. S., and McIntosh, R. A. (1993). Cytogenetic studies in wheat. XV. Location of rust resistance genes in VPM1 and their genetic linkage with other disease resistance genes in chromosome 2A. Genome 36, 476–482. doi: 10.1139/g93-065
Barkan, A., Klipcan, L., Ostersetzer, O., Kawamura, T., Asakura, Y., and Watkins, K. P. (2007). The CRM domain: an RNA binding module derived from an ancient ribosome-associated protein. RNA 13, 55–64. doi: 10.1261/rna.139607
Basnet, B. R., Singh, R. P., Herrera-Foessel, S. A., Ibrahim, A. M. H., Huerta-Espino, J., Calvo-Salazar, V., et al. (2013). Genetic analysis of adult plant resistance to yellow rust and leaf rust in common spring wheat Quaiu 3. Plant Dis. 97, 728–736. doi: 10.1094/PDIS-02-12-0141-RE
Bayer, M. M., Rapazote-Flores, P., Ganal, M., Hedley, P. E., Macaulay, M., Plieske, J., et al. (2017). Development and evaluation of a barley 50k iSelect SNP array. Front. Plant Sci. 8, 1792. doi: 10.3389/fpls.2017.01792
Bernardo, R.. (2014). Genomewide selection when major genes are known. Crop Sci. 54, 68–75. doi: 10.2135/cropsci2013.05.0315
Boukhatem, N., Baret, P. V., Mingeot, D., and Jacquemin, J. M. (2002). Quantitative trait loci for resistance against yellow rust in two wheat-derived recombinant inbred line populations. Theor. Appl. Genet. 104, 111–118. doi: 10.1007/s001220200013
Bulli, P., Zhang, J., Chao, S., Chen, X., and Pumphrey, M. (2016). Genetic architecture of resistance to stripe rust in a global winter wheat germplasm collection. G3 Genes|Genom.|Genet. 6, 2237–2253. doi: 10.1534/g3.116.028407
Cao, X., Zhou, J., Gong, X., Zhao, G., Jia, J., and Qi, X. (2012). Identification and validation of a major quantitative trait locus for slow-rusting resistance to stripe rust in wheat. J. Integr. Plant Biol. 54, 330–344. doi: 10.1111/j.1744-7909.2012.01111.x
Carter, A. H., Chen, X. M., Garland-Campbell, K., and Kidwell, K. K. (2009). Identifying QTL for high-temperature adult-plant resistance to stripe rust (Puccinia striiformis f. sp. tritici) in the spring wheat (Triticum aestivum L.) cultivar ‘Louise'. Theor. Appl. Genet. 119, 1119–1128. doi: 10.1007/s00122-009-1114-2
Cavanagh, C., Morell, M., Mackay, I., and Powell, W. (2008). From mutations to MAGIC: resources for gene discovery, validation and delivery in crop plants. Curr. Opin. Plant Biol. 11, 215–221. doi: 10.1016/j.pbi.2008.01.002
Cavanagh, C. R., Chao, S., Wang, S., Huang, B. E., Stephen, S., Kiani, S., et al. (2013). Genome-wide comparative diversity uncovers multiple targets of selection for improvement in hexaploid wheat landraces and cultivars. Proc. Nat. Acad. Sci. U S A 110, 8057–8062. doi: 10.1073/pnas.1217133110
Chen, H., Xie, W., He, H., Yu, H., Chen, W., Li, J., et al. (2014). A high-density SNP genotyping array for rice biology and molecular breeding. Mol. Plant. 7, 541–553. doi: 10.1093/mp/sst135
Chen, J., Chu, C., Souza, E. J., Guttieri, M. J., Chen, X., Xu, S., et al. (2011). Genome-wide identification of QTL conferring high-temperature adult-plant (HTAP) resistance to stripe rust (Puccinia striiformis f. sp. tritici) in wheat. Molec. Breed. 29, 791–800. doi: 10.1007/S11032-011-9590-X
Chen, X.. (2013). Review article: High-temperature adult-plant resistance, key for sustainable control of stripe rust. AJPS. 04, 608–627. doi: 10.4236/ajps.2013.43080
Chen, X. M.. (2005). Epidemiology and control of stripe rust (Puccinia striiformis f. sp. tritici) on wheat. Canad. J. Plant Pathol. 27, 314–337. doi: 10.1080/07060660509507230
Christiansen, M. J., Feenstra, B., Skovgaard, I. M., and Andersen, S. B. (2006). Genetic analysis of resistance to yellow rust in hexaploid wheat using a mixture model for multiple crosses. Theor. Appl. Genet. 112, 581–591. doi: 10.1007/s00122-005-0128-7
Churchill, G. A., and Doerge, R. W. (1994). Empirical threshold values for quantitative trait mapping. Genetics 138, 963–971.
Cui, F., Zhang, N., Fan, X.-l., Zhang, W., Zhao, C.-h., Yang, L.-j., et al. (2017). Utilization of a wheat 660K SNP array-derived high-density genetic map for high-resolution mapping of a major QTL for kernel number. Sci. Rep. 7. doi: 10.1038/s41598-017-04028-6
Dedryver, F., Paillard, S., Mallard, S., Robert, O., Trottet, M., Nègre, S., et al. (2009). Characterization of genetic components involved in durable resistance to stripe rust in the bread wheat ‘Renan'. Phytopathology. 99, 968–973. doi: 10.1094/PHYTO-99-8-0968
Deng, W., Nickle, D. C., Learn, G. H., Maust, B., and Mullins, J. I. (2007). ViroBLAST: A stand-alone BLAST web server for flexible queries of multiple databases and user's datasets. Bioinformatics. 23, 2334–2336. doi: 10.1093/bioinformatics/btm331
Ellis, J. G., Lagudah, E. S., Spielmeyer, W., and Dodds, P. N. (2014). The past, present and future of breeding rust resistant wheat. Front. Plant Sci. 5. doi: 10.3389/fpls.2014.00641
Elshire, R. J., Glaubitz, J. C., Sun, Q., Poland, J. A., Kawamoto, K., Buckler, E. S., et al. (2011). A robust, simple genotyping-by-sequencing (GBS) approach for high diversity species. PLoS ONE 6, e19379. doi: 10.1371/journal.pone.0019379
Feng, J., Wang, M., See, D. R., Chao, S., Zheng, Y., and Chen, X. (2018). Characterization of novel gene Yr79 and four additional quantitative trait loci for all-stage and high-temperature adult-plant resistance to stripe rust in spring wheat PI 182103. Phytopathology 108, 737–747. doi: 10.1094/PHYTO-11-17-0375-R
Flor, H. H.. (1956). The complementary genic systems in flax and flax rust. Adv. Genet. 8, 29–54. doi: 10.1016/S0065-2660(08)60498-8
Flor, H. H.. (1971). Current status of the gene-for-gene concept. Annu. Rev. Phytopathol. 9, 275–296. doi: 10.1146/annurev.py.09.090171.001423
Food and Agriculture Organization of the United Nations (FAO) (2020). FAOSTAT. Crops. Latest update: December 12, 2020. Available online at: https://www.fao.org/faostat/en/#data/QC (accessed January 9, 2021).
Fraser, C. M., Rider, L. W., and Chapple, C. (2005). An expression and bioinformatics analysis of the Arabidopsis serine carboxypeptidase-like gene family. Plant Physiol. 138, 1136–1148. doi: 10.1104/pp.104.057950
Fu, D., Uauy, C., Distelfeld, A., Blechl, A., Epstein, L., Chen, X., et al. (2009). A kinase-START gene confers temperature-dependent resistance to wheat stripe rust. Science 323, 1357–1360. doi: 10.1126/science.1166289
Gao, L., Turner, M. K., Chao, S., Kolmer, J., and Anderson, J. A. (2016). Genome wide association study of seedling and adult plant leaf rust resistance in elite spring wheat breeding lines. PLoS ONE 11, e0148671. doi: 10.1371/journal.pone.0148671
Gessese, M., Bariana, H., Wong, D., Hayden, M., and Bansal, U. (2019). Molecular mapping of stripe rust resistance gene Yr81 in a common wheat landrace Aus27430. Plant Dis. 103, 1166–1171. doi: 10.1094/PDIS-06-18-1055-RE
Gibson, G.. (2012). Rare and common variants: twenty arguments. Nat. Rev. Genet. 13, 135–145. doi: 10.1038/nrg3118
Guo, Q., Zhang, Z. J., Xu, Y. B., Li, G. H., Feng, J., and Zhou, Y. (2008). Quantitative trait loci for high-temperature adult-plant and slow-rusting resistance to Puccinia striiformis f. sp. tritici in wheat cultivars. Phytopathology 98, 803–809. doi: 10.1094/PHYTO-98-7-0803
Gupta, P., Nutan, K. K., Singla-Pareek, S. L., and Pareek, A. (2017). Abiotic stresses cause differential regulation of alternative splice forms of GATA transcription factor in rice. Front Plant Sci 8, 1944. doi: 10.3389/fpls.2017.01944
Haley, C. S., and Knott, S. A. (1992). A simple regression method for mapping quantitative trait loci in line crosses using flanking markers. Heredity (Edinb) 69, 315–324. doi: 10.1038/hdy.1992.131
Hallauer, A. R., Carena, M. J., and Miranda, F. J. B. (2010). Quantitative Genetics in Maize Breeding. New York, NY: Springer Science and Business Media, 57–70.
Han, Z., Hu, G., Liu, H., Liang, F., Yang, L., Zhao, H., et al. (2020). Bin-based genome-wide association analyses improve power and resolution in QTL mapping and identify favorable alleles from multiple parents in a four-way MAGIC rice population. Theor. Appl. Genet. 133, 59–71. doi: 10.1007/s00122-019-03440-y
Hao, Y., Chen, Z., Wang, Y., Bland, D., Buck, J., Brown-Guedira, G., et al. (2011). Characterization of a major QTL for adult plant resistance to stripe rust in US soft red winter wheat. Theor. Appl. Genet. 123, 1401–1411. doi: 10.1007/s00122-011-1675-8
He, J., Zhao, X., Laroche, A., Lu, Z.-X., Liu, H., and Li, Z. (2014). Genotyping-by-sequencing (GBS), an ultimate marker-assisted selection (MAS) tool to accelerate plant breeding. Front. Plant Sci. 5, 484. doi: 10.3389/fpls.2014.00484
Heath, M. C.. (2000). Hypersensitive response-related death. Plant Mol. Biol. 44, 321–334. doi: 10.1023/a:1026592509060
Holland, J. B.. (2015). MAGIC maize: a new resource for plant genetics. Genome. Biol. 16, 163. doi: 10.1186/s13059-015-0713-2
Hou, L., Chen, X., Wang, M., See, D. R., Chao, S., Bulli, P., et al. (2015). Mapping a large number of QTL for durable resistance to stripe rust in winter wheat Druchamp using SSR and SNP markers. PLoS ONE 10, e0126794. doi: 10.1371/journal.pone.0126794
Hou, L., Jia, J., Zhang, X., Li, X., Yang, Z., Ma, J., et al. (2016). Molecular mapping of the stripe rust resistance gene Yr69 on wheat chromosome 2AS. Plant Dis. 100, 1717–1724. doi: 10.1094/PDIS-05-15-0555-RE
Hovmøller, M. S.. (2007). Sources of seedling and adult plant resistance to Puccinia striiformis f.sp. tritici in European wheats. Plant Breed. 126, 225–233. doi: 10.1111/j.1439-0523.2007.01369.x
Hovmøller, M. S., Rodriguez-Algaba, J., Thach, T., Justesen, A. F., and Hansen, J. G. (2017). Report for Puccinia striiformis race analyses and molecular genotyping 2017, Global Rust Reference Center (GRRC), Aarhus University, Flakke-bjerg, DK- 4200 Slagelse, Denmark. Available online at: https://wheatrust.org/fileadmin/www.grcc.au.dk/International_Services/Pathotype_YR_results/Summary_of_Puccinia_striiformis_race_analysis_2017.pdf (accessed September 1, 2021).
Huang, B. E., and George, A. W. (2011). R/mpMap: a computational platform for the genetic analysis of multiparent recombinant inbred lines. Bioinformatics 27, 727–729. doi: 10.1093/bioinformatics/btq719
Huang, B. E., Verbyla, K. L., Verbyla, A. P., Raghavan, C., Singh, V. K., Gaur, P., et al. (2015). MAGIC populations in crops: Current status and future prospects. Theor. Appl. Genet. 128, 999–1017. doi: 10.1007/s00122-015-2506-0
Huang, Y.-F., Madur, D., Combes, V., Ky, C. L., Coubriche, D., Jamin, P., et al. (2010). The genetic architecture of grain yield and related traits in Zea maize L. revealed by comparing intermated and conventional populations. Genetics. 186, 395–404. doi: 10.1534/genetics.110.113878
Hussain, K., Yingxing, Z., Anley, W., Riaz, A., Abbas, A., Rani, M. H., et al. (2020). Association mapping of quantitative trait loci for grain size in introgression line derived from Oryza rufipogon. Rice Sci. 27, 246–254. doi: 10.1016/j.rsci.2020.04.007
Jagger, L. J., Newell, C., Berry, S. T., MacCormack, R., and Boyd, L. A. (2011). The genetic characterisation of stripe rust resistance in the German wheat cultivar Alcedo. Theor. Appl. Gene.t 122, 723–733. doi: 10.1007/s00122-010-1481-8
Jighly, A., Oyiga, B. C., Makdis, F., Nazari, K., Youssef, O., Tadesse, W., et al. (2015). Genome-wide DArT and SNP scan for QTL associated with resistance to stripe rust (Puccinia striiformis f. sp. tritici) in elite ICARDA wheat (Triticum aestivum L.) germplasm. Theor. Appl. Genet. 128, 1277–1295. doi: 10.1007/s00122-015-2504-2
Jones, J. D. G., and Dangl, J. L. (2006). The plant immune system. Nature 444, 323–329. doi: 10.1038/nature05286
Juliana, P., Singh, R. P., Singh, P. K., Poland, J. A., Bergstrom, G. C., Huerta-Espino, J., et al. (2018). Genome-wide association mapping for resistance to leaf rust, stripe rust and tan spot in wheat reveals potential candidate genes. Theor. Appl. Genet. 131, 1405–1422. doi: 10.1007/s00122-018-3086-6
Klymiuk, V., Yaniv, E., Huang, L., Raats, D., Fatiukha, A., Chen, S., et al. (2018). Cloning of the wheat Yr15 resistance gene sheds light on the plant tandem kinase-pseudokinase family. Nat. Commun. 9, 3735. doi: 10.1038/s41467-018-06138-9
Kolmer, J. A.. (2005). Tracking wheat rust on a continental scale. Curr. Opin Plant Biol. 8, 441–449. doi: 10.1016/j.pbi.2005.05.001
Krattinger, S. G., and Keller, B. (2016). Molecular genetics and evolution of disease resistance in cereals. New Phytol. 212, 320–332. doi: 10.1111/nph.14097
Krattinger, S. G., Lagudah, E. S., Spielmeyer, W., Singh, R. P., Huerta-Espino, J., McFadden, H., et al. (2009). A putative ABC transporter confers durable resistance to multiple fungal pathogens in wheat. Science 323, 1360–1363. doi: 10.1126/science.1166453
Li, H., Bariana, H., Singh, D., Zhang, L., Dillon, S., Whan, A., et al. (2020). A durum wheat adult plant stripe rust resistance QTL and its relationship with the bread wheat Yr80 locus. Theor. Appl. Genet. 133, 3049–3066. doi: 10.1007/s00122-020-03654-5
Li, R., Lyons, M. A., Wittenburg, H., Paigen, B., and Churchill, G. A. (2005). Combining data from multiple inbred line crosses improves the power and resolution of quantitative trait loci mapping. Genetics 169, 1699–1709. doi: 10.1534/genetics.104.033993
Lillemo, M., Asalf, B., Singh, R. P., Huerta-Espino, J., Chen, X. M., He, Z. H., et al. (2008). The adult plant rust resistance loci Lr34/Yr18 and Lr46/Yr29 are important determinants of partial resistance to powdery mildew in bread wheat line Saar. Theor. Appl. Genet. 116, 1155–1166. doi: 10.1007/s00122-008-0743-1
Lin, F., and Chen, X. M. (2009). Quantitative trait loci for non-race-specific, high-temperature adult-plant resistance to stripe rust in wheat cultivar Express. Theor. Appl. Genet. 118, 631–642. doi: 10.1007/s00122-008-0894-0
Liu, L., Wang, M. N., Feng, J. Y., See, D. R., Chao, S. M., and Chen, X. M. (2018). Combination of all-stage and high-temperature adult-plant resistance QTL confers high-level, durable resistance to stripe rust in winter wheat cultivar Madsen. Theor. Appl. Genet. 131, 1835–1849. doi: 10.1007/s00122-018-3116-4
Liu, W., Frick, M., Huel, R., Nykiforuk, C. L., Wang, X., Gaudet, D. A., et al. (2014). The stripe rust resistance gene Yr10 encodes an evolutionary-conserved and unique CC-NBS-LRR sequence in wheat. Mol. Plant. 7, 1740–1755. doi: 10.1093/mp/ssu112
Lowe, I., Jankuloski, L., Chao, S., Chen, X., See, D., and Dubcovsky, J. (2011). Mapping and validation of QTL which confer partial resistance to broadly virulent post-2000 North American races of stripe rust in hexaploid wheat. Theor. Appl. Genet. 123, 143–157. doi: 10.1007/s00122-011-1573-0
Lück, S., Strickert, M., Lorbeer, M., Melchert, F., Backhaus, A., Kilias, D., et al. (2020). “Macrobot”: an automated segmentation-based system for powdery mildew disease quantification. Plant Phenomics 2020:5839856. doi: 10.34133/2020/5839856
Ma, J., Qin, N., Cai, B., Chen, G., Ding, P., Zhang, H., et al. (2019). Identification and validation of a novel major QTL for all-stage stripe rust resistance on 1BL in the winter wheat line 20828. Theor. Appl. Genet. 132, 1363–1373. doi: 10.1007/s00122-019-03283-7
Maccaferri, M., Zhang, J., Bulli, P., Abate, Z., Chao, S., Cantu, D., et al. (2015). A genome-wide association study of resistance to stripe rust (Puccinia striiformis f. sp. tritici) in a worldwide collection of hexaploid spring wheat (Triticum aestivum L.). G3 Genes|Genomes|Genet. 5, 449–465. doi: 10.1534/g3.114.014563
Mallard, S., Gaudet, D., Aldeia, A., Abelard, C., Besnard, A. L., Sourdille, P., et al. (2005). Genetic analysis of durable resistance to yellow rust in bread wheat. Theor. Appl. Genet. 110, 1401–1409. doi: 10.1007/s00122-005-1954-3
Mammadov, J., Aggarwal, R., Buyyarapu, R., and Kumpatla, S. (2012). SNP markers and their impact on plant breeding. Int. J. Plant Genom. 2012, 728398. doi: 10.1155/2012/728398
Marais, F., Marais, A., McCallum, B., and Pretorius, Z. (2009). Transfer of leaf rust and stripe rust resistance genes Lr62 and Yr42 from Aegilops neglecta Req. ex Bertol. to common wheat. Crop Sci. 49, 871–879. doi: 10.2135/cropsci2008.06.0317
Marais, G. F., McCallum, B., and Marais, A. S. (2006). Leaf rust and stripe rust resistance genes derived from Aegilops Sharonensis. Euphytica, 149(3), 373-380. doi: 10.1007/S10681-006-9092-9
Marchal, C., Zhang, J., Zhang, P., Fenwick, P., Steuernagel, B., Adamski, N. M., et al. (2018). BED-domain-containing immune receptors confer diverse resistance spectra to yellow rust. Nat. Plant. 4, 662–668. doi: 10.1038/s41477-018-0236-4
McDonald, B. A., and Linde, C. (2002a). Pathogen population genetics, evolutionary potential, and durable resistance. Annu. Rev. Phytopathol. 40, 349–379. doi: 10.1146/annurev.phyto.40.120501.101443
McDonald, B. A., and Linde, C. (2002b). The population genetics of plant pathogens and breeding strategies for durable resistance. Euphytica 124, 163–180. doi: 10.1023/A:1015678432355
McIntosh, R.A., Dubcovsky, J., Rogers, W. J., Morris, C., Appels, R., and Xia, X. C. (2011). Catalogue of gene symbols for wheat: 2011 supplement. Available online at: https://wheat.pw.usda.gov/GG3/wgc (accessed February 8, 2021).
McIntosh, R.A., Dubcovsky, J., Rogers, W. J., Morris, C., Appels, R., and Xia, X. C. (2014). Catalogue of gene symbols for wheat: 2013-2014 supplement. Available online at: https://wheat.pw.usda.gov/GG3/wgc (accessed February 7, 2021).
McIntosh, R.A., Dubcovsky, J., Rogers, W. J., Xia, X. C., and Raupp, W. J. (2019). Catalogue of gene symbols for wheat: 2019 supplement. Available online at: https://wheat.pw.usda.gov/GG3/wgc (accessed August 15, 2020).
McIntosh, R. A.. (1988). The role of specific genes in breeding for durable stem rust resistance in wheat and triticale. In: Breeding Strategies for Resistance to the rust of wheat, eds. Simmonds, N. W., and Rajaram S. (CIMMYT, Mexico, DF), p. 1–9.
McIntosh, R. A., Wellings, C. R., and Park, R. F. (1995). Wheat rusts: An atlas of resistances genes. CSIRO Publishing.
Meier, U.. (2018). Growth stages of mono- and dicotyledonous plants. BBCH Monograph. Open Agrar Repositorium. doi: 10.5073/20180906-074619
Melching, J. S.. (1967). Improved deposition of airborne urediospores of Puccinia graminis and P. striiformis on glass slides and on wheat leaves by use of a turntable. Phytopathology 57, 647.
Melichar, J. P. E., Berry, S., Newell, C., MacCormack, R., and Boyd, L. A. (2008). QTL identification and microphenotype characterisation of the developmentally regulated yellow rust resistance in the UK wheat cultivar Guardian. Theor. Appl. Genet. 117, 391–399. doi: 10.1007/s00122-008-0783-6
Moll, E., Flath, K., and Tessenow, I. (2010). Assessment of resistance in cereal cultivars. Design and analysis of experiments using the SAS-application RESI 2. Berichte aus dem Julius-Kühn-Institut. 154, 15–29.
Moll, E., Walther, U., Flath, K., Prochnow, J., and Sachs, E. (1996). Methodische Anleitung zur Bewertung der partiellen Resistenz und die SAS-Anwendung RESI. In: Mitteilungen aus der Biologischen Bundesanstalt für Land- und Forstwirtschaft, p. 4–6.
Moore, J. W., Herrera-Foessel, S., Lan, C., Schnippenkoetter, W., Ayliffe, M., Huerta-Espino, J., et al. (2015). A recently evolved hexose transporter variant confers resistance to multiple pathogens in wheat. Nat. Genet. 47, 1494–1498. doi: 10.1038/ng.3439
Mott, R., Talbot, C. J., Turri, M. G., Collins, A. C., and Flint, J. (2000). A method for fine mapping quantitative trait loci in outbred animal stocks. Proc. Natl. Acad. Sci. U S A 97, 12649–12654. doi: 10.1073/pnas.230304397
Mugford, S. T., Qi, X., Bakht, S., Hill, L., Wegel, E., Hughes, R. K., et al. (2009). A serine carboxypeptidase-like acyltransferase is required for synthesis of antimicrobial compounds and disease resistance in oats. Plant Cell 21, 2473–2484. doi: 10.1105/tpc.109.065870
Muqaddasi, Q. H., Brassac, J., Ebmeyer, E., Kollers, S., Korzun, V., Argillier, O., et al. (2020). Prospects of GWAS and predictive breeding for European winter wheat's grain protein content, grain starch content, and grain hardness. Sci. Rep. 10, 1–17. doi: 10.1038/s41598-020-69381-5
Naruoka, Y., Garland-Campbell, K. A., and Carter, A. H. (2015). Genome-wide association mapping for stripe rust (Puccinia striiformis F. sp. tritici) in US Pacific Northwest winter wheat (Triticum aestivum L.). Theor. Appl. Genet. 128, 1083–1101. doi: 10.1007/s00122-015-2492-2
Navabi, A., Tewari, J. P., Singh, R. P., McCallum, B., Laroche, A., and Briggs, K. G. (2005). Inheritance and QTL analysis of durable resistance to stripe and leaf rusts in an Australian cultivar, Triticum aestivum ‘Cook'. Genome 48, 97–107. doi: 10.1139/g04-100
Nsabiyera, V., Bariana, H. S., Qureshi, N., Wong, D., Hayden, M. J., and Bansal, U. K. (2018). Characterisation and mapping of adult plant stripe rust resistance in wheat accession Aus27284. Theor. Appl. Genet. 131, 1459–1467. doi: 10.1007/s00122-018-3090-x
Pascual, L., Desplat, N., Huang, B. E., Desgroux, A., Bruguier, L., Bouchet, J.-P., et al. (2015). Potential of a tomato MAGIC population to decipher the genetic control of quantitative traits and detect causal variants in the resequencing era. Plant Biotechnol. J. 13, 565–577. doi: 10.1111/pbi.12282
Periyannan, S., Milne, R. J., Figueroa, M., Lagudah, E. S., and Dodds, P. N. (2017). An overview of genetic rust resistance: from broad to specific mechanisms. PLoS Pathog. 13, e1006380. doi: 10.1371/journal.ppat.1006380
Prins, R., Pretorius, Z. A., Bender, C. M., and Lehmensiek, A. (2010). QTL mapping of stripe, leaf and stem rust resistance genes in a Kariega × Avocet S doubled haploid wheat population. Molec. Breed. 27, 259–270. doi: 10.1007/S11032-010-9428-Y
R Core Team (2017). R: A language and environment for statistical computing. R Foundation for Statistical Computing, Vienna, Austria, Available online at: https://www.R-project.org/
Ramburan, V. P., Pretorius, Z. A., Louw, J. H., Boyd, L. A., Smith, P. H., Boshoff, W. H. P., et al. (2004). A genetic analysis of adult plant resistance to stripe rust in the wheat cultivar Kariega. Theor. Appl. Genet. 108, 1426–1433. doi: 10.1007/s00122-003-1567-7
Ren, Y., He, Z., Li, J., Lillemo, M., Wu, L., Bai, B., et al. (2012). QTL mapping of adult-plant resistance to stripe rust in a population derived from common wheat cultivars Naxos and Shanghai 3/Catbird. Theor. Appl. Genet. 125, 1211–1221. doi: 10.1007/s00122-012-1907-6
Rollar, S., Serfling, A., Geyer, M., Hartl, L., Mohler, V., and Ordon, F. (2021). QTL mapping of adult plant and seedling resistance to leaf rust (Puccinia triticina Eriks.) in a multiparent advanced generation intercross (MAGIC) wheat population. Theor. Appl. Genet. 134, 37–51. doi: 10.1007/s00122-020-03657-2
Rosewarne, G. M., Herrera-Foessel, S. A., Singh, R. P., Huerta-Espino, J., Lan, C. X., and He, Z. H. (2013). Quantitative trait loci of stripe rust resistance in wheat. Theor. Appl. Genet. 126, 2427–2449. doi: 10.1007/s00122-013-2159-9
Rosewarne, G. M., Singh, R. P., Huerta-Espino, J., Herrera-Foessel, S. A., Forrest, K. L., Hayden, M. J., et al. (2012). Analysis of leaf and stripe rust severities reveals pathotype changes and multiple minor QTLs associated with resistance in an Avocet × Pastor wheat population. Theor. Appl. Genet. 124, 1283–1294. doi: 10.1007/s00122-012-1786-x
Sallam, A., and Martsch, R. (2015). Association mapping for frost tolerance using multi-parent advanced generation inter-cross (MAGIC) population in faba bean (Vicia faba L.). Genetica 143, 501–514. doi: 10.1007/s10709-015-9848-z
Sannemann, W., Huang, B. E., Mathew, B., and Léon, J. (2015). Multi-parent advanced generation inter-cross in barley: high-resolution quantitative trait locus mapping for flowering time as a proof of concept. Mol. Breed. 35, 418. doi: 10.1007/s11032-015-0284-7
Sannemann, W., Lisker, A., Maurer, A., Léon, J., Kazman, E., Cöster, H., et al. (2018). Adaptive selection of founder segments and epistatic control of plant height in the MAGIC winter wheat population WM-800. BMC Genom. 19, 559. doi: 10.1186/s12864-018-4915-3
Singh, R. P., Nelson, J. C., and Sorrells, M. E. (2000). Mapping Yr28 and other genes for resistance to stripe rust in wheat. Crop Sci. 40, 1148–1155. doi: 10.2135/cropsci2000.4041148x
Stadlmeier, M., Hartl, L., and Mohler, V. (2018). Usefulness of a multiparent advanced generation intercross population with a greatly reduced mating design for genetic studies in winter wheat. Front. Plant Sci. 9, 1825. doi: 10.3389/fpls.2018.01825
Stadlmeier, M., Jørgensen, L. N., Corsi, B., Cockram, J., Hartl, L., and Mohler, V. (2019). Genetic dissection of resistance to the three fungal plant pathogens Blumeria graminis, Zymoseptoria tritici, and Pyrenophora tritici-repentis using a multiparental winter wheat population. G3 (Bethesda) 9, 1745–1757. doi: 10.1534/g3.119.400068
Suenaga, K., Singh, R. P., Huerta-Espino, J., and William, H. M. (2003). Microsatellite markers for genes lr34/yr18 and other quantitative trait loci for leaf rust and stripe rust resistance in bread wheat. Phytopathology 93, 881–890. doi: 10.1094/PHYTO.2003.93.7.881
Tovar-Méndez, A., Miernyk, J. A., and Randall, D. D. (2003). Regulation of pyruvate dehydrogenase complex activity in plant cells. Eur. J. Biochem. 270, 1043–1049. doi: 10.1046/j.1432-1033.2003.03469.x
Vazquez, M. D., Peterson, C. J., Riera-Lizarazu, O., Chen, X., Heesacker, A., Ammar, K., et al. (2012). Genetic analysis of adult plant, quantitative resistance to stripe rust in wheat cultivar ‘Stephens' in multi-environment trials. Theor. Appl. Genet. 124, 1–11. doi: 10.1007/s00122-011-1681-x
Wang, H., Zou, S., Li, Y., Lin, F., and Tang, D. (2020). An ankyrin-repeat and WRKY-domain-containing immune receptor confers stripe rust resistance in wheat. Nat. Commun. 11, 1–11. doi: 10.1038/s41467-020-15139-6
Wang, M., and Chen, X. (2017). Stripe rust resistance. in Stripe Rust, eds. Chen, X., and Kang, Z. (Dordrecht, s.l. Springer Netherlands), p. 353–558.
William, H. M., Singh, R. P., Huerta-Espino, J., Palacios, G., and Suenaga, K. (2006). Characterization of genetic loci conferring adult plant resistance to leaf rust and stripe rust in spring wheat. Genome 49, 977–990. doi: 10.1139/g06-052
Woloshen, V., Huang, S., and Li, X. (2011). RNA-binding proteins in plant immunity. J. Pathog. 2011, 278697. doi: 10.4061/2011/278697
Worland, A. J., and Law, C. N. (1986). Genetic analysis of chromosome 2D of wheat I. The location of genes affecting height, day-length insensitivity, hybrid dwarfism and yellow-rust resistance. Zeitschrift für Pflanzenzüchtung. 96, 331–345.
Wu, J., Wang, Q., Kang, Z., Liu, S., Li, H., Mu, J., et al. (2017). Development and validation of KASP-SNP markers for QTL underlying resistance to stripe rust in common wheat cultivar P10057. Plant Dis. 101, 2079–2087. doi: 10.1094/PDIS-04-17-0468-RE
Xu, S.. (1996). Mapping quantitative trait loci using four-way crosses. Genet. Res. 68, 175–181. doi: 10.1017/S0016672300034066
Yang, E.-N., Rosewarne, G. M., Herrera-Foessel, S. A., Huerta-Espino, J., Tang, Z.-X., Sun, C.-F., et al. (2013). QTL analysis of the spring wheat “Chapio” identifies stable stripe rust resistance despite inter-continental genotype × environment interactions. Theor. Appl. Genet. 126, 1721–1732. doi: 10.1007/s00122-013-2087-8
Yang, M., Li, G., Wan, H., Li, L., Li, J., Yang, W., et al. (2019a). Identification of QTLs for stripe rust resistance in a recombinant inbred line population. Int. J. Mol. Sci. 20, 3410. doi: 10.3390/ijms20143410
Yang, Y., Basnet, B. R., Ibrahim, A. M.H., Rudd, J. C., Chen, X., Bowden, R. L., et al. (2019b). Developing KASP markers on a major stripe rust resistance QTL in a popular wheat TAM 111 using 90K array and genotyping-by-sequencing SNPs. Crop Sci. 59, 165–175. doi: 10.2135/cropsci2018.05.0349
You, F. M., and Cloutier, S. (2020). Mapping quantitative trait loci onto chromosome-scale pseudomolecules in flax. MPs 3, 28. doi: 10.3390/mps3020028
Zetzsche, H., Serfling, A., and Ordon, F. (2019). Breeding progress in seedling resistance against various races of stripe and leaf rust in European bread wheat. Crop. Breed Genet. Genom. 1, 546. doi: 10.20900/cbgg20190021
Zhang, C., Huang, L., Zhang, H., Hao, Q., Lyu, B., Wang, M., et al. (2019). An ancestral NB-LRR with duplicated 3′UTRs confers stripe rust resistance in wheat and barley. Nat. Commun. 10, 1–12. doi: 10.1038/s41467-019-11872-9
Zhang, D., Bowden, R. L., Yu, J., Carver, B. F., and Bai, G. (2014). Association analysis of stem rust resistance in U.S. winter wheat. PLoS ONE. 9, e103747. doi: 10.1371/journal.pone.0103747
Keywords: stripe rust, Yr genes, MAGIC population, simple interval mapping, QTL
Citation: Rollar S, Geyer M, Hartl L, Mohler V, Ordon F and Serfling A (2021) Quantitative Trait Loci Mapping of Adult Plant and Seedling Resistance to Stripe Rust (Puccinia striiformis Westend.) in a Multiparent Advanced Generation Intercross Wheat Population. Front. Plant Sci. 12:684671. doi: 10.3389/fpls.2021.684671
Received: 23 March 2021; Accepted: 19 November 2021;
Published: 23 December 2021.
Edited by:
Peter Bulli, Washington State University, United StatesReviewed by:
Yong Suk Chung, Jeju National University, South KoreaQingdong Zeng, Northwest A&F University, China
Yan Ren, Henan Agricultural University, China
Copyright © 2021 Rollar, Geyer, Hartl, Mohler, Ordon and Serfling. This is an open-access article distributed under the terms of the Creative Commons Attribution License (CC BY). The use, distribution or reproduction in other forums is permitted, provided the original author(s) and the copyright owner(s) are credited and that the original publication in this journal is cited, in accordance with accepted academic practice. No use, distribution or reproduction is permitted which does not comply with these terms.
*Correspondence: Frank Ordon, frank.ordon@julius-kuehn.de