 Anthony Bernard1,2Julie Crabier1Armel S. L. Donkpegan1Annarita Marrano3Fabrice Lheureux2
 Elisabeth Dirlewanger1*
- 1Univ. Bordeaux, INRAE, Biologie du Fruit et Pathologie, UMR 1332, Villenave d’Ornon, France
- 2CTIFL, Centre Opérationnel de Lanxade, Prigonrieux, France
- 3Department of Plant Sciences, University of California, Davis, Davis, CA, United States
Elucidating the genetic determinants of fruit quality traits in walnut is essential to breed new cultivars meeting the producers and consumers’ needs. We conducted a genome-wide association study (GWAS) using multi-locus models in a panel of 170 accessions of Juglans regia from the INRAE walnut germplasm collection, previously genotyped using the AxiomTM J. regia 700K SNP array. We phenotyped the panel for 25 fruit traits related to morphometrics, shape, volume, weight, ease of cracking, and nutritional composition. We found more than 60 marker-trait associations (MTAs), including a highly significant SNP associated with nut face diameter, nut volume and kernel volume on chromosome 14, and 5 additional associations were detected for walnut weight. We proposed several candidate genes involved in nut characteristics, such as a gene coding for a beta-galactosidase linked to several size-related traits and known to be involved in fruit development in other species. We also confirmed associations on chromosomes 5 and 11 with nut suture strength, recently reported by the University of California, Davis. Our results enhance knowledge of the genetic control of important agronomic traits related to fruit quality in walnut, and pave the way for the development of molecular markers for future assisted selection.
Introduction
Persian walnut (Juglans regia L.) is one of the oldest food sources known (Aradhya et al., 2006) and is subject to myths and legends since ancient times (Rondeau, 1997). It is a tree species with 2n = 2x = 32 chromosomes (Woodworth, 1930), growing in temperate region (McGranahan and Leslie, 2009). Walnut is an important tree crop in France after apple, with a worldwide in-shell walnut production led by China, California, and Iran1. If the ability of adapting to changing climatic conditions is among breeding priorities, larger fruit size, larger filling ratio, and easiness of cracking remain the main goals of most walnut breeding programs (Bernard et al., 2018b; Vahdati et al., 2019).
Effective management of genetic and phenotypic diversity within germplasm repositories is of valuable assistance to breeders. Typically, germplasm collections are first evaluated using morphological descriptors (Bernard et al., 2018b). Measurements of nut-related traits (e.g., shell thickness, nut length, nut diameter, etc.) in walnut were broadly conducted in Iran and Turkey using a caliper or a micrometer (Eskandari et al., 2005; Ghasemi et al., 2012; Ahandani et al., 2014; Khadivi-Khub et al., 2015; Mahmoodi et al., 2019). Similar studies were conducted in Europe (Zeneli et al., 2005; Poggetti et al., 2017), but the task is labor-intensive and not accurate. Careful consideration of the phenotyping method is of great importance since the heritability of a given trait may depend on the accuracy of the data (Furbank and Tester, 2011; Burghardt et al., 2017). Phenotyping techniques are evolving along with genotyping technologies, and X-ray computed tomography (CT) is one of the imaging techniques applied in food sciences to evaluate internal quality (Kotwaliwale et al., 2014), used notably for studying nut species such as almond, hazelnut, pecan (Harrison et al., 1993; Kim and Schatzki, 2001; Khosa and Pasero, 2014), and recently walnut (Bernard et al., 2020a).
Determination of genetic architecture of such traits has been the focus of several recent studies. A new era in walnut genetics started with the release of a high-density AxiomTM J. regia 700K SNP genotyping array (Marrano et al., 2019a). By using this genomic tool, several association mappings studies have been possible. For instance, Arab et al. (2019) applied this SNP array to dissect the genetic architecture of nut-related traits, such as nut length, nut weight, shell thickness, shell texture, and kernel percentage. In addition, Marrano et al. (2019b) carried out a gene-mapping study to decipher the genetic control of yield, phenology, and kernel pellicle color. In addition, Sideli et al. (2020) investigated the genetic control of shell suture strength phenotyped using a texture analyzer, identifying many candidate genes. By combining acquisition of accurate phenotypic data using innovative techniques with the unique walnut germplasm collection from INRAE of Bordeaux, we studied the genetic control of 25 traits related to nut quality, and we propose several candidate genes involved in those traits. These achievements are the starting point for the selection and development of walnut cultivars with desirable and improved fruit quality features.
Materials and Methods
Plant Material and Phenotypic Data Acquisition
The INRAE walnut germplasm collection is publicly available and the GWAS panel is made of 170 unique J. regia accessions previously used to study phenological traits and lateral bearing genetic architecture (Bernard et al., 2020b). All the accessions are located in the Fruit Experimental Unit of the INRAE-Bordeaux research center, at Toulenne located 50 km south-west from Bordeaux, France. The accessions were classified into three groups according to the breeding level: Selection, Landrace and Modern varieties. All the accessions were collected from 1988 and 2000 from a collecting work in 23 countries.
Walnuts were phenotyped for 25 traits, important for producers or consumers but also for walnut industry. These traits can be classified into six groups as follows (Supplementary Table 1):
– Nut morphometric traits (nut length, nut face diameter, nut profile diameter, and nut surface area). These traits are particularly important for cultivar identification.
– Nut shape and texture traits (nut shape VA3D, nut Feret shape VA3D, nut sphericity, and shell rugosity), decisive for the attractiveness to the consumers.
– Volume traits (nut, shell, kernel, and empty space volumes, and kernel filling ratio), that determine the breaking yield.
– Weight traits (nut weight, x3 extreme groups, kernel weight, and breaking yield).
– Shell cracking related traits (nut face strength, nut suture strength, and shell thickness), crucial for walnut industry.
– Nutritional components (saturated fatty acids, polyunsaturated fatty acids, monounsaturated fatty acids, tocopherols, and vitamin E activity).
In-shell walnut sampling (n = 100 nuts/accession) was performed during harvest seasons in September 2017, 2018, 2019 for each accession. Walnuts were dried for 2 days at 25°C using a food dryer. They were stored in a cold room set to 2°C. We phenotyped 25 traits.
Nut morphometric traits were evaluated on nuts collected in 2017, nut length, nut face diameter and nut profile diameter were measured using an electronic caliper (accuracy 10–2 mm) on the sample of 100 nuts/accession. On nuts collected in 2018, all traits were measured using an X-ray CT method on a subsample of 50 nuts randomly selected from the 100 nuts original sample collected. X-ray CT scans and analyses were performed as described by Bernard et al. (2020a). Nut shape and texture traits (nut shape VA3D, nut Feret shape VA3D, nut sphericity, and shell rugosity) were measured using the X-ray CT method on nuts collected in 2018. Volume traits were measured using the X-ray CT method on nuts collected in 2018. Weight traits were measured on nuts collected in 2017, 2018, and 2019 using an electronic scale (accuracy 10–1 mm). A subsample of 50 nuts from the 100 nuts sampled every year was randomly selected to obtain the weight of 50 kernels and the breaking yield. The French walnut industry considers seven size groups depending on the diameter: < 28 mm, 28–30 mm, 30–32 mm, 32–34 mm, 34–36 mm, 36–38 mm, > 38 mm. The trait “x3 extreme groups” is the ratio of the number of walnuts in the three extreme groups (34–36 mm, 36–38 mm, and > 38 mm) to the total number of walnuts in all groups. For shell cracking related traits a subsample of 50 randomly selected nuts was halved to determine the force needed to crack the nut (initial rupture) on the face (25 nuts) and on the suture (25 nuts) for 2017, 2018, and 2019 samples using a texture analyzer (TA-PLUS model, TA1 Texture Analyzer series, from Lloyd Materials TestingTM, Ametek®). The following parameters were retained: compression speed of 75 mm/min and detection of the initial break when the force drops abruptly by 80%. For the 2018 harvest, the shell thickness was obtained using the X-ray CT method. Nutritional components were measured on nuts collected in 2018 using the following methods: fatty acids were extracted by 3/2 (v/v) hexane/isopropanol mixture, miscella washed with 0.8% potassium chloride, vacuum evaporated with a Buchi® rotary evaporator. Fatty acid methyl esters were analyzed using gas chromatography according to NF EN ISO 12966-2 and 12966-4 standards, whereas tocopherols/tocotrienols were processed using high-performance liquid chromatography according to the NF EN ISO 9936 standard. Quantifications were performed at ITERG laboratory (Canéjan, France).
Data Analysis, SNP Genotyping, Population Structure, and Kinship Analyzes
Data management and visualization were performed using “R” software with the package “tidyverse” (Wickham, 2017). The Pearson correlation matrix was performed using the package “corrplot” (Wei and Simko, 2017). The Principal Component Analysis (PCA) was performed using the package “FactoMineR” (Lê et al., 2008). The means of genotypic effects were obtained for each accession by adjusting for year effect using the Best Linear Unbiased Predictions (BLUPs), considering the following mixed linear model:
where Pik refers to the observed phenotype of the kth accession in the ith year; μ is the mean value of the trait; Yi is the fixed effect of the ith year, gk is the random effect of the k genotype; and eik is the residuals of the model. The BLUPs were performed using the package “lme4” (Bates et al., 2015). The broad-sense heritability of the traits phenotyped during at least 2 years was estimated using the variance components obtained by the previous mixed linear model:
where σ2G is the genotypic effect variance and σ2P is the phenotypic variance.
The accessions were genotyped using the AxiomTM J. regia 700K SNP array containing 609,658 SNPs uniformly distributed over the 16 J. regia chromosomes (Marrano et al., 2019a). These SNPs were then filtered through several criteria described previously (Bernard et al., 2020b). Finally, 364,275 robust SNPs were retained for the GWAS.
The population structure was investigated using the “fastSTRUCTURE” software and the most likely K was determined using the ΔK method (Bernard et al., 2020b). The identity-by-descent (IBD) proportions between all pairwise comparisons are already described in Bernard et al. (2020b).
Genome-Wide Association Analysis, LD Blocks, and Search of Annotations
GWAS was carried out using the R package “GAPIT” (Lipka et al., 2012). Two multi-locus models were tested using the BLUPs as phenotypic data: the Multi-Locus Mixed Model (MLMM) (Segura et al., 2012) and the Fixed and random model Circulating Probability Unification method (FarmCPU) (Liu et al., 2016), as already described (Bernard et al., 2020b). Familiar relatedness was accounted for using a kinship matrix estimated with the VanRaden algorithm implemented in GAPIT. In order to correct for population structure, the best number of principal components to include in our models was selected using the “model.selection” function implemented in GAPIT according to the Bayesian Information Criterion (BIC). Significant marker-trait associations (MTAs) were determined using both 1 and 5% Bonferroni correction, and previous knowledge based on literature for cracking related traits. The percentage explained variance R2 was corrected for genome-wide background.
Each physical position of the identified MTAs was investigated to explore the extension of the surrounding linkage disequilibrium (LD) blocks using “solid spine of LD” method implemented in HaploView v4.2 software (Barrett et al., 2005). We searched the defined LD blocks for candidate genes using the walnut nuclear gene annotation and mapped into the new chromosome-scale reference “Chandler” genome v2.0 (Marrano et al., 2020)2.
Results
Phenotypic Data
A large variability was observed for all traits within the INRAE walnut germplasm collection (Table 1). Considering the range of the nut length in 2017, the values vary from ∼26 to 53 mm according to the accessions. We observed higher variation for nut volume in 2018 (from ∼10,400 to 43,000 mm3), nut weight in 2017 (from ∼522 to 2,278 g), and for nut suture strength in 2019 (from ∼101 to 777 N). On the contrary, there was low variation for nut sphericity (from 0.84 to 0.93) and the proportion of saturated fatty acids (from 8.60 to 11.29%). The distribution of the 25 studied traits is shown in Supplementary Figure 1.
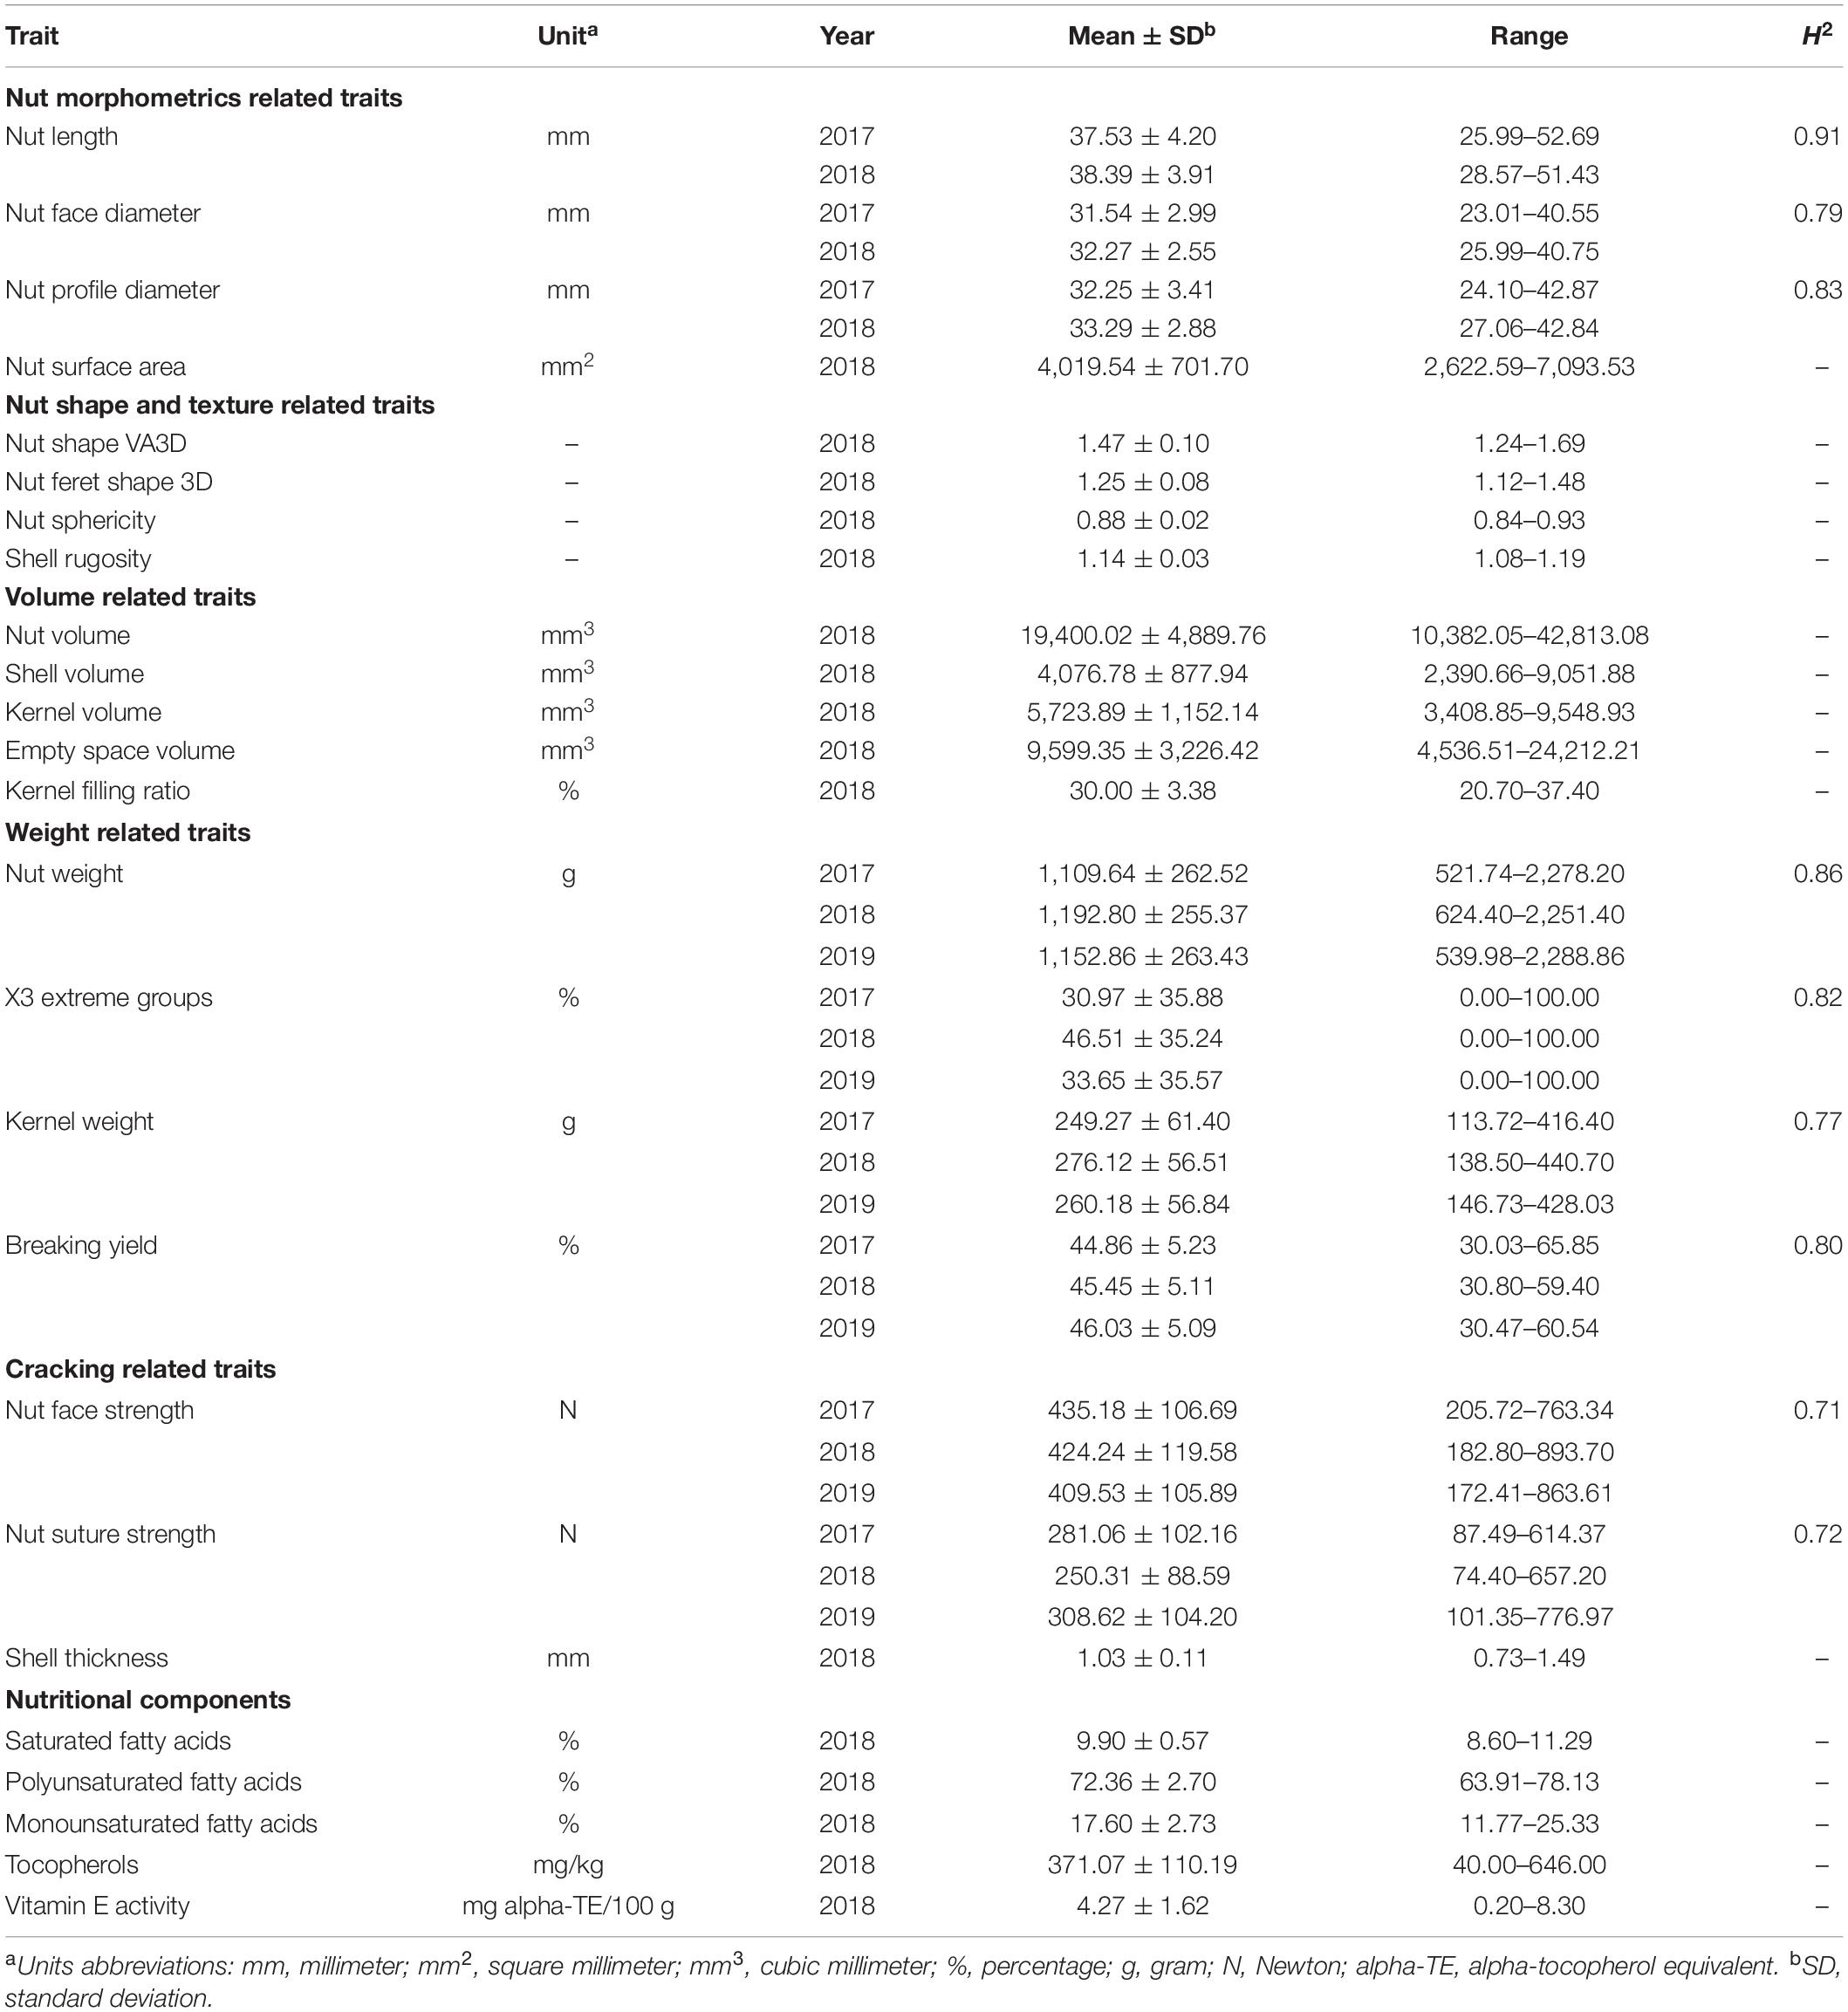
Table 1. Descriptive statistics and broad-sense heritability values of the 25 traits studied in the walnut GWAS analysis.
The Pearson correlation matrix (Figure 1) indicated strong positive correlations between all nut morphometrics related traits (group a) and volume related traits (group c). For instance, nut length was positively correlated with nut face diameter (0.62), nut volume (0.74), and kernel volume (0.64). Nut weight was also positively correlated with kernel weight (0.81). Nut suture and nut face strengths were positively correlated (0.73) but both were negatively correlated with breaking yield (−0.53 and −0.64 respectively). Nut sphericity was negatively correlated with shell rugosity and nut shape “VA3D” (−1 for both). Kernel filling ratio was negatively correlated with nut volume (−0.57). Finally, breaking yield, which is the ratio between the weight of the kernel and the nut, was not correlated with kernel filling ratio, which is the same ratio but based on volumes.
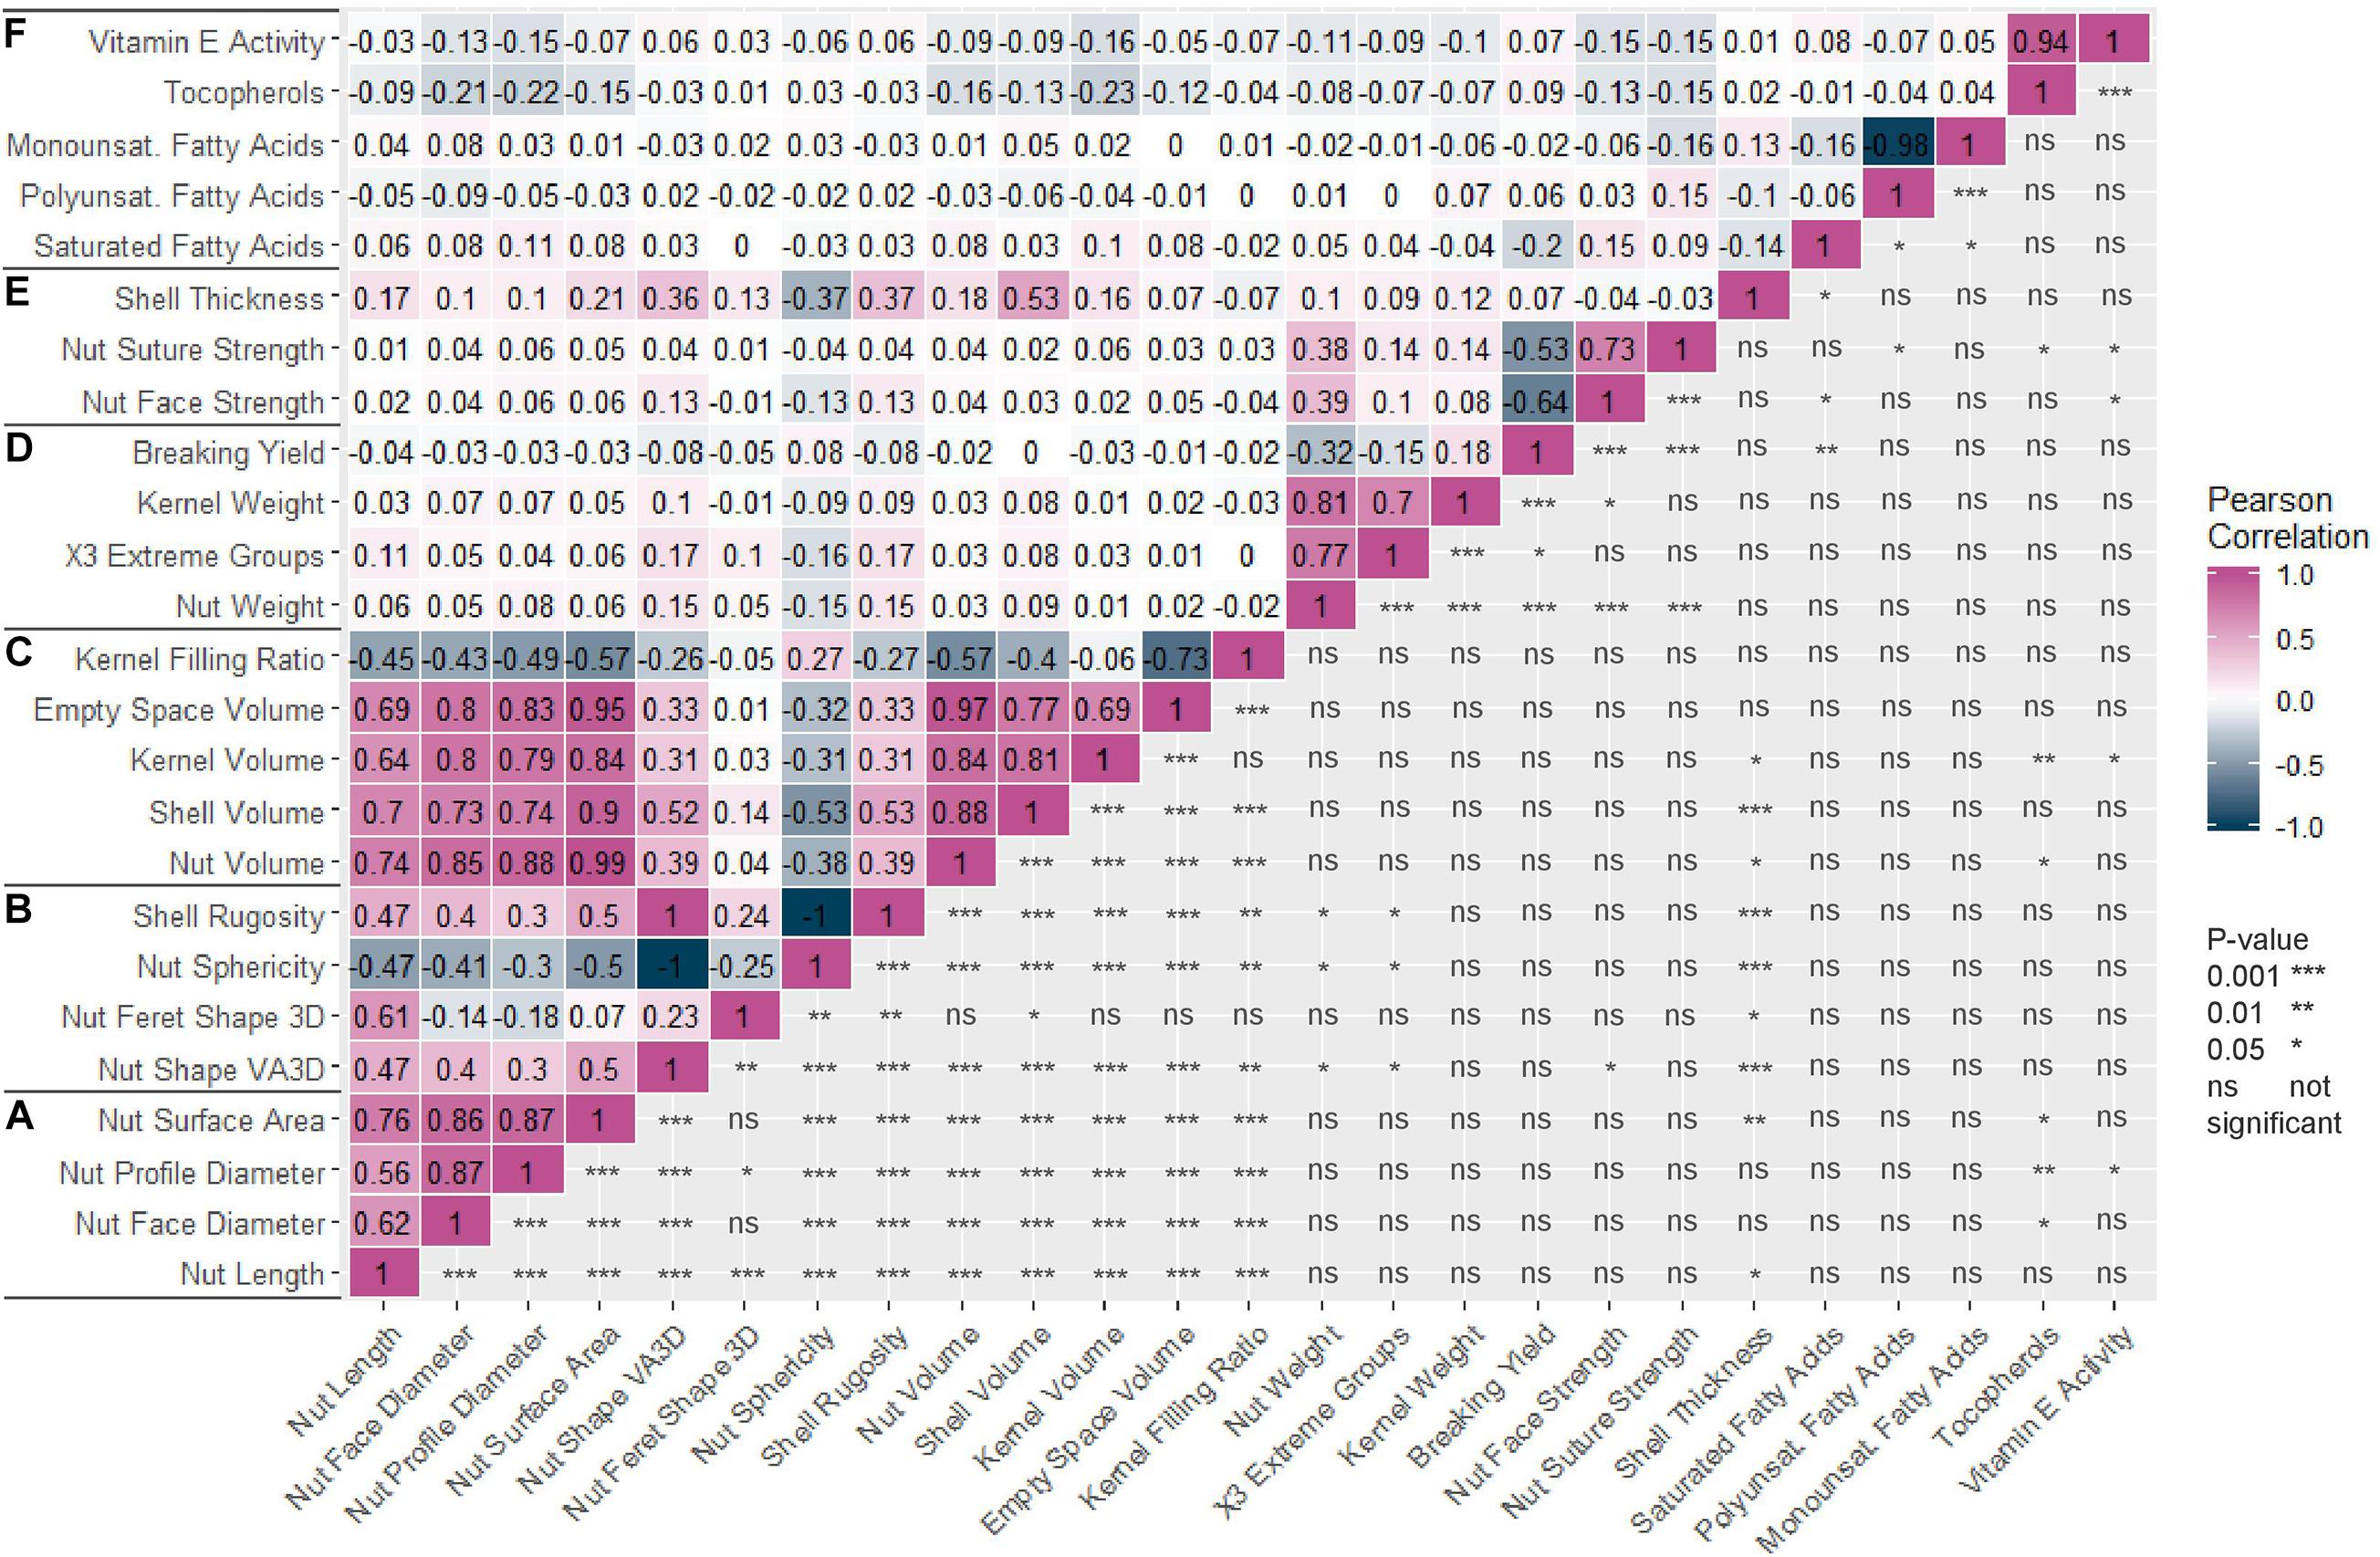
Figure 1. Correlation matrix of the 25 traits studied in the walnut GWAS analysis. (A) Nut morphometric traits. (B) Nut shape and texture traits. (C) Volume traits. (D) Weight traits. (E) Cracking traits. (F) Nutritional components. Pearson correlation coefficient was used and p-value is indicated as follows: 0.001 (***), 0.01 (**), 0.05 (*), not significant (ns).
The broad-sense heritability values estimated for the nine traits measured in at least two years showed differences (Table 1). Nut morphometrics related traits had high H2-values, ranging from 0.79 to 0.91, as those related to the weight (from 0.77 to 0.86). However, nut face strength and suture strength had smaller H2-values, 0.71 and 0.72, respectively, indicating a more complex genetic architecture.
BLUPs and Cofounding Factors
BLUPs were calculated for the nine traits with at least 2 years of phenotypic data using a linear mixed model that included the genotypic mean as a random effect and the year as a fixed effect. The density plots (Figure 2) showed a normal distribution for all traits, except for “x3 extreme groups” trait.
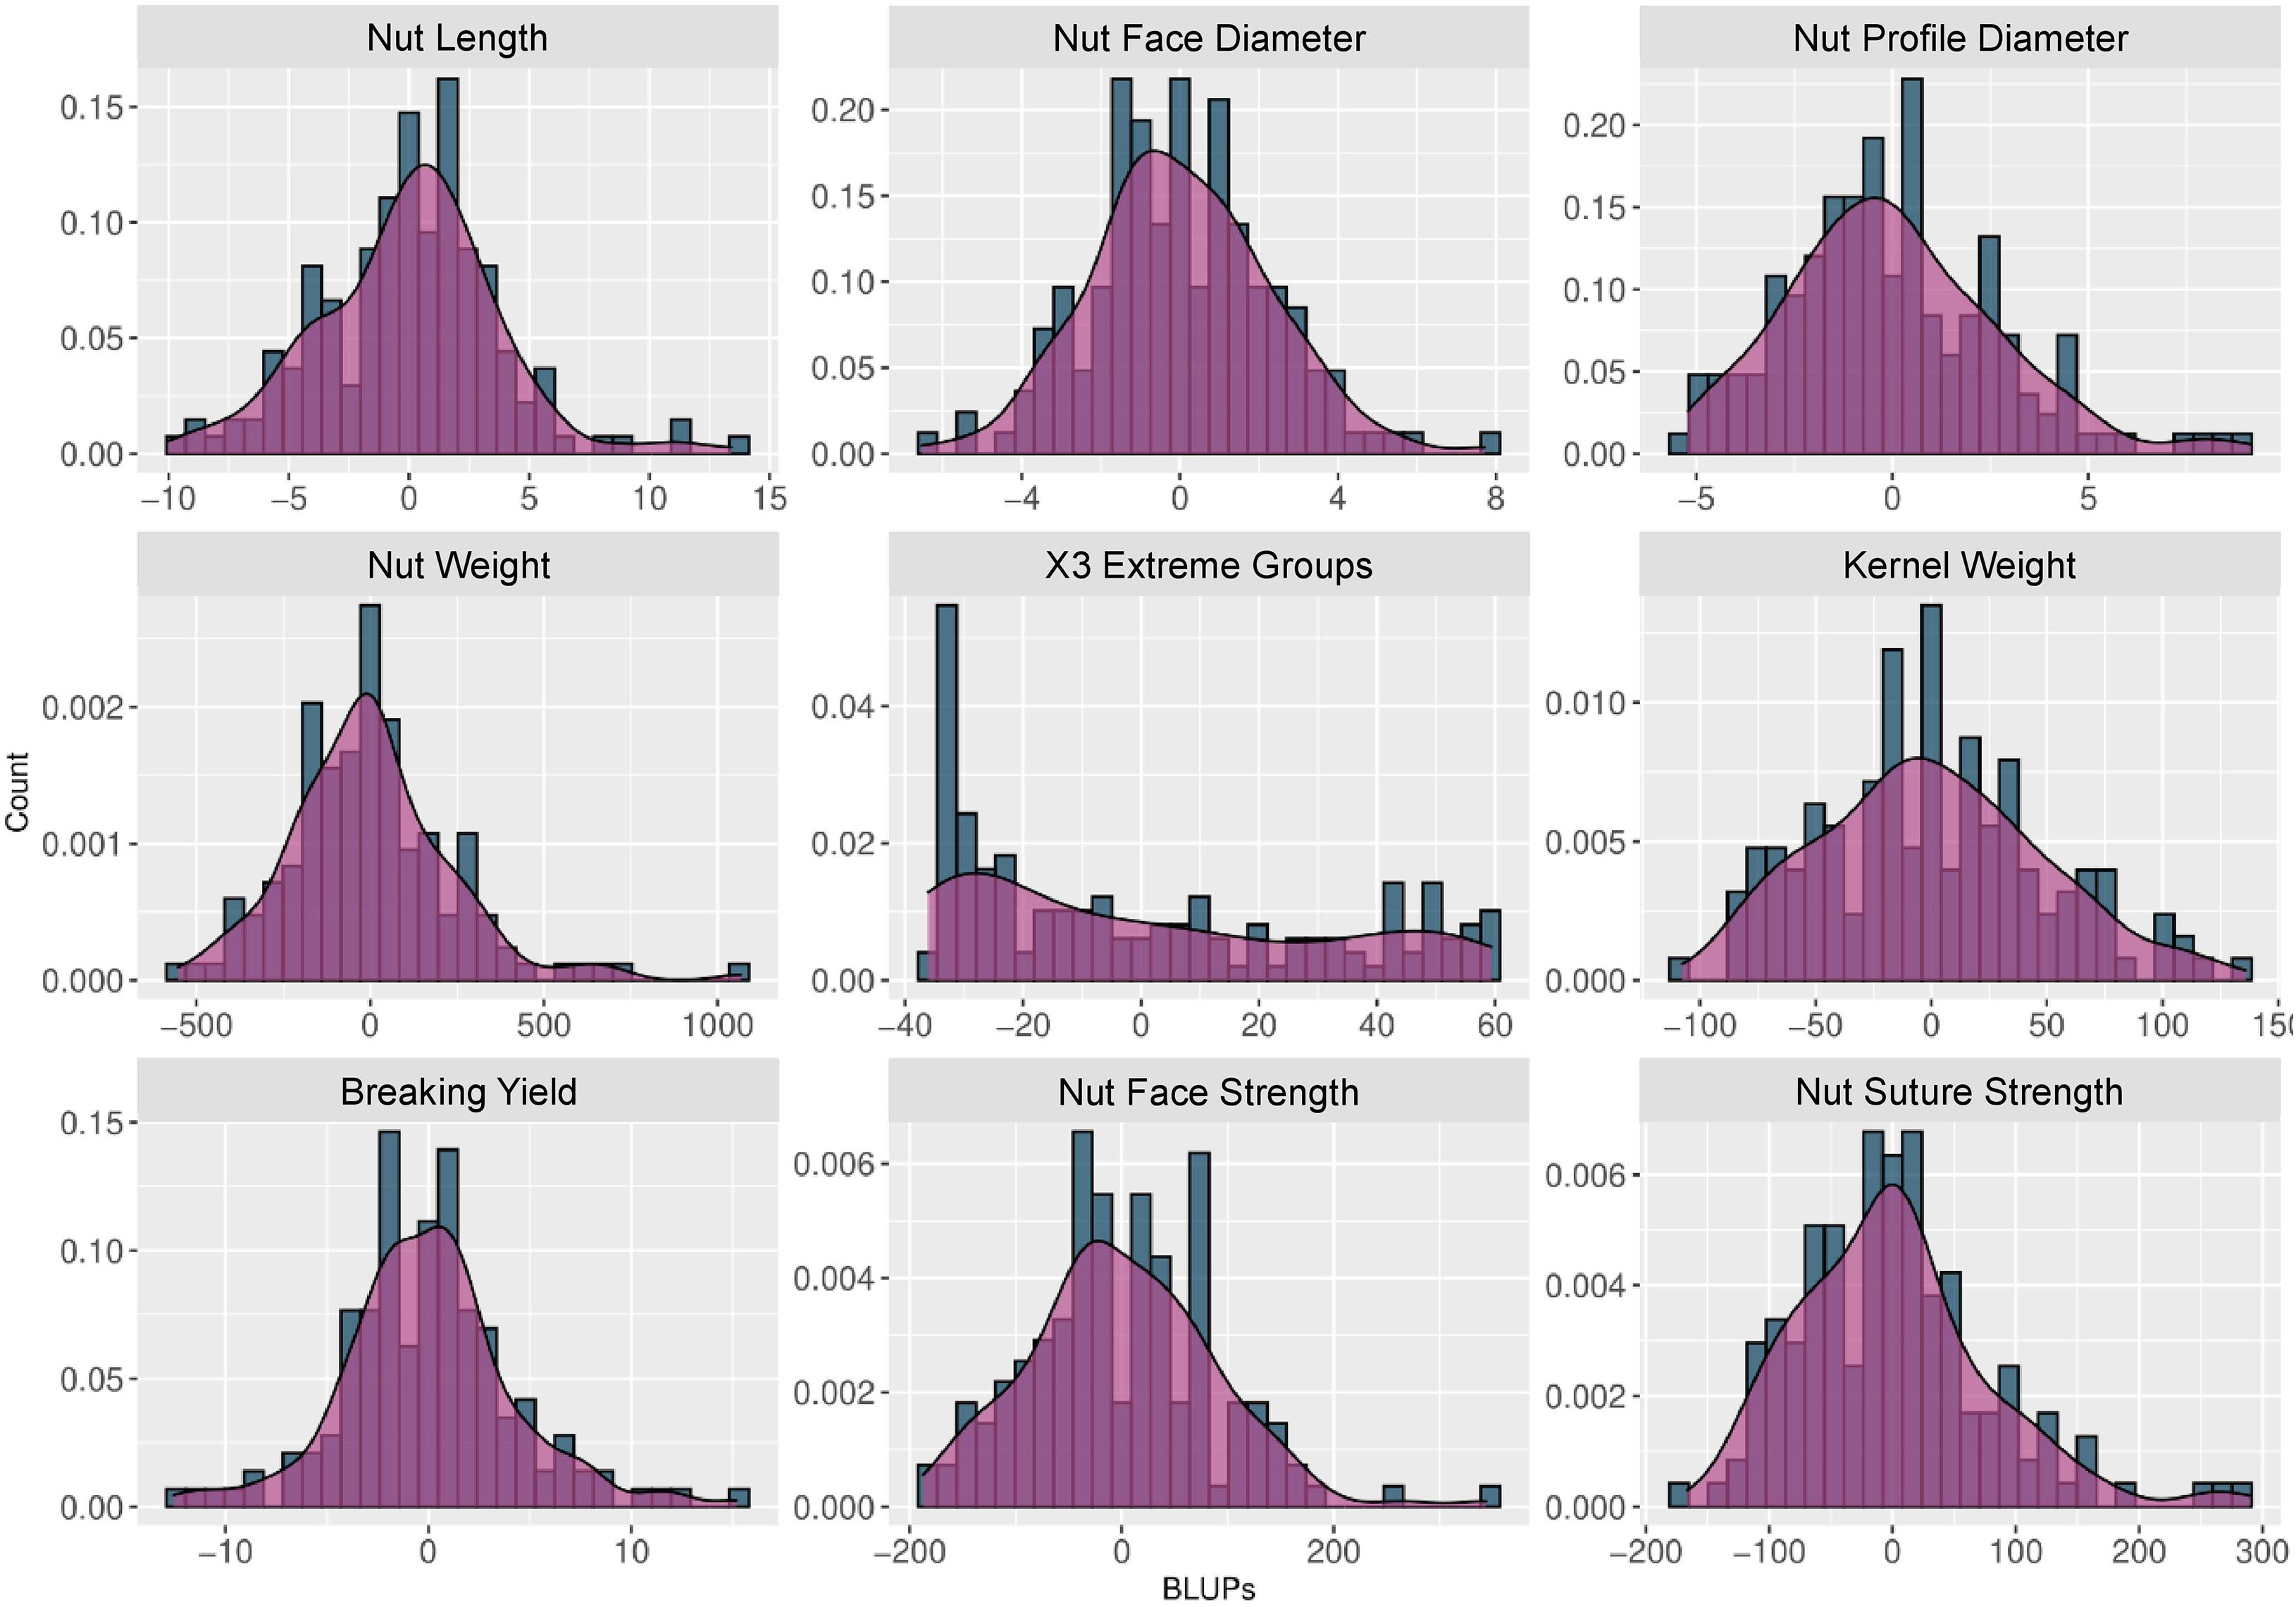
Figure 2. Histograms and density plots of the BLUPs used for the walnut GWAS analysis. The BLUPs were calculated for the 9 traits observed during at least 2 years using a linear mixed model, considering the genotypic mean as a random effect and the year as a fixed effect.
Using a BIC, we defined that the best number of principal components to include in the models for accounting for structure was zero, as previously found for phenological traits (Bernard et al., 2020b). We also determined the best K as K = 2 with a group consisting of the accessions coming from Western Europe and America and the second with the accessions from Eastern Europe and Asia (Bernard et al., 2020b). As a result, we decided to perform a Principal Component Analysis (PCA) using the 25 traits and structure-based individual clustering (Figure 3). The first two dimensions of the PCA explained 44.6% of the total variance (Figure 3A). Along the first dimension, individuals grouped according to the morphometrics, volume and weight-related traits, whereas the dimension 2 separated the walnut accessions based on shape, texture, and cracking related traits (Figure 3B). We could also notice that all groups (Western Europe and America “W,” Eastern Europe and Asia “E,” and the admixed “A”) contained accessions with large or small-sized nuts (Figure 3C), since the 95% confidence ellipses intersected and blended together. This means that the structure of our germplasm did not influence the traits, supporting the best number of PCs to include of zero.
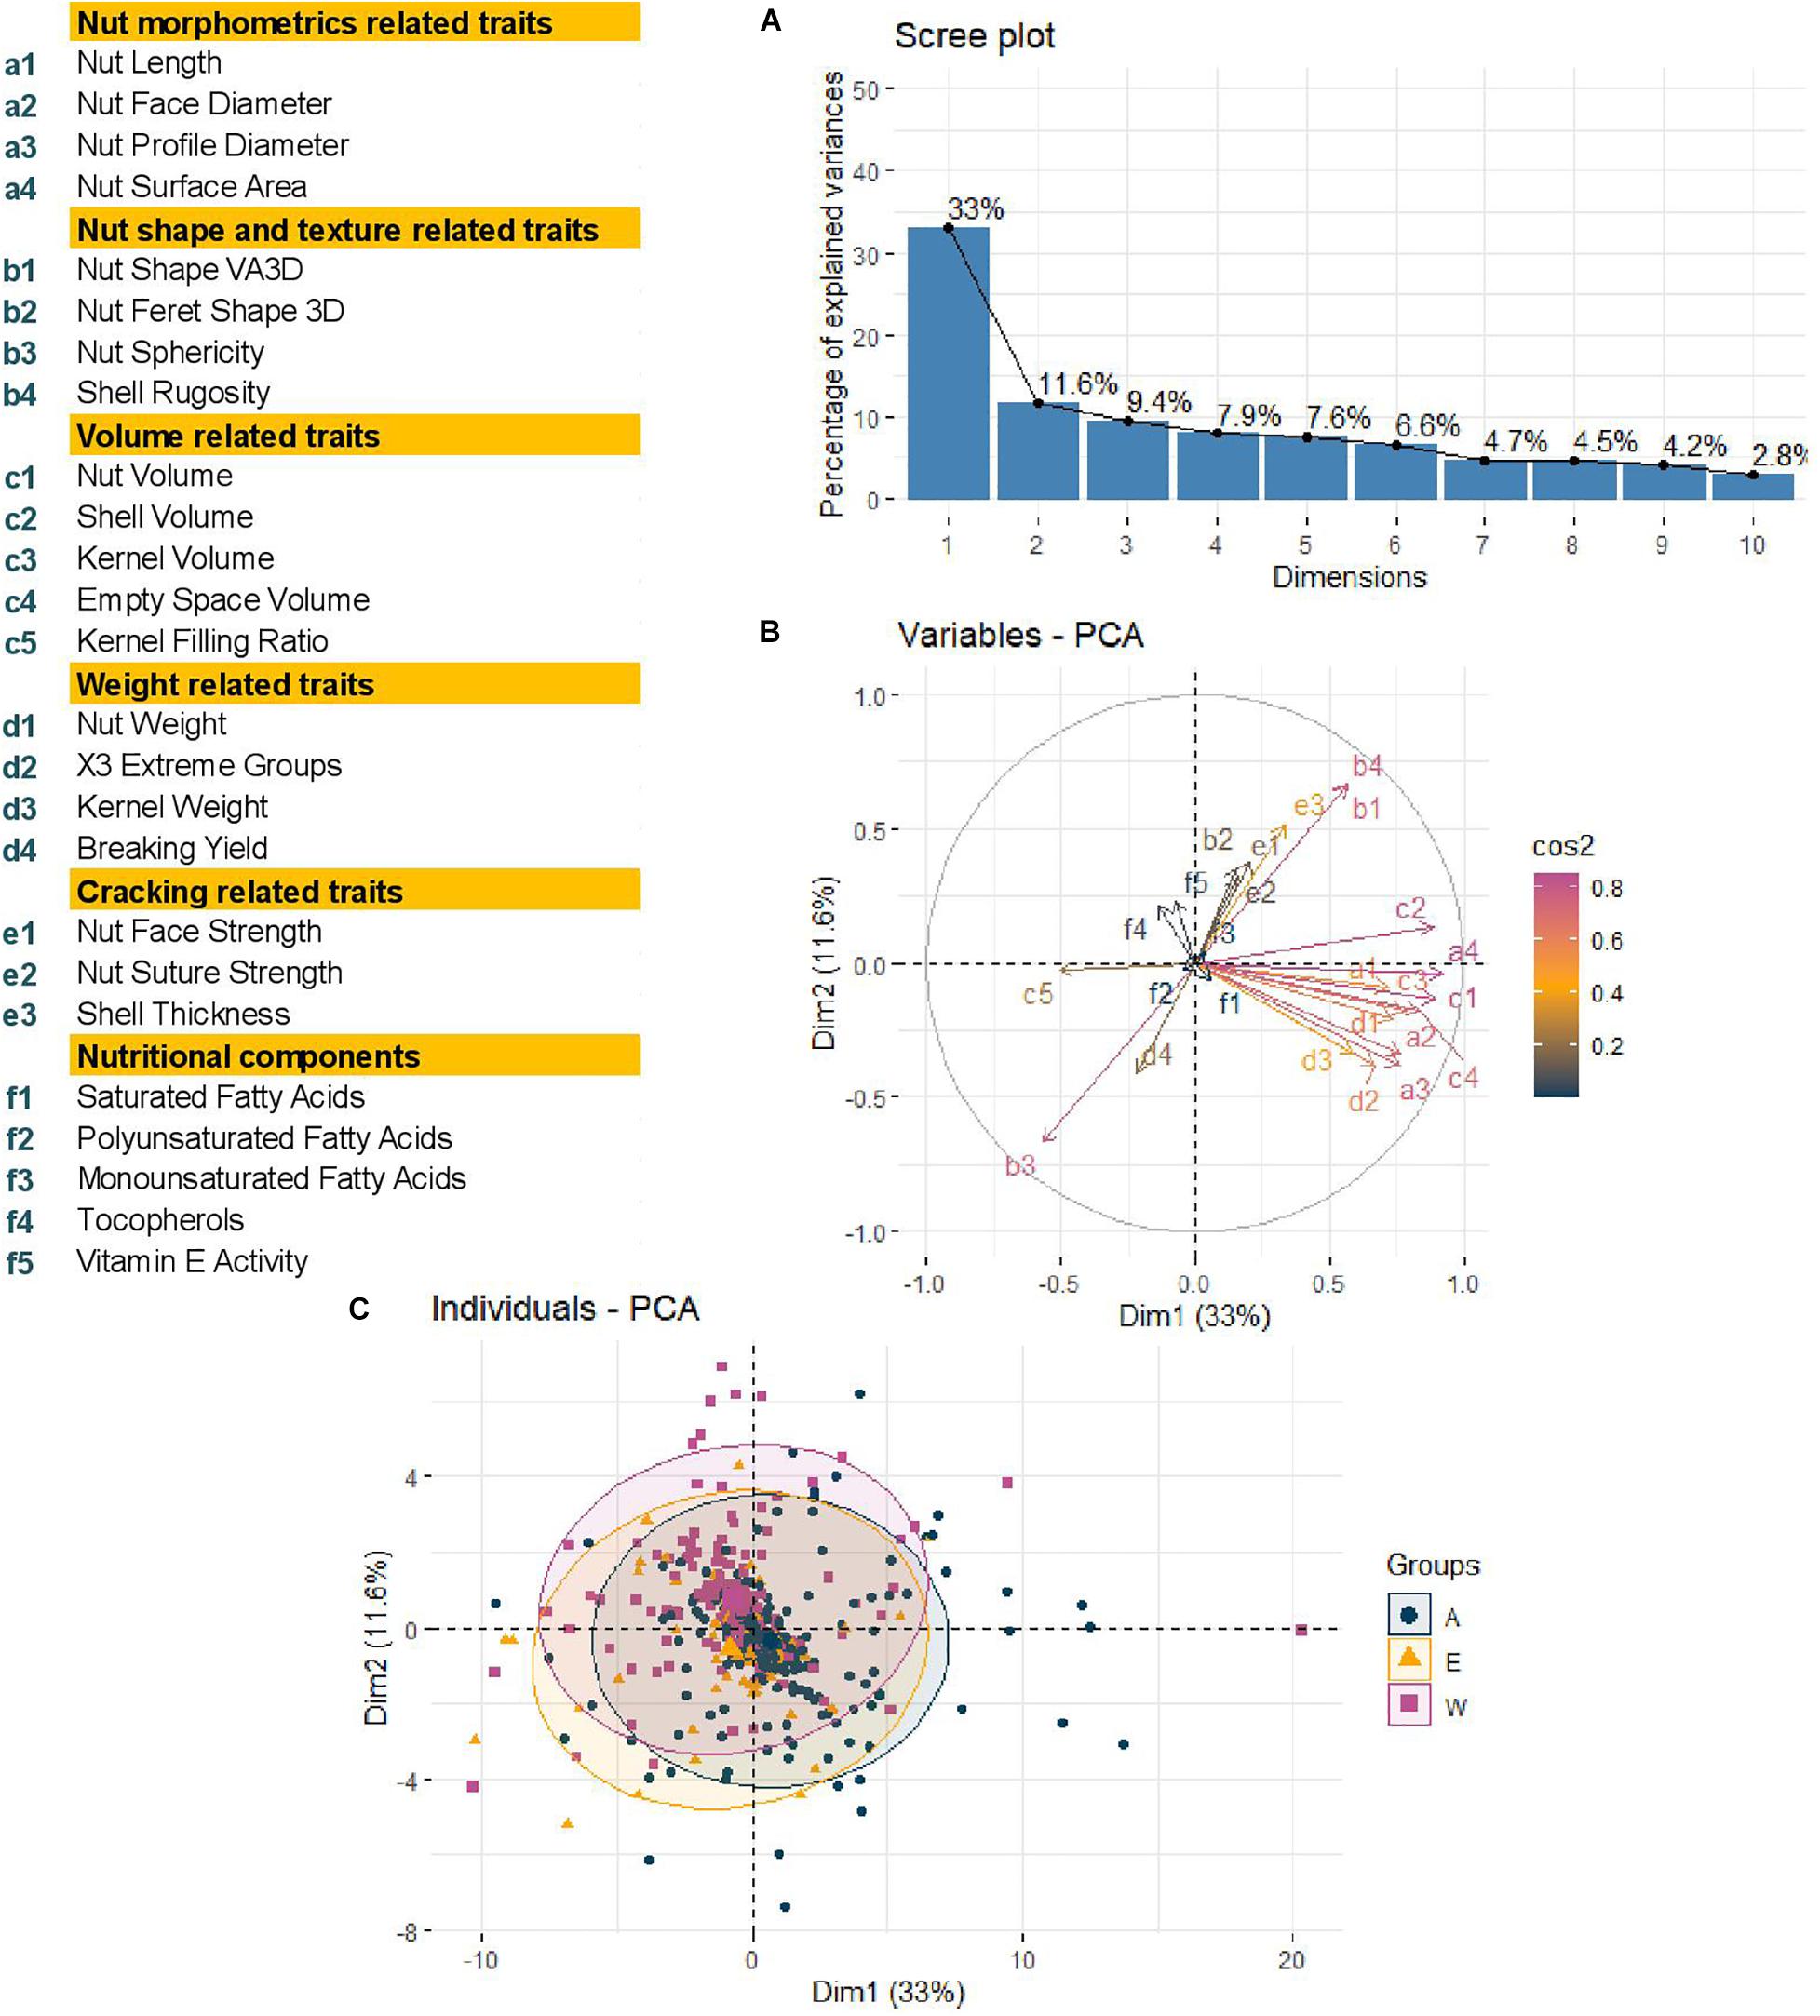
Figure 3. Principal Component Analysis performed using phenotypic raw dataset of the walnut GWAS analysis. (A) Scree plot indicating the percentage of explained variances of the first 10 dimensions. (B) Variables circular plot indicating the cos2 of the 25 traits for the two first two dimensions. (C) Individual scatterplot indicating the accessions colored by results of structure analysis previously performed. Groups: A, admixed, E, Eastern Europe and Asia, W, Western Europe and America.
MTAs for Fruit Traits
In Manhattan plots, the –log10 of the p-value were equal to 7.56, giving 37 MTAs using 1% Bonferroni threshold automatically implemented in GAPIT. By using 5% Bonferroni threshold, the –log10 of the p-value were equal to 6.86, giving 58 significant MTAs in total (Figures 4–6). We found on average 3.2 MTAs per trait. For instance, we found MTAs on chromosomes (Chr) 5, 8, 11, and 15 for nut length (Figure 4), on Chr6, 7, 9, 14 for nut volume (Figure 5) and on Chr1, 3, 6, 8, and 12 for nut weight (Figure 6). Most of the significant MTAs were obtained using the FarmCPU model, whereas the MLMM approach identified two SNPs associated with both tocopherols content and vitamin E activity (Supplementary Figure 3). However, the Manhattan plots indicated strong similarities between both MLMM and FarmCPU models for all traits, even if the signals obtained with the MLMM were below the significant thresholds. We found no significant associations for 6 traits: nut shape VA3D, nut sphericity, nut rugosity, shell volume, saturated and polyunsaturated fatty acids content (Supplementary Figure 3).
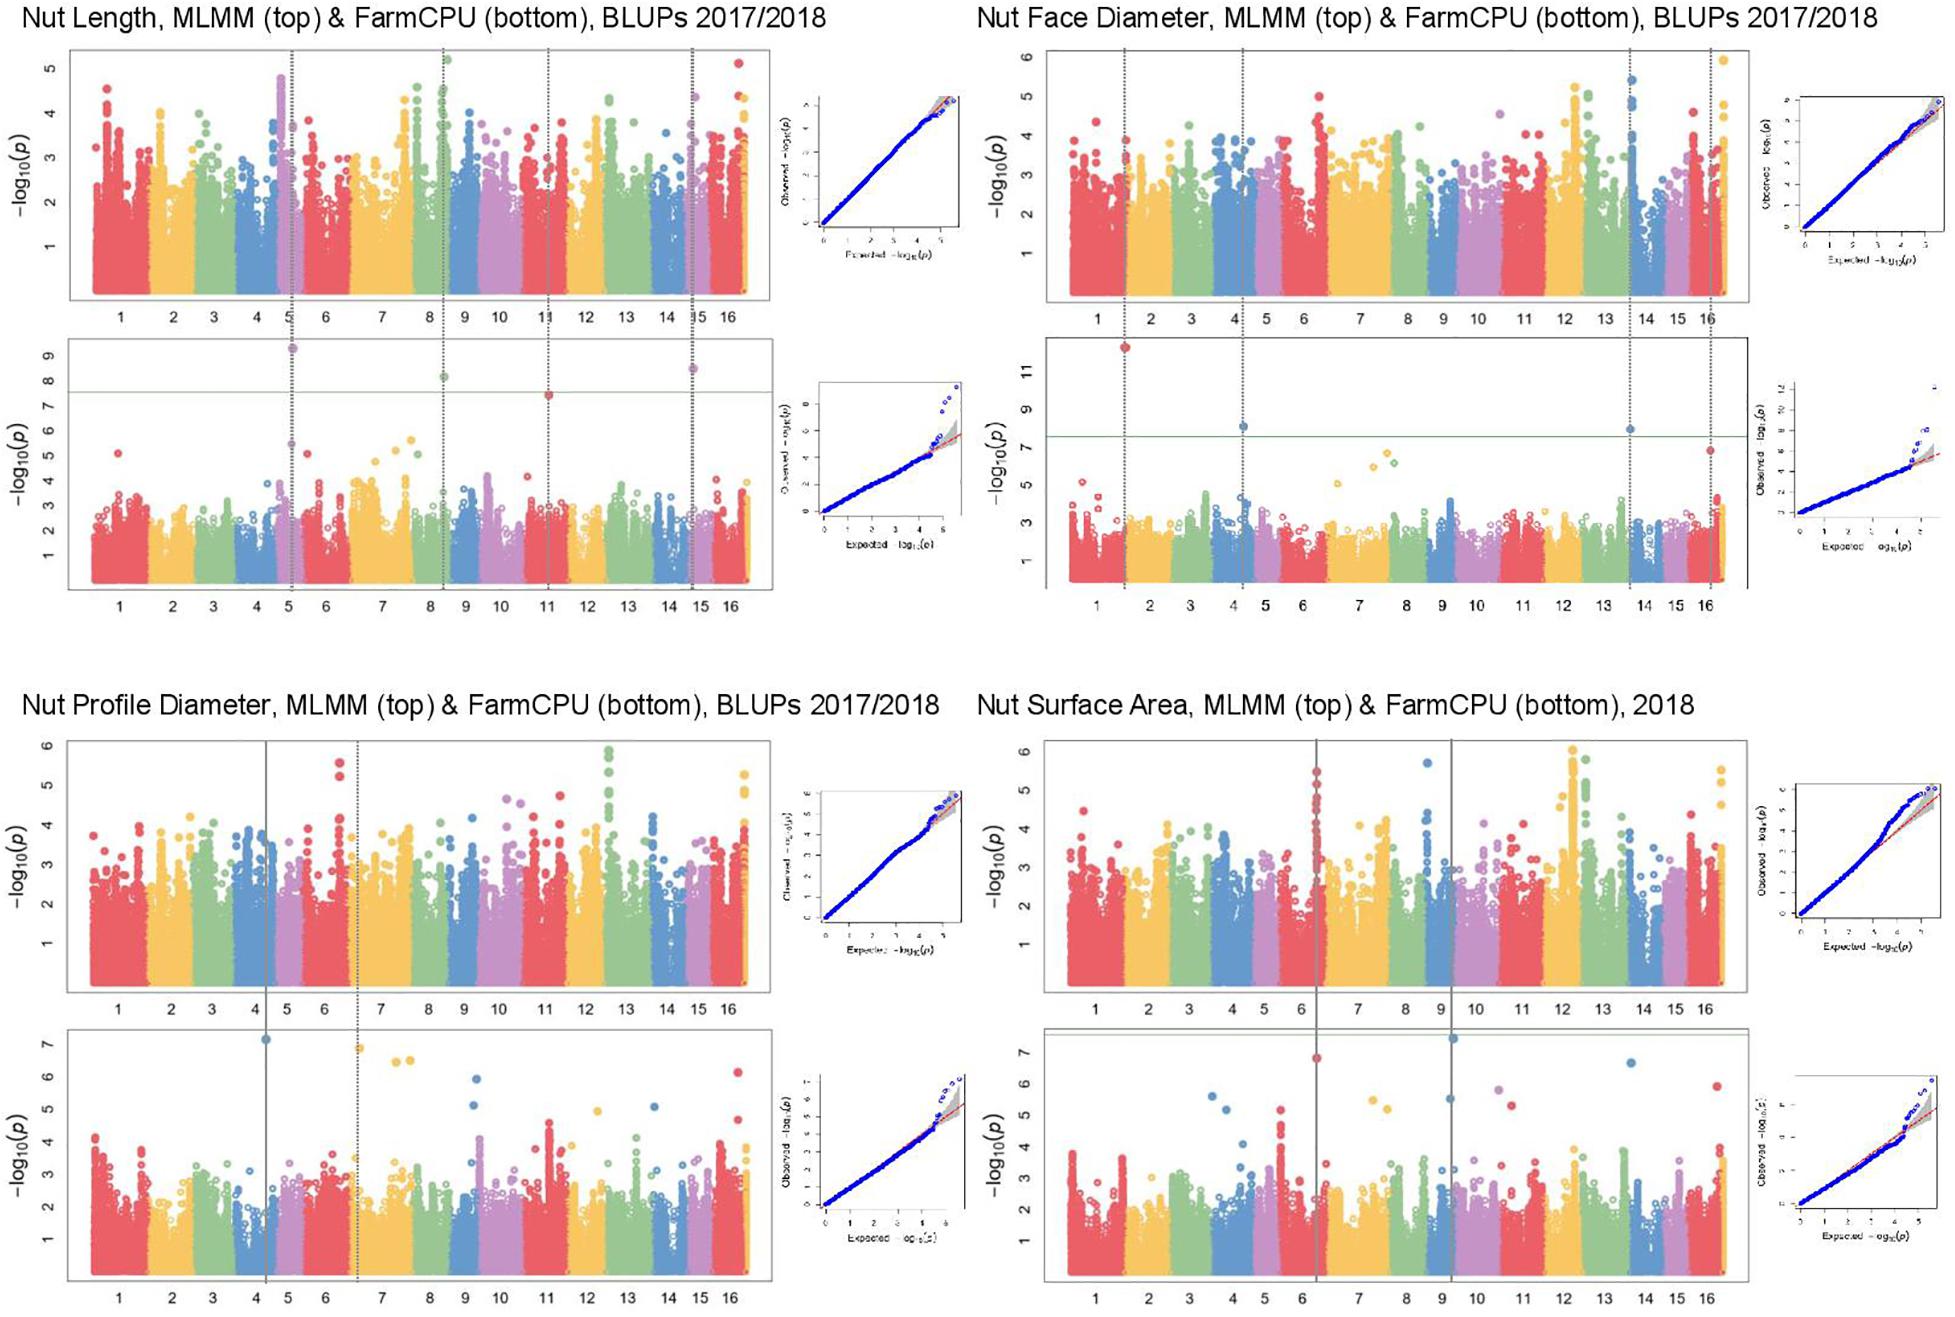
Figure 4. Manhattan plots of nut morphometrics related traits in the walnut GWAS analysis. For each trait, MLMM Manhattan plot and Q-Q plot are shown at the top, and FarmCPU Manhattan plot and Q-Q plot are shown at the bottom. Horizontal green line corresponds to 1% Bonferroni threshold automatically implemented in GAPIT.

Figure 5. Manhattan plots of volume related traits in the walnut GWAS analysis. For each trait, MLMM Manhattan plot and Q-Q plot are shown at the top, and FarmCPU Manhattan plot and Q-Q plot are shown at the bottom. Horizontal green line corresponds to 1% Bonferroni threshold automatically implemented in GAPIT.
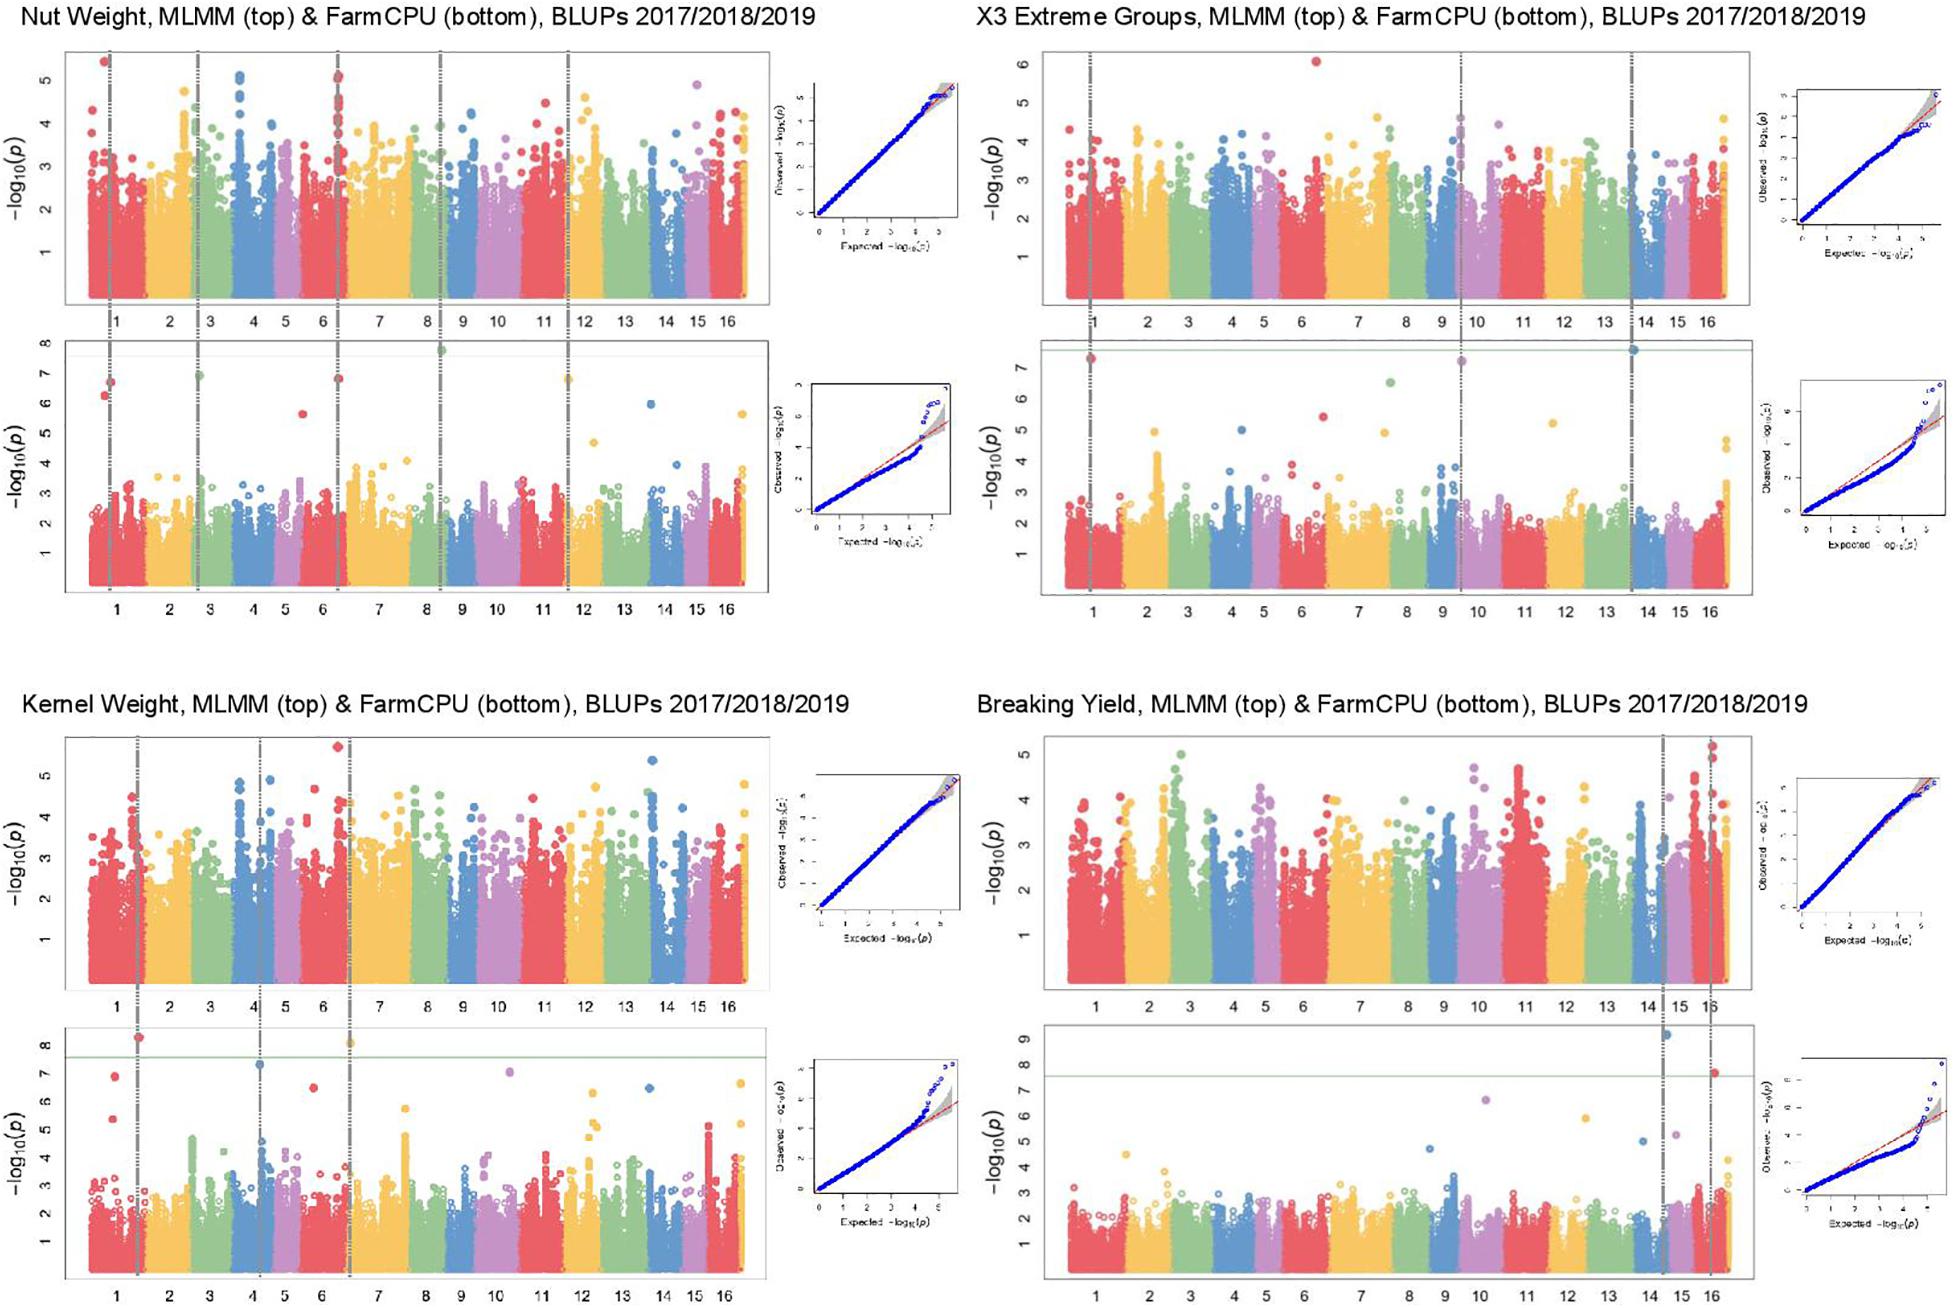
Figure 6. Manhattan plots of weight related traits in the walnut GWAS analysis. For each trait, MLMM Manhattan plot and Q-Q plot are shown at the top, and FarmCPU Manhattan plot and Q-Q plot are shown at the bottom. Horizontal green line corresponds to 1% Bonferroni threshold automatically implemented in GAPIT.
For some of the correlated traits, we detected MTAs which were very close or even at the same physical position, that we called loci of interest (LOI) (Table 2). For instance, MTA AX-171125096 (Chr4, 26,041,265 bp) was associated with both nut face diameter (R2 = 19.80) and nut profile diameter (R2 = 16.50), even though the single traits exhibited additional associations signals on other chromosomes (e.g., on Chr1 for the nut face diameter and on Chr7 for the nut profile diameter). This locus was referred as LOI2 in Table 2. Moreover, MTA AX-170690867 (Chr14, 1,248,953 bp) was associated with nut face diameter, nut volume, and kernel volume, and was only 119 bp apart from MTA AX-171170293 associated with “x3 extreme groups” trait. This locus included these two MTAs, was referred to LOI3 (Table 2). Similarly, the MTA AX-170984383 on Chr9 for nut surface area was also found for nut volume and empty space volume (referred as LOI4).
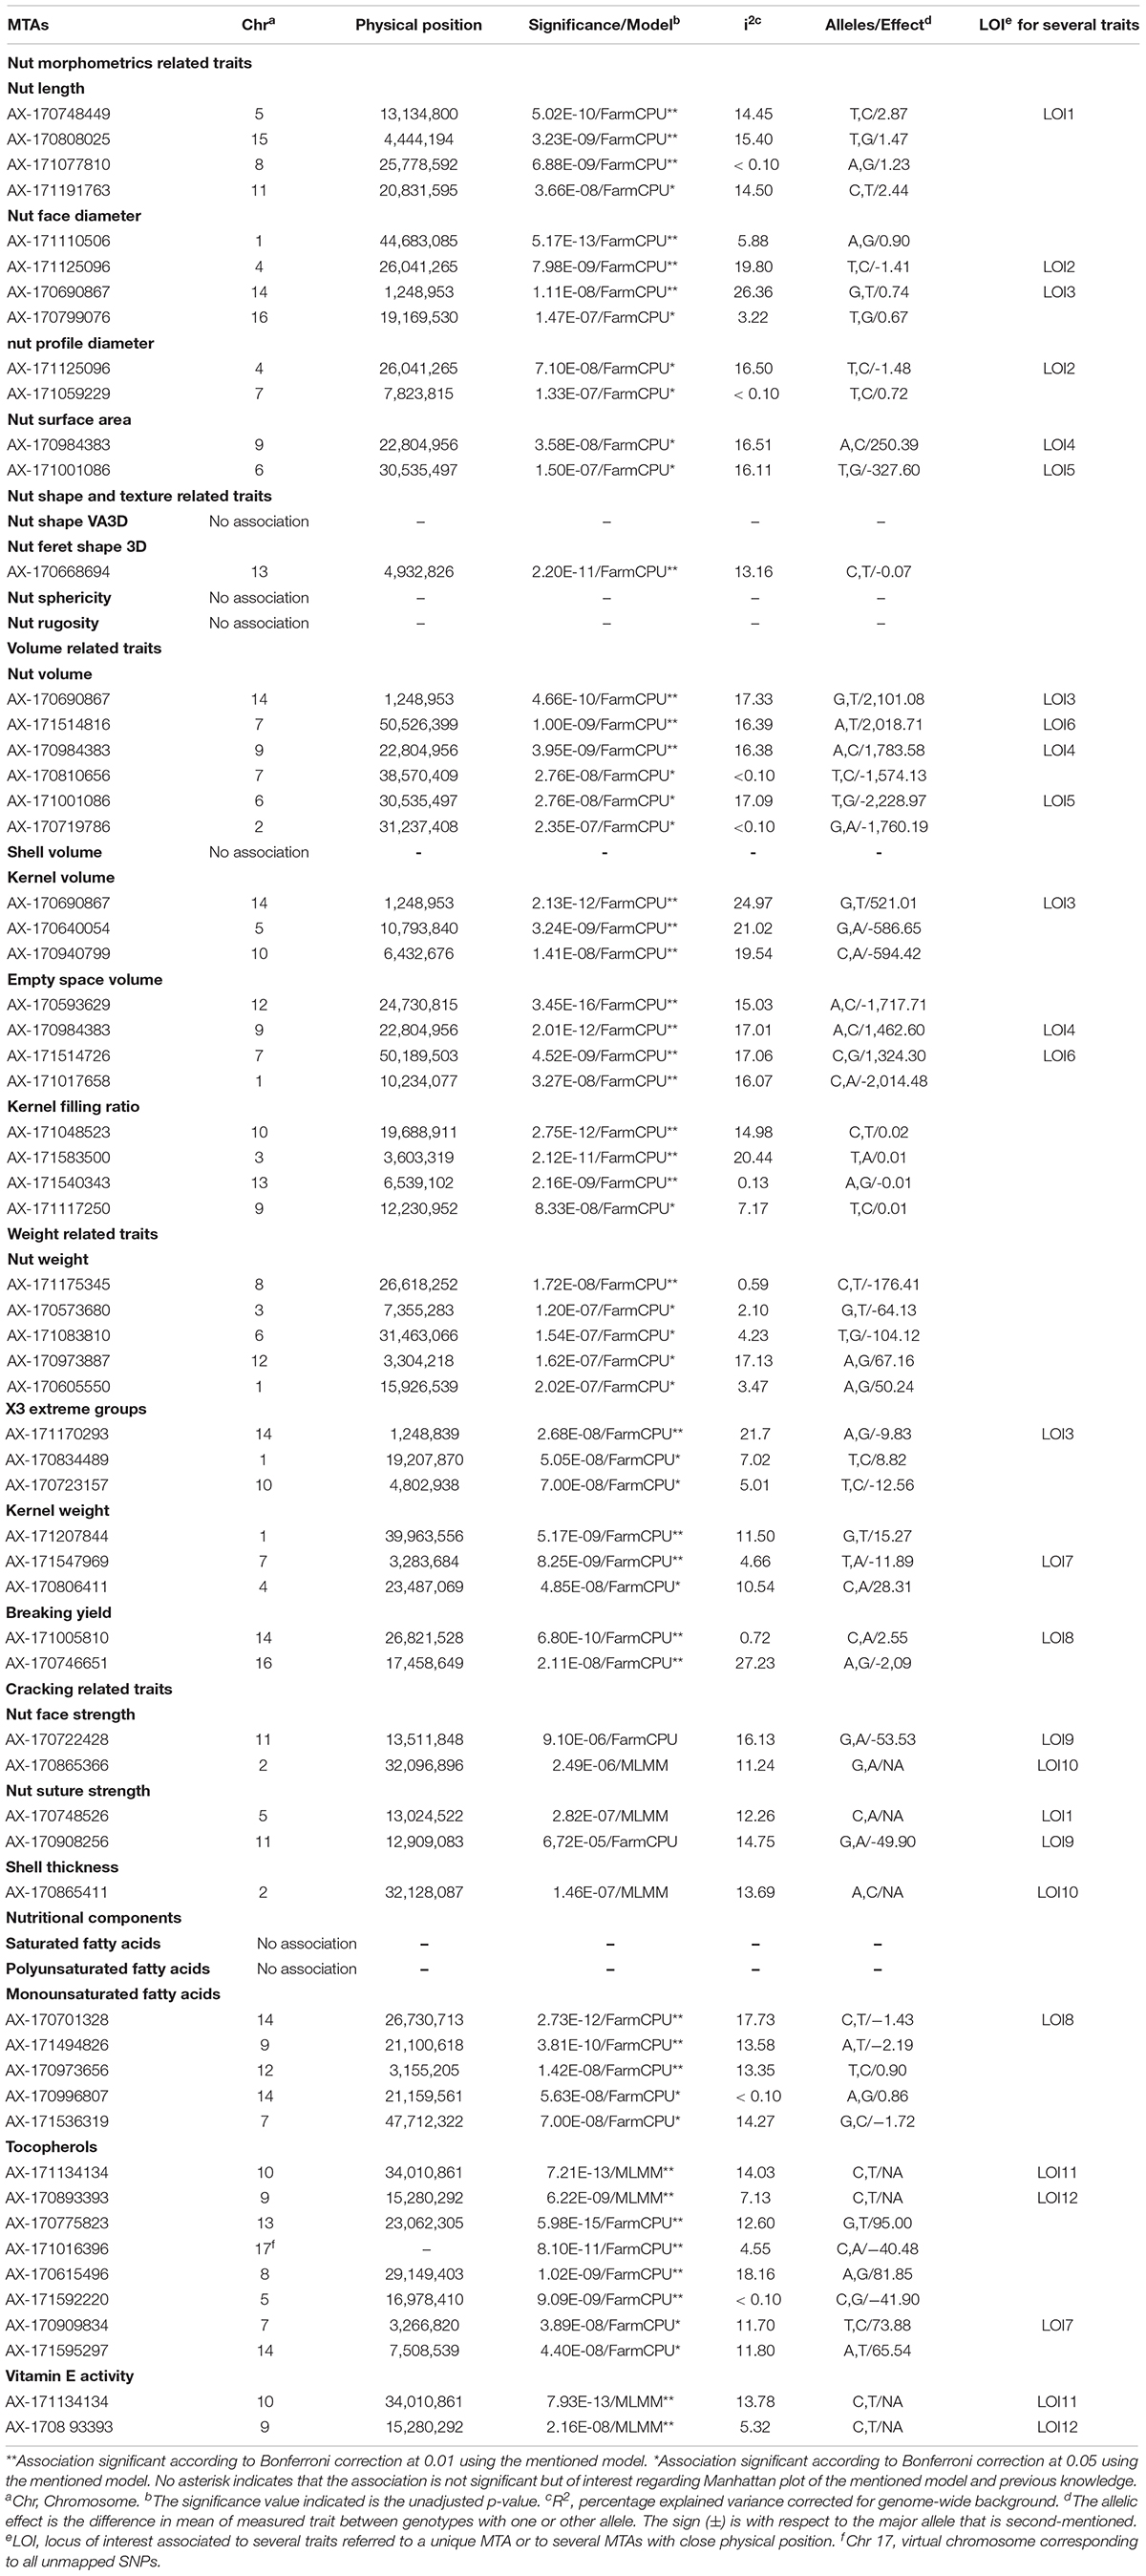
Table 2. List of the MTAs identified for the 25 traits studied in the walnut GWAS analysis with their position, significance and effect.
For the cracking-related traits, no signals passed the significant thresholds. However, we observed interesting peaks on Chr2 and 11 for nut face strength, on Chr5 and 11 for nut suture strength, and on Chr2 for shell thickness, which was very close to the one found with the nut face strength (Table 2). Since significant associations on Chr5 and 11 for the suture strength have been previously reported, we decided to explore and discuss further these signals.
LD Blocks and Candidate Genes
Using the “solid spine of LD” method, we found differences in LD level around the MTAs. The LOI3, including the MTA AX-170690867 (Chr14, 1,248,953 bp) associated with nut face diameter, nut volume, and kernel volume, and the MTA AX-171170293 (Chr14, 1,248,839 bp) linked with “x3 extreme groups,” belong to a very short LD block of 814 bp (Table 3). On the contrary, the LD block around the MTA AX-171514816 on Chr7, associated with nut volume, extends for 139,342 bp. We also found several loci in complete linkage equilibrium, such as the MTA AX-171001086 (Chr6, 30,535,497 bp), associated with the nut surface area, which did not belong to any block.
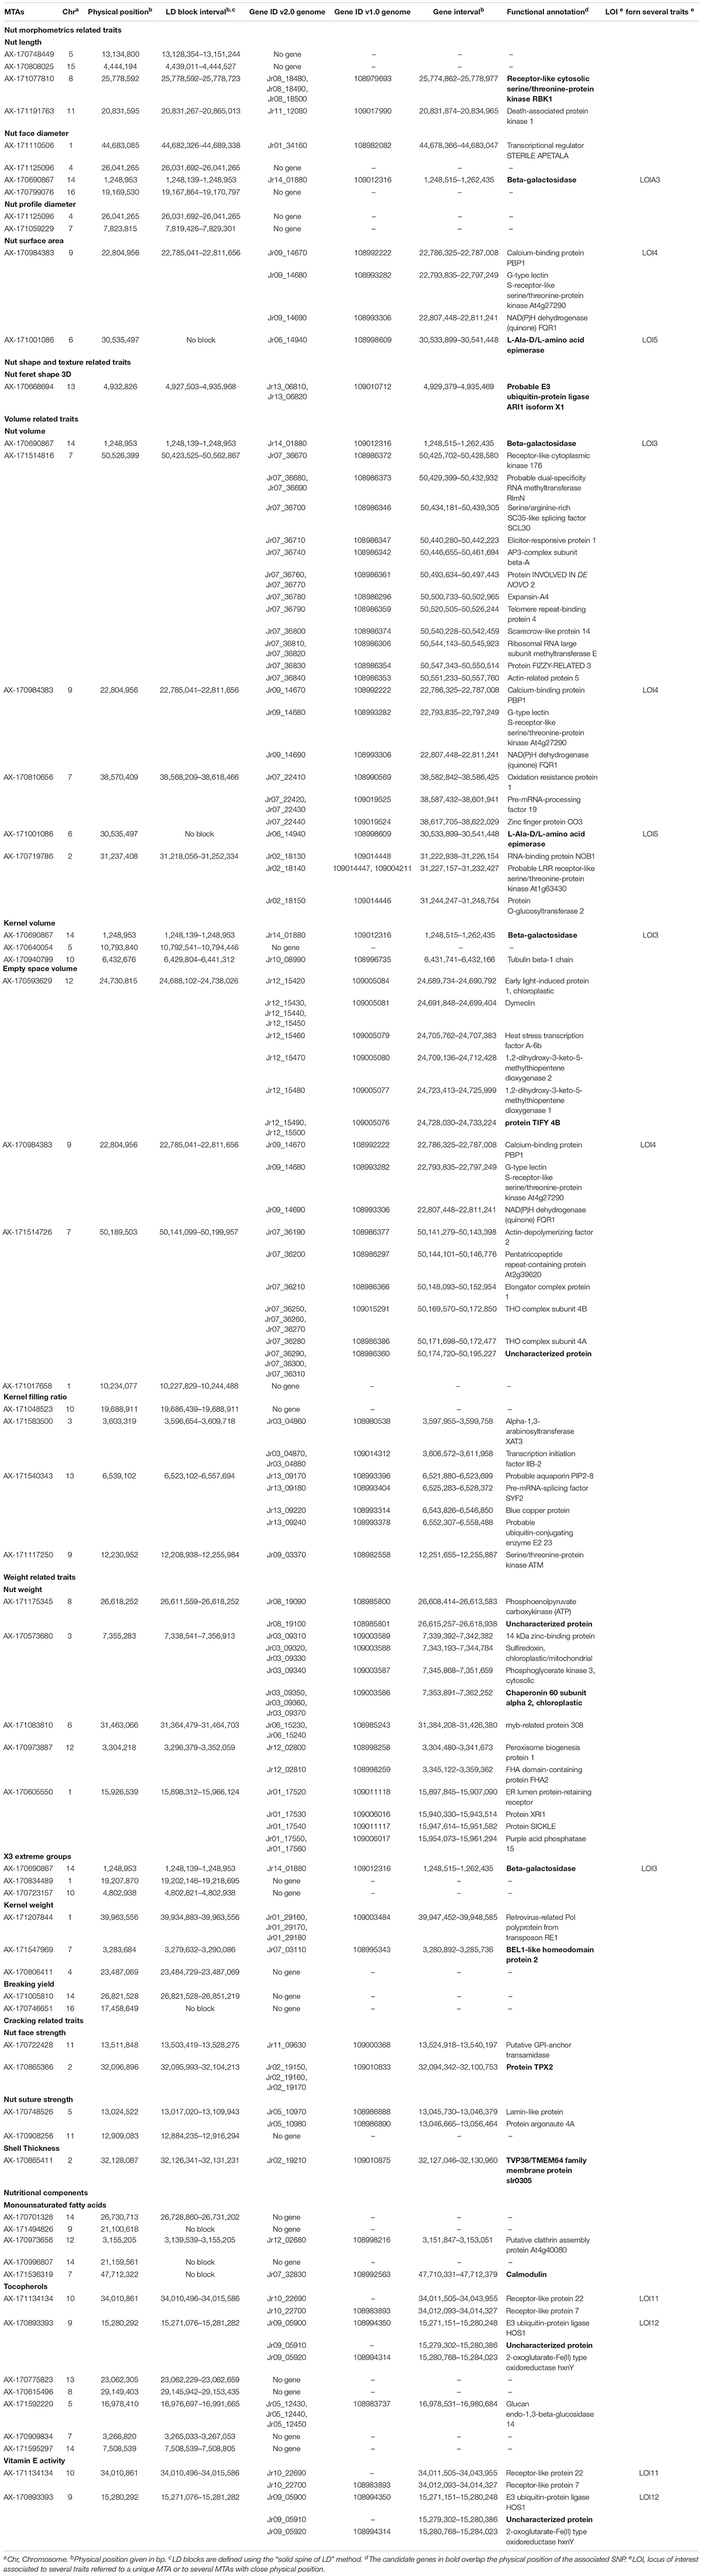
Table 3. List of the MTAs for 25 walnut traits with the candidate genes located in the corresponding LD block.
We identified a total of 75 different candidate genes within all the LD blocks (Table 3), with 13 candidate genes including some of the MTAs. Regarding nut morphometrics, shape, volume, and weight related traits, a gene coding for a beta-galactosidase was found to be associated with nut face diameter, nut volume, kernel volume, and the “x3 extreme groups.” We found a receptor-like cytosolic serine/threonine-protein kinase RBK1 encoding gene for nut length, and an L-Ala-D/L-amino acid epimerase encoding gene associated with nut surface area and nut volume. We also found a probable E3 ubiquitin-protein ligase ARI1 encoding gene linked with the nut Feret shape 3D, and a protein TIFY 4B encoding gene linked with empty space volume. Then, a chaperonin 60 subunit alpha 2, chloroplastic and a BEL1-like homeodomain protein 4 encoding genes were found to be associated, respectively, with nut weight and kernel weight. In addition, for the cracking related traits, we determined a gene coding for a protein TPX2-like being involved in nut face strength, and a TVP38/TMEM64 family membrane protein encoding gene linked with the shell thickness. Finally, we found a candidate gene linked with the monounsaturated fatty acids content such as a calmodulin encoding gene. Interestingly, the SNP associated with this trait fell within an exonic sequence of this calmodulin encoding gene.
Discussion
The INRAE Walnut Germplasm Collection Has a High Degree of Fruit Phenotypic Variability
The walnut genetic resources of INRAE form an ex situ collection near Bordeaux, France, and gather numerous accessions of different geographical origin (Bernard et al., 2018a). By comparison with other walnut panels used for GWAS, we observed a larger degree of fruit phenotypic variability. For instance, in the panel used in Iran, the range for nut weight was between 7.71 and 20.11 g (Arab et al., 2019), whereas in our panel, combining all the years studied, the range was between 5.22 and 22.51 g. Similarly, in the work on suture strength reported by the University of California, Davis, the use of a texture analyzer to phenotype suture strength showed a variation between 6.94 to 63.14 kg-force (i.e., between 68.06 to 619.19 N) among the 556 accessions studied (mainly from 39 biparental progenies) corresponding to a variation of 551.13 N (Sideli et al., 2020). In our walnut germplasm, with only 170 accessions and combining all the years, the variation extends from 74.40 to 776.97 N. With the high phenotypic variability and the diversity of the INRAE walnut panel used for GWAS analysis, knowing that most of these traits are highly quantitative, we may expect to find major loci involved in their variation.
MTAs of Correlated Traits Are Not Impacted by Different Phenotyping Methods
In our study, we attempted to improve the accuracy of phenotyping procedures for several traits across the following phenotyping years. This is the case for three of the nut morphometrics related traits: in 2017, we used an electronic caliper to measure nut length, nut face diameter, and nut profile diameter, but we decided to develop an X-ray CT method for the nuts phenotyped in 2018. We had some doubts concerning the impact of changing our phenotyping method on the GWAS results. However, the resulting BLUPs were reliable since we found a significant association on Chr14 for nut face diameter, which was also detected for nut volume and kernel volume, only measured in 2018 and for which no BLUPs were calculated. In addition, the three traits were significantly positively correlated.
Nut face diameter, nut volume, and kernel volume were all correlated traits and the MTA AX-170690867 on Chr14 in the LOI3 is associated with all of them (minor allele G: frequency 0.30, and major allele T: frequency 0.70), with major allele having a positive effect (+0.74 BLUPs unit, +2,101.08 mm3 and + 521.01 mm3, respectively). The trait “x3 extreme groups” was associated with the MTA AX-171170293 on Chr14 also in the LOI3 (minor allele A: frequency 0.47, and major allele G: frequency 0.53), with major allele having a negative effect (−9.83 BLUPs unit). The LOI3 including the two MTAs (AX-170690867 and AX-171170293) and two additional SNPs, was a haplotype block with five haplotypes, of which the one of interest had a frequency of only 0.23. The two MTAs were in moderate LD (r2 = 0.37) and belonged to the sequence of a beta-galactosidase encoding gene. This finding suggests that almost equivalent traits might be considered as a simple “repetition” of the phenotyping, leading preferentially to the detection of the major locus.
Although nut size is a complex trait, the association on Chr14 controlled three different dimensions of nut (nut face diameter, nut volume, and kernel volume), suggesting its crucial role in determining nut size. The explained phenotypic variance (R2) at this locus was high for each of the three traits (i.e., for nut face diameter: 26.36 vs. 19.80, 5.88, and 3.22). However, by phenotyping correlated traits, we were able to detect minor and more specific loci involved in nut size. For instance, if nut volume and kernel volume are sharing the major association on Chr14, we found other specific minor associations. These findings have implications for selection: if it is possible to select superior genotypes for bigger nut size in general (MTA on Chr14), it remain possible for instance, to select for bigger kernel volume using only minor loci.
Comparison of MTAs Detected in Other Germplasm Collections for Similar Traits
For cracking related traits, using different phenotyping methods and FarmCPU model, the MTA AX-170748528 (Chr5, 13,023,760 bp) was found to be associated with the suture strength (Sideli et al., 2020). This MTA was only 762 bp apart from the SNP just below the significant threshold obtained for the suture strength initial rupture. These two SNPs are located in the same region close to a gene coding for a lamin-like protein. Similarly, three MTAs were identified on the Chr11 using FarmCPU model, depending on the phenotype recorded with texture analyzer (Sideli et al., 2020). The genomic region spans from 10,995,387 bp to 13,714,234 bp. We found one suggestive association signal within this interval (at 12,909,083 bp). The walnut germplasm collections of INRAE and University of California, Davis, share numerous accessions, such as “Chandler,” “Robert Livermore,” “Vina,” and diverse representing accessions from China, Japan, and France. The two germplasm collections are also related, since many parents of common California varieties are French (Marrano et al., 2019a). The shared genetic background can explain why we found the same major loci. However, our GWAS panel was smaller compared to Sideli et al. (2020), and this could be the reason we did not obtain significant marker association with this trait.
On the contrary, we did not find any association in common with the association study performed on nut traits by Arab et al. (2019). This study was based on a panel of 95 genotypes representing local populations across four different Iranian areas from valleys to mountains. The panel represented a large part of Iranian walnut populations’ genetic diversity that is not represented in our panel, explaining why we found different results. This means that our markers can be used at University of California, Davis, for the selection of superior genotypes, but they will be less efficient at the University of Tehran, and vice versa. This finding proves the difficulty to develop markers for selection on a global scale (Mohammadi et al., 2020), and that it will be important to create a large and more diverse collection of walnut accessions for future work, representing the genetic diversity across the world.
Contribution to Better Understanding of the Genetic Control of Fruit Quality
Nut size results from a complex signaling pathway involving cell division and expansion. Serine/threonine kinases are enzymes catalyzing the phosphorylation from ATP to an amino acid residue (Diallo and Prigent, 2011). Several studies suggested that receptor-like cytosolic kinases contribute to plant development, particularly in cell wall function (Muto et al., 2004; Steinwand and Kieber, 2010) and cell morphogenesis (Becraft, 2002). Similarly, beta-galactosidases are enzymes catalyzing hydrolyzation of galactosyl residues of hemicellulose and pectin from the cell wall (Smith and Gross, 2000; Yang et al., 2018), and L-Ala-D/L-amino acid epimerases are enzymes catalyzing the epimerization of various dipeptides (Lukk et al., 2012), involved in the peptidoglycan pathway, essential for cell wall integrity in bacteria, but also in land plants, although lacking in those peptidoglycans (Yang et al., 2013). The beta-galactosidase, L-Ala-D/L-amino acid epimerase-like, and receptor-like cytosolic serine/threonine-protein kinase RBK1 are therefore interesting candidate genes involved in nut morphometrics.
Along with nut size, kernel weight and the easiness of cracking are important traits for walnut quality. We found a BEL1-like homeodomain protein 4 encoding gene as involved in kernel weight. In Arabidopsis thaliana, BEL1 protein is a commonly found transcription factor required for ovule morphogenesis (Modrusan et al., 1994), whereas in potato, BEL1-type proteins enhance tuberization (Sharma et al., 2014). Therefore, BEL1 is likely involved in determining kernel weight in walnut. In addition, we found a protein TPX2-like encoding candidate gene for nut face strength. TPX2 is a protein phosphorylated during mitosis interphase acting as a spindle assembly factor for microtubules in the nucleus, and is therefore crucial for cell division.
Using the “solid spine of LD” for the definition of the LD blocks, we highlighted complementary candidate genes for several MTAs. Nut volume is the trait with the highest number of candidate genes found. In addition to the gene coding for a beta-galactosidase related to the most significant association on Chr14, we found an expansin-A4 and a scarecrow-like protein 14 encoding genes on Chr7, involved in loosening of cell wall during growth (Cosgrove, 2000) and flower bud transition (Quan et al., 2019). We also found a calcium-binding protein PBP1 encoding gene on Chr9, supporting the central role of calcium during fruit growth when Ca2+ uptake increases (Song et al., 2018). As Sideli et al. (2020), we identified a gene encoding a lamin-like protein for nut suture strength. Lamins are proteins part of the lamina, providing a mechanical support to the nuclear envelope and also acting on nucleus size and shape (Ciska and Moreno Díaz de la Espina, 2014).
The selection of appropriate model and threshold levels is crucial in GWAS. Among the two models implemented, FarmCPU provided the highest number of significant associations. FarmCPU has a higher detection power than previous GWAS models since it controls for false positives while reducing false negatives; it uses a MLMM divided into fixed effect and random effect model iteratively (Liu et al., 2016). FarmCPU has not been widely used for complex traits in crops because of a lacking comparison with previous existing models. However, MLMM and FarmCPU models have been recently compared using well-known GWAS dataset of soybean and maize, and the authors confirm FarmCPU’s ability to outperform previous GWAS models (Kaler et al., 2020). In addition, the authors claim that MLMM did not find any significant marker since it uses a too conservative multiple comparison adjustment method. For this reason, we decided to consider also signals below the 1% Bonferroni threshold to avoid false negatives.
First List of Candidate Genes Involved in Fatty Acids and Vitamin E Contents Variation in Kernel
For the first time in walnut, we discovered SNPs and candidate genes associated with monounsaturated fatty acids and tocopherols contents. Primary metabolites in plants such as lipids and vitamins are synthesized by numerous multi-enzymatic complexes, and we found that the significant SNP on Chr7 associated with monounsaturated fatty acids content falls within a gene coding for a calmodulin. In de novo fatty acids synthesis, the fatty acid synthase requires NAD(P)H as cofactor, and the dependent nicotinamide adenine dinucleotide (NAD) signaling is thought to be highly regulated by calmodulin (Tai et al., 2019). However, additional phenotyping data are necessary to confirm the MTAs and the candidate genes identified.
Conclusion
By combining a highly accurate characterization of crucial traits for walnut quality with a high diverse walnut germplasm collection, a dense SNP genotyping, and newly available multi-locus models, we identified numerous MTAs, particularly for traits related to nut size. We confirmed major loci involved in suture strength, and we proposed candidate genes for fruit quality, mainly linked to cell wall function and calcium signaling. After phenological traits, the INRAE walnut germplasm collection proved its suitability for GWAS. It will make easy to select genitors allowing future release of new walnut cultivars meeting the criteria required by both consumers and producers.
Data Availability Statement
The datasets presented in this study can be found in online repositories. The names of the repository/repositories and accession number(s) can be found below: https://doi.org/10.15454/XPKII8, Portail Data INRAE.
Author Contributions
AB performed all the genetic analyzes and wrote the manuscript. JC assisted AB in performing, analyzing, and interpreting the data of weight and cracking related traits. AD and AM provided their experience in GWAS to interpret the results. ED, FL, and AB conceived and coordinated the research. All authors revised the manuscript.
Funding
This work has been mainly funded by the Nouvelle-Aquitaine Region in the project “INNOV’noyer,” coordinated by the CTIFL, and in partnership with the INRAE of Bordeaux. This work has been also funded by the “Cifre” convention number 2016/1558 of ANRT (Agence Nationale de la Recherche et de la Technologie). INRAE funded part of the Ph.D. grant of AB. Postdoctoral fellowship for AD was funded by the Nouvelle-Aquitaine Region project 2018-1R 20203 “CerGEn.” We thank the GIS Fruits for the funding of the Master fellowship of JC. To finish, AB thanks the “Initiative d’Excellence” program of the University of Bordeaux and the “Dufrenoy-Crédit Agricole d’Ile-de-France Mécénat” grant for contributing to the funding of his Ph.D.
Conflict of Interest
The authors declare that the research was conducted in the absence of any commercial or financial relationships that could be construed as a potential conflict of interest.
Acknowledgments
We thank the Fruit Tree Experimental Unit of the INRAE in Toulenne and the Prunus/Juglans Genetic Resources Center for the maintenance of the collection and for helping us to collect the fruits. We want to thank the GIS Fruits consortium for the funding of the Master’s degree fellowship of JC. We acknowledge the GEVES for X-ray CT analyzes. The measurements were performed on a phenotyping platform, PHENOTIC, dedicated to instrumentation and imagery for seeds, seedlings and plants in Angers, France (https://www6.inrae.fr/phenotic/; https://doi.org/10.15454/U2BWFJ). We acknowledge the ITERG laboratory in Canéjan, France, for the fatty acids and tocopherols quantifications (http://iterg.com/index.php/fr/home/). Then, the CTIFL, holder of the project “INNOV’noyer,” in partnership with the INRAE of Bordeaux, want to thank the “Région Nouvelle-Aquitaine,” and “Cifre” convention of “ANRT” (Agence Nationale de la Recherche et de la Technologie). It is also important to note that the project is supported by the “Agri Sud-Ouest Innovation” competitiveness cluster.
Supplementary Material
The Supplementary Material for this article can be found online at: https://www.frontiersin.org/articles/10.3389/fpls.2020.607213/full#supplementary-material
Supplementary Figure 1 | Histograms of the 25 studied traits for each year of evaluation for the walnut GWAS analysis.
Supplementary Figure 2 | Manhattan plots of traits related to fruit shape, cracking and nutritional components studied in the walnut GWAS analysis. For each trait, MLMM Manhattan plot and Q-Q plot are shown at the top, and FarmCPU Manhattan plot and Q-Q plot are shown at the bottom. Horizontal green line corresponds to 1% Bonferroni threshold automatically implemented in GAPIT.
Supplementary Table 1 | Description of the 25 studied traits with the methodologies used for the different years of evaluation, for the walnut GWAS analysis.
Supplementary Table 2 | Phenotypic raw dataset of the 25 traits studied in the walnut GWAS analysis.
Footnotes
References
Ahandani, E. A., Ramandi, H. D., Sarmad, J., Samani, M. A., Yavari, A., Ahandani, R. A., et al. (2014). Evaluation of morphological diversity among some Persian walnut accessions (Juglans regia L.) in Guilan, northern Iran. Int. J. Plant Biol. Res. 2, 1015–1022.
Arab, M. M., Marrano, A., Abdollahi-Arpanahi, R., Leslie, C. A., Askari, H., Neale, D. B., et al. (2019). Genome-wide patterns of population structure and association mapping of nut-related traits in Persian walnut populations from Iran using the Axiom J. regia 700K SNP array. Sci. Rep. 9:6376. doi: 10.1038/s41598-019-42940-1
Aradhya, M. K., Potter, D., and Simon, C. J. (2006). “Cladistic biogeography of juglans (juglandaceae) based on chloroplast DNA intergenic spacer sequences,” in Darwins Harvest New Approaches Orig. Evol. Conserv. Crops, eds T. J. Motley, N. Zerega, and H. Cross (New-York: Columbia University Press), 143–170. doi: 10.7312/motl13316-008
Barrett, J. C., Fry, B., Maller, J., and Daly, M. J. (2005). Haploview: analysis and visualization of LD and haplotype maps. Bioinformatics 21, 263–265. doi: 10.1093/bioinformatics/bth457
Bates, D., Maechler, M., Bolker, B., and Walker, S. (2015). Fitting linear mixed-effects models using lme4. J. Stat. Softw. 67, 1–48. doi: 10.18637/jss.v067.i01
Becraft, P. W. (2002). Receptor kinase signaling in plant development. Annu. Rev. Cell Dev. Biol. 18, 163–192. doi: 10.1146/annurev.cellbio.18.012502.083431
Bernard, A., Lheureux, F., and Dirlewanger, E. (2018b). Walnut: past and future of genetic improvement. Tree Genet. Genomes 14:1. doi: 10.1007/s11295-017-1214-0
Bernard, A., Barreneche, T., Lheureux, F., and Dirlewanger, E. (2018a). Analysis of genetic diversity and structure in a worldwide walnut (Juglans regia L.) germplasm using SSR markers. PLoS One 13:e0208021. doi: 10.1371/journal.pone.0208021
Bernard, A., Hamdy, S., Le Corre, L., Dirlewanger, E., and Lheureux, F. (2020a). 3D characterization of walnut morphological traits using X-ray computed tomography. Plant Methods. 16:115. doi: 10.1186/s13007-020-00657-7
Bernard, A., Marrano, A., Donkpegan, A., Brown, P. J., Leslie, C. A., Neale, D. B., et al. (2020b). Association and linkage mapping to unravel genetic architecture of phenological traits and lateral bearing in Persian Walnut (Juglans regia L.). BMC Genomics 21:203. doi: 10.1186/s12864-020-6616-y
Burghardt, L. T., Young, N. D., and Tiffin, P. (2017). A Guide to Genome-Wide Association Mapping in plants. Curr. Protoc. Plant Biol. 2, 22–38. doi: 10.1002/cppb.20041
Ciska, M., and Moreno Díaz de la Espina, S. (2014). The intriguing plant nuclear lamina. Front. Plant Sci. 5:166. doi: 10.3389/fpls.2014.00166
Cosgrove, D. J. (2000). Loosening of plant cell walls by expansins. Nature 407, 321–326. doi: 10.1038/35030000
Diallo, A., and Prigent, C. (2011). The serine/threonine kinases that control cell cycle progression as therapeutic targets. Bull. Cancer 98, 1335–1345. doi: 10.1684/bdc.2011.1467
Eskandari, S., Hassani, D., and Abdi, A. (2005). Investigation on genetic diversity of Persian walnut and evaluation of promising genotypes. Acta Hortic. 705, 159–166. doi: 10.17660/ActaHortic.2005.705.18
Furbank, R. T., and Tester, M. (2011). Phenomics – technologies to relieve the phenotyping bottleneck. Trends Plant Sci. 16, 635–644. doi: 10.1016/j.tplants.2011.09.005
Ghasemi, M., Arzani, K., and Hassani, D. (2012). Evaluation and identification of walnut (Juglans regia L.) genotypes in Markazi province of Iran. Crop Breed. J. 2, 119–124.
Harrison, R. D., Gardner, W. A., Tollner, W. E., and Kinard, D. J. (1993). X-ray computed tomography studies of the burrowing behaviour of fourth-instar pecan weevil (Coleoptera: Curculionidae). J. Econ. Entomol. 86, 1714–1719. doi: 10.1093/jee/86.6.1714
Kaler, A. S., Gilman, J. D., Beissinger, T., and Purcell, L. C. (2020). Comparing different statistical models and multiple testing corrections for association mapping in soybean and maize. Front. Plant Sci. 10:1794. doi: 10.3389/fpls.2019.01794
Khadivi-Khub, A., Ebrahimi, A., Sheibani, F., and Esmaeili, A. (2015). Phenological and pomological characterization of Persian walnut to select promising trees. Euphytica 205, 557–567. doi: 10.1007/s10681-015-1429-9
Khosa, I., and Pasero, E. (2014). “Feature extraction in X-ray images for hazelnuts classification,” in Proceedings of the. International Jointt Conference Neural. Networks, (Beijing). doi: 10.1109/IJCNN.2014.6889661
Kim, S., and Schatzki, T. (2001). Detection of pinholes in almonds through X-ray imaging. Trans. ASAE 44, 997–1003. doi: 10.13031/2013.6232
Kotwaliwale, N., Singh, K., Kalne, A., Jha, S. N., Seth, N., Kar, A., et al. (2014). X-ray imaging methods for internal quality evaluation of agricultural produce. J. Food Sci. Technol. 51, 1–15. doi: 10.1007/s13197-011-0485-y
Lê, S., Josse, J., and Husson, F. (2008). FactoMineR: an r package for multivariate analysis. J. Stat. Softw. 25, 1–18. doi: 10.18637/jss.v025.i01
Lipka, A. E., Tian, F., Wang, Q., Peiffer, J., Li, M., Bradbury, P. J., et al. (2012). GAPIT: genome association and prediction integrated tool. Bioinformatics 28, 2397–2399. doi: 10.1093/bioinformatics/bts444
Liu, X., Huang, M., Fan, B., Buckler, E. S., and Zhang, Z. (2016). Iterative usage of fixed and random effect models for powerful and efficient genome-wide association studies. PLoS Genet. 12:e1005767. doi: 10.1371/journal.pgen.1005767
Lukk, T., Sakai, A., Kalyanaraman, C., Brown, S. D., Imker, H. J., Song, L., et al. (2012). Homology models guide discovery of diverse enzyme specificities among dipeptide epimerases in the enolase superfamily. Proc. Natl. Acad. Sci. USA. 109, 4122–4127. doi: 10.1073/pnas.1112081109
Mahmoodi, R., Dadpour, M. R., Hassani, D., Zeinalabedini, M., Vendramin, E., Micali, S., et al. (2019). Development of a core collection in Iranian walnut (Juglans regia L.) germplasm using the phenotypic diversity. Sci. Hortic. 249, 439–448. doi: 10.1016/j.scienta.2019.02.017
Marrano, A., Britton, M., Zaini, P. A., Zimin, A. V., Workman, R. E., Puiu, D., et al. (2020). High-quality chromosome-scale assembly of the walnut (Juglans regia L) reference genome. GigaScience 9:giaa050. doi: 10.1093/gigascience/giaa050
Marrano, A., Martínez-García, P. J., Bianco, L., Sideli, G. M., Di Pierro, E. A., Leslie, C. A., et al. (2019a). A new genomic tool for walnut (Juglans regia L.): development and validation of the high-density AxiomTM J. regia 700K SNP genotyping array. Plant Biotechnol. J. 17, 1027–1036. doi: 10.1111/pbi.13034
Marrano, A., Sideli, G. M., Leslie, C. A., Cheng, H., and Neale, D. B. (2019b). Deciphering of the genetic control of phenology, yield and pellicle color in persian walnut (Juglans regia L.). Front. Plant Sci. 10:1140. doi: 10.3389/fpls.2019.01140
McGranahan, G., and Leslie, C. (2009). “Breeding Walnuts (Juglans regia),” in Breeding Plantation Tree Crops: Temperate Species, eds S. M. Jain and P. M. Priyadarshan (Berlin: Springer Science), 249–273. doi: 10.1007/978-0-387-71203-1_8
Modrusan, Z., Reiser, L., Feldmann, K. A., Fischer, R. L., and Haughn, G. W. (1994). Homeotic transformation of ovules into carpel-like structures in Arabidopsis. Plant Cell 6, 333–349. doi: 10.2307/3869754
Mohammadi, M., Xavier, A., Beckett, T., Beyer, S., Chen, L., Chikssa, H., et al. (2020). Identification, deployment, and transferability of quantitative trait loci from genome-wide association studies in plants. Curr. Plant Biol. 24:100145. doi: 10.1016/j.cpb.2020.100145
Muto, H., Yabe, N., Asami, T., Hasunuma, K., and Yamamoto, K. T. (2004). Overexpression of constitutive differential growth 1 gene, which encodes a RLCK VII-subfamily protein kinase, causes abnormal differential and elongation growth after organ differentiation in Arabidopsis. Plant Physiol. 136, 3124–3133. doi: 10.1104/pp.104.046805
Poggetti, L., Ermacora, P., Cipriani, G., Pavan, F., and Testolin, R. (2017). Morphological and carpological variability of walnut germplasm (Juglans regia L.) collected in North-Eastern Italy and selection of superior genotypes. Sci. Hortic. 225, 615–619. doi: 10.1016/j.scienta.2017.07.056
Quan, S., Niu, J., Zhou, L., Xu, H., Ma, L., and Qin, Y. (2019). Genome-wide identification, classification, expression and duplication analysis of GRAS family genes in Juglans regia L. Sci. Rep. 9:11643. doi: 10.1038/s41598-019-48287-x
Segura, V., Vilhjálmsson, B. J., Platt, A., Korte, A., Seren, Ü, Long, Q., et al. (2012). An efficient multi-locus mixed-model approach for genome-wide association studies in structured populations. Nat. Genet. 44, 825–830. doi: 10.1038/ng.2314
Sharma, P., Lin, T., Grandellis, C., Yu, M., and Hannapel, D. J. (2014). The BEL1-like family of transcription factors in potato. J. Exp. Bot. 65, 709–723. doi: 10.1093/jxb/ert432
Sideli, G. M., Marrano, A., Montanari, S., Leslie, C. A., Allen, B. J., Cheng, H., et al. (2020). Quantitative phenotyping of shell suture strength in walnut (Juglans regia L.) enhances precision for detection of QTL and genome-wide association mapping. PLoS One 15:e0231144. doi: 10.1371/journal.pone.0231144
Song, W.-P., Chen, W., Yi, J.-W., Wang, H.-C., and Huang, X.-M. (2018). Ca distribution pattern in litchi fruit and pedicel and impact of Ca channel inhibitor, La3 +. Front. Plant Sci. 8:2228. doi: 10.3389/fpls.2017.02228
Smith, D. L., and Gross, K. C. (2000). A family of at least seven β-galactosidase genes is expressed during tomato fruit development. Plant Physiol. 123, 1173–1183. doi: 10.1104/pp.123.3.1173
Steinwand, B. J., and Kieber, J. J. (2010). The role of receptor-like kinases in regulating cell wall function. Plant Physiol. 153, 479–484. doi: 10.1104/pp.110.155887
Tai, L., Li, B.-B., Nie, X.-M., Zhang, P.-P., Hu, C.-H., Zhang, L., et al. (2019). Calmodulin is the fundamental regulator of NADK-mediated NAD signaling in plants. Front. Plant Sci. 10:681. doi: 10.3389/fpls.2019.00681
Vahdati, K., Arab, M. M., Sarikhani, S., Sadat-Hosseini, M., Leslie, C. A., and Brown, P. J. (2019). “Advances in Persian Walnut (Juglans regia L.) Breeding Strategies,” in Advances in Plant Breeding Strategies: Nut and Beverage Crops, eds J. Al-Khayri, S. M. Jain, and D. V. Johnson (Switzerland: Springer), 401–472. doi: 10.1007/978-3-030-23112-5_11
Wei, T., and Simko, V. R. (2017). Package “corrplot”: Visualization of a Correlation Matrix (Version 0.84). Available online at: https://github.com/taiyun/corrplot (accessed April 10, 2020).
Wickham, H. (2017). Tidyverse: Easily Install and Load the ‘Tidyverse’. R Package Version 1.2.1. Available online at: https://CRAN.R-project.org/package=tidyverse (accessed April 10, 2020).
Woodworth, R. H. (1930). Meiosis of micro-sporogenesis within the Juglandaceae. Am. J. Bot. 17, 863–869. doi: 10.1002/j.1537-2197.1930.tb04927.x
Yang, H., Liu, J., Dang, M., Zhang, B., Li, H., Meng, R., et al. (2018). Analysis of β-Galactosidase during fruit development and ripening in two different texture types of apple cultivars. Front. Plant Sci. 9:539. doi: 10.3389/fpls.2018.00539
Yang, Z., Wang, Y., Zhou, Y., Gao, Q., Zhang, E., Zhu, L., et al. (2013). Evolution of land plant genes encoding L-Ala-D/L-Glu epimerases (AEEs) via horizontal gene transfer and positive selection. BMC Plant Biol. 13:34. doi: 10.1186/1471-2229-13-34
Keywords: texture analyzer, gas chromatography, HPLC, X-ray CT, fruit traits, GWAS, Juglans regia L., walnut
Citation: Bernard A, Crabier J, Donkpegan ASL, Marrano A, Lheureux F and Dirlewanger E (2021) Genome-Wide Association Study Reveals Candidate Genes Involved in Fruit Trait Variation in Persian Walnut (Juglans regia L.). Front. Plant Sci. 11:607213. doi: 10.3389/fpls.2020.607213
Received: 16 September 2020; Accepted: 10 December 2020;
Published: 08 January 2021.
Edited by:
Agata Gadaleta, University of Bari Aldo Moro, ItalyReviewed by:
Aziz Ebrahimi, Purdue University, United StatesShouvik Das, Indian Agricultural Research Institute (ICAR), India
Ksenija Gasic, Clemson University, United States
Copyright © 2021 Bernard, Crabier, Donkpegan, Marrano, Lheureux and Dirlewanger. This is an open-access article distributed under the terms of the Creative Commons Attribution License (CC BY). The use, distribution or reproduction in other forums is permitted, provided the original author(s) and the copyright owner(s) are credited and that the original publication in this journal is cited, in accordance with accepted academic practice. No use, distribution or reproduction is permitted which does not comply with these terms.
*Correspondence: Elisabeth Dirlewanger, elisabeth.dirlewanger@inrae.fr