 Eduardo Flores-Sandoval
 Facundo Romani
 John L. Bowman
- 1School of Biological Sciences, Monash University, Melbourne, VIC, Australia
- 2Facultad de Bioquímica y Ciencias Biológicas, Centro Científico Tecnológico CONICET Santa Fe, Instituto de Agrobiotecnología del Litoral, Universidad Nacional del Litoral – CONICET, Santa Fe, Argentina
We performed differential gene expression (DGE) and co-expression analyses with genes encoding components of hormonal signaling pathways and the ∼400 annotated transcription factors (TFs) of M. polymorpha across multiple developmental stages of the life cycle. We identify a putative auxin-related co-expression module that has significant overlap with transcripts induced in auxin-treated tissues. Consistent with phylogenetic and functional studies, the class C ARF, MpARF3, is not part of the auxin-related co-expression module and instead is associated with transcripts enriched in gamete-producing gametangiophores. We analyze the Mparf3 and MpmiR160 mutant transcriptomes in the context of coexpression to suggest that MpARF3 may antagonize the reproductive transition via activating the MpMIR11671 and MpMIR529c precursors whose encoded microRNAs target SQUAMOSA-PROMOTER BINDING PROTEIN-LIKE (SPL) transcripts of MpSPL1 and MpSPL2. Both MpSPL genes are part of the MpARF3 co-expression group corroborating their functional significance. We provide evidence of the independence of MpARF3 from the auxin-signaling module and provide new testable hypotheses on the role of auxin-related genes in patterning meristems and differentiation events in liverworts.
Introduction
Transcriptome studies in model systems provide a foundation to characterize genetic pathways in the absence of mutational studies. Transcriptome co-expression studies can highlight how specification of complex phenotypes depends on the activity of coordinated batteries of regulatory genes. In plants, many co-expression analyses focused on secondary metabolite production (Ruprecht et al., 2011; Ruprecht and Persson, 2012; Cassan-Wang et al., 2013; Ferreira et al., 2016; Turco et al., 2017), although co-expressed modules for hormonal genes (Ruprecht et al., 2017b; Singh et al., 2017), or developmental factors have also been described (Ichihashi et al., 2014). The functional significance of co-expression modules has been tested by further differential gene expression (DGE), protein-protein interaction (Kemmeren et al., 2002; Ichihashi et al., 2014), epigenetic (Turco et al., 2017) or functional analyses (Yokoyama et al., 2007; Ruprecht et al., 2011; Cassan-Wang et al., 2013; Ichihashi et al., 2014). Furthermore, studies have corroborated conservation of sets of co-expressed genes in closely related species (Ficklin and Feltus, 2011; Ichihashi et al., 2014; Netotea et al., 2014; Ferreira et al., 2016) as well as in deep evolutionary time (Stuart et al., 2003; Gerstein et al., 2014; Ruprecht et al., 2017a). From a simple ancestral genetic network, gene/genome duplication events could trigger the formation of novel co-expression clusters that can be re-wired and co-opted to pattern novel biological processes (Ruprecht et al., 2017b).
With the establishment of model bryophytes, an increasing number of transcriptome datasets describing multiple developmental and environmental conditions in mosses (Devos et al., 2016; Ortiz-Ramírez et al., 2016; Perroud et al., 2018) and liverworts (Alaba et al., 2015; Frank and Scanlon, 2015; Higo et al., 2016), are providing novel avenues to perform reverse genetic studies in non-vascular plant lineages. Marchantia polymorpha is a dioecious liverwort model system (Ishizaki et al., 2016) amenable to gene editing (Sugano et al., 2014) and gene silencing (Flores-Sandoval et al., 2016) techniques. Regulatory genes encoded in the M. polymorpha genome exhibit little genetic redundancy, with many transcription factor (TF) families represented by single paralogs (Bowman et al., 2017), making it an attractive system to characterize gene families that display genetic redundancy in other systems. The life cycle of M. polymorpha is haploid dominant (Figure 1A), with the diploid generation dependent upon the maternal haploid plant. Haploid spores germinate producing a sporeling, a developmental stage with active cell proliferation that forms a simple polarity between anchoring rhizoids and photosynthetic cells (Shimamura, 2016). In accordance with previous work (Bowman et al., 2017; Boehm et al., 2017), day 1 sporelings are single celled but actively differentiate chloroplasts, day 2 sporelings initiate a rhizoid cell, in day 3 sporelings the rhizoid cell elongates and the first divisions of the shoot occur, clearly establishing anatomical apical-basal polarity. By day 4, sporelings undergo proliferation of photosynthetic shoot tissue and further elongation of the rhizoid (Figure 1A). Using light cues, sporelings transition into prothalli, a two-dimensional heart-shaped body in which a meristematic zone with an apical cell producing derivatives in two planes is established (Flores-Sandoval et al., 2015). When the apical cell (Figure 1B) transitions to producing derivatives in four planes (top, bottom and lateral planes) a three-dimensional vegetative thallus (Figure 1C) is formed. Growth in thalli occurs at apical regions with differentiated tissues produced from apical cell derivatives and the apical meristem dichotomously branching (Figure 1C) at regular intervals (Shimamura, 2016; Solly et al., 2017). Upon inductive far-red to red light ratios (Kubota et al., 2014; Inoue et al., 2016; Linde et al., 2017) apices differentiate umbrella-like sexual gametangiophores (Figures 1D,E) wherein gametes (Figures 1F,G) are produced (Higo et al., 2016; Koi et al., 2016; Rövekamp et al., 2016; Yamaoka et al., 2018). In an moist environment, a sperm cell swims and fertilizes an egg cell, thus forming a zygote that undergoes several rounds of cell proliferation (Figure 1H) before differentiating sporogenous (Figure 1I) tissue (Shimamura, 2016).
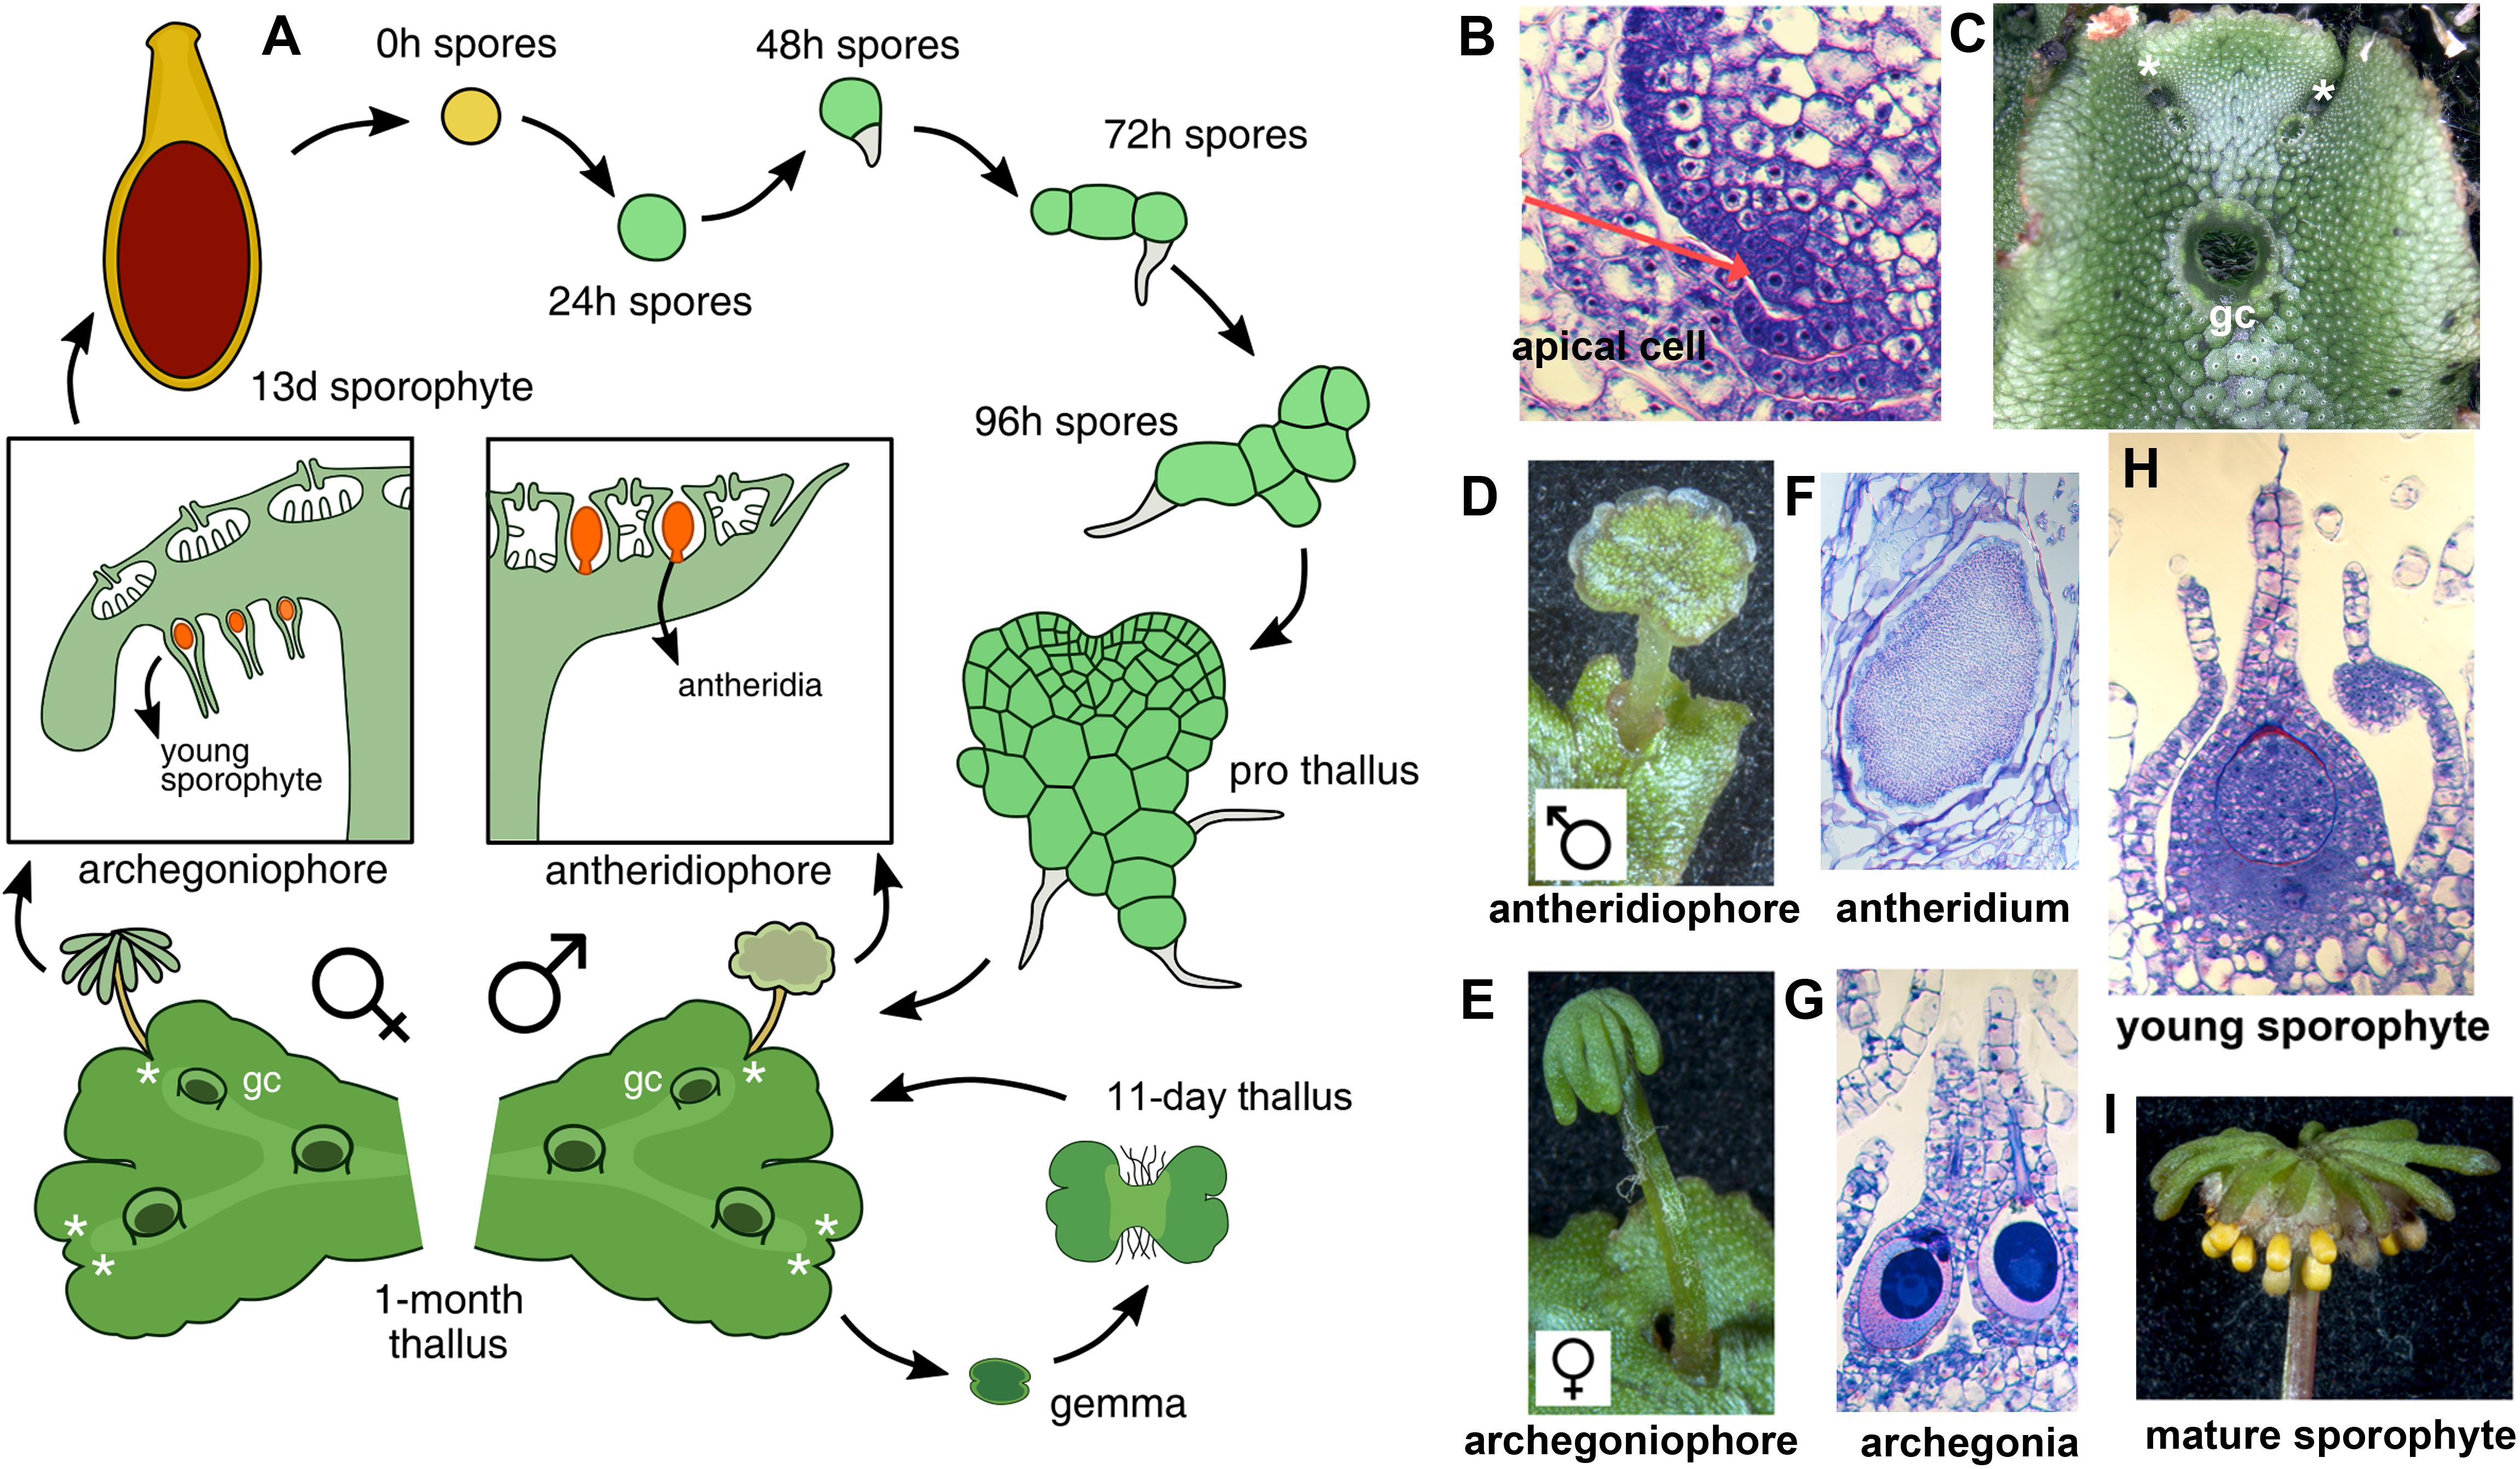
FIGURE 1. The life cycle of M. polymorpha. (A) Life cycle schematic of M. polymorpha displaying representative tissues of transcriptome libraries used in the study. Prothallus diagram based on Kny (1890). (B) Wild type thallus apex cross-section showing putative apical cell (red arrow). (C) Wild-type thallus showing dichotomous branching from apical notches. (D) Wild-type antheridiophore. (E) Wild-type archegoniophore. (F) Wild-type antheridia. (G) Wild-type archegonia. (H) Young wild-type sporophyte at similar to the sequenced 13-day sporophytes from Frank and Scanlon (2015). (I) Mature wild-type sporophytes protruding from archegoniophore. Asterisks = apical notches and gc = gemmae cups.
Auxin is a key phytohormone that triggers multiple aspects of land plant physiology and development in a context dependent fashion. Comparative analysis between charophycean algae and land plant genomes and transcriptomes indicates that the canonical F-box mediated auxin signaling pathway evolved in the land plant ancestor (Bowman et al., 2017). Surprisingly, charophycean algae are able to transcriptionally respond to exogenous auxin (Hori et al., 2014; Ohtaka et al., 2017; Romani, 2017; Mutte et al., 2018) even in the absence of specific TIR1 F-box receptors, AUX/IAAs with auxin-sensitive degron (II) domains or distinct class A and B ARFs (Bowman et al., 2017; Flores-Sandoval et al., 2018; Mutte et al., 2018). M. polymorpha possesses single paralogs of all the canonical auxin-signaling pathway genes, retaining the predicted ancestral embryophyte state (Flores-Sandoval et al., 2015; Kato et al., 2015; Bowman et al., 2017; Mutte et al., 2018). In M. polymorpha, the class A ARF (MpARF1) is necessary to elicit physiological and transcriptional responses to exogenous auxin, acting as a transcriptional activator (Kato et al., 2017). The class B ARF (MpARF2) has not yet been characterized but is regarded as a transcriptional repressor (Kato et al., 2015). The class C ARF (MpARF3) is a target of the embryophyte-specific miRNA160 and antagonizes differentiation events in multiple developmental contexts with loss-of-function Mparf3 alleles able to respond to exogenous auxin (Flores-Sandoval et al., 2018; Mutte et al., 2018), and strong gain-of-function MpARF3 alleles resembling auxin-depleted mutants (Eklund et al., 2015; Flores-Sandoval et al., 2018). Phylogenetic analysis indicates Class C ARFs evolved in a charophycean algal ancestor prior to the emergence of the auxin-signaling module (Flores-Sandoval et al., 2018; Mutte et al., 2018). Two additional genes, the NON-CANONICAL ARF (MpNCARF) and NON-CANONICAL IAA (MpNCIAA), are predicted to form part of the auxin-mediated transcriptional response (Flores-Sandoval et al., 2018; Mutte et al., 2018). NCARFs evolved from a class A-like ARF in the embryophyte ancestor, and in M. polymorpha act synergistically with MpARF1 to promote auxin signaling despite lacking a B3-DNA binding domain (Flores-Sandoval et al., 2018; Mutte et al., 2018). NCIAA genes form a sister clade to the AUX/IAA auxin signaling repressor genes, and as with the case of the class C ARFs, evolved prior to the origin of land plants (Flores-Sandoval et al., 2018; Mutte et al., 2018). Mpnciaa mutants are also sensitive to exogenous auxin (Mutte et al., 2018) suggesting they are not essential for auxin signaling. Despite conservation of these components across land plants, it is not known whether these genes act in common co-expression groups and whether their co-expression reflects functional dependency. Furthermore, the low number of annotated TFs, aMIR precursors and hormone-related genes in M. polymorpha allow accessible computation of a regulatory co-expression matrix, which perhaps is difficult in angiosperm model systems due to their high genetic redundancy. In this study we create a preliminary expression landscape of TFs defining developmental transitions in M. polymorpha based on available transcriptomic data. With co-expression analysis, we define gene clusters related to different tissues and developmental stages. Moreover, we reveal a cluster of auxin-related genes that are validated by significant overlap with auxin-inducible transcripts. We further show that the class C auxin response factor is expressed independently of this cluster and may negatively influence reproductive transitions in M. polymorpha.
Materials and Methods
DGE Expression Analysis
Fastq files of publicly available Illumina RNA-Seq libraries were obtained from the NCBI (SRA) depository. All libraries used for DGE analysis were performed in triplicates (except for antheridia – duplicates) and pairwise-comparisons were exclusively made with their original controls. Marchantia genome assembly (V3.1) and annotated gene models were used as references for TopHat2 mapping (Kim et al., 2013; Afgan et al., 2015). Control, Mparf3 and Mpmir160 transcriptomes were sequenced and processed as previously described (Flores-Sandoval et al., 2018). DGE analysis was performed with edgeR and outputs presented were limited to curated TFs (Supplementary Table S1; Bowman et al., 2017) with logCPM > 0 and P-Values < 0.01. Box plots were generated using and online R application available at http://shiny.chemgrid.org/boxplotr/. Accession numbers from the NCBI Sequence Read Archive include: 11-day thalli (DRR050343, DRR050344, and DRR050345), Archegoniophore (DRR050351, DRR050352, and DRR050353), Antheridiophore, (DRR050346, DRR050347, and DRR050348), Antheridia (DRR050349, and DRR050350), apical cell (SRR1553294, SRR1553295, and SRR1553296), 13d-Sporophyte (SRR1553297, SRR1553298, and SRR1553299), Sporelings 0 h (SRR4450262, SRR4450261, and SRR4450260), 24hr-Sporeling (SRR4450266, SRR4450265, and SRR4450259), 48hr-Sporeling (SRR4450268, SRR4450264, and SRR4450263), 72hr-Sporeling (SRR4450267, SRR4450258, and SRR4450257), 96hr-Sporeling (SRR4450256, SRR4450255, and SRR4450254), 1-month wild type (SRR6685782, SRR6685783, and SRR6685784), 1-month Mparf3 (SRR6685778, SRR6685779, and SRR6685785), 1-month Mpmir160 (SRR6685777, SRR6685780, and SRR6685781), thalli-mock (SRR5905100, SRR5905099, and SRR5905098), and 2,4-D 1-h (SRR5905097, SRR5905092, and SRR5905091). Alternatively, we performed DGE analysis with DESeq2 (Love et al., 2014) when stated in the text.
Co-expression Analysis
Pearson’s correlations were calculated for all Marchantia TFs and for genes with putative connection with auxin biology: correlation coefficients were calculated amongst TFs and whole genome co-expression partners were calculated only for auxin-related genes. Gene sets were generated considering those with correlation > 0.8 and P-value < 0.001 as significantly co-expressed. Venn and Euler plots were generated using R package VennDiagram as well as VENNY (Oliveros, 2007). UpSet plots were generated using its respective R package (Lex et al., 2014). Heatmaps for TF co-expression matrixes were generated using Heatmapper (Babicki et al., 2016) by applying average linkage clustering to rows and columns and Euclidian distance measurements.
Enrichment Analysis
Comparison of co-expression groups with differentially expressed genes were performed by enrichment analysis using Fisher’s exact test. For the auxin enrichment analysis we manually selected auxin related co-expression groups (and unrelated genes as negative controls) as a bait against: Auxin inducible genes from Physcomitrella patens (p.adjust < 0.05; Lavy et al., 2016), Arabidopsis thaliana (p.adjust < 0.01; Omelyanchuk et al., 2017) and M. polymorpha (p.adjust < 0.05; Mutte et al., 2018). For the first two species listed we determined orthologs using Phytozome1. -log10 P-values were reported in each Figure.
GO and Protein Family Enrichment
Gene sets were functionally characterized via GO term enrichment analysis using an in-house Fisher’s exact test algorithm implemented in R (v3.3.2). We compiled Biological Process related GO term annotation for M. polymorpha genes using annotations available in Phytozome for M. polymorpha and A. thaliana and P. patens orthologs. We included in our GO term database both one-to-many and many-to-one relationships in order to obtain a more accurate annotation. For protein families, we used the same algorithm based on a different database. In this case, we annotated protein families using the HMMscan algorithm implemented in HMMER3 (Wheeler and Eddy, 2013) over the M. polymorpha proteome with default parameters and using Pfam profiles2.
Results
Transcription Factors Controlling Developmental Transitions in M. polymorpha
We performed DGE analysis on publicly available RNA-Seq libraries to (1) identify transcription factors defining or influencing Marchantia developmental transitions and (2) use the obtained datasets as references for enrichment analysis (Frank and Scanlon, 2015; Higo et al., 2016; Bowman et al., 2017). Datasets span multiple tissues throughout the life cycle, including intensively sampled sporelings during the first 5 days of development (Bowman et al., 2017), apical cells (Frank and Scanlon, 2015), gametangiophores, antheridia (Higo et al., 2016), and 13-day old sporophytic micro-dissections (Frank and Scanlon, 2015). In our analysis, 82% of differentially expressed TFs with P < 0.01 (edgeR) have fold changes (FC) below 4× in most tissues except sporophytes (Figure 2A and Supplementary Figure S1A), suggesting feedback regulation preventing drastic changes in regulatory gene expression. To account for both read abundance and fold-changes, we used the product of logFC and logCPM (counts per million) to categorize the transcripts enriched in a particular tissue. Of the 405 TFs in the M. polymorpha genome (Supplementary Table S1), 45 were not differentially expressed in any of the performed pair-wise comparisons (Supplementary Figure S1B).
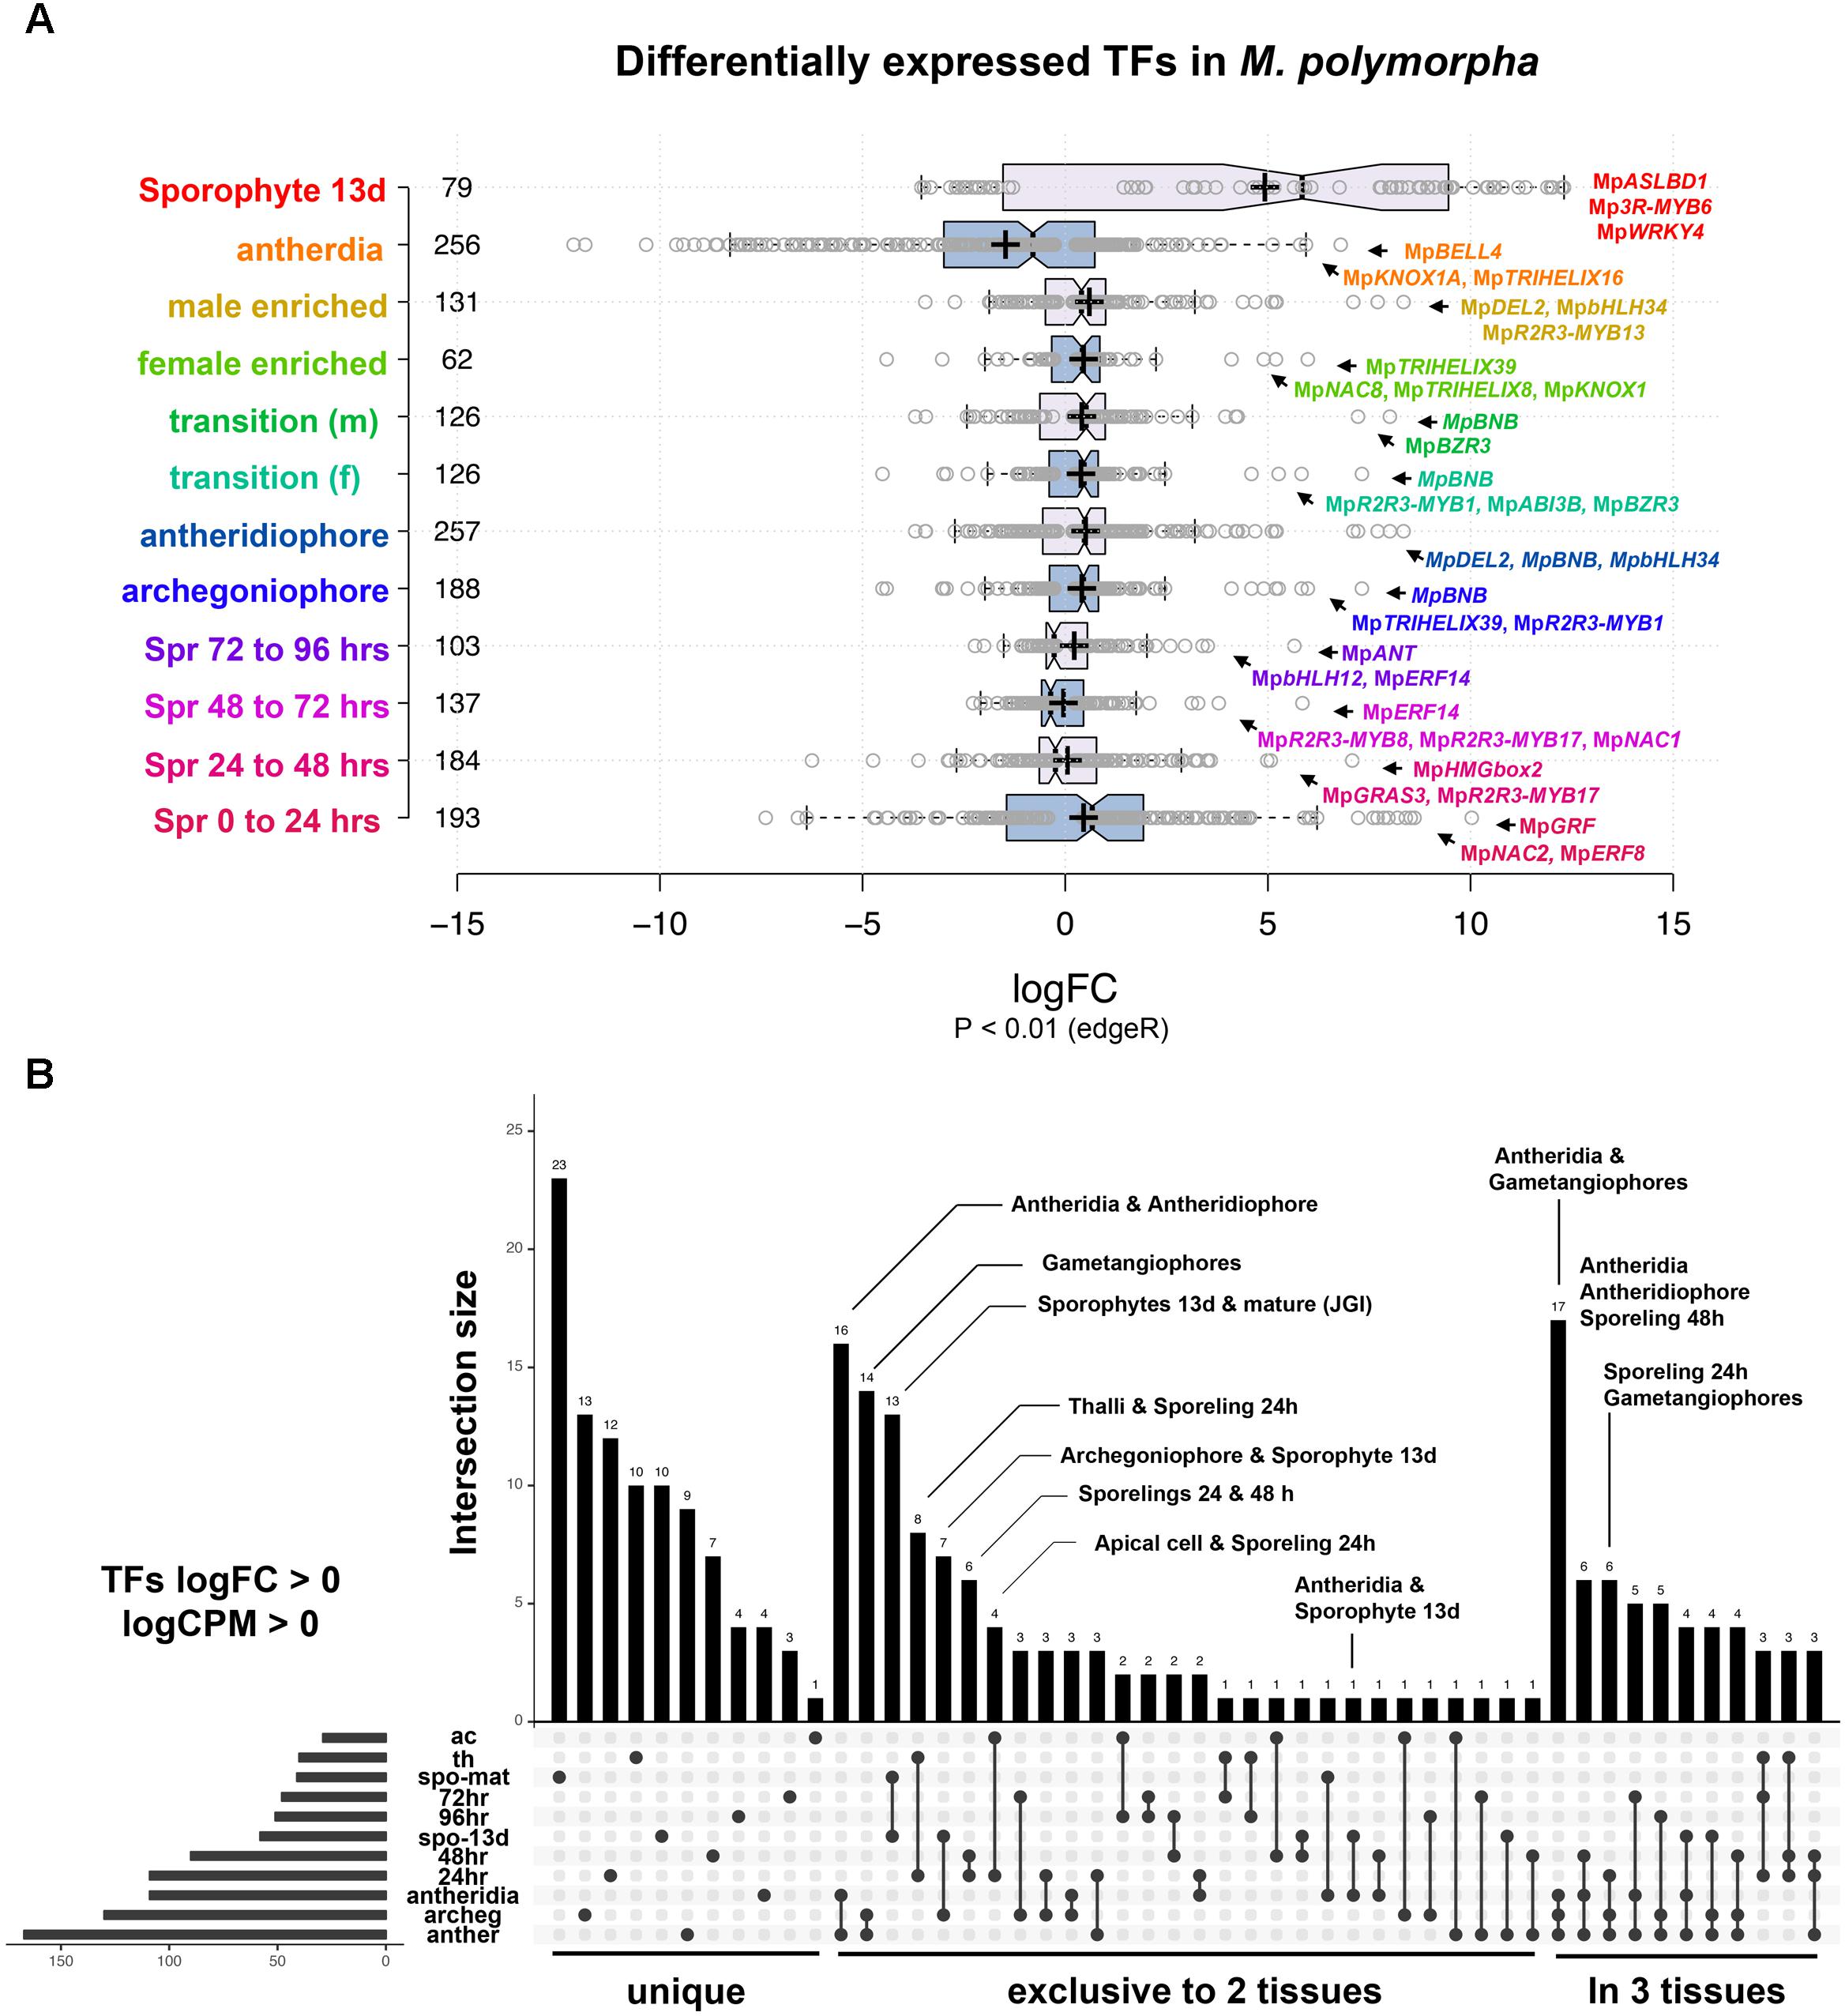
FIGURE 2. Differential gene expression analysis in M. polymorpha. (A) Boxplots of log2FC value distribution of differentially expressed (edgeR, P < 0.01) TFs in multiple pair-wise comparisons. Central lines represent medians; box limits indicate the 25th and 75th percentiles as determined by R software (http://shiny.chemgrid.org/boxplotr/); whiskers extend 1.5 times the interquartile range from the 25th and 75th percentiles, outliers are represented by dots; crosses represent sample means; data points are plotted as open circles. Number of sample points are included for each group. (B) UpSet diagram indicating intersections between upregulated TFs (P < 0.01, logFC > 0) in multiple pairwise comparisons. Diagram indicates uniquely up-regulated TFs on the left, followed by those exclusively shared between two and three pairwise comparisons. Abbreviations: ac, apical cell; th, thallus; spo-mat, JGI-sporophytes; 72 h, 72-h sporelings; 96 h, 96-h sporelings; spo-13 d, 13-day sporophytes; 48 h, 48-h sporelings; 24 h, 24-h sporelings; archeg, archegoniophores; anther, antheridiophores.
In order to find TFs specific to a developmental transition, we compared all upregulated TFs in each tissue using a cut off of logFC and logCPM > 0 (Figure 2B and Supplementary Table S2). Mature sporophyte-enriched TFs sequenced by JGI (Bowman et al., 2017) were included in this comparison to validate the 13-day microdissected sporophytes with both datasets showing a high degree of overlap (Figure 2B). Mature sporophytes have the largest number of uniquely upregulated TFs (Figure 2B), followed by 24-h germinated spores, gametangiophores and thalli. The apical cell and antheridia had a single uniquely upregulated TF each (Figure 2B). As expected, antheridia and antheridiophores, male and female gametangiophores and thalli/24-h sporelings show the highest degree of similarity. Surprisingly, 13-day sporophytes, but not mature sporophytes, had common and exclusive upregulation with archegoniophores and antheridia. Finally, antheridia, antheridiophores and archegoniophores formed a large group of uniquely upregulated TFs (Figure 2B). The TFs enriched in each tissue library will be described in detail in the following paragraphs.
Sporelings 0 to 24 h
A total of 193 TFs (114 upregulated) define the transition of dormant spores to germinated ones (Figure 2A and Supplementary Table S3). This stage has the third highest number of upregulated TFs after gametangiophores (logFC > 0), and has the highest number of upregulated TFs at logFC > 2 (Supplementary Figure S1A). This likely reflects the large number of physiological, cellular and developmental processes being activated upon germination. The ortholog of the root specifying TARGET OF MONOPTEROS 5/ABNORMAL SHOOT 5 (Schlereth et al., 2010), MpbHLH7 (Mapoly0039s0068, logFC = 8 and logCPM = 5.9) is the highest expressed TF incorporating both fold-changes and read abundance in 1-day sporelings (Figure 3A). MpbHLH7 is followed by the B-box type ZINC FINGER gene MpBBX3 (Mapoly0049s0067, logFC = 8.4 and logCPM = 5.7) and the single M. polymorpha GROWTH REGULATING FACTOR gene MpGRF (Mapoly1350s0001, logFC = 10 and logCPM = 4.4). MpGRAS8 (Mapoly0065s0089, logFC = 7.6 and logCPM = 5.23) from an uncharacterized GRAS lineage in plants (Bowman et al., 2017), and MpbHLH41 (Mapoly0100s0033, logFC = 6.21 and logCPM = 6.23), an ortholog of NAI1, a TF involved in activation of post-germinative seedling programs in Arabidopsis (Yoshii et al., 2015) are also highly upregulated. An auxin-inducible gene (Mutte et al., 2018), the HOMEODOMAIN class II HD-ZIP, MpC2HDZ (Mapoly0069s0069, logFC = 5.89 and logCPM = 5.01) also has high expression consistent with up-regulation of MpYUC2 (Mapoly0063s0040, logFC = 1.32 and logCPM = 3.55). Co-expression dynamics for day-1 sporeling enriched genes shows MpbHLH7 and MpC2HDZ are highly correlated. Meanwhile MpGRF expression correlates with that of the class I TCP MpTCP1, the auxin signaling repressor MpIAA and the HOMEODOMAIN class IV HD-ZIP MpC4HDZ (Supplementary Figure S2).
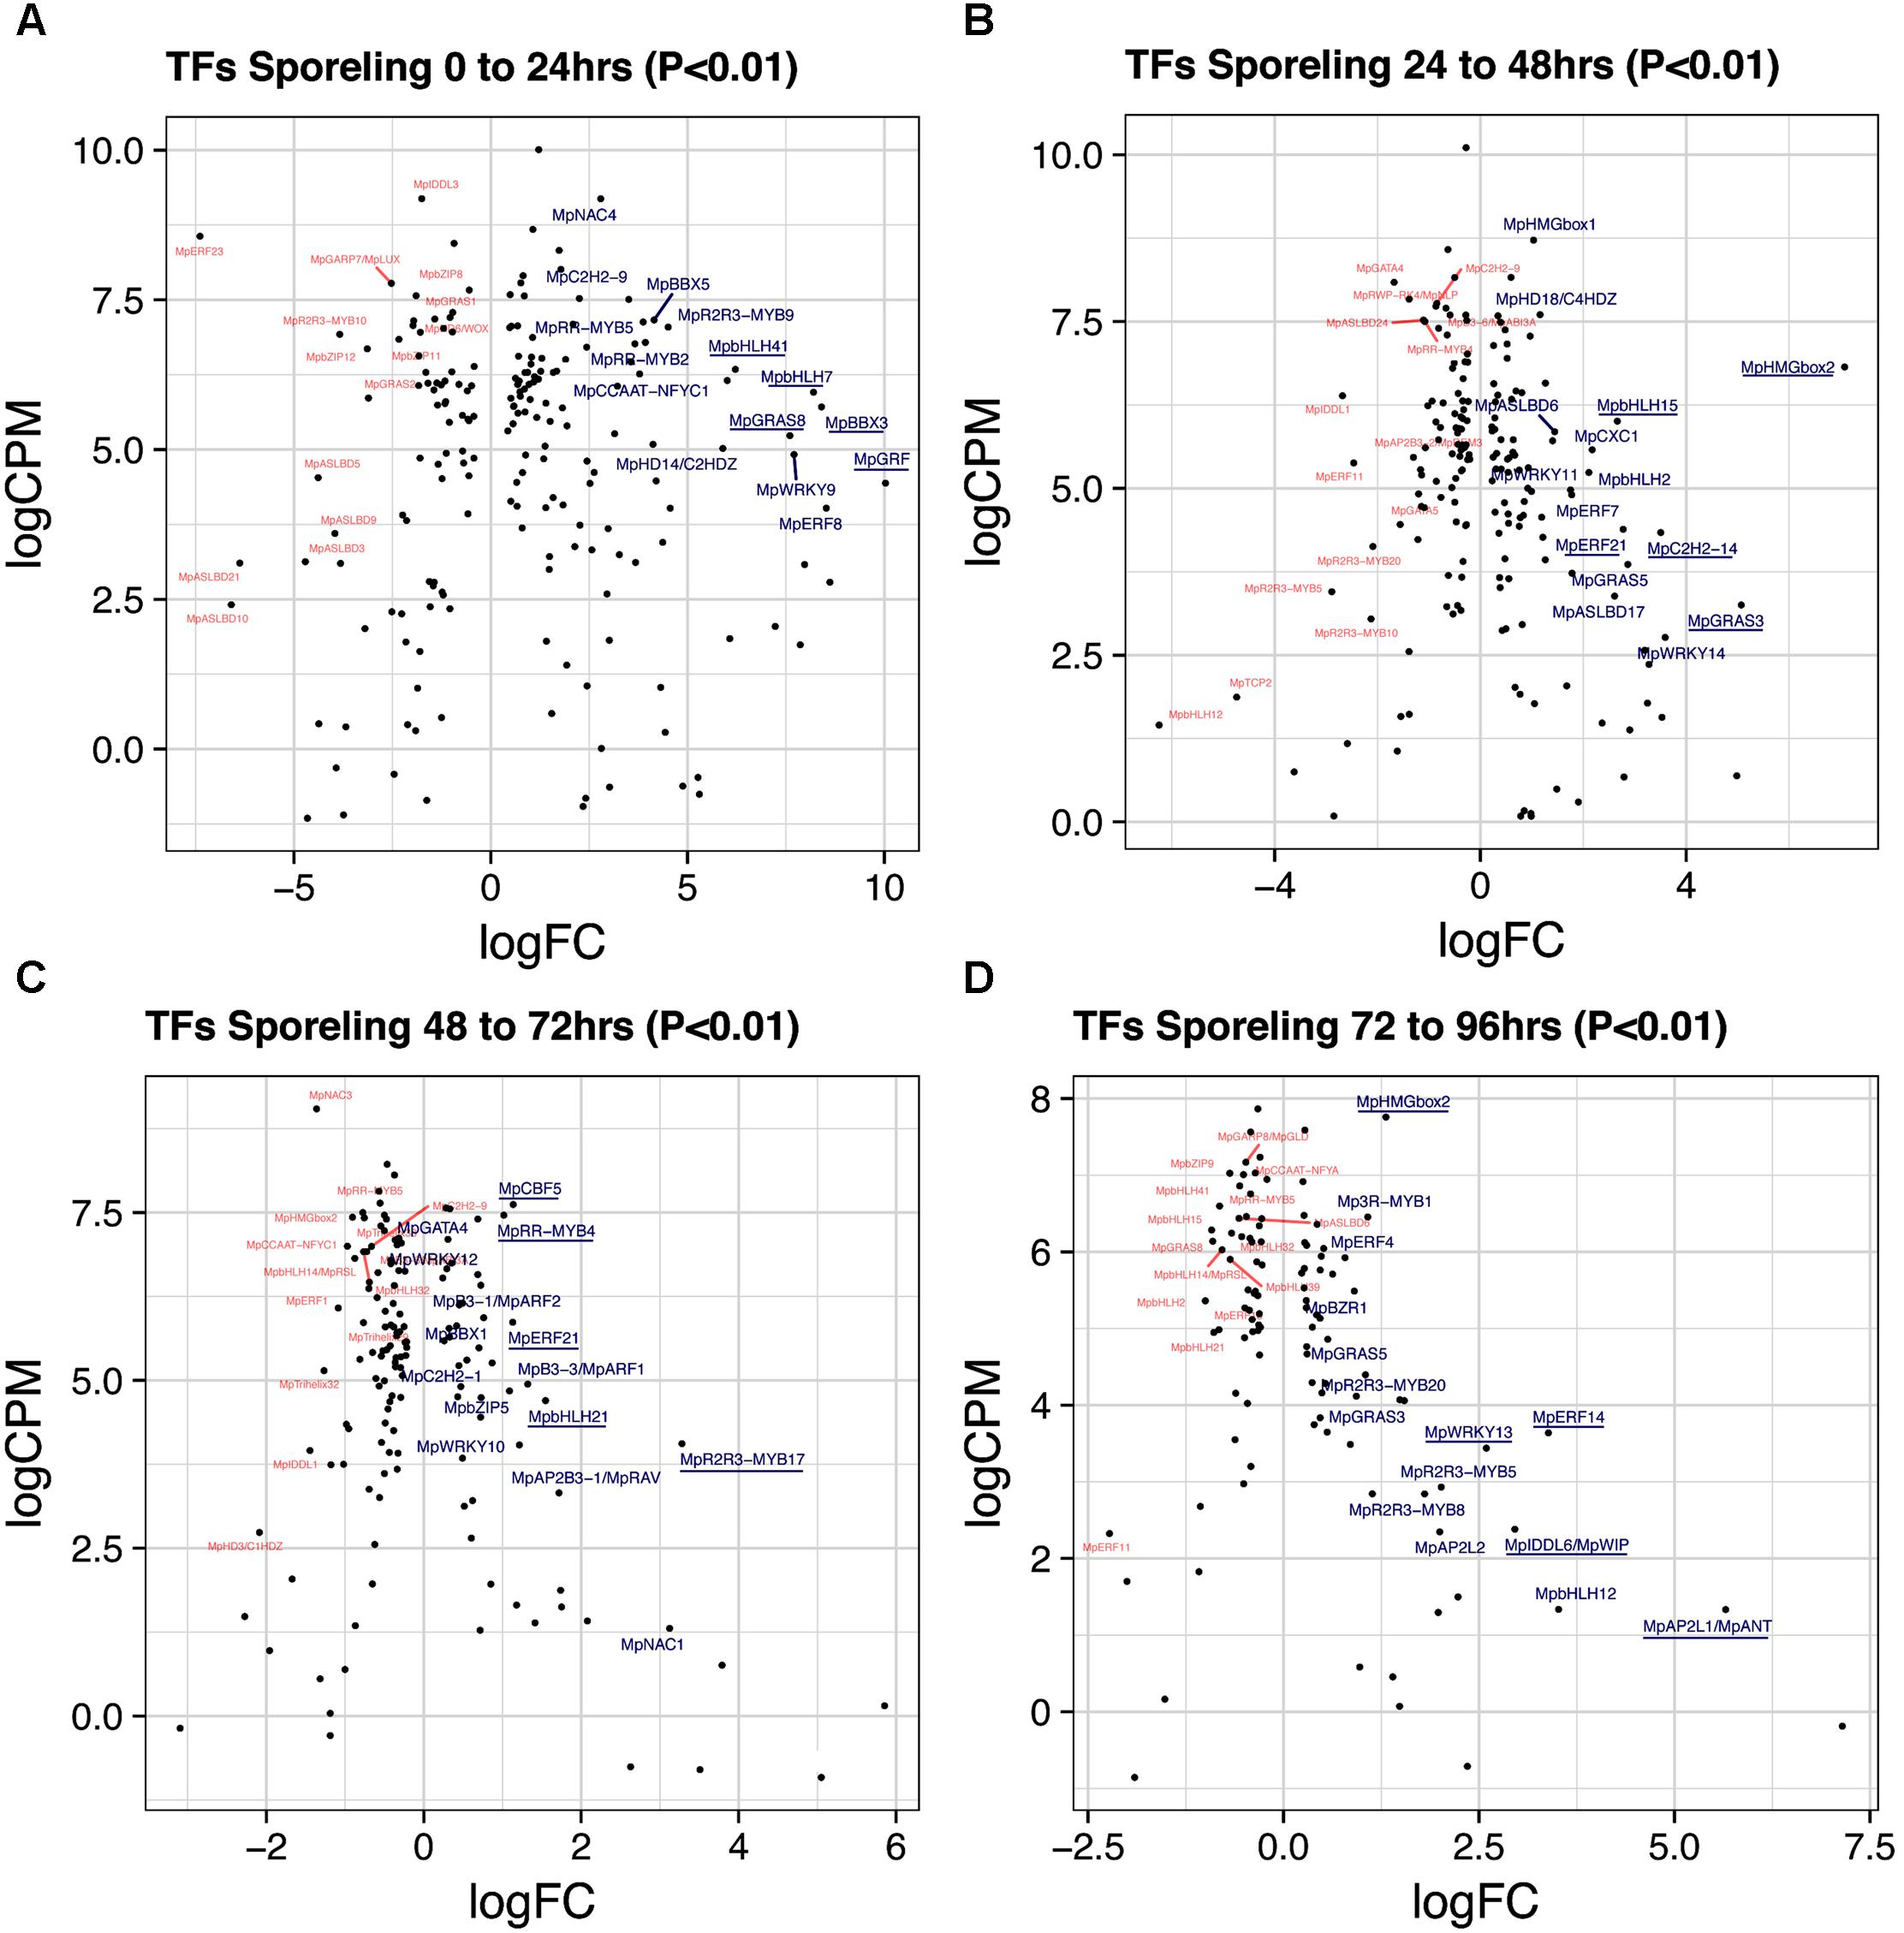
FIGURE 3. Differentially expressed TFs in M. polymorpha sporelings. LogFC and logCPM outputs of DGE analysis showing pairwise comparisons of (A) 0 vs. 24 h, (B) 24 vs. 48 h, (C) 48 vs. 72 h, and (D) 72 vs. 96 h. Top 15 upregulated (blue) and downregulated (red) TFs are annotated, with the top5 upregulated TFs underlined.
Sporelings 24 to 48 h
A total of 184 TFs (90 upregulated, Supplementary Table S4) define the second day of sporeling development where the first rhizoid is formed (Bowman et al., 2017). MpHMGbox2 (Mapoly0026s0138, logFC = 7 and logCPM = 6.8) and MpHMGbox1 (Mapoly0013s0048, logFC = 1.03 and logCPM = 8.71) are upregulated and abundant (Figure 3B). They are orthologs of the 3xHIGH MOBILITY GROUP-BOX2 genes involved in cell cycle regulation (Pedersen et al., 2011). These are followed by two GRAS TFs: MpGRAS3 (Mapoly0014s0183, logFC = 5 and logCPM = 3.2) and MpGRAS5 (Mapoly0047s0034, logFC = 2.86 and logCPM = 3.85), which belong to separate and uncharacterized GRAS lineages in land plants (Bowman et al., 2017). MpERF21 (Mapoly0166s0010, logFC = 2.77 and logCPM = 4.38), an ABA REPRESSOR1 (ABR1) ortholog and MpERF7 (Mapoly0034s0029, logFC = 1.77 and logCPM = 4.9) a DREB26 ortholog, are two AP2/ERF TFs enriched in this transition and putatively involved in stress-responses (Pandey, 2005; Krishnaswamy et al., 2011). Finally, MpbHLH15 (Mapoly0038s0058, logFC = 2 and logCPM = 6), an ortholog of CRYPTOCHROME-INTERACTING (CIB) bHLHs (Liu et al., 2008) is also enriched in day two sporelings (Figure 3B). Co-expression dynamics for day-2 sporeling enriched genes shows MpHMGbox1 and 2 form a distinct group, while MpERF7 and 21 are co-expressed (Supplementary Figure S3).
Sporelings 48 to 72 h
A total of 142 TFs (50 upregulated, Supplementary Table S5) define this transition, where photosynthetic vs. anchoring tissue polarity is properly established (Bowman et al., 2017). MpR2R3-MYB17 (logFC = 3.2, logCPM = 4.05) a MIXTA-like MYB TF is the highest expressed gene after incorporating abundance (Figure 3C). It belongs to a MYB lineage (clade IV) composed of genes regulating secondary compound metabolism (Bowman et al., 2017). Similar to day 2, MpERF21 continues its enrichment (logFC = 1.12 and logCPM = 5.86), as well as MpbHLH21 (Mapoly0037s0007, logFC = 1.54 and logCPM = 4.69) a paralog of MpbHLH15 (CIB bHLHs). The auxin signaling pathway, represented by MpARF1 (Mapoly0019s0045, logFC = 1.32 and logFC = 4.94) and MpARF2 (Mapoly0011s0167, logFC = 0.72 and logFC = 6.41) are significantly upregulated in this transition (Supplementary Figure S4A). The CUP-SHAPE COTYLEDON ortholog MpNAC1 (Mapoly0015s0058, logFC = 3.1 and logCPM = 1.3) and the RAV-like B3-domain TF MpRAV (Mapoly0072s0102, logFC = 1.71 and logCPM = 3.32) are also enriched. The logFC average in 3-day sporelings has decreased by ∼1/2 (Figure 2A) from 1-day sporelings, suggesting increased homeostatic control of TF expression. MpR2R3-MYB17, MpARF1, MpARF2, and MpNAC1 form a robust co-expression cluster (Supplementary Figure S5).
Sporelings 72 to 96 h
A total of 106 TFs (52 unregulated, Supplementary Table S6) define this transition, where there is a proliferation of photosynthetic cells and elongation of the rhizoid (Bowman et al., 2017). The ANT/PLETHORA/BABYBOOM ortholog MpANT (Mapoly0008s0071, euANT clade) involved in meristematic activity in mosses (Aoyama et al., 2012) and angiosperms (Aida et al., 2004; Kareem et al., 2015) is the TF with the highest fold-change (logFC = 5.6) despite being mildly expressed (logCPM = 1.3, Figure 3D). The auxin-induced gene MpWIP (Mapoly0096s0050, logFC = 2.95 and logCPM = 2.38) necessary for air pore development (Jones and Dolan, 2017) follows a similar pattern. MpERF14 (Mapoly0066s0103, logFC = 3.38 and logCPM = 3.63) from clade VIII of the ERF phylogeny (Bowman et al., 2017), MpHMGbox2 (logFC = 7.75 and logCPM=) and MpWRKY13 (Mapoly0162s0003, logFC = 2.59 and logCPM = 3.43) are highly expressed and upregulated (Figure 3D). The auxin-signaling TFs MpARF1 (logFC = 0.46 and logCPM = 5.76) and MpARF2 (logFC = 0.24 and logCPM = 6.91) continue to be highly expressed and upregulated (Supplementary Figure S4A). Enrichment analysis (Fishers-exact test) probing auxin-induced M. polymorpha transcripts (Mutte et al., 2018) with sporeling and thalloid transcriptomes shows that 96-h sporelings vastly converge with genes activated by auxin, perhaps as a result of progressive increases of class A and B ARF activity (Supplementary Figure S4B). All of the above mentioned genes form a robust co-expression cluster (Supplementary Figure S5).
Thalli vs. Archegoniophores
A total of 188 TFs (129 upregulated, Supplementary Table S7) are differentially expressed between 11-day thalli and mature archegoniophores (Higo et al., 2016). The TFs with highest expression at this stage (Figure 4A) is the bHLH factor MpBONOBO/MpBNB (Mapoly0024s0106, logFC = 7 and logCPM 2.6), which has been shown to promote formation of gametangiophores and biogenesis of gametes (Yamaoka et al., 2018). MpR2R3-MYB1 (Mapoly0001s0061) is a highly expressed and upregulated factor in archegoniophores (logFC = 5.26 and logCPM = 6.37), followed by the B3-domain MpABI3B (Mapoly0474s0001, logFC = 5.26 and logCPM = 5.96) whose orthologs in Arabidopsis modulate abscisic acid responses (Mccarty et al., 1991; Suzuki et al., 2001). Finally, the putative GT2-like MpTRIHELIX39 (Mapoly0003s0229, logFC = 5.98 and logCPM 3.2) has drastic fold changes but lower read counts (Figure 4A).
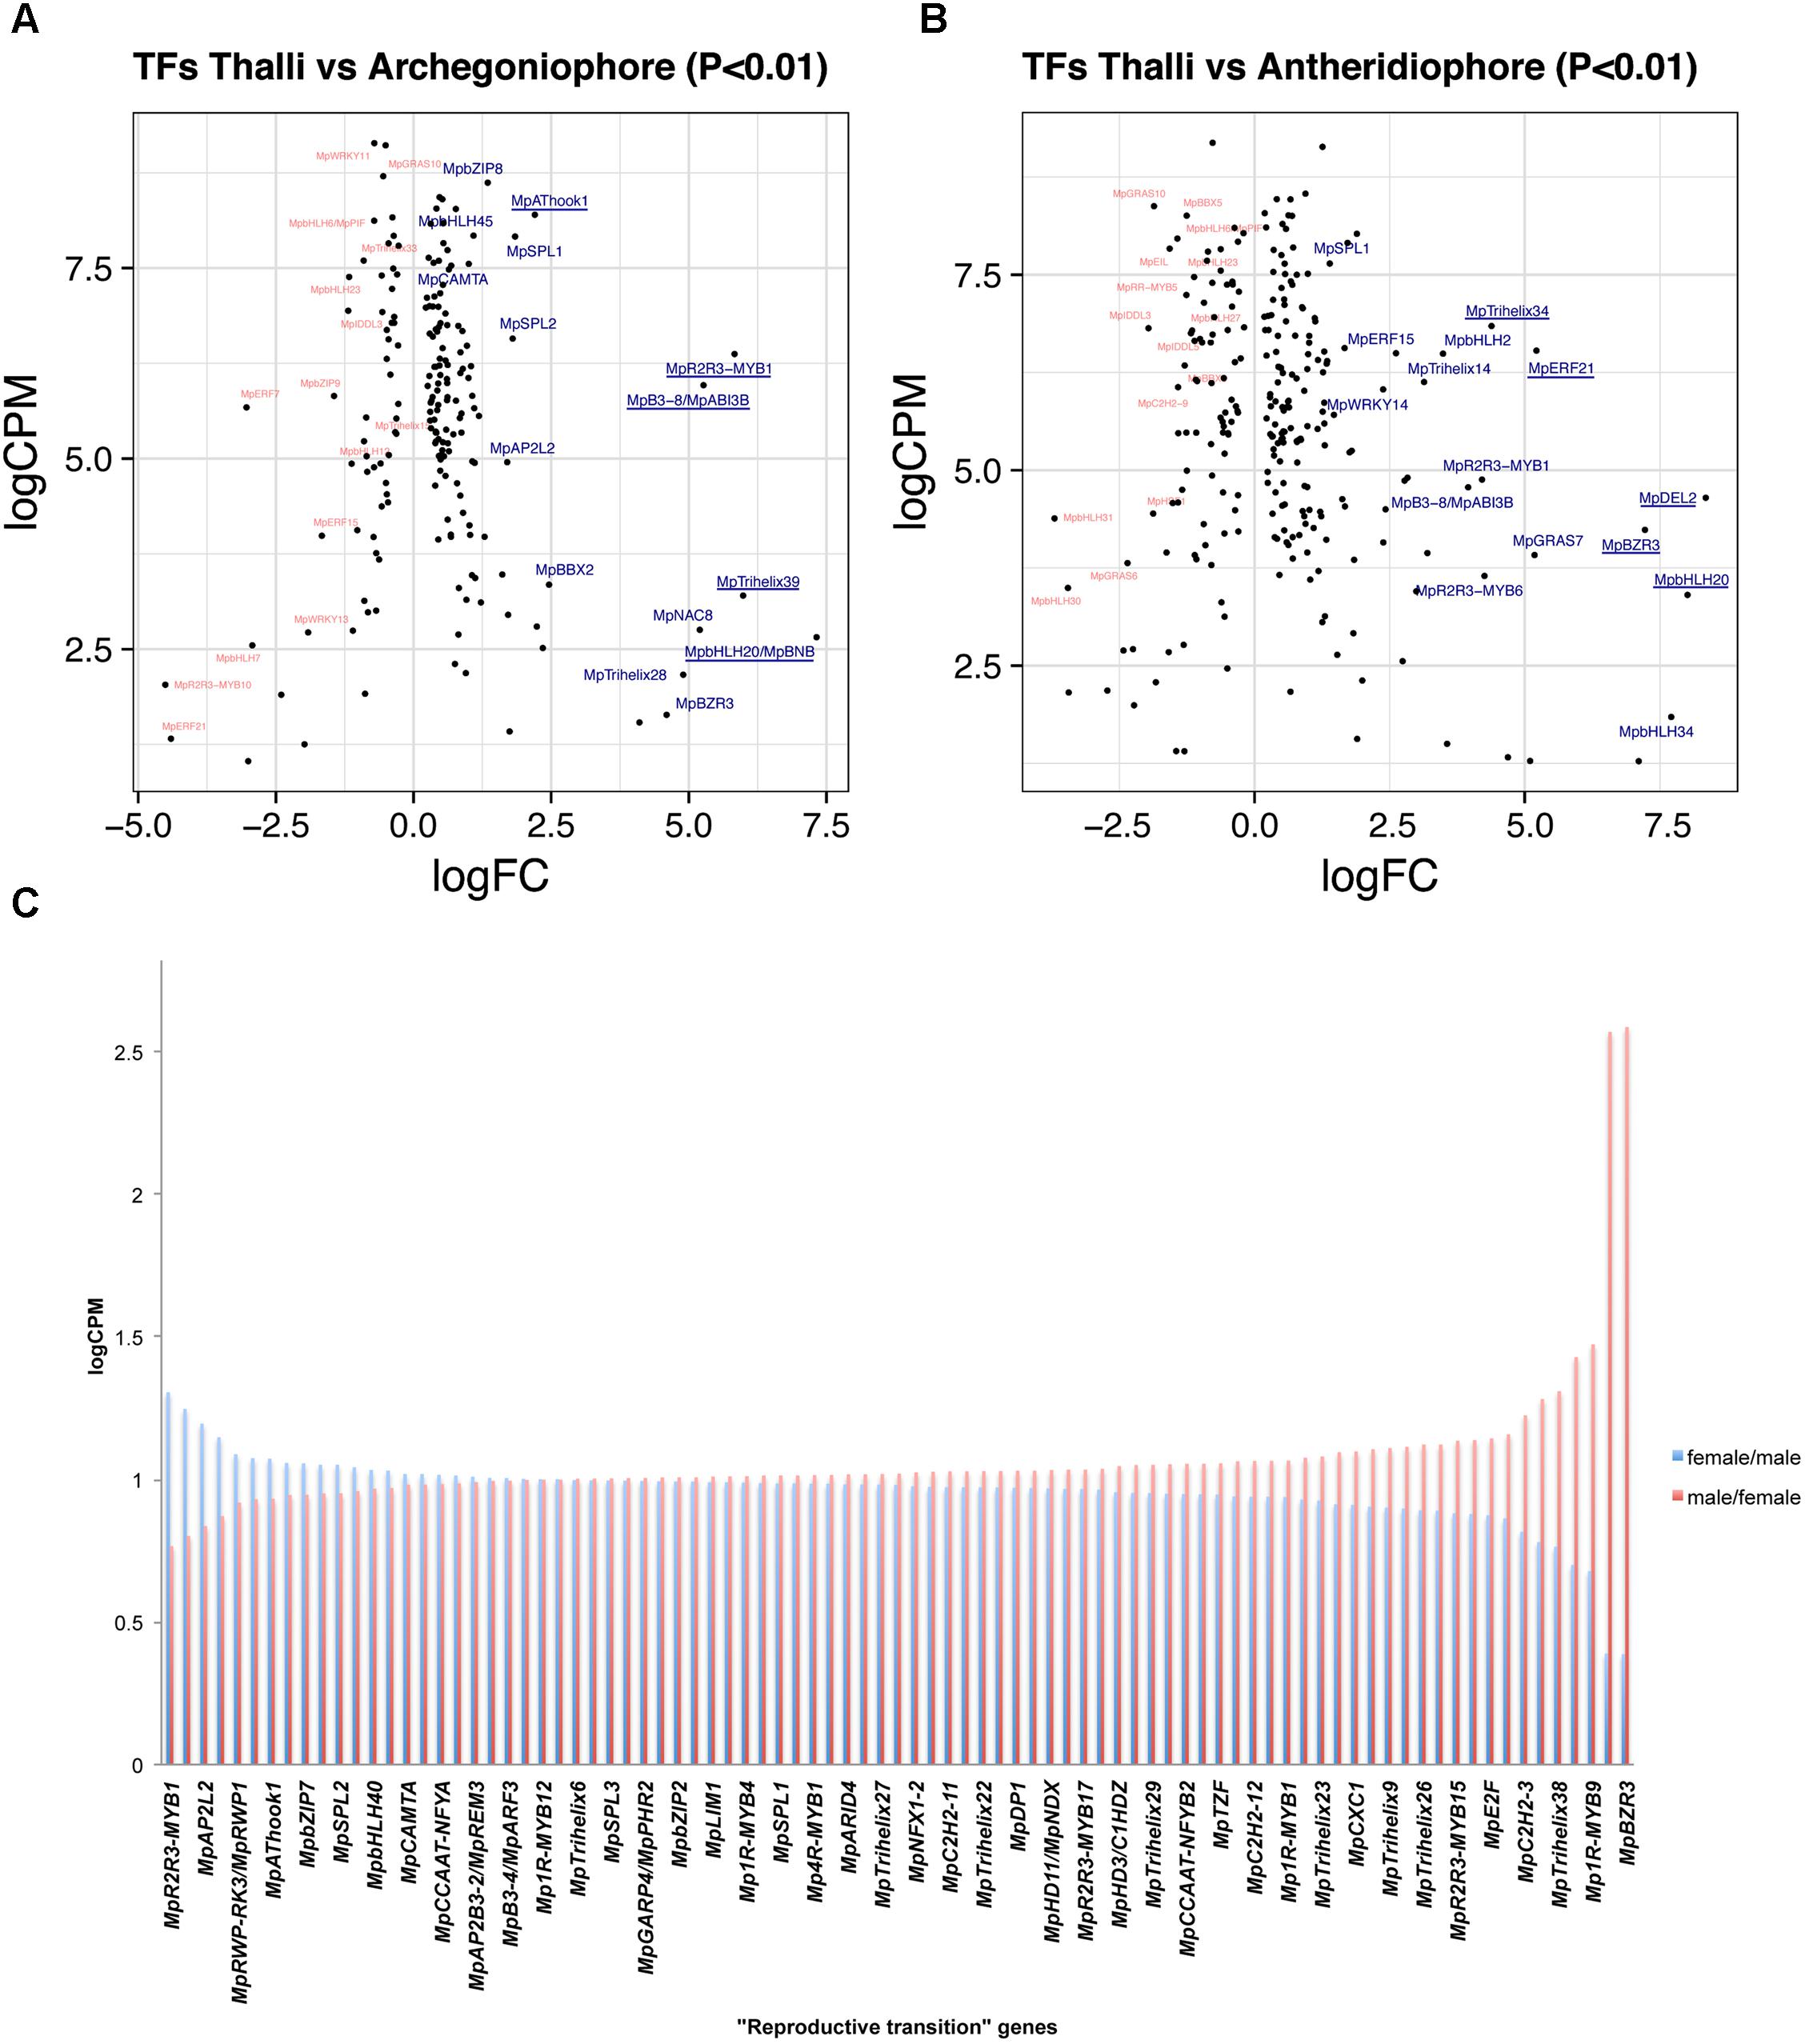
FIGURE 4. Differentially expressed TFs in M. polymorpha gametangiophores. LogFC and logCPM outputs of DGE analysis showing pairwise comparisons of (A) thalli vs. archegoniophores and (B) thalli vs. antheridiophores. Top 15 upregulated (blue) and downregulated (red) TFs are annotated, with the top5 upregulated TFs underlined. (C) TFs upregulated in both sexes were defined as reproductive transition genes, most of which have 1/1 ratios of logCPM values in males and females.
Thalli vs. Antheridiophores
A total of 257 TFs (166 upregulated, Supplementary Table S8) are differentially expressed in antheridiophores when compared to 11-day thalli. One of the two DP-E2F-LIKE PROTEIN TFs in Marchantia, MpDEL2 (Mapoly0198s0008, logFC = 8.34 and logCPM = 4.64), involved in regulating the cell cycle and cell proliferation (Sozzani et al., 2010), as well as MpBNB (logFC = 8 and logCPM = 3.4) are the TFs with the highest fold change in the transition from thalli to antheridiophores (Figure 4B). In addition, MpERF21 (Mapoly0166s0010, logFC = 5.14 and logCPM = 6.52), MpBZR3 (Mapoly0072s0031, logFC = 7.22, logCPM = 4.23), and MpTRIHELIX34 (Mapoly0159s0017, logFC = 4.38, logCPM = 6.84) are highly expressed genes with large fold-changes in antheridiophores (Figure 4B).
Reproductive Transition
A total of 126 TFs (87 upregulated, Supplementary Table S9) are shared with similar dynamics in thalli vs. archegoniophore and thalli vs. antheridiophore comparisons (Figure 4C). Nine of these genes were enriched in no other tissue but gametangiophores albeit being mildly upregulated (Figure 2B and Supplementary Table S2). Thirteen genes were exclusive to gametangiophores and antheridia, corroborating their specificity in reproductive roles (Figure 2B and Supplementary Table S2). MpBNB is in this former group, consistent with its role in both gametangiophore and gamete formation (Yamaoka et al., 2018). Additional genes were enriched but not specific to gametangiophores (Supplementary Table S2). A majority of these TFs (Figure 4C) have 1:1 ratios of logCPM between male and female tissues with only MpR2R3-MYB1 being higher in females (logCPM female/male = 1.3) and MpBZR3 and MpR2R3-MYB6 preferentially expressed in males (logCPM male/female = 2.5 in both cases). Despite their high expression in males, complete MpR2R3-MYB1 transcripts were exclusively found in females, suggesting male expression may be represented by incomplete transcripts.
Female Enriched Genes
Due to the lack of archegonia-specific transcriptomes, we defined female enriched genes by discarding reproductive transition genes from the thalli vs. archegoniophore comparison (62 genes in total, 42 upregulated, Supplementary Table S10). These include (Figure 5A) MpNAC8 (Mapoly0035s0054, logFC = 5.19 and logCPM = 2.75), which is an ortholog of LONG VEGETATIVE PHASE (LOV1) involved in repressing flowering transitions in Arabidopsis (Yoo et al., 2007); MpTRIHELIX39, and the SH4-like MpTRIHELIX28 (Mapoly0122s0030, logFC = 4.89 and logCPM = 2.16). Additionally, two TALE-HOMEODOMAIN TFs are also upregulated in females although with lower read counts, possibly showing a diluted signal from archegonia RNA. These include the class I KNOX gene MpKNOX1 (Mapoly0175s0020, logFC = 4.1 and logCPM = 1.53) as well as a BELL gene, MpBELL5 (Mapoly0093s0028, logFC = 2.23 and logCPM = 2.79), the latter only having orthologs in charophycean algae (Bowman et al., 2017).
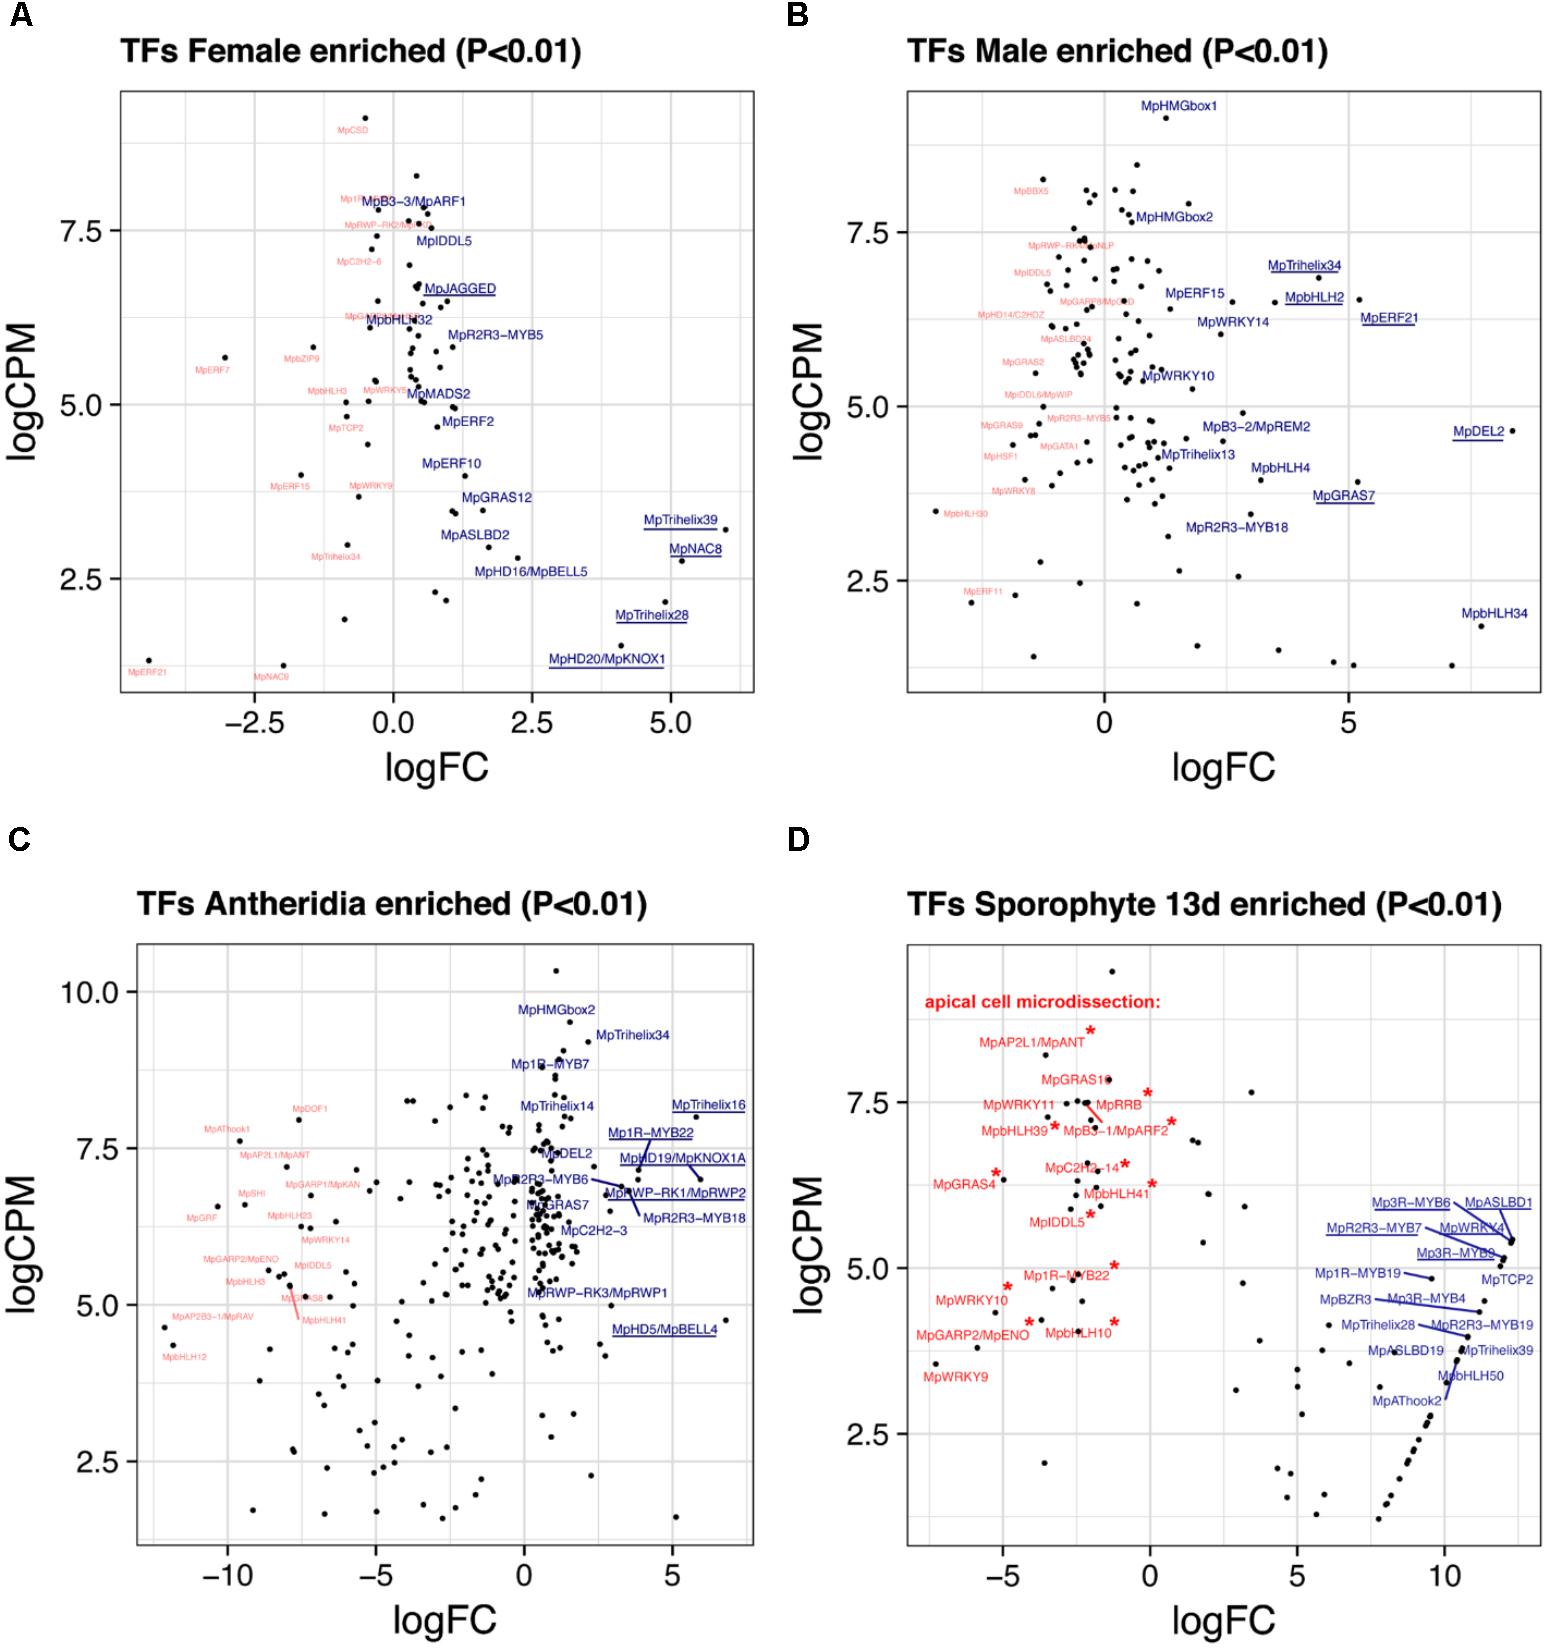
FIGURE 5. Sex-enriched and sporophyte TFs obtained from DGE analysis. LogFC and logCPM outputs of DGE analysis showing TFs solely enriched in (A) archegoniophores and not antheridiophores, (B) antheridiophores and not archegoniophores, (C) antheridia vs. antheridiophores, and (D) 13-day sporophytes vs. apical cell RNAs. Top 15 upregulated (blue) and downregulated (red) TFs are annotated, with the top5 upregulated TFs underlined. Asterisks in (D) represent TFs not upregulated in thallus tissue.
Male Enriched Genes
A total of 131 TFs (79 upregulated, Supplementary Table S11) are enriched in antheridiophores after discarding reproductive transition genes. MpDEL2 and MpTRIHELIX34 are kept in this category (Figure 5B). Additional genes include, MpERF21 (Mapoly0166s0010, logFC = 5.21 and logCPM = 6.52), MpbHLH2 (Mapoly0028s0062, logFC = 3.48 and logCPM = 6.49) an ortholog of AT4G09820, MpERF15 (Mapoly0068s0088, logFC = 2.61 and logCPM = 6.49), MpGRAS7 (Mapoly0064s0023, logFC = 5.18 and logCPM = 3.91) a gene lost in the common ancestor of seed plants (Bowman et al., 2017), and MpWRKY14 (Mapoly0467s0001, logFC = 2.37 and logCPM = 6.49) that belongs to clade III in the WRKY phylogeny (Bowman et al., 2017).
Antheridiophore vs. Antheridia
A total of 256 TFs (108 upregulated, Supplementary Table S12) are differentially expressed in antheridia when compared to antheridiophores. The higher ratio of repressed/activated TFs suggests the substitution of haploid photosynthetic and free-living thalli for that of more specialized gamete forming pathways (Figure 2A). For example, TFs upregulated during sporeling development, such as MpGRF (logFC = -10) and MpANT (logFC = -8) are repressed (Figure 5C). Upregulated genes in antheridia in both in terms of fold-change and abundance (Figure 5C) are an ortholog of the SH4-like MpTRIHELIX16 (Mapoly0037s0146, logFC = 5.79 and logCPM = 7.99); MpKNOX1A (Mapoly0174s0007, logFC = 5.93 and logCPM = 7); and MpKNOX1B (Mapoly0023s0081, logFC = 2.55 and logCPM = 4.37), which are semi conserved TALE (KNOX1) HD genes that have lost the DNA binding domain (Bowman et al., 2017), MpBELL4 (Mapoly0013s0027, logFC = 6.79 and logCPM = 4.75) and MpBELL5 (logFC = 2.25 and logCPM = 2.27). MpBELL4 in particular is not detected as differentially expressed in thalli vs. antheridiophores, suggesting it is male-gamete specific, while MpBELL5 shows incomplete transcription in males, suggesting that it might be a female-associated factor. Additional genes previously curated (Higo et al., 2016) include Mp1R-MYB22 (Mapoly0811s0001, logFC = 3.85 and logCPM = 7.15), MpRWP2/MpMID (Mapoly0014s0044, logFC = 3.83, logCPM = 7) whose ortholog in the chlorophycean algae Chlamydomonas specifies minus gametes (Ferris and Goodenough, 1997; Lin and Goodenough, 2007), and MpR2R3-MYB18 (Mapoly0123s0012, logFC = 3.52 and logCPM = 6.81) an ortholog of FOUR LIPS (FLP), which restricts mitosis in stomatal development in Arabidopsis (Lee et al., 2013).
Sporophytic Genes
We re-analyzed the microdissected RNA of 13-day-old sporophytes given that at the time of publication (Frank and Scanlon, 2015) there was no annotated reference genome. These samples have low read-mapping rate using TopHat2 (∼60%), which would leave differentially expressed genes with low CPM undetected. Replicates were compared to its endogenous control, the apical notch microdissected libraries. Due to these limitations, the 85 differentially expressed TFs (57 upregulated, Supplementary Table S13) in sporophytes are skewed to high-fold changes (Figures 2A, 5D). The TFs shared between 13-day sporophytes and mature JGI sporophyte libraries (Figure 2B) include the AP2/B3 domain MpREM4 (Mapoly0006s0205, logFC = 13.86 and logCPM = 6.96), several FAMA-like orthologs MpbHLH35-37 and 50 (Mapoly0031s0072, 74, 75, and 76; average logFC = 9.4 and logCPM = 2.67) involved in stomata development in mosses and tracheophytes (Ohashi-Ito and Bergmann, 2006; Chater et al., 2016); multiple Mp3R-MYBs (Mp3R-MYB3-6 and 9) among others (Supplementary Table S13). However, representative mature sporophyte-enriched genes such as the TALE-class HOMEODOMAIN MpBELL1 (Mapoly0213s0014), MpKNOX2 (Mapoly0194s0001) and the AP2/B3 domain MpREM1 (Mapoly0183s0010) were not upregulated in 13-day sporophytes (Supplementary Table S13). Enrichment analysis confirmed significant overlap between differentially expressed JGI and 13-day sporophyte transcriptomes with a slight significant overlap between female-enriched genes and 13-day sporophytes (Supplementary Figure S6A). Female enriched TFs (Figure 5A) upregulated in 13-day sporophytes include MpTRIHELIX28 and 39, MpASLBD2, MpKNOX1, MpGRAS12, MpNAC8, and MpbHLH29 (Figure 2B and Supplementary Table S2). This could be due to archegonia RNA contamination or a continuation of maternal developmental programs in young sporophytes. Supporting the latter interpretation, 13 of previously classified antheridia enriched genes (Figure 5C) including MpBELL4, MpTRIHELIX16, MpR2R3-MYB3, 6 and 13, MpGRAS7 and MpDEL2 were also detected as upregulated in 13-day sporophytes (Supplementary Figure S6B). MpBELL4 is the only TF exclusively upregulated in antheridia and 13-day sporophytes in our analysis (Supplementary Table S2). Finally, MpBELL5 is upregulated in archegoniophores, antheridia (incomplete transcript) and 13-day sporophytes (Supplementary Table S2).
There are additionally seven genes uniquely upregulated in 13-day sporophytes (Figure 2B), these include: MpWRKY4 (Mapoly0031s0170), MpASLBD19 (Mapoly0817s0001), MpAP2L5 (Mapoly0144s0032), among others (Supplementary Table S2). Orthologs of sporophyte-enriched Physcomitrella genes (Ortiz-Ramírez et al., 2016) include (Supplementary Table S2) the class II TCP TF MpTCP2 (Mapoly0001s0298, logFC = 11.89 and logCPM = 5.02), MpREM4, MpABI3B (Mapoly0474s0001, logFC = 8.29 and logCPM = 3.72) and the SQUAMOSA-PROMOTER BINDING PROTEIN-LIKE MpSPL1 (Mapoly0014s0224, logFC = 1.44 and logCPM = 6.92). These genes are upregulated in other tissues and only MpREM4 seems to be sporophyte-specific (Supplementary Table S2).
Apical Cell
We used the microdissected putative apical cell libraries as controls for the sporophyte DGE analysis (Frank and Scanlon, 2015). This potentially shows that down-regulated genes in sporophytes are upregulated in apical cells (Figure 5D). To try to refine this comparison we discarded genes that were robustly (logFC > 1) upregulated in other tissues (Supplementary Figure S7 and Supplementary Table S14). This resulted in 8 TFs exclusively enriched at logFC > 1 in apical cells. These included a GARP TF MpGARP2/ENO (Mapoly0157s0009, logFC = 5.87 and logCPM = 3.79) belonging to a lineage sister to KANADI genes (Bowman et al., 2017), the B3-domain MpARF2 auxin signaling transcriptional repressor (Mapoly0011s0167, logFC = 2.2 and logCPM = 7.48), the single member of the basal SCGJ bZIP group MpbZIP15 (Mapoly0737s0001, logFC = 2.13 and logCPM = 6.58) and 5 other genes (Supplementary Table S4). Outside this group, the highest expressed TF in the apical cell RNA is MpGRAS4 (Mapoly0031s0041, logFC = 4.97 and logCPM = 6.32), an ortholog of LATERAL SUPRESSOR involved in axillary meristem establishment in Arabidopsis (Greb et al., 2003). MpGRAS4 however, is strongly upregulated in 24 h-sporelings (logFC = 3.26 and logCPM = 3.24), 48 h-sporelings (logFC = 1.18) and weakly in antheridiophores (logFC = 0.89). MpANT is robustly enriched in apical cell tissue (logFC = 3.55 and logCPM = 8.21) but also in 96 h sporelings (Figure 2A). Four genes were exclusively upregulated in apical cells and 24 h-sporelings at logFC > 1: MpbHLH39 (Mapoly0073s0059, logFC = 3.48 and logCPM = 7.27), MpbHLH41, the type-B RESPONSE REGULATOR MpRR-B (Mapoly0101s0006) and MpWRKY9 (Mapoly0051s0057). Finally, MpWRKY10 (Mapoly0057s0012, logFC = 5.25 and logCPM = 4.32) is upregulated exclusively in apical cells and antheridiophores (Supplementary Table S2).
Marchantia Regulatory Genes Are Organized in Co-expression Groups
In order to predict functional roles of clusters of TFs sharing similar expression dynamics, we created a co-expression matrix comparing averages of normalized reads per kilobase per million (RPKMs) across 11 different tissues. Pearson coefficients were calculated for each of the annotated Marchantia TFs, microRNA (miR) precursors as well as hormone biosynthetic and signaling genes. Two stages of sporeling development (48 and 96 h), multiple thallus RNAs, archegoniophores, antheridiophores, antheridia and older sporophytes (JGI) were used in this analysis. Using a minimal RPKM value of 5 as a threshold, a Pearson coefficient heatmap (Figure 6A) suggests at least 9 highly correlated groups, some of which show a greater degree of correlation than others. A distance dendrogram (RPKM < 1) supported the occurrence of multiple groups (Supplementary Figure S8) and we focused on describing nine of the most conspicuous in basis of their tissue-specificity or putative functional relationships (Supplementary Figure S9). The antheridia (group 1) and sporophyte-enriched genes (group 3) combined comprise ∼1/2 of the total sample. This is in agreement with these tissues being the most divergent in terms of form and physiology.
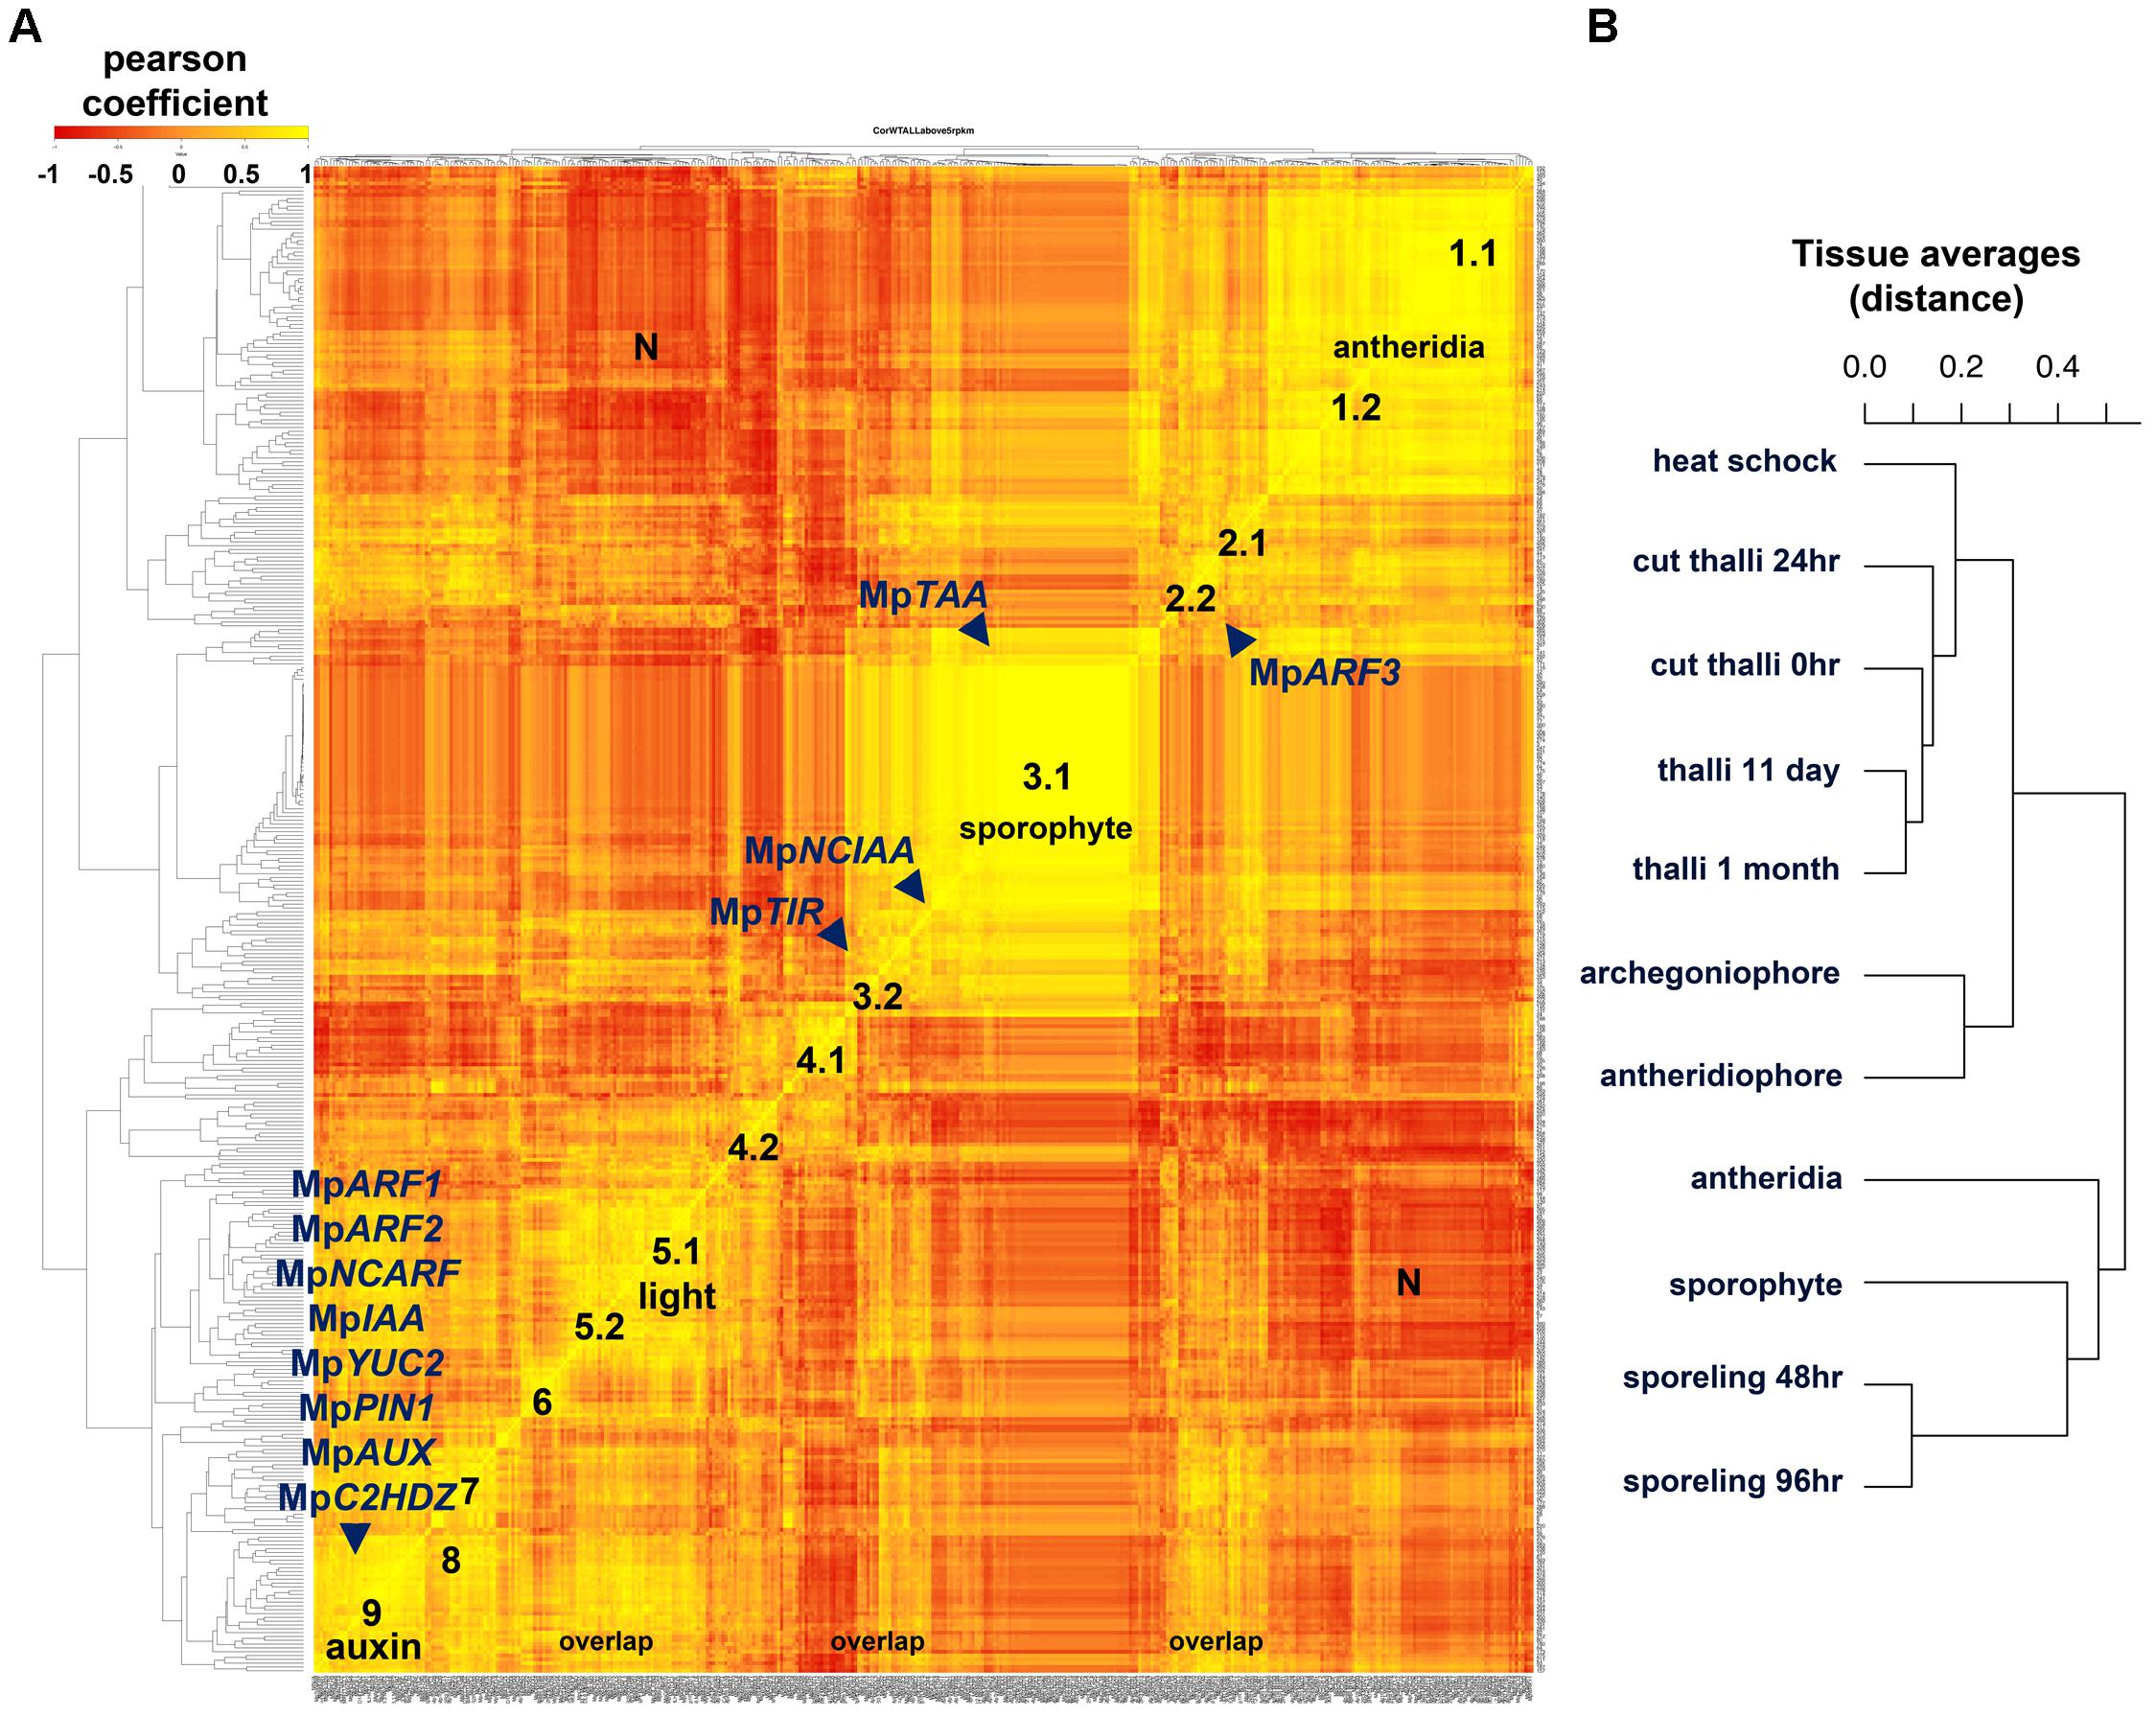
FIGURE 6. Co-expression matrix of regulatory genes in M. polymorpha (A) Heatmap of Pearson coefficient matrix of all annotated M. polymorpha TFs, MIR precursors and putative hormone response and synthesis pathway genes (Supplementary Table S15) in 11 tissue libraries using RPKM values > 5. Co-expression groups were delimited by sets of genes sharing coefficients above 0.8. Genes putatively involved in auxin biosynthesis, perception, signaling and transport are mapped. (B) Distance dendrogram of tissue libraries used in the analysis. Average replicate RPKM values were used per library. Scale for heatmap indicates Pearson coefficients.
Group 1 defined by MpBELL4 partners (Pearson > 0.8, average coefficient = 0.91) composed of 47 TFs includes MpTRIHELIX16, MpKNOX1A, MpKNOX1B, MpRWP2/MID, Mp1R-MYB22, MpPIN2, MpLFY, MpGRAS7 among others (Supplementary Figure S9A). A diffuse group (group 2) includes 9 partners of MpARF3 (Pearson > 0.8, average coefficient = 0.85), many of which were classified as reproductive transition genes, such as, MpSPL1-3, MpbZIP8, MpbHLH17 and 48, MpRR-B, MpC3HDZ, among others (Supplementary Figure S9B). Sporophytic genes (group 3) can be divided between those enriched or specific to the sporophyte. The MpBELL1 subgroup (Pearson > 0.8 and average coefficient = 0.94) is composed of 96 genes including MpREM1 and 4, MpKNOX2, MpYUC1, MpPYL2-4, Mp1R-MYB5,6,19 and 21; Mp3R-MYB2,4-9; MpbHLH8, 9, 11, 18, 22, 25, 34-37 and 51; MpASLBD1,-5, 8, 9, 11, 13-16, 19 and 21, most of which are exclusive to the mature sporophyte (Supplementary Figure S9C). Meanwhile, the MpNCIAA subgroup (Pearson > 0.8, average coefficient = 0.84) is composed of 25 genes including MpTAA, MpERF17, MpGRAS2, MpLUX, MpPHR2, MpACS2, MpMIR319a, MpIDDL1-2, MpASLBD2 and others that fit in the first category (Supplementary Figure S9D). A diffuse group 4.1 (Pearson > 0.8, average coefficient = 0.88) includes six partners of MpbHLH14/MpRSL (Supplementary Figure S9E), which has been shown to promote epidermal outgrowths (Proust et al., 2016). Members of this group include MpNAC4, MpGRAS8, and MpMIR11671 a negative regulator of MpSPL1 (Tsuzuki et al., 2015; Lin et al., 2016). Group 4.1 is expressed maximally in 48 h. sporelings and steadily decreases at later stages (Supplementary Figure S9E). Similar to group 4.1, MpGLD forms a subgroup 4.2 (Pearson > 0.8, average coefficient = 0.91) with five other genes including MpC2H2-9, MpbHLH32, 41, and MpRR-MYB5 that follows a similar decrease in expression pattern albeit with higher expression in the thallus (Supplementary Figure S9F). Group 5 is defined by MpTOC1 partners (Pearson > 0.8, average coefficient = 0.81), composed of 12 TFs including MpbHLH6/MpPIF, the Type-A RESPONSE REGULATOR MpRR-A, MpBBX5, MpWIP, MpETR1, MpERF10, MpGRAS9 among others, possibly reflecting a light signaling/circadian clock module (Inoue et al., 2016; Linde et al., 2017). Group 5 has peaks in thalli with excised apical notches (0 h) and heat-shocked thalli (Supplementary Figure S9G). MpKAN and its partners overlap with most of group 5 (Pearson > 0.8, average coefficient = 0.86) but form a larger group with 42 other members that include MpWRKY8 and 11, MpbHLH15, 23, 27 and 31, MpHSR, and auxin-related genes (which will be discussed in the following paragraph) at the ∼20th rank. The MpKANADI group has its average highest expression only at 0-h cut thalli with excised apical notches suggesting a role in differentiated tissues (Supplementary Figure S9H). Group 6 (Supplementary Figure S9I) comprises 10 genes highly expressed in regenerating thalli (after 24 h of apical notch excision) and includes partners of the apical-cell enriched MpGRAS4 (Pearson > 0.8. average coefficient = 0.85). Other partners include MpR2R3-MYB5 and 20, MpERF20, MpbHLH4, MpGRAS6/DELLA and MpLOG. Given their expression context it is likely that this group regulates certain aspects of thalloid totipotency/regeneration. Group 7 genes are MpSPL2 partners (Pearson > 0.8, coefficient average = 0.88) that overlap considerably with the MpARF3 group, it also includes novel genes such as MpAThook1, MpPIN3, MpMIR11697 which targets MpYUC2 (Lin et al., 2016), MpPLINC and MpGRAS12 (Supplementary Figure S9J). Group 8 (Pearson > 0.8 and coefficient average = 0.87) is defined by partners of MpNAC8 and includes 16 putative female enriched TFs (Supplementary Figure S9K) such as MpKNOX1, MpBPC1, MpTRIHELIX28 and 39, MpPIN3, and MpGRAS12. Group 8 has overlaps with group 2/7 members such as MpSPL2, MpABI3B, MpMIR11697 and it includes MpR2R3-MYB1 a reproductive transition gene with highest expression in females (Supplementary Figure S9K).
Surprisingly, most auxin-related genes formed a large co-expression group (group 9) of 32 TFs (Pearson > 0.8, average coefficient = 0.87, Figure 6). Group 9 is defined by partners of the class A ARF, MpARF1 (Supplementary Figure S9L), a TF regulating physiological and transcriptional auxin responses, gemmae development and gemmae dormancy (Kato et al., 2017). Additional members include the class B ARF, MpARF2 (Supplementary Figure S10), which has been identified as a transcriptional repressor (Kato et al., 2015), the auxin signaling repressor MpIAA (Flores-Sandoval et al., 2015; Kato et al., 2015), the NON-CANONICAL ARF MpNCARF (Mutte et al., 2018), MpYUC2 an auxin biosynthetic gene (Eklund et al., 2015), MpPIN1 a putative intercellular auxin exporter (Bowman et al., 2017), MpAUX/LAX an intercellular auxin importer (Bowman et al., 2017), MpC2HDZ an auxin responsive gene (Mutte et al., 2018), and MpSHI a putative YUC2 activator (Eklund et al., 2010), as well as additional TFs involved in sporeling patterning such as MpGRF and MpANT. A cluster of bHLH genes including MpbHLH10, 42, 43, 45, 47, and 48 are all members of this group. In agreement with recent works (Flores-Sandoval et al., 2018; Mutte et al., 2018) MpARF3 is not co-expressed with any member of the auxin group except for MpNCARF (Pearson = 0.78). A third set of putative auxin related genes showing independent co-expression dynamics includes the putative auxin receptor MpTIR1 as well as NON-CANONICAL IAA MpNCIAA, which are associated with sporophytic genes (Supplementary Figure S9D). The dn-OPDA receptor in Marchantia MpCOI (Monte et al., 2018), is co-expressed with MpARF1 (Pearson = 0.88). MpTAA the major catalyst of Tryptophan into IPA, a precursor of auxin in M. polymorpha (Eklund et al., 2015) is also preferentially expressed in older sporophytes grouping with the sporophyte-specific MpYUC1 (Pearson = 0.91, Figure 6 and Supplementary Figure 9D).
Testing Co-expression Group Robustness in Thalloid Haploid Tissues
To examine co-expression group robustness and mitigate the biasing effects elicited by the non-thalloid sporelings, antheridia, and diploid sporophytic tissues, we generated a co-expression matrix without these three groups (Supplementary Figure S11). In this matrix, MpARF1 forms a co-expression group with MpGRF, MpMADS2, MpCOI, and MIR11707, an amiR targeting MpAGO1 (Tsuzuki et al., 2015; Lin et al., 2016), that remains correlated with the auxin group. As expected, the auxin group now includes MpTAA and MpNCIAA but excludes MpNCARF and MpAUX/LAX. The biggest co-expression groups in this matrix are formed by reproductive genes or antheridiophore-specific genes (Supplementary Figure S11). Within the reproductive group, former groups 2 and 7 have merged to include MpARF3, MpSPL1-3, MpC3HDZ, MpCAMTA, MpNCARF, and MpTPL, which was previously associated with antheridia. MpAUX/LAX is grouped with the light signaling group, which has gained MpLUX, formerly associated with sporophytes. MpWIP, MpKAN, and MpRR-A form their own group, which has overlap with the auxin group.
Co-expression Groups Are Dynamic at the Earliest Stages of Development
To examine how co-expression groups form at the earliest developmental transitions, we generated a matrix exclusive to sporeling RNA libraries. Multiple sporeling co-expression groups are formed that have different affinities with general co-expression groups (Supplementary Figures S2, S3, S5, S12). Auxin-related genes in particular show independent expression patterns prior to their clustering in later developmental stages. For example, the auxin signaling repressor MpIAA forms a well-supported group (Pearson > 0.9) with genes that putatively promote cell proliferation such as the class I TCP gene MpTCP1 (Martín-Trillo and Cubas, 2010; Davière et al., 2014), and the day 1 sporeling-enriched TF MpGRF (Supplementary Figure S2). Additional genes in this group include MpC4HDZ, MpBBX3 and 5, MpGRAS8, MpDOF1 (Pearson > 0.9). MpGRAS4 is also correlated with GRF/TCP1, although more distantly (Pearson > 0.8). In sporelings, MpARF1 and MpARF2 form a well-supported group (Pearson = 0.93) with MpARF1 more closely sharing expression with MpMIR11707/MIRAGO1 (Pearson = 0.99), similar to what is observed in the thallus. MpRAV, MpbHLH48, MpANT, MpR2R3-MYB17, MpbHLH10, 21, 23 MpWIP and MpLOG are all co-expressed genes in this group (Pearson > 0.9). MpYUC2, MpNCIAA, and MpTIR form separate groups from each other and independent from the MpARF1/2 group. With MpTIR and MpNCIAA moderately close to each other (Pearson > 0.75). The largest co-expression group in sporelings consist of genes with high expression in 0-h sporelings. Genes included in this group are MpARF3, MpTAA, MpPIN1, MpSPL2, MpWOX, MpC3HDZ, MpVAL among others. Finally MpNCARF is in another group clustering with MpHMGbox3, MpRR-MYB6, MpHD2/SAWADEE, MpPIN4, and MpIPT1 (Pearson > 0.9).
The Auxin Co-expression Group Is Expressed Independently of the Single Marchantia Class C ARF and NCIAA
To validate a putative auxin co-expression group we performed a co-expression analysis of most PB1-containing genes (MpARF1-3, MpIAA, MpNCARF, and MpNCIAA) against all annotated M. polymorpha genes (Figure 7). Enrichment analysis (Fisher’s exact test) was used to compare co-expression groups (Pearson > 0.8 and P < 0.001) with the multiple datasets obtained from our DGE analysis (Figure 2, P < 0.01, logFC > 0). The MpARF1, MpARF2, MpIAA, and MpNCARF co-expression groups were significantly composed of auxin-induced genes (Mutte et al., 2018) as well as apical cell-enriched transcripts (Figure 7A). Consistent with the TF co-expression matrix, the MpARF3 and MpNCIAA groups are not enriched in auxin-induced transcripts. TFs shared between the MpARF1 and MpARF2 groups and the Mutte et al. (2018) auxin-treated upregulated genes (Figure 7B) are MpC2HDZ, MpR2R3-MYB8, MpbHLH45, MpbHLH43/MpLRL, and MpbHLH42. The MpARF1, MpARF2, and MpIAA groups were also enriched in 96-h sporeling transcripts, particularly the MpARF2 group (Figure 7A). All groups had significant overlap with archegoniophore transcripts, except MpIAA. Only the MpARF3 and MpNCARF groups were enriched with reproductive transition genes (Figure 7A). Finally, the MpNCIAA group was significantly composed of dormant spores (Supplementary Table S3) and 13-day sporophyte enriched genes (Figure 7A). UpSet diagrams (Supplementary Figure S13) corroborated these observations with MpNCIAA having the largest unique co-expression group (588 genes exclusive to NCIAA), followed by MpARF3 (N = 138), MpNCARF (N = 120), MpIAA (N = 83), MpARF1 (N = 58), and finally MpARF2 (N = 14). The most correlated groups were MpARF1, MpARF2, MpNCARF, and MpIAA with 123 genes exclusively shared between them, followed by MpARF1, MpARF2, and MpIAA (66 exclusively shared genes) and MpARF1, MpARF2, and MpNCARF (51 exclusively shared genes). No gene was shared across all groups, with only 21 genes shared between MpARF1-3, MpNCARF and MpIAA. Finally, MpARF3 and MpNCARF co-expression groups shared exclusively 25 genes (Figure 7A).
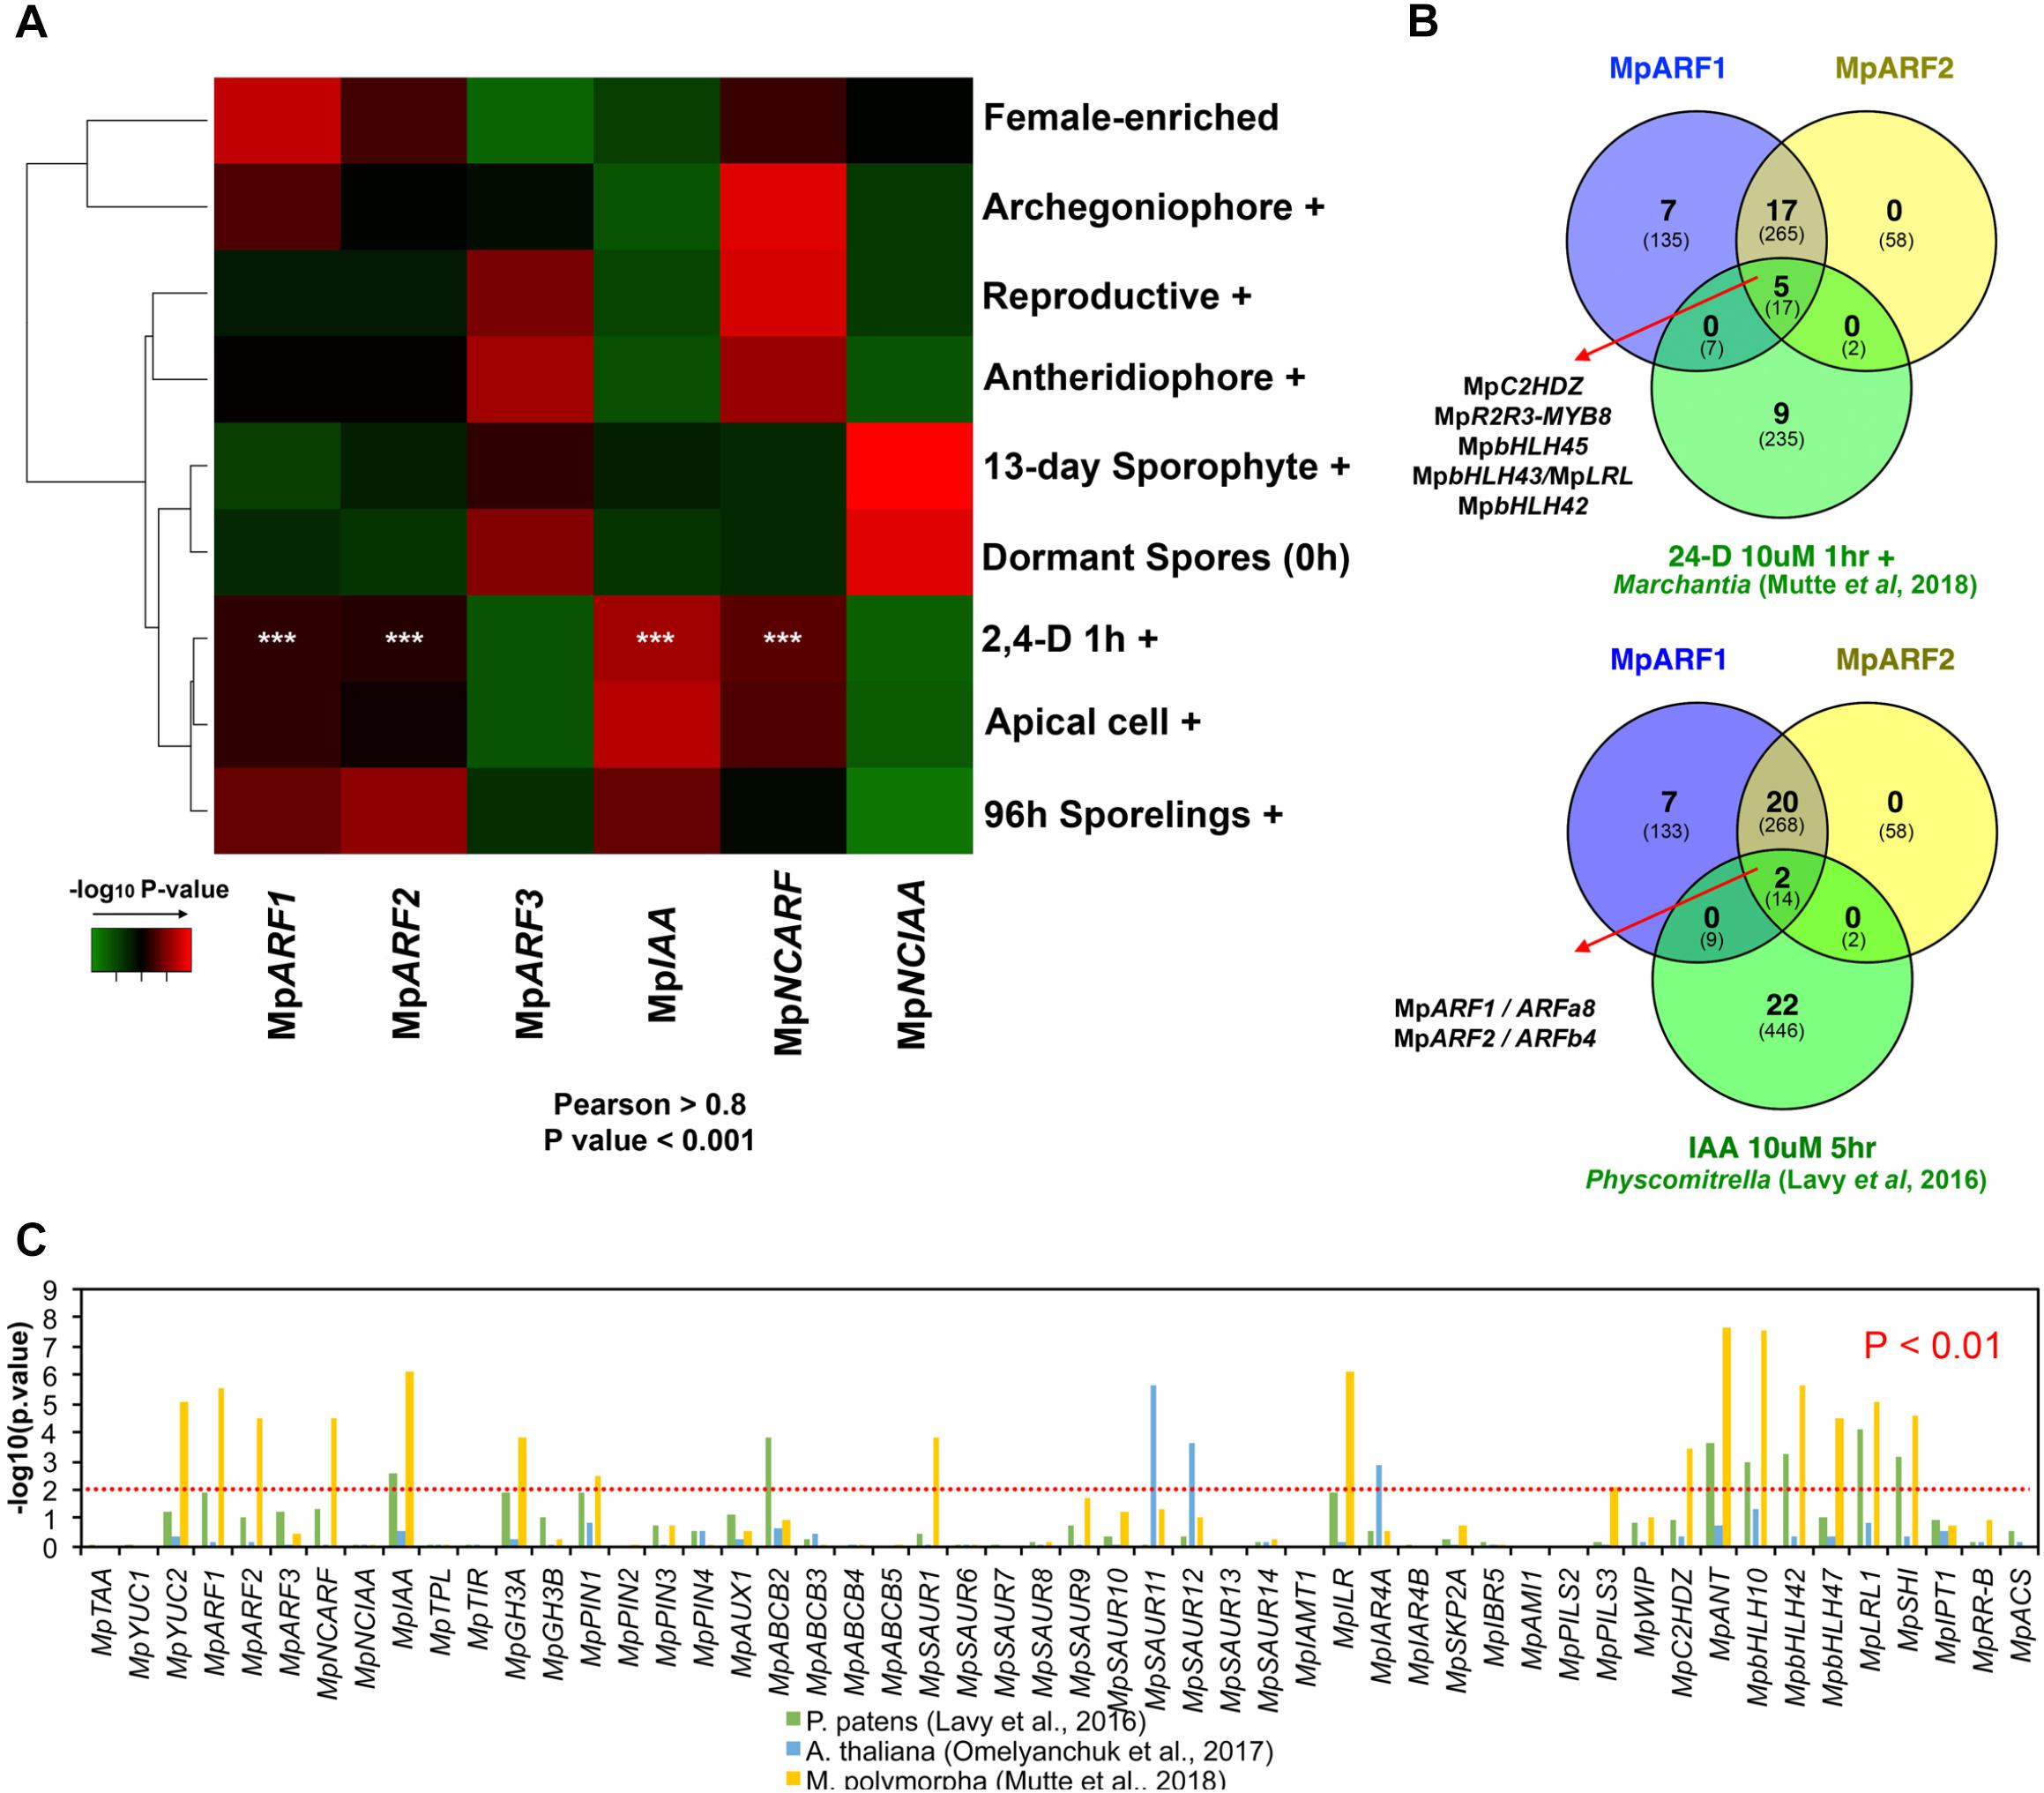
FIGURE 7. Auxin-related genes belong to a common co-expression network in M. polymorpha and other embryophytes. (A) Enrichment analysis heat map interrogating MpARF1-3, MpIAA, MpNCARF, and MpNCIAA co-expression groups with tissue-enriched transcriptomes identified in our DGE analysis. High -log10 P-values are shown in red and are equivalent to highly supported enrichment P-values. For the comparison with the auxin induced transcriptome white asterisks indicate P < 0.01. (B) TFs shared between the MpARF1 and MpARF2 co-expression groups and auxin-induced TFs in M. polymorpha (above) and P. patens (below). The total number of shared genes (or orthologs) is indicated below. (C) Enrichment analysis of all putative auxin-related co-expression groups against auxin-induced genes in M. polymorpha, and uxin-induced orthologs in P. patens and A. thaliana.
Consistent with these results, the MpARF1, MpARF2, MpNCARF, and MpIAA groups share six GO-terms by biological process (Supplementary Figure S14A) and four GO-terms (biological process) are shared between MpARF1, MpARF2 and MpIAA. In contrast, the MpARF3 group showed 12 specific GO-terms (Supplementary Figure S14B) while the MpNCIAA group had 11 specific GO-terms by biological process (Supplementary Figure S14C).
The Auxin Co-expression Group Is Conserved in Bryophytes
To further test the robustness of auxin-related co-expression groups, we compared them with differentially expressed genes (up and down-regulated) in auxin-treated M. polymorpha thalli (Mutte et al., 2018), P. patens protonemal tissue (Lavy et al., 2016) and Arabidopsis root tissue (Omelyanchuk et al., 2017) using enrichment analysis. The co-expression groups of MpARF1, MpARF2, MpNCARF, MpIAA, MpYUC2, MpGH3A, MpPIN1, MpSAUR1, MpILR1, MpPILS3, MpC2HDZ, MpANT, MpbHLH10, MpbHLH42, MpbHLH47, MpbHLH43/MpLRL, and MpSHI showed significant similarity (P < 0.01, Fisher’s exact-test) with DEGs in auxin-treated Marchantia plants (Figure 7C). Meanwhile, the MpIAA, MpABCB2, MpANT, MpbHLH10, MpbHLH42, MpbHLH47, MpbHLH43/MpLRL, and MpSHI groups showed significant resemblance (P < 0.01) to Physcomitrella auxin treated upregulation profiles, with MpARF1, PIN1, MpGH3A, and MpILR groups overlapping at P < 0.05 (Figure 7C). In contrast, only the MpSAUR11, MpSAUR12, and MpIARF4A groups showed significant enrichment with auxin-treated Arabidopsis plants orthologs. This suggests a conservation of auxin co-expression groups across bryophytes, although the only TFs shared between the MpARF1 and MpARF2 co-expression groups and the moss auxin-induced transcriptome are the class A and B ARF orthologs themselves, ARFa8 and ARFb4 (Figure 7B).
Analysis of MpARF3 Gain and Loss-of-Function Mutant Transcriptomes Confirms Validity of Co-expression Groups
We performed DGE analysis (edgeR and DESeq2) in previously isolated Mparf3/Mpmir160 CRISPR mutants (Flores-Sandoval et al., 2018) to test whether: (1) loss of MpARF3 disrupts the auxin co-expression group, (2) genes co-expressed with MpARF3 are altered in mutant alleles, and (3) Mparf3 or Mpmir160 transcriptomes could facilitate identification of genes responsible for developmental aspects of their respective mutant phenotypes. The edgeR analysis identified 2874 differentially expressed genes in Mparf3 compared to the wild type (P < 0.01, 1524 upregulated). Similarly, 2864 differentially expressed genes were identified in comparisons of MpmiR160 mutants with the wild type (P < 0.01, 1572 upregulated). To filter out steady-state false positives and highlight genes dependent on MpARF3 activity, we searched for genes with converse behaviors in the Mparf3 and Mpmir160 transcriptomes. Genes down-regulated in Mparf3 and upregulated in MpmiR160 mutants were considered to be activated, either directly or indirectly, by MpARF3 (Category 1, N = 112; Supplementary Table S18). Conversely, genes upregulated in Mparf3 and down-regulated in Mpmir160 mutants were considered repressed, either directly or indirectly, by MpARF3 (Category 2, N = 115; Supplementary Table S19). Strikingly, genes with similar dynamics, i.e., upregulated (Category 3, N = 501; Supplementary Table S20) or down-regulated (Category 4, N = 470; Supplementary Table S21) in both mutants were ∼4× more abundant, suggesting a large cohort of genes affected by secondary feedback effects independent of the MpmiR160/MpARF3 regulatory module (Figure 8A). The most prevalent protein family found in Category 1 was peroxidases (PF00141, Supplementary Table S22), while Category 2 had an abundance of FB_lectins (PF07367, Supplementary Table S23), four of which were in tandem arrays in scaffold 118 and with high resemblance to fungal lectin genes (Bowman et al., 2017).
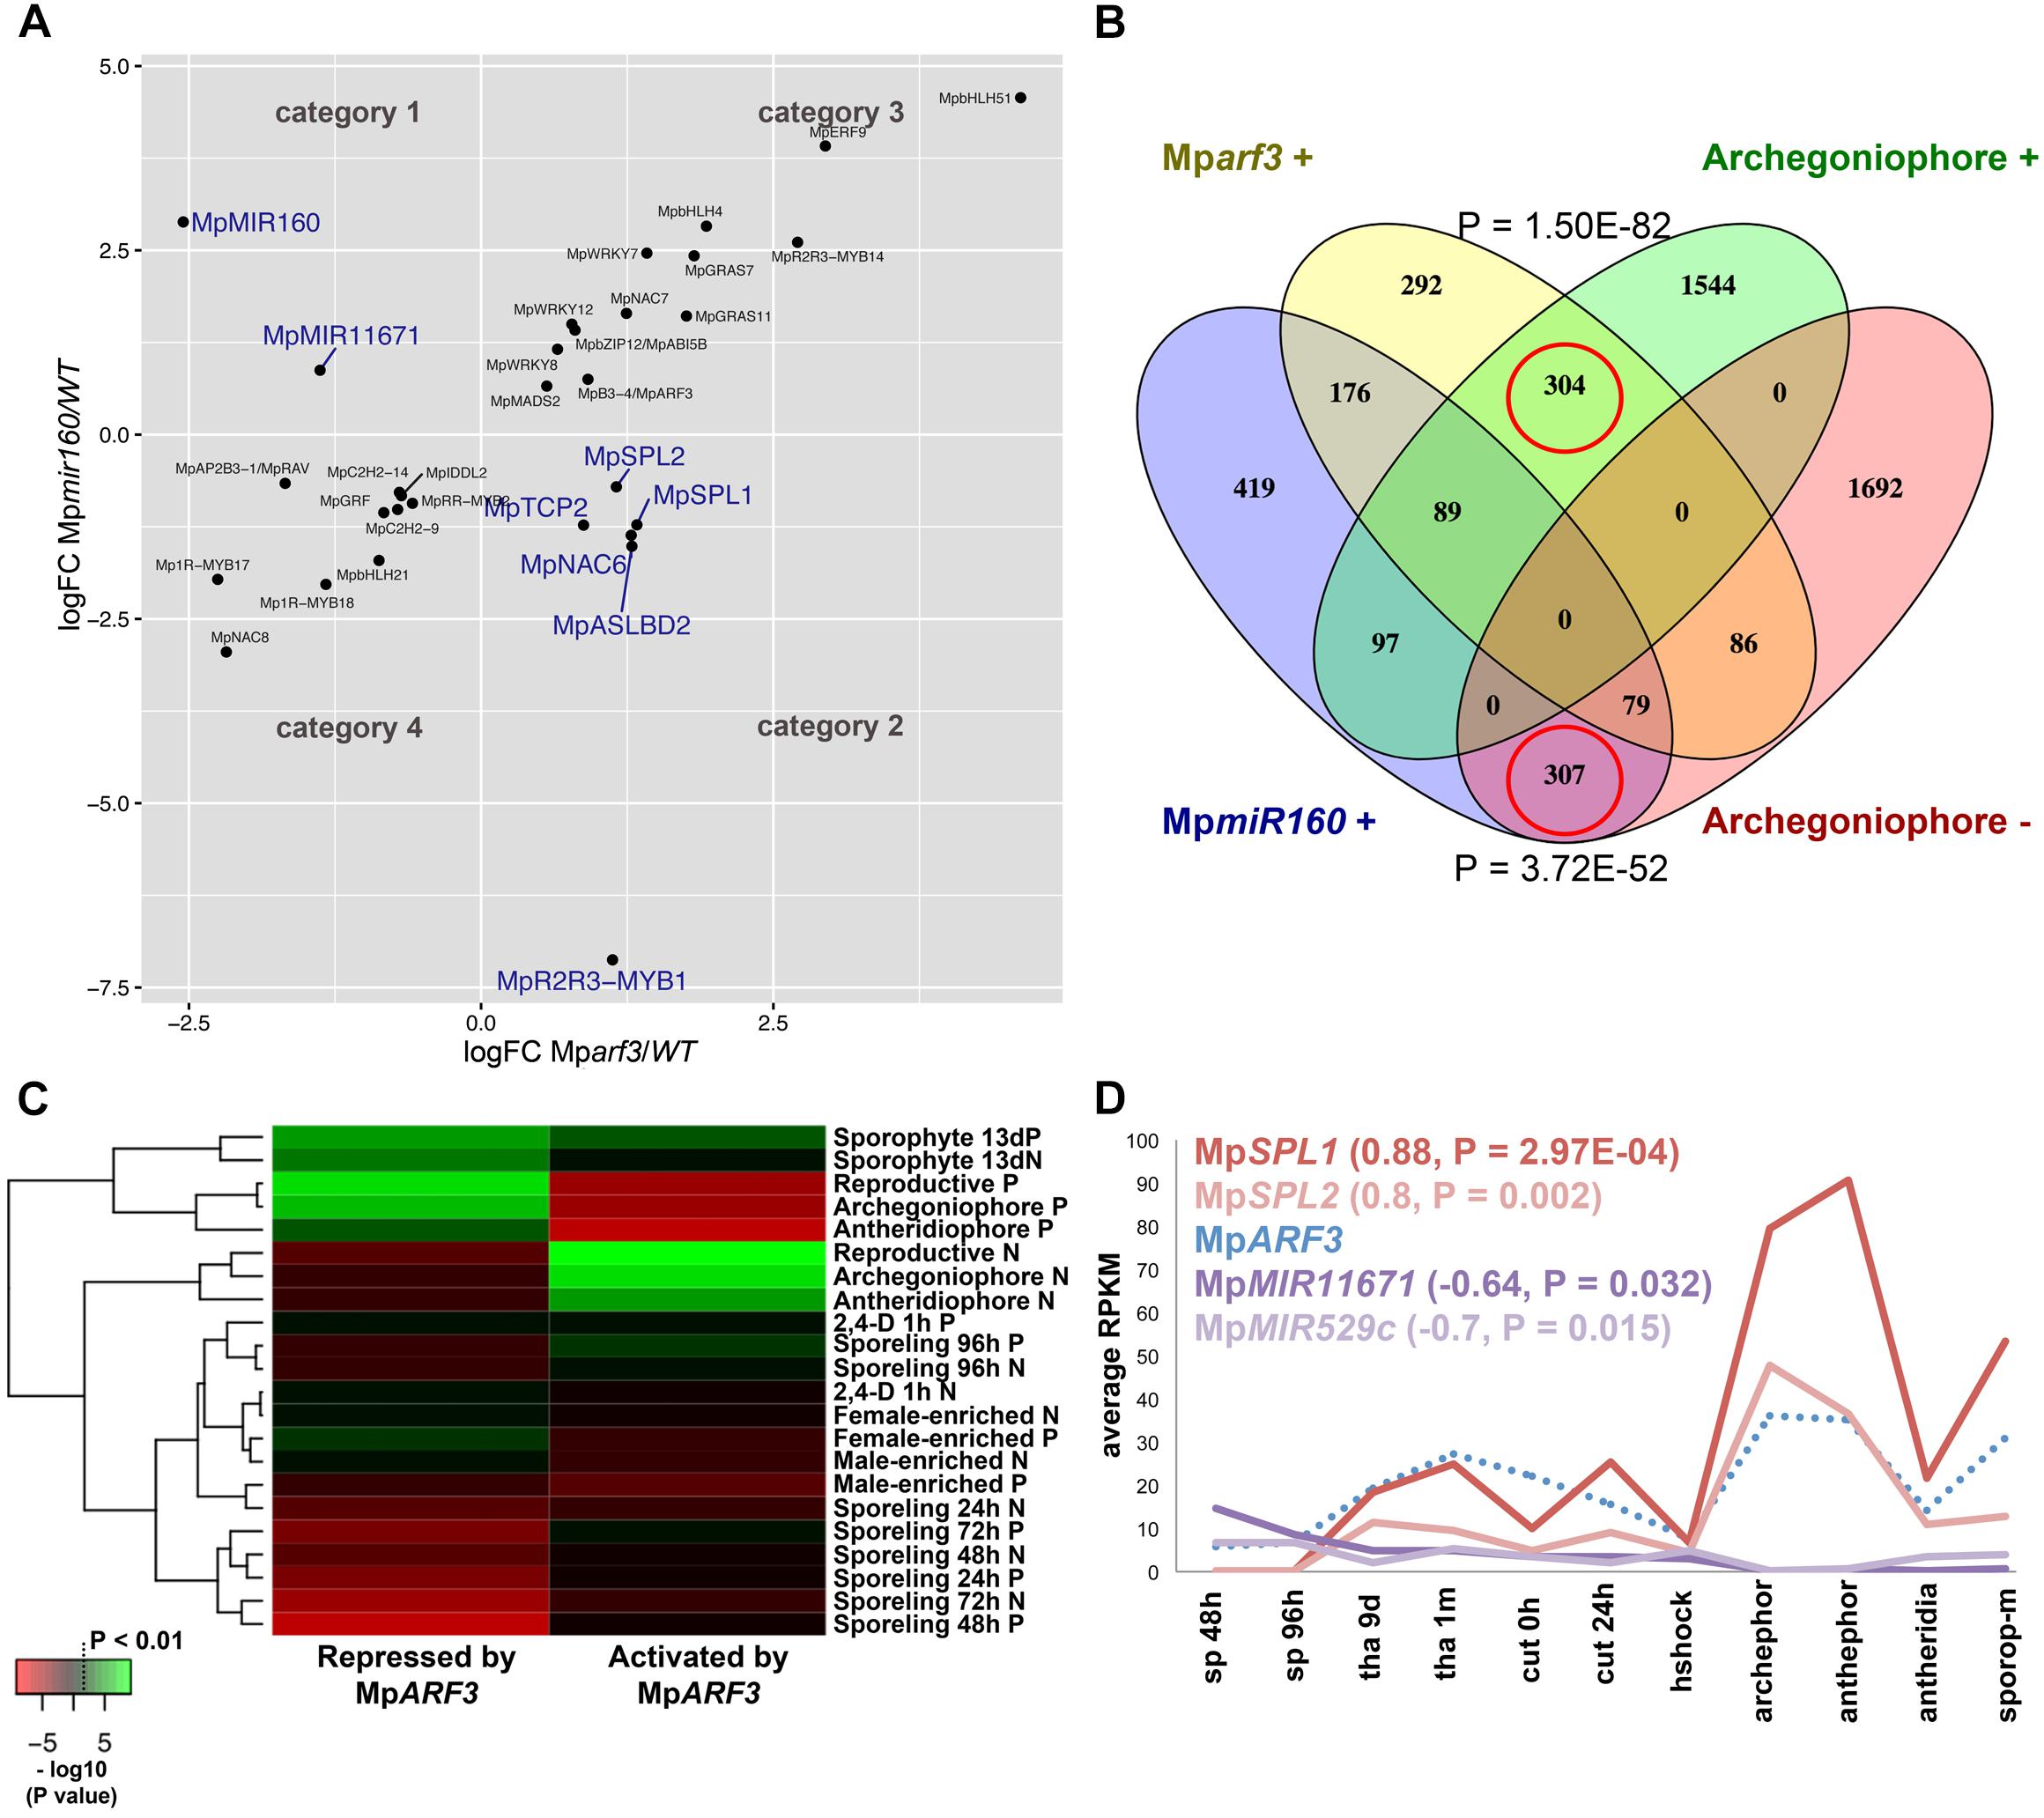
FIGURE 8. The MpARF3/MpMIR160 module controls reproductive transitions in M. polymorpha. (A) Differentially expressed TFs in Mparf3 and Mpmir160 transcriptomes fall into four categories depending on logFC between wild-type and mutant reads. Results are shown for the edgeR pipeline with a P < 0.01 cut-off. Genes in blue are consistent with MpmiR160-dependent repression of MpARF3. (B) Venn diagram showing overlap of genes upregulated in Mparf3 and Mpmir160 transcriptomes with genes whose expression is enriched or downregulated in archegoniophores. (C) Enrichment analysis (Fisher’s exact test) of genes activated (category 1) or repressed (category 2) by MpARF3 against all differentially expressed genes obtained from previous analyses in Figure 2. Significant enrichment values are shown in green. (D) Expression dynamics of MpARF3, MpSPL1, MpSPL2, MpMIR11671, and MpMIR529c using average RPKM values. Pearson coefficients and associated P-values are shown in reference to MpARF3.
Although no TFs were identified as activated by MpARF3 (Category 1), two miR precursors fell into this category, with MpMIR160 (Mapoly0002s0211) and MpMIR11671 (Mapoly0239s0004) supported by both edgeR and DEseq2 analyses (Figure 8A). Meanwhile, a third miR precursor, MpMIR529c (Mapoly0006s0020) was also identified as activated by MpARF3 using DESeq2 (Supplementary Figure S14D). We had previously suggested that MpARF3 forms a negative feedback loop with MpmiR160 to control both developmental transitions and differentiation vs. totipotency in a context-dependent fashion (Flores-Sandoval et al., 2018).
The other two miRs identified in our analysis target SPL transcripts (Tsuzuki et al., 2015; Lin et al., 2016), with MpmiR11671 targeting MpSPL1 (Mapoly0014s0224, orthologous to SPL8 of Arabidopsis) and MpmiR529c targeting MpSPL2 (Mapoly0014s0223, orthologous to SPL3-5 of Arabidopsis). Consistent with these results, both MpSPL1 and MpSPL2 appeared as category 2 genes (i.e., repressed by MpARF3) using both edgeR and DEseq2, and supported by protein family GO-terms (P = 0.0006924). Additional TFs identified as downregulated by MpARF3 included MpTCP2 (Mapoly0001s0298), a FEZ-like NAC domain ortholog MpNAC6 (Mapoly0175s0015), the class Ia ASL1 gene MpASLBD2 (Mapoly0008s0060), and MpR2R3-MYB1 (Mapoly0001s0061). MpR2R3-MYB1 was most dramatically downregulated in Mpmir160 alleles (logFC = -7, Figure 8A).
Three of the downregulated TFs (MpSPL1, 2 and MpR2R3-MYB1) as well as MpARF3 itself were classified as reproductive genes in our wild-type DGE analysis (Figure 5). Furthermore, we had previously characterized MpARF3 as an antagonist of reproductive transitions, with Mpmir160 alleles insensitive to gamentangiophore-inducing far-red light treatment and Mparf3 alleles as hypersensitive to far-red light treatment (forming more gametangiophores per area than wild type; Flores-Sandoval et al., 2018). We therefore measured the overlap between genes enriched in gametangiophores (either male or female) and the Mparf3 or MpmiR160 mutants. A significant number of genes (N = 304, P = 1.5 × 10-82, Hypergeometric test) were upregulated in both Mparf3 mutants and wild-type archegoniophores (Figure 8B). Consistently, a significant number of genes were upregulated in MpmiR160 mutants and downregulated in archegoniophores (N = 307, P = 3.7 × 10-52, Hypergeometric test). Enrichment analysis (Fisher’s exact test) using the datasets obtained in our DGE analysis (edgeR, P < 0.01) show that overall transcripts activated by MpARF3 (category 1) are similar to those downregulated in wild type gametangiophores (P < 0.01, Figure 8C). Conversely, transcripts repressed by MpARF3 (category 2) are significantly upregulated in wild type gametangiophores, in particular the subset of reproductive transition genes and not the female or male-enriched genes (Figure 8C). Additionally, 13-day sporophytes also have transcripts that seem to be controlled by MpARF3 although with an ambiguous trend unlike that observed for reproductive tissues. Although some auxin-related or auxin-induced genes were differentially expressed in Mparf3 transcriptomes (Flores-Sandoval et al., 2018), not a single auxin-induced gene had converse expression patterns in the Mparf3 and Mpmir160 transcriptomes (Figure 8A). Finally, the expression dynamics of the candidate TF/MIR pairs shows that MpARF3, MpSPL1 and 2 expression patterns are positively correlated with peaks of expression in gametangiophores (Figure 8D), while the MpMIR11671 and MpMIR529c precursors are negatively correlated with MpARF3 and show down-regulation in gametangiophores. Thus, an inverse relationship exists between MpARF3 activity and expression of the MpSPL1-2/MpMIR529c/MpMIR11671 modules in M. polymorpha (Figures 8D, 9B).
Discussion
This study provides a first attempt at characterizing DGE patterns and co-expression groups throughout the life cycle of M. polymorpha (Figure 1). Given their hierarchal regulatory character, TFs were chosen as a proxy for the thousands of genes differentially expressed between cell and tissue types. DGE analysis reveals that only a minority of TFs show dramatic fold-changes between developmental transitions in M. polymorpha. However, this figure is qualified by the limited number of tissues and environmental conditions sampled in our analysis (Figure 2). These differentially expressed TFs are candidates for functional analysis to assess whether they determine cell identity or broader processes required for tissue patterning, i.e., meiosis, cell division, expansion, stress-responses.
The relatively small number of annotated TFs (∼400) in M. polymorpha (Bowman et al., 2017) facilitated construction of a co-expression matrix using 11 tissues, including sporelings, thallus, gametangiophores, antheridia and sporophytes. This matrix resolved multiple discrete groups with variable levels of overlap and putative interactions (Figure 6). As expected, some groups correspond to tissue-specific TF enrichment (e.g., sporophytes, antheridia, archegoniophores or regenerating tissue). Surprisingly, a second kind of group that did not show enrichment in any one type of library (Supplementary Figures S9E,G,I,L) was also identified. These groups include the partners of MpARF1 or MpTOC1, which are involved in auxin and light/circadian responses, respectively. Members of these co-expression groups were differentially expressed in multiple stages but did not change dramatically across our pair-wise comparisons, likely due to lack of inductive environmental conditions or because they are under tight regulatory feedbacks. Thus, our data suggests developmental transitions are also defined by the additive influence of multiple members of a co-expression group.
TF Functions Predicted by Our Analysis
Totipotency
A set of TFs that could represent regulating factors controlling aspects of totipotency include the LAS ortholog MpGRAS4, MpANT, and MpARF2. MpGRAS4 is enriched in the apical cell and both 24 and 48 h sporelings. It is further nested in a co-expression group enriched in 24-h regenerating tissue following wounding (Supplementary Figure S9F). Thus, MpGRAS4 is expressed in tissues united by active cell proliferation. Second, the ANT/PLT/BBM ortholog, MpANT, is enriched exclusively in apical cells and 96 h sporelings, raising the possibility that its action is downstream of MpGRAS4. MpANT is also co-expressed in the auxin cluster (Supplementary Figure S10), suggesting that it may be auxin-inducible, as occurs in angiosperm model systems (Galinha et al., 2007; Ding and Friml, 2010). Consistent with this scenario, MpARF2 is also an apical-cell enriched gene whose expression steadily increases from 72-h sporelings (in parallel with MpARF1, Supplementary Figure S4A). It is plausible, given that MpARF1 and MpARF2 act as respective activators or repressors of transcription (Kato et al., 2015), that antagonism between MpARF1 and MpARF2 at 72 h stabilizes MpANT expression in 96 h sporelings, subsequently forming a co-expression group throughout development. Given that LAS has key roles specifying axillary meristems in angiosperms, and that ANT/PLT/BBM orthologs act in meristems in both angiosperms (Aida et al., 2004) and mosses (Aoyama et al., 2012), there might be more overlap between haploid and diploid meristems than previously acknowledged (Frank and Scanlon, 2015).
Cell Proliferation and Auxin
Additional genes may play a role in cellular processes that contribute to, but do not specify, meristematic tissues. For example, a cluster represented by the 24-h sporelings involving MpTCP1, MpGRF, MpC4HDZ and MpIAA genes could represent a cell proliferation group. MpGRF in particular is highly expressed in the first day of sporeling germination, but it is also co-expressed with auxin-related genes throughout the life cycle (Figure 6A and Supplementary Figure S11). Auxin signaling in 24-h sporelings may be constrained by the presence of the known MpIAA auxin signaling repressor (Flores-Sandoval et al., 2015; Kato et al., 2015). Given that key aspects of auxin physiology in M. polymorpha involve organ differentiation (Eklund et al., 2015; Flores-Sandoval et al., 2015; Kato et al., 2015), it is tempting to speculate that there may be an antagonism between auxin-dependent differentiation and cell proliferation elicited by MpGRF and other TFs in M. polymorpha.
Differentiation Factors
An auxin-inducible gene (Mutte et al., 2018) characterized in M. polymorpha is the IDDL-like Zinc Finger MpWIP TF, which is essential for air pore differentiation (Jones and Dolan, 2017). Consistently, MpWIP is upregulated in 96-h sporelings at the time of photosynthetic tissue proliferation (Supplementary Figure S5). MpWIP is co-expressed (Supplementary Figure S9H) with the GARP TF MpKAN, whose orthologs influence organ polarity in angiosperms (Eshed et al., 2001). MpKAN and its co-expression partner MpWRKY8 are in turn clearly enriched in 0-h cut thalli that lack apical notches and haven’t initiated regeneration. One hypothesis is that members of this group may regulate key aspects of differentiation possibly downstream of auxin and light signaling, given their overlap in expression patterns (MpKAN and MpARF1 have a Pearson coefficient of 0.76, while MpPIF and MpKAN have a coefficient of 0.8).
Reproductive Genes in Marchantia
Comparisons between gametangiophore datasets facilitated distinctions between reproductive transition TFs (enriched in both sexes) vs. female or male-enriched TFs. MpBNB served as a marker to validate this group given its role in promoting formation of gametangiophores irrespective of sex (Yamaoka et al., 2018). A co-expression group including MpSPL1, MpSPL2, MpC3HDZIP, MpABI3B, MpARF3, among others correlates with the vegetative to reproductive transition and is supported by mutant transcriptomes (see below section). Interestingly, auxin-repressed genes are significantly represented in archegoniophore and antheridiophore-enriched transcripts (Supplementary Figure S4B), suggesting a repressor(s) of auxin signaling is a member of the reproductive transition group. Male-enriched TFs were refined by the presence of antheridia libraries, which suggest a robust set of male gamete-enriched TFs and these have been extensively described in previous studies (Higo et al., 2016). MpRWP2/MpMID could provide an interesting candidate for an antheridia specific factor given that its orthologs specify minus gametes in green algae (Ferris and Goodenough, 1997).
Extended Parental to Zygotic Transition in M. polymorpha
The identification of female and antheridia-enriched TFs allowed comparisons with upregulated TFs in 13-day sporophytes, consisting of ∼10 cells and at which point sporogenous tissue differentiation has not commenced (Frank and Scanlon, 2015). Female-enriched TFs shared with young sporophytes include members of 10 TF families. Male-enriched TFs shared with young sporophytes involve members of 7 TF families, although MpBELL4 is the only identified TF exclusively upregulated in antheridia and young sporophytes (Figure 2B). Enrichment analysis (Supplementary Figure S6) suggests that only archegoniophore-enriched genes are significantly represented in 13-day sporophyte transcriptomes. Thus, the possibility of RNA contamination from maternal tissues still remains as a plausible explanation to this phenomenon.
Class C ARF and MpNCIAA Genes Are Independent of Other Auxin Related Genes
The discovery of a putative auxin co-expression group among transcription factors (Figure 6) coincides with a similar PIN1-related co-expression group observed in moss (Ruprecht et al., 2017b), suggesting an ancestral origin for the auxin co-expression network in land plants. The robustness of the auxin TF co-expression group was tested using whole-genome co-expression analysis for candidate genes and comparisons with the only available auxin-inducible transcriptome in M. polymorpha (Mutte et al., 2018). Enrichment analysis supports significant overlap between MpARF1, MpARF2, MpIAA, MpNCARF, MpYUC2, MpSAUR1, MpPIN1, MpGH3A, and MpILR1 co-expression groups and the M. polymorpha auxin-upregulated transcriptome (Figures 7A,C). Other TFs within the auxin co-expression group but strictly not involved in auxin biosynthesis, transport, conjugation or responses include MpANT, MpSHI, MpbHLH10, 43, 45 and 47, MpMIR11707, MpR2R3-MYB8, and MpC2HDZ (Figure 7C and Supplementary Figure S12). They could represent upstream or downstream elements regulating the module (Mutte et al., 2018) and are suitable candidates for future characterization. Importantly, many of these genes are also part of the auxin-inducible transcriptome of Physcomitrella but not Arabidopsis (Figure 7C), suggesting they were key components of the auxin co-expression network in the ancient bryophyte ancestor. As MpbHLH43/LRL possibly mediates ectopic rhizoid formation (Breuninger et al., 2016) in response to exogenous auxin in M. polymorpha its association was anticipated. Furthermore, 5 of the 14 TFs induced by auxin (Supplementary Table S24) in M. polymorpha are found within the MpARF1 and MpARF2 co-expression groups (Figure 7B). Notably, the class C ARF, MpARF3, a gene that is not necessary for physiological and transcriptional auxin responses (Flores-Sandoval et al., 2018; Mutte et al., 2018), forms part of an independent co-expression group highly active in reproductive structures (Figure 8 and Supplementary Figure S9). However, MpARF3 still shares members with MpNCARF (72 genes), MpARF1/MpARF2/MpNCARF/MpIAA (21 genes) and MpNCIAA (9 genes, Supplementary Figure S13) co-expression groups. The significance of this connectivity was tested (Supplementary Table S25), providing ways in which MpARF3 competes for MpARF1 and MpARF2 targets in an auxin-independent manner. Importantly, the MpARF3 and MpNCARF co-expression groups are enriched in reproductive transition genes (Figure 7A), opening the possibility of interaction at this developmental stage. MpNCIAA is another PBI-containing factor that forms an independent group with sporophyte-enriched transcripts (Figure 7 and Supplementary Figure S9) and is also not essential for transcriptional auxin responses (Mutte et al., 2018). Consistent with their auxin independence, both class C ARFs and NCIAAs evolved before the origin the canonical auxin-signaling pathway (and land plants), and thus they may act in independent regulatory networks. The putative roles of NCIAA genes in patterning sporophytic development are of interest although these genes are also expressed in haploid tissues in M. polymorpha.
RNA-Seq Data Supports the Role of MpARF3 as an Inhibitor of Reproductive Transitions
We have previously described MpARF3 as a repressor of differentiation in multiple developmental contexts. For example, Mparf3 mutants display developmental transition, defects, such as ectopic differentiation of air pores, scales, pegged rhizoids, and gametophores, and are deficient in forming undifferentiated gemmalings (Flores-Sandoval et al., 2018; Mutte et al., 2018). Meanwhile strong MpARF3 gain-of-function alleles form undifferentiated calli whose cell identity resembles that of young sporelings or prothalli (Flores-Sandoval et al., 2018). Thus, we anticipated the transcriptome data should reflect aspects of these developmental defects. Using gain- and loss-of-function MpARF3 transcriptomes, were able to discern secondary feedback, treatment-dependent and steady state effects and thus assign with more confidence genes genuinely dependent on the MpMIR160/MpARF3 regulatory module (category 1 and 2 genes, Figure 8). Indeed, enrichment analysis demonstrated that MpARF3 represses, directly or indirectly, genes that promote reproductive transitions (Figure 8). Consistently, MpARF3 activates genes that inhibit production of, or at least are downregulated in, sexual organs. We therefore propose the hypothesis (Figure 9A) that MpARF3 inhibits the reproductive transition in M. polymorpha via activation of the MpMIR11671 and MpMIR529c precursors, which in turn target MpSPL1 and MpSPL2. This appears plausible, given the observed MpSPL1 and MpSPL2 RPKM values in Mparf3/mir160 mutant backgrounds (Figure 9B) and the roles of SPL genes in regulating heteroblastic changes and specifically in promoting reproductive transitions in angiosperms (Huijser and Schmid, 2011) and possibly mosses (Cho et al., 2012).
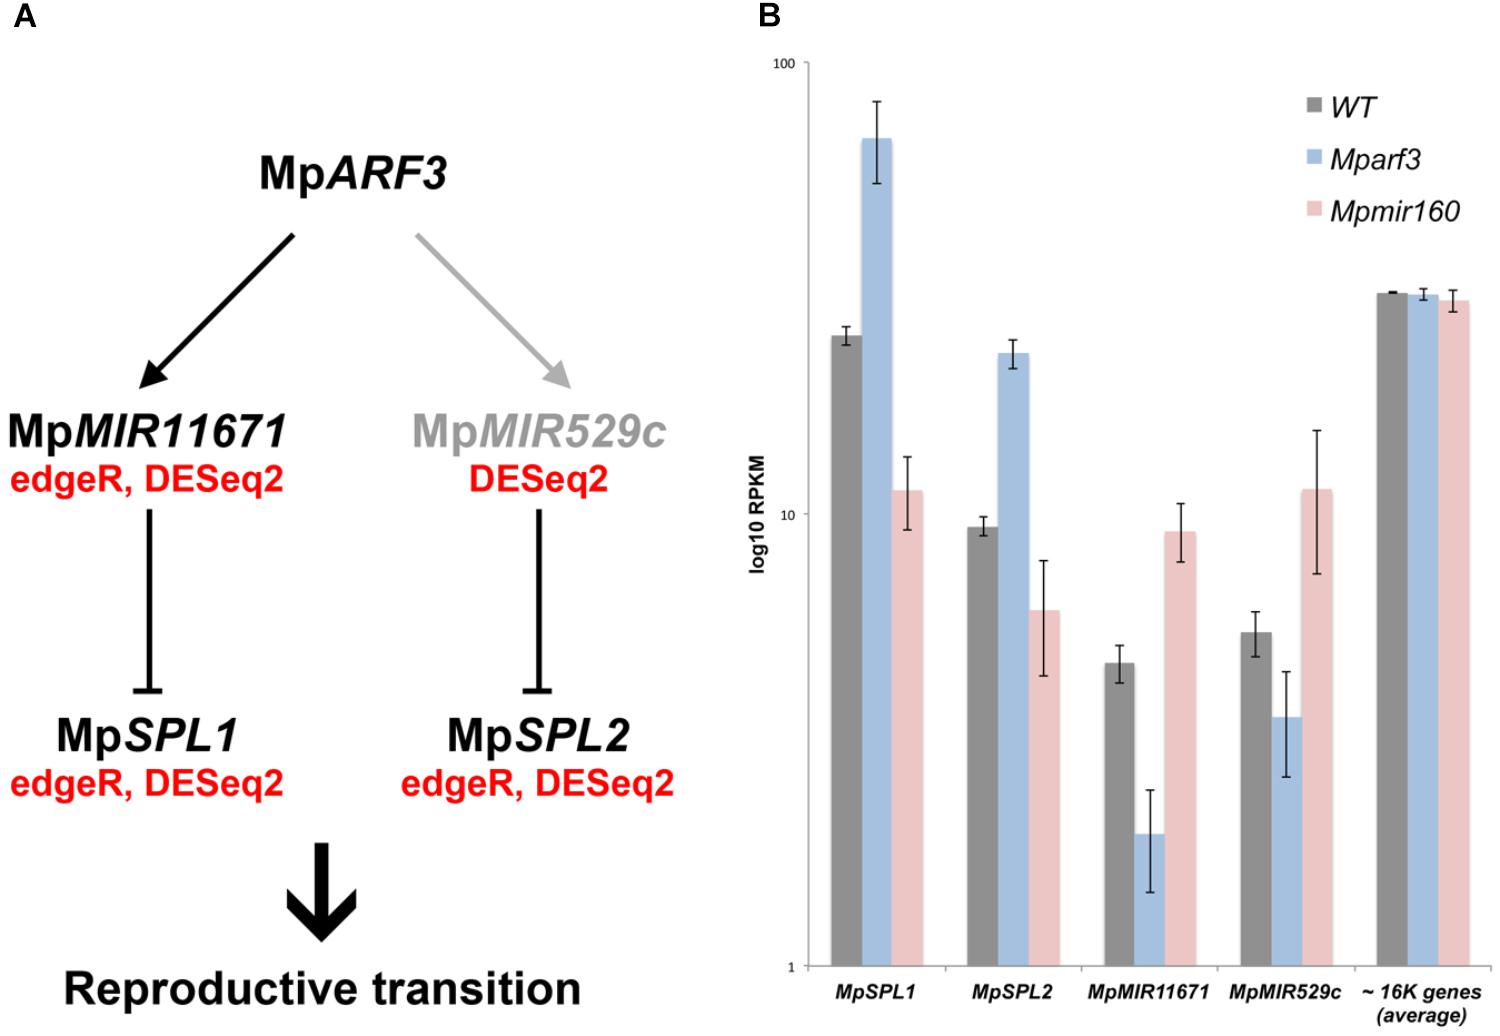
FIGURE 9. Model for MpARF3 dependent regulation of reproductive phase changes in M. polymorpha. (A) Putative regulatory relationships between MpARF3 and MpSPL1-2 as supported by RNA-Seq data. Relationships supported by two (edgeR and DESeq2) or one statistical analyses (DESeq2) are indicated. Reproductive phase change roles are attributed to M. polymorpha SPL genes given their common enrichment in gametangiophores. (B) Average log10RPKM values (biological triplicates) for MpSPL1, MpSPL2, MpMIR11671, and MpMIR529c in our experimental conditions. The average RPKM value for all mapped genes (N = 16520) per library is ∼30. Error bars show SD.
Author Contributions
EF-S generated data for Figures 1–5. EF-S and FR generated data for Figures 6–8. FR created scripts for enrichment analysis and GO-terms pipelines. EF-S designed all figures, except Figures 6, 7, which were jointly designed by EF-S and FR. EF-S and JB co-wrote the manuscript and interpreted the data. All authors analyzed and revised the data.
Funding
This work was made possible by funding from the Australian Research Council (DP160100892 and DP170100049 to JB) and by the Agencia Nacional de Promoción Científica y Tecnológica (PICT2013-3285 and PICT2017-1484).
Conflict of Interest Statement
The authors declare that the research was conducted in the absence of any commercial or financial relationships that could be construed as a potential conflict of interest.
Acknowledgments
We thank all past and current members of the Bowman Lab for feedback and helpful discussions. The Monash University Bioinformatics platform provided helpful guidance and feedback. The Monash Next Generation sequencing facility (Micromon) sequenced the Mparf3 and Mpmir160 transcriptomes. We thank Sandra K. Floyd, Tom Dierschke, and John Alvarez for providing images for Figure 1.
Supplementary Material
The Supplementary Material for this article can be found online at: https://www.frontiersin.org/articles/10.3389/fpls.2018.01345/full#supplementary-material
FIGURE S1 |(A) Frequency of log2FC values in pairwise comparisons performed in this study. (B) UpSet diagram of upregulated genes (logFC), including all curated TFs, in this study. Red asterisk indicates TFs not differentially expressed in any DGE analysis comparison.
FIGURE S2 | Identification of co-expression groups of 24-h enriched TFs in M. polymorpha sporelings. RPKM values are shown for all replicates from 0 to 96 h.
FIGURE S3 | Identification of co-expression groups of 48-h enriched TFs M. polymorpha sporelings. RPKM values are shown for all replicates from 0 to 96 h.
FIGURE S4 | Auxin-signaling and biosynthetic gene expression during sporeling development. (A) RPKM averages of MpARF1, MpARF2, MpARF3, MpIAA, MpTAA, and MpYUC2 during the first four days of sporeling development. Error bars indicate SD. Upregulation of MpARF1 and MpARF2 and downregulation of MpIAA at 96 h are statistically supported. P-values marked are from edgeR analysis. (B) Enrichment analysis of auxin upregulated and downregulated genes probed against multiple developmental RNA-Seq libraries obtained from DGE analysis. The tissue with the highest resemblance to the auxin-upregulated transcriptome is 96-h sporelings.
FIGURE S5 | Identification of co-expression groups of 72 and 96-h enriched TFs M. polymorpha sporelings. RPKM values are shown for all replicates from 0 to 96 h.
FIGURE S6 | Sporophytic gene expression in M. polymorpha. (A) Enrichment analysis of 13-day and JGI manually dissected sporophytes shows significant enrichment between the transcriptomes. Genes classified as female-enriched (Supplementary Table S10) are also statistically represented in 13-day sporophyte transcriptomes. (B) Venn Diagram of shared TFs between antheridia, archegoniophore, 13-day and JGI sporophytes. Putative maternal, paternal and common TFs continuing expression in 13-day sporophytes are annotated. The + symbol indicates upregulation (logFC > 0).
FIGURE S7 | UpSet diagram of tissue-specific TF enrichment at logFC > 1. Red asterisk shows eight uniquely upregulated TFs in apical cells at logFC > 1 compared to other tissues.
FIGURE S8 | Distance dendrogram generated with hclust (R Version 2.3.2) of all annotated M. polymorpha TFs (Supplementary Table S1) in 11 tissue libraries using RPKM > 1 as a threshold.
FIGURE S9 | RPKM dynamics of TF/response/biosynthetic genes obtained in our analysis. Pearson coefficients above 0.8 were used to define the MpBELL4 (A), MpARF3 (B), MpBELL1 (C), MpNCIAA (D), MpbHLH14/RSL (E), MpGRAS4 (F), MpTOC1 (G), MpGARP1/KAN (H), MpGARP8/GLD (I), MpSPL2 (J), MpNAC8 (K), and MpARF1 (L) coxpression groups. Accompanying TFs are indicated at the left of each graph.
FIGURE S10 | RPKM dynamics of the putative auxin co-expression group genes.
FIGURE S11 |(A) Heatmap of Pearson coefficient matrix of all annotated M. polymorpha TFs, MIR precursors and putative hormonal genes (Supplementary Table S16) RPKM values above 0.75 (to include MpANT) in sporeling tissues. Putative groups were delimited by sets of genes sharing coefficients above 0.8. Genes putatively involved in auxin biosynthesis, perception, signaling and transport are mapped, together with accompanying partners in smaller fonts. (B) Distance dendrogram of tissue libraries used in the analysis. Average replicate RPKM values were used per library. Scale for heatmap indicates Pearson coefficients.
FIGURE S12 |(A) Heatmap of Pearson coefficient matrix of all annotated M. polymorpha TFs, MIR precursors and putative hormonal genes with RPMK values above 5 (Supplementary Table S17) in thalli and gametangiophores. Putative groups were delimited by sets of genes sharing coefficients above 0.8. Genes putatively involved in auxin biosynthesis, perception, signaling and transport are mapped, together with accompanying partners in smaller fonts. (B) Distance dendrogram of tissue libraries used in the analysis. Average replicate RPKM values were used per library. Scale for heatmap indicates Pearson coefficients.
FIGURE S13 |(A) UpSet diagram showing shared co-expressed genes (cut-offs indicated) between most PBI-containing genes in M. polymorpha. Numbers of genes exclusive or shared between groups are shown. Co-expression analyses were performed for all expressed genes in our RPKM matrix.
FIGURE S14 |(A) Significant GO-terms (Biological Process) found in the MpARF1, MpARF2, MpNCARF, and MpIAA co-expression groups. X-axis indicates P-Values. (B) Significant GO-terms (Biological Process) found in the MpARF3 co-expression group. X-axis indicates P-values. (C) Significant GO-terms (Biological Process) found in the MpNCIAA co-expresion group. X-axis indicates P-values. (D) TFs differentially expressed in Mparf3 and MpmiR160 transcriptomes using DESeq2 (P < 0.01 cut-off). Genes in blue are consistent with MpmiR160-dependent repression of MpARF3.
TABLE S1 | TFs, MIRs and hormonal genes and accession numbers used in this paper.
TABLE S2 | Shared upregulated genes between DEG analysis comparisons at logFC > 0.
TABLE S3 | Differentially expressed TFs and genes in 24-h sporelings using edgeR.
TABLE S4 | Differentially expressed TFs and genes in 48-h sporelings using edgeR.
TABLE S5 | Differentially expressed TFs and genes in 72-h sporelings using edgeR.
TABLE S6 | Differentially expressed TFs and genes in 96-h sporelings using edgeR.
TABLE S7 | Differentially expressed TFs and genes in archegoniophores using edgeR.
TABLE S8 | Differentially expressed TFs and genes in antheridiophores using edgeR.
TABLE S9 | Differentially expressed TFs and genes shared in archegoniophores and antheridiophores (reproductive TFs) using edgeR.
TABLE S10 | Archegoniophore-enriched TFs and genes using edgeR.
TABLE S11 | Antheridiophore-enriched TFs and genes using edgeR.
TABLE S12 | Differentially expressed TFs and genes in antheridia using edgeR.
TABLE S13 | Differentially expressed TFs and genes in 13-day sporophytes using edgeR.
TABLE S14 | Shared upregulated genes between DEG analysis comparisons at logFC > 1.
TABLE S15 | Pearson coefficient matrix of TFs for Figure 6.
TABLE S16 | Pearson coefficient matrix of TFs for Supplementary Figure S11.
TABLE S17 | Pearson coefficient matrix of TFs for Supplementary Figure S12.
TABLE S18 | Category 1 genes from Mparf3 (x) and Mpmir160 (y)transcriptomes.
TABLE S19 | Category 2 genes from Mparf3 (x) and Mpmir160 (y)transcriptomes.
TABLE S20 | Category 3 genes from Mparf3 (x) and Mpmir160 (y)transcriptomes.
TABLE S21 | Category 4 genes from Mparf3 (x) and Mpmir160 (y) transcriptomes.
TABLE S22 | Go analysis (PF-terms) of Category 1 genes from Mparf3 (x) and Mpmir160 (y) transcriptomes.
TABLE S23 | Go analysis (PF-terms) of Category 2 genes from Mparf3 (x) and Mpmir160 (y) transcriptomes.
TABLE S24 | Differentially expressed TFs in auxin-induced tissue (1 h) from Mutte et al. (2018) using edgeR.
TABLE S25 | Enrichment-analysis between MpARF1-3, MpIAA, MpNCARF, and MpNCIAA co-expression groups, P-values are shown.
Footnotes
References
Afgan, E., Sloggett, C., Goonasekera, N., Makunin, I., Benson, D., Crowe, M., et al. (2015). Genomics virtual laboratory: a practical bioinformatics workbench for the cloud. PLoS One 10:e0140829. doi: 10.1371/journal.pone.0140829
Aida, M., Beis, D., Heidstra, R., Willemsen, V., Blilou, I., Galinha, C., et al. (2004). The PLETHORA genes mediate patterning of the Arabidopsis root stem cell niche. Cell 119, 109–120. doi: 10.1016/j.cell.2004.09.018
Alaba, S., Piszczalka, P., Pietrykowska, H., Pacak, A. M., Sierocka, I., Nuc, P. W., et al. (2015). The liverwort Pellia endiviifolia shares microtranscriptomic traits that are common to green algae and land plants. New Phytol. 206, 352–367. doi: 10.1111/nph.13220
Aoyama, T., Hiwatashi, Y., Shigyo, M., Kofuji, R., Kubo, M., Ito, M., et al. (2012). AP2-type transcription factors determine stem cell identity in the moss Physcomitrella patens. Development 139, 3120–3129. doi: 10.1242/dev.076091
Babicki, S., Arndt, D., Marcu, A., Liang, Y., Grant, J. R., Maciejewski, A., et al. (2016). Heatmapper: web-enabled heat mapping for all. Nucleic Acids Res. 44, W147–W153. doi: 10.1093/nar/gkw419
Boehm, C. R., Pollak, B., Purswani, N., Patron, N., and Haseloff, J. (2017). Synthetic botany. Cold Spring Harb. Perspect. Biol. 9:a023887. doi: 10.1101/cshperspect.a023887
Bowman, J. L., Kohchi, T., Yamato, K. T., Jenkins, J., Shu, S., Ishizaki, K., et al. (2017). Insights into land plant evolution garnered from the Marchantia polymorpha genome. Cell 171, 287.e15–304.e15. doi: 10.1016/j.cell.2017.09.030
Breuninger, H., Thamm, A., Streubel, S., Sakayama, H., Nishiyama, T., and Dolan, L. (2016). diversification of a transcription factor family led to the evolution of antagonistically acting genetic regulators of root hair growth. Curr. Biol. 26, 1622–1628. doi: 10.1016/j.cub.2016.04.060
Cassan-Wang, H., Goué, N., Saidi, M. N., Legay, S., Sivadon, P., Goffner, D., et al. (2013). Identification of novel transcription factors regulating secondary cell wall formation in Arabidopsis. Front. Plant Sci. 4:189. doi: 10.3389/fpls.2013.00189
Chater, C. C., Caine, R. S., Tomek, M., Wallace, S., Kamisugi, Y., Cuming, A. C., et al. (2016). Origin and function of stomata in the moss Physcomitrella patens. Nat. Plants 2, 16179. doi: 10.1038/nplants.2016.179
Cho, S. H., Coruh, C., and Axtell, M. J. (2012). miR156 and miR390 regulate tasiRNA accumulation and developmental timing in physcomitrella patens. Plant Cell 24, 4837–4849. doi: 10.1105/tpc.112.103176
Davière, J.-M., Wild, M., Regnault, T., Baumberger, N., Eisler, H., Genschik, P., et al. (2014). Class I TCP-DELLA interactions in inflorescence shoot apex determine plant height. Curr. Biol. 24, 1923–1928. doi: 10.1016/j.cub.2014.07.012
Devos, N., Szövényi, P., Weston, D. J., Rothfels, C. J., Johnson, M. G., and Shaw, A. J. (2016). Analyses of transcriptome sequences reveal multiple ancient large-scale duplication events in the ancestor of Sphagnopsida (Bryophyta). New Phytol. 211, 300–318. doi: 10.1111/nph.13887
Ding, Z., and Friml, J. (2010). Auxin regulates distal stem cell differentiation in Arabidopsis roots. Proc. Natl. Acad. Sci. U.S.A. 107, 12046–12051. doi: 10.1073/pnas.1000672107
Eklund, D. M., Ishizaki, K., Flores-Sandoval, E., Kikuchi, S., Takebayashi, Y., Tsukamoto, S., et al. (2015). Auxin produced by the indole-3-pyruvic acid pathway regulates development and gemmae dormancy in the liverwort Marchantia polymorpha. Plant Cell 27, 1650–1669. doi: 10.1105/tpc.15.00065
Eklund, D. M., Thelander, M., Landberg, K., Staldal, V., Nilsson, A., Johansson, M., et al. (2010). Homologues of the Arabidopsis thaliana SHI/STY/LRP1 genes control auxin biosynthesis and affect growth and development in the moss Physcomitrella patens. Development 137, 1275–1284. doi: 10.1242/Dev.039594
Eshed, Y., Baum, S. F., Perea, J. V., and Bowman, J. L. (2001). Establishment of polarity in lateral organs of plants. Curr. Biol. 11, 1251–1260. doi: 10.1016/S0960-9822(01)00392-X
Ferreira, S. S., Hotta, C. T., de Carli Poelking, V. G., Leite, D. C. C., Buckeridge, M. S., Loureiro, M. E., et al. (2016). Co-expression network analysis reveals transcription factors associated to cell wall biosynthesis in sugarcane. Plant Mol. Biol. 91, 15–35. doi: 10.1007/s11103-016-0434-2
Ferris, P. J., and Goodenough, U. W. (1997). Mating type in Chlamydomonas is specified by mid, the minus-dominance gene. Genetics 146, 859–869.
Ficklin, S. P., and Feltus, F. A. (2011). Gene coexpression network alignment and conservation of gene modules between two grass species: maize and rice. Plant Physiol. 156, 1244–1256. doi: 10.1104/pp.111.173047
Flores-Sandoval, E., Dierschke, T., Fisher, T. J., and Bowman, J. L. (2016). Efficient and inducible use of artificial MicroRNAs in Marchantia polymorpha. Plant Cell Physiol. 57, 281–290. doi: 10.1093/pcp/pcv068
Flores-Sandoval, E., Eklund, D. M., and Bowman, J. L. (2015). A simple auxin transcriptional response system regulates multiple morphogenetic processes in the liverwort Marchantia polymorpha. PLoS Genet. 11:e1005207. doi: 10.1371/journal.pgen.1005207
Flores-Sandoval, E., Eklund, D. M., Hong, S. F., Alvarez, J. P., Fisher, T. J., Lampugnani, E. R., et al. (2018). Class C ARFs evolved before the origin of land plants and antagonize differentiation and developmental transitions in Marchantia polymorpha. New Phytol. 218, 1612–1630. doi: 10.1111/nph.15090
Frank, M. H., and Scanlon, M. J. (2015). Transcriptomic evidence for the evolution of shoot meristem function in sporophyte-dominant land plants through concerted selection of ancestral gametophytic and sporophytic genetic programs. Mol. Biol. Evol. 32, 355–367. doi: 10.1093/molbev/msu303
Galinha, C., Hofhuis, H., Luijten, M., Willemsen, V., Blilou, I., Heidstra, R., et al. (2007). PLETHORA proteins as dose-dependent master regulators of Arabidopsis root development. Nature 449, 1053–1057. doi: 10.1038/nature06206
Gerstein, M. B., Rozowsky, J., Yan, K. K., Wang, D., Cheng, C., Brown, J. B., et al. (2014). Comparative analysis of the transcriptome across distant species. Nature 512, 445–448. doi: 10.1038/nature13424
Greb, T., Clarenz, O., Schäfer, E., Müller, D., Herrero, R., Schmitz, G., et al. (2003). Molecular analysis of the LATERAL SUPPRESSOR gene in Arabidopsis reveals a conserved control mechanism for axillary meristem formation. Genes Dev. 17, 1175–1187. doi: 10.1101/gad.260703
Higo, A., Niwa, M., Yamato, K. T., Yamada, L., Sawada, H., Sakamoto, T., et al. (2016). Transcriptional framework of male gametogenesis in the liverwort Marchantia polymorpha L. Plant Cell Physiol. 57, 325–338. doi: 10.1093/pcp/pcw005
Hori, K., Maruyama, F., Fujisawa, T., Togashi, T., Yamamoto, N., Seo, M., et al. (2014). Klebsormidium flaccidum genome reveals primary factors for plant terrestrial adaptation. Nat. Commun. 5:3978. doi: 10.1038/ncomms4978
Huijser, P., and Schmid, M. (2011). The control of developmental phase transitions in plants. Development 138, 4117–4129. doi: 10.1242/dev.063511
Ichihashi, Y., Aguilar-Martínez, J. A., Farhi, M., Chitwood, D. H., Kumar, R., Millon, L. V., et al. (2014). Evolutionary developmental transcriptomics reveals a gene network module regulating interspecific diversity in plant leaf shape. Proc. Natl. Acad. Sci. U.S.A. 111, E2616–E2621. doi: 10.1073/pnas.1402835111
Inoue, K., Nishihama, R., Kataoka, H., Hosaka, M., Manabe, R., Nomoto, M., et al. (2016). Phytochrome signaling is mediated by phytochrome interacting factor in the liverwort Marchantia polymorpha. Plant Cell 28, 1406–1421. doi: 10.1105/tpc.15.01063
Ishizaki, K., Nishihama, R., Yamato, K. T., and Kohchi, T. (2016). Molecular genetic tools and techniques for Marchantia polymorpha research. Plant Cell Physiol. 57, 262–270. doi: 10.1093/pcp/pcv097
Jones, V. A. S., and Dolan, L. (2017). Mp WIP regulates air pore complex development in the liverwort Marchantia polymorpha. Development 144, 1472–1476. doi: 10.1242/dev.144287
Kareem, A., Durgaprasad, K., Sugimoto, K., Du, Y., Pulianmackal, A. J., Trivedi, Z. B., et al. (2015). PLETHORA genes control regeneration by a two-step mechanism. Curr. Biol. 25, 1017–1030. doi: 10.1016/j.cub.2015.02.022
Kato, H., Ishizaki, K., Kouno, M., Shirakawa, M., Bowman, J. L., Nishihama, R., et al. (2015). Auxin-mediated transcriptional system with a minimal set of components is critical for morphogenesis through the life cycle in Marchantia polymorpha. PLoS Genet. 11:e1005084. doi: 10.1371/journal.pgen.1005084
Kato, H., Kouno, M., Takeda, M., Suzuki, H., Ishizaki, K., Nishihama, R., et al. (2017). The roles of the sole activator-type auxin response factor in pattern formation of Marchantia polymorpha. Plant Cell Physiol. 58, 1642–1651. doi: 10.1093/pcp/pcx095
Kemmeren, P., van Berkum, N. L., Vilo, J., Bijma, T., Donders, R., Brazma, A., et al. (2002). Protein interaction verification and functional annotation by integrated analysis of genome-scale data. Mol. Cell 9, 1133–1143. doi: 10.1016/S1097-2765(02)00531-2
Kim, D., Pertea, G., Trapnell, C., Pimentel, H., Kelley, R., and Salzberg, S. L. (2013). TopHat2: accurate alignment of transcriptomes in the presence of insertions, deletions and gene fusions. Genome Biol. 14:R36. doi: 10.1186/gb-2013-14-4-r36
Kny, L. (1890). “Bau und entwickelung von Marchantia polymorpha,” in Botanische Wandtafeln Mit Erläuterndem, ed. V. von Wiegandt (Berlin: Hempel & Parey).
Koi, S., Hisanaga, T., Sato, K., Shimamura, M., Yamato, K. T., Ishizaki, K., et al. (2016). An evolutionarily conserved plant RKD factor controls germ cell differentiation. Curr. Biol. 26, 1775–1781. doi: 10.1016/j.cub.2016.05.013
Krishnaswamy, S., Verma, S., Rahman, M. H., and Kav, N. N. V. (2011). Functional characterization of four APETALA2-family genes (RAP2.6, RAP2.6L, DREB19 and DREB26) in Arabidopsis. Plant Mol. Biol. 75, 107–127. doi: 10.1007/s11103-010-9711-7
Kubota, A., Kita, S., Ishizaki, K., Nishihama, R., Yamato, K. T., and Kohchi, T. (2014). Co-option of a photoperiodic growth-phase transition system during land plant evolution. Nat. Commun. 5:3668. doi: 10.1038/ncomms4668
Lavy, M., Prigge, M. J., Tao, S., Shain, S., Kuo, A., Kirchsteiger, K., et al. (2016). Constitutive auxin response in Physcomitrella reveals complex interactions between Aux/IAA and ARF proteins. eLife 5:e13325. doi: 10.7554/eLife.13325
Lee, E., Liu, X., Eglit, Y., and Sack, F. (2013). FOUR LIPS and MYB88 conditionally restrict the G1/S transition during stomatal formation. J. Exp. Bot. 64, 5207–5219. doi: 10.1093/jxb/ert313
Lex, A., Gehlenborg, N., Strobelt, H., Vuillemot, R., and Pfister, H. (2014). UpSet: visualization of intersecting sets. IEEE Trans. Vis. Comput. Graph. 20, 1983–1992. doi: 10.1109/TVCG.2014.2346248
Lin, H., and Goodenough, U. W. (2007). Gametogenesis in the Chlamydomonas reinhardtii minus mating type is controlled by two genes, MID and MTD1. Genetics 176, 913–925. doi: 10.1534/genetics.106.066167
Lin, P.-C., Lu, C.-W., Shen, B.-N., Lee, G.-Z., Bowman, J. L., Arteaga-Vazquez, M. A., et al. (2016). Identification of miRNAs and their targets in the liverwort Marchantia polymorpha by integrating RNA-SEQ and degradome analyses. Plant Cell Physiol. 57, 339–358. doi: 10.1093/pcp/pcw020
Linde, A., Eklund, D. M., Kubota, A., Pederson, E. R. A., Holm, K., Gyllenstrand, N., et al. (2017). Early evolution of the land plant circadian clock. New Phytol. 216, 576–590. doi: 10.1111/nph.14487
Liu, H., Yu, X., Li, K., Klejnot, J., Yang, H., Lisiero, D., et al. (2008). Photoexcited CRY2 interacts with CIB1 to regulate transcription and floral initiation in Arabidopsis. Science 322, 1535–1539. doi: 10.1126/science.1163927
Love, M. I., Huber, W., and Anders, S. (2014). Moderated estimation of fold change and dispersion for RNA-seq data with DESeq2. Genome Biol. 15:550. doi: 10.1186/s13059-014-0550-8
Martín-Trillo, M., and Cubas, P. (2010). TCP genes: a family snapshot ten years later. Trends Plant Sci. 15, 31–39. doi: 10.1016/j.tplants.2009.11.003
Mccarty, D. R., Hattori, T., Carson, C. B., Vasil, V., Lazar, M., and Vasil, I. K. (1991). The viviparous-1 developmental gene of maize encodes a novel transcriptional activator. Cell 66, 895–905. doi: 10.1016/0092-8674(91)90436-3
Monte, I., Ishida, S., Zamarreño, A. M., Hamberg, M., Franco-Zorrilla, J. M., García-Casado, G., et al. (2018). Ligand-receptor co-evolution shaped the jasmonate pathway in land plants. Nat. Chem. Biol. 14, 480–488. doi: 10.1038/s41589-018-0033-4
Mutte, S. K., Kato, H., Rothfels, C., Melkonian, M., Wong, G. K.-S., and Weijers, D. (2018). Origin and evolution of the nuclear auxin response system. eLife 7:e33399. doi: 10.7554/eLife.33399
Netotea, S., Sundell, D., Street, N. R., and Hvidsten, T. R. (2014). ComPlEx: conservation and divergence of co-expression networks in A. thaliana, Populus and O. sativa. BMC Genom. 15:106. doi: 10.1186/1471-2164-15-106
Ohashi-Ito, K., and Bergmann, D. C. (2006). Arabidopsis FAMA Controls the Final Proliferation/Differentiation Switch during Stomatal Development. Plant Cell 18, 2493–2505. doi: 10.1105/tpc.106.046136
Ohtaka, K., Hori, K., Kanno, Y., Seo, M., and Ohta, H. (2017). Primitive auxin response without TIR1 and Aux/IAA in the charophyte alga klebsormidium nitens. Plant Physiol. 174, 1621–1632. doi: 10.1104/pp.17.00274
Oliveros, J. C. (2007). Venny. An interactive Tool for Comparing Lists with Venn Diagrams. Available: http://bioinfogp.cnb.csic.es/tools/venny/index.html
Omelyanchuk, N. A., Wiebe, D. S., Novikova, D. D., Levitsky, V. G., Klimova, N., Gorelova, V., et al. (2017). Auxin regulates functional gene groups in a fold-change-specific manner in Arabidopsis thaliana roots. Sci. Rep. 7:2489. doi: 10.1038/s41598-017-02476-8
Ortiz-Ramírez, C., Hernandez-Coronado, M., Thamm, A., Catarino, B., Wang, M., Dolan, L., et al. (2016). A transcriptome atlas of physcomitrella patens provides insights into the evolution and development of land plants. Mol. Plant 9, 205–220. doi: 10.1016/j.molp.2015.12.002
Pandey, G. K. (2005). ABR1, an APETALA2-domain transcription factor that functions as a repressor of ABA response in Arabidopsis. Plant Physiol. 139, 1185–1193. doi: 10.1104/pp.105.066324
Pedersen, D. S., Coppens, F., Ma, L., Antosch, M., Marktl, B., Merkle, T., et al. (2011). The plant-specific family of DNA-binding proteins containing three HMG-box domains interacts with mitotic and meiotic chromosomes. New Phytol. 192, 577–589. doi: 10.1111/j.1469-8137.2011.03828.x
Perroud, P. F., Haas, F. B., Hiss, M., Ullrich, K. K., Alboresi, A., Amirebrahimi, M., et al. (2018). The Physcomitrella patens gene atlas project: large-scale RNA-seq based expression data. Plant J. 95, 168–192. doi: 10.1111/tpj.13940
Proust, H. H., Honkanen, S., Jones, V. A. S. S., Morieri, G., Prescott, H., Kelly, S., et al. (2016). RSL class i genes controlled the development of epidermal structures in the common ancestor of land plants. Curr. Biol. 26, 93–99. doi: 10.1016/j.cub.2015.11.042
Romani, F. (2017). Origin of TAA genes in charophytes: new insights into the controversy over the origin of auxin biosynthesis. Front. Plant Sci. 8:1616. doi: 10.3389/fpls.2017.01616
Rövekamp, M., Bowman, J. L., and Grossniklaus, U. (2016). Marchantia MpRKD regulates the gametophyte-sporophyte transition by keeping egg cells quiescent in the absence of fertilization. Curr. Biol. 26, 1782–1789. doi: 10.1016/j.cub.2016.05.028
Ruprecht, C., Mutwil, M., Saxe, F., Eder, M., Nikoloski, Z., and Persson, S. (2011). Large-scale co-expression approach to dissect secondary cell wall formation across plant species. Front. Plant Sci. 2:23. doi: 10.3389/fpls.2011.00023
Ruprecht, C., and Persson, S. (2012). Co-expression of cell-wall related genes: new tools and insights. Front. Plant Sci. 3:83. doi: 10.3389/fpls.2012.00083
Ruprecht, C., Proost, S., Hernandez-Coronado, M., Ortiz-Ramirez, C., Lang, D., Rensing, S. A., et al. (2017a). Phylogenomic analysis of gene co-expression networks reveals the evolution of functional modules. Plant J. 90, 447–465. doi: 10.1111/tpj.13502
Ruprecht, C., Vaid, N., Proost, S., Persson, S., and Mutwil, M. (2017b). Beyond genomics: studying evolution with gene coexpression networks. Trends Plant Sci. 22, 298–307. doi: 10.1016/j.tplants.2016.12.011
Schlereth, A., Moller, B., Liu, W., Kientz, M., Flipse, J., Rademacher, E. H., et al. (2010). MONOPTEROS controls embryonic root initiation by regulating a mobile transcription factor. Nature 464, 913–916. doi: 10.1038/nature08836
Shimamura, M. (2016). Marchantia polymorpha: taxonomy, phylogeny and morphology of a model system. Plant Cell Physiol. 57, 230–256. doi: 10.1093/pcp/pcv192
Singh, V. K., Rajkumar, M. S., Garg, R., and Jain, M. (2017). Genome-wide identification and co-expression network analysis provide insights into the roles of auxin response factor gene family in chickpea. Sci. Rep. 7:10895. doi: 10.1038/s41598-017-11327-5
Solly, J. E., Cunniffe, N. J., and Harrison, C. J. (2017). Regional growth rate differences specified by apical notch activities regulate liverwort thallus shape. Curr. Biol. 27, 16–26. doi: 10.1016/j.cub.2016.10.056
Sozzani, R., Maggio, C., Giordo, R., Umana, E., Ascencio-Ibañez, J. T., Hanley-Bowdoin, L., et al. (2010). The E2FD/DEL2 factor is a component of a regulatory network controlling cell proliferation and development in Arabidopsis. Plant Mol. Biol. 72, 381–395. doi: 10.1007/s11103-009-9577-8
Stuart, J. M., Segal, E., Koller, D., and Kim, S. K. (2003). A gene-coexpression network for global discovery of conserved genetic modules. Science 302, 249–255. doi: 10.1126/science.1087447
Sugano, S. S., Shirakawa, M., Takagi, J., Matsuda, Y., Shimada, T., Hara-Nishimura, I., et al. (2014). CRISPR/Cas9-mediated targeted mutagenesis in the liverwort Marchantia polymorpha L. Plant Cell Physiol. 55, 475–481. doi: 10.1093/pcp/pcu014
Suzuki, M., Kao, C. Y., Cocciolone, S., and McCarty, D. R. (2001). Maize VP1 complements Arabidopsis abi3 and confers a novel ABA/auxin interaction in roots. Plant J. 28, 409–418. doi: 10.1046/j.1365-313X.2001.01165.x
Tsuzuki, M., Nishihama, R., Ishizaki, K., Kurihara, Y., Matsui, M., Bowman, J. L., et al. (2015). Profiling and characterization of small RNAs in the liverwort, Marchantia polymorpha, belonging to the first diverged land plants. Plant Cell Physiol. 57, 359–372. doi: 10.1093/pcp/pcv182
Turco, G. M., Kajala, K., Kunde-Ramamoorthy, G., Ngan, C., Olson, A., Deshphande, S., et al. (2017). DNA methylation and gene expression regulation associated with vascularization in Sorghum bicolor. New Phytol. 214, 1213–1229. doi: 10.1111/nph.14448
Wheeler, T. J., and Eddy, S. R. (2013). nhmmer: DNA homology search with profile HMMs. Bioinformatics 29, 2487–2489. doi: 10.1093/bioinformatics/btt403
Yamaoka, S., Nishihama, R., Yoshitake, Y., Ishida, S., Inoue, K., Saito, M., et al. (2018). Generative cell specification requires transcription factors evolutionarily conserved in land plants. Curr. Biol. 28, 479–486. doi: 10.1016/j.cub.2017.12.053
Yokoyama, A., Yamashino, T., Amano, Y. I., Tajima, Y., Imamura, A., Sakakibara, H., et al. (2007). Type-B ARR transcription factors, ARR10 and ARR12, are implicated in cytokinin-mediated regulation of protoxylem differentiation in roots of Arabidopsis thaliana. Plant Cell Physiol. 48, 84–96. doi: 10.1093/pcp/pcl040
Yoo, S. Y., Kim, Y., Kim, S. Y., Lee, J. S., and Ahn, J. H. (2007). Control of flowering time and cold response by a NAC-domain protein in Arabidopsis. PLoS One 2:e642. doi: 10.1371/journal.pone.0000642
Yoshii, M., Yamamoto, A., Kagaya, Y., Takeda, S., and Hattori, T. (2015). The Arabidopsis transcription factor NAI1 is required for enhancing the active histone mark but not for removing the repressive mark on PYK10, a seedling-specific gene upon embryonic-to-postgerminative developmental phase transition. Plant Signal. Behav. 10:e1105418. doi: 10.1080/15592324.2015.1105418
Keywords: auxin, co-expression, Marchantia, auxin response factors, reproductive transitions, class C ARFs, transcriptome, miR160
Citation: Flores-Sandoval E, Romani F and Bowman JL (2018) Co-expression and Transcriptome Analysis of Marchantia polymorpha Transcription Factors Supports Class C ARFs as Independent Actors of an Ancient Auxin Regulatory Module. Front. Plant Sci. 9:1345. doi: 10.3389/fpls.2018.01345
Received: 15 June 2018; Accepted: 27 August 2018;
Published: 01 October 2018.
Edited by:
Verónica S. Di Stilio, University of Washington, United StatesReviewed by:
Bharti Sharma, California State Polytechnic University, Pomona, United StatesRaffaele Dello Ioio, Università degli Studi di Roma La Sapienza, Italy
Copyright © 2018 Flores-Sandoval, Romani and Bowman. This is an open-access article distributed under the terms of the Creative Commons Attribution License (CC BY). The use, distribution or reproduction in other forums is permitted, provided the original author(s) and the copyright owner(s) are credited and that the original publication in this journal is cited, in accordance with accepted academic practice. No use, distribution or reproduction is permitted which does not comply with these terms.
*Correspondence: John L. Bowman, john.bowman@monash.edu