 Samuli Junttila1,2*
 Junko Sugano1
 Mikko Vastaranta1,2,3
 Riikka Linnakoski1,4Harri Kaartinen5,6Antero Kukko2,5Markus Holopainen1,2Hannu Hyyppä2,7Juha Hyyppä2,5
- 1Department of Forest Sciences, University of Helsinki, Helsinki, Finland
- 2Centre of Excellence in Laser Scanning Research, Finnish Geospatial Research Institute (FGI), Masala, Finland
- 3School of Forest Sciences, University of Eastern Finland, Joensuu, Finland
- 4Natural Resources Institute Finland (Luke), Helsinki, Finland
- 5Department of Remote Sensing and Photogrammetry, Finnish Geospatial Research Institute (FGI), Masala, Finland
- 6Department of Geography and Geology, University of Turku, Turku, Finland
- 7Department of Built Environment, Aalto University, Aalto, Finland
Changing climate is increasing the amount and intensity of forest stress agents, such as drought, pest insects, and pathogens. Leaf water content, measured here in terms of equivalent water thickness (EWT), is an early indicator of tree stress that provides timely information about the health status of forests. Multispectral terrestrial laser scanning (MS-TLS) measures target geometry and reflectance simultaneously, providing spatially explicit reflectance information at several wavelengths. EWT and leaf internal structure affect leaf reflectance in the shortwave infrared region that can be used to predict EWT with MS-TLS. A second wavelength that is sensitive to leaf internal structure but not affected by EWT can be used to normalize leaf internal effects on the shortwave infrared region and improve the prediction of EWT. Here we investigated the relationship between EWT and laser intensity features using multisensor MS-TLS at 690, 905, and 1,550 nm wavelengths with both drought-treated and Endoconidiophora polonica inoculated Norway spruce seedlings to better understand how MS-TLS measurements can explain variation in EWT. In our study, a normalized ratio of two wavelengths at 905 and 1,550 nm and length of seedling explained 91% of the variation (R2) in EWT as the respective prediction accuracy for EWT was 0.003 g/cm2 in greenhouse conditions. The relation between EWT and the normalized ratio of 905 and 1,550 nm wavelengths did not seem sensitive to a decreased point density of the MS-TLS data. Based on our results, different EWTs in Norway spruce seedlings show different spectral responses when measured using MS-TLS. These results can be further used when developing EWT monitoring for improving forest health assessments.
Introduction
Measuring tree health is an increasingly important topic as the world's climate is warming and the human population is growing, putting the environment and forests under increasing stress (Williams et al., 2013). Stress and different disturbance events caused by, for example, insects are natural processes in forest ecosystems that can help maintain healthy and heterogeneous forests (Raffa et al., 2009). However, forests are facing new stresses and disturbance events such as drought, invasive pests, and air pollution, which are more intense than those they have previously adapted to (Trumbore et al., 2015). Forests provide many ecosystem services, such as carbon storage, recreational activities, timber, and non-timber forest products, which are jeopardized by declining forest health, increased forest mortality, and increased susceptibility to forest fires (Hanewinkel et al., 2013; McDowell and Allen, 2015; Morris et al., 2016). Managing declining forests efficiently in the face of climate change requires more information on the condition of forests to be able to monitor and control forest damage and fires (Allen et al., 2010); thus, new methods for mapping and monitoring forest health are needed.
Existing forest health mapping methods can be divided according to spatial, spectral, and temporal resolutions (Senf et al., 2017). Large-scale mapping of insect infestation has been conducted using single and multi-date Landsat data at 30 m resolution (Goodwin et al., 2008; Meddens et al., 2013). These methods are capable of capturing forest health information on a large scale and are suitable for countries where extensive forest management is applied, but spatially, more detailed approaches are necessary for capturing small-scale dynamics of forest decline in smaller countries with a more intensive approach to forest management. Spatially more accurate hyperspectral remote sensing data with 5 m resolution have been used to investigate the mapping of bark beetle induced tree mortality resulting in high overall accuracy (84–96%) in classifying dead trees (Fassnacht et al., 2014). Multispectral satellite imagery with 4 m resolution has been used to detect the red stage in mountain pine beetle infestation, resulting in high overall accuracy of 71–92% (White et al., 2005). However, none of the methods studied so far have been able to accurately detect early stages of bark beetle infestation and early tree stress when the trees have exhibited few visual symptoms (Fassnacht et al., 2014).
Leaf water content, typically measured as the weight of water per leaf area or equivalent water thickness (EWT), is an indicator of tree health that is affected by several tree stressors (Carter, 1993; Chaerle and Van Der Straeten, 2000). Drought, pest insects, and pathogens affect EWT, often before other symptoms appear, such as discoloration or defoliation; thus, detecting changes in EWT provides an early-warning signal of tree stress (Skakun et al., 2003; Zarco-Tejada et al., 2003). Leaf and canopy water content derived from Landsat data have been used as a proxy to detect large-scale insect infestation (Skakun et al., 2003; Wulder et al., 2006). Early detection of tree stress is crucial in providing timely information about the condition of forests, mitigating damage, and preventing the spread of the stressor (Wermelinger, 2004). For example, the European spruce bark beetle (Ips typographus L.) is a forest insect pest whose main host is Norway spruce trees. The bark beetle and a fungal pathogen have a mutual relationship causing disruptions in the flow of water and nutrients in the phloem and sapwood of the trees, resulting in decreased water content in the canopy and the sapwood (Horntvedt et al., 1983). Recently infested trees do not exhibit visual symptoms (green attack), but a reddish-brown coloring of tree crowns appears when the beetles have already left the host tree (Lausch et al., 2013). Thus, early detection of tree stress would greatly assist in mitigating and managing the damage caused by I. typographus. Efforts have been made to solve this issue but none have succeeded with reasonable accuracy thus far (Lausch et al., 2013; Fassnacht et al., 2014).
Improving reference data for assessing forest health has been identified as a key research area in need of development (Senf et al., 2017). Because field reference data or the ground truth is the gold standard of modeling, any errors in the data can lead to significant bias and errors in modeling. The high costs of collecting field data usually lead to a compromise between the number of plots and the spatial extent of the investigation. National forest inventories may collect forest health data, but forest inventory data are not available in all countries (Gschwantner et al., 2016). Visual assessment of forest health in field data collection is prone to error and bias due to the subjective nature of the estimation, and it requires substantial expertise. The early stages of tree stress can be visually difficult to determine because trees may not exhibit visual symptoms at this stage. Thus, objective and reliable methods for collecting forest health related reference data in the field are needed.
Equivalent water thickness is closely related to another metric for calculating vegetation water content—fuel moisture content (FMC)—that is more frequently used in forest fire danger literature (Chuvieco et al., 2004). Fuel moisture content is expressed as the ratio between the weight of water and sample dry weight and is an important parameter in fire ignition (Dimitrakopoulos and Papaioannou, 2001). A multitemporal analysis of NOAA-AVHRR images has been used to derive FMC for Mediterranean grasslands and shrub species with R2-values over 0.8 (Chuvieco et al., 2004). Generally, studies aiming to estimate FMC use spatially coarse resolution satellite data that can provide frequent imagery, important in forest fire danger estimation (Sow et al., 2013).
Multispectral terrestrial laser scanning (MS-TLS) measures the range and reflectance of the target at several wavelengths simultaneously, providing three-dimensional estimates of reflectance. Several MS-TLS instruments have been developed recently mainly for laboratory use (Douglas et al., 2012; Hakala et al., 2012; Wallace et al., 2012; Wei et al., 2012; Niu et al., 2015; Li et al., 2016). These instruments utilize a supercontinuum laser source that is powerful enough to not be eye-safe, limiting their operation in the field, with the exception of a terrestrial laser scanner operating at two wavelengths, which is also portable (Douglas et al., 2012). Recently, a commercial multispectral laser scanner—the Optech Titan (Teledyne Optech, Canada)—with three channels has become available for airborne measurements (Matikainen et al., 2016). The development of multispectral laser scanning instruments widens the possibilities of using laser scanning data as more information about the target's reflectance becomes available in a three-dimensional format.
Alterations in EWT affect leaf reflectance in the shortwave infrared region (Ceccato et al., 2001), which can be measured using MS-TLS. A number of studies have investigated the use of MS-TLS and terrestrial laser scanning (TLS) in the estimation of EWT. Gaulton et al. (2013) studied the potential of estimating leaf EWT with a dual-wavelength terrestrial laser scanner at 1,063 and 1,545 nm wavelengths, resulting in a significant correlation (R2 = 0.8, root mean square error [RMSE] = 0.0069 g/cm2) between leaf EWT and a normalized ratio of the two wavelengths, but with a low number of samples and species. The estimation of leaf EWT has been recently studied using MS-TLS at 690 and 1,550 nm wavelengths with single leaves, resulting in a strong correlation (R2 = 0.93, RMSE = 0.004 g/cm2) between EWT and a normalized ratio of the two wavelengths, but the selection of wavelengths was concluded to be suboptimal (Junttila et al., 2016). Zhu et al. (2015) showed that TLS intensity data at 1,550 nm were able to explain 76% of the variation in EWT at leaf level after radiometric correction of the TLS intensity data. Canopy EWT has been estimated with full-waveform single wavelength TLS at 1,550 nm wavelength, resulting in a significant correlation between canopy EWT and backscatter coefficient (R2 = 0.66, RMSE = 0.001 g/cm2) (Zhu et al., 2017). However, single wavelength data seem to be sensitive to confounding factors, such as incidence angle, requiring complicated correction of the intensity data, and they are also affected by structural variables of the leaf other than EWT (Zhu et al., 2015, 2017). The requirement of an incidence angle correction limits the utilization of the single wavelength method to deciduous species with distinguishable leaves. Coniferous forests comprise a large part of the world's forest biomes, but thus far only Junttila et al. (2016) have looked into the estimation of EWT with coniferous species using MS-TLS. The use of spectral ratios calculated from dual-wavelength intensity data has been shown to be insensitive to incidence angle effects thus enabling higher accuracy in the estimation of EWT (Hancock et al., 2017). A second wavelength in the near infrared region coupled with a wavelength in the shortwave infrared region is also capable of normalizing leaf structural effects on the estimation of EWT (Ceccato et al., 2001).
The aim of this study was to investigate the capability of multisensor MS-TLS in monitoring leaf EWT, with Norway spruce (Picea abies L.) seedlings. First, the dependencies between EWT and laser intensity features at different wavelengths (and calculated spectral ratios) of segmented point clouds are examined to find explanatory variables for predicting EWT. Secondly, we compare the combination of 690, 905, and 1,550 nm wavelengths in predicting EWT using different sensors. Thirdly, the importance of point density in estimating EWT is evaluated using random sampling of the point clouds to decrease the point density. This research contributes to the first steps in developing a method for the accurate estimation of leaf EWT in forests using MS-TLS.
Materials and Methods
Experiment Design
Two-year-old commercial Norway spruce seedlings (n = 145) were grown for 12 weeks in a greenhouse between May and August 2016. The seedlings were subjected to different treatments to induce drought and variation in EWT. The seedlings were divided into five groups for different treatments. Three of the groups received 75% (28 ml), 50% (20 ml), and 25% (12 ml) of “normal” watering (watered as required to maintain moist soil) three times a week (groups D75, D50, and D25, respectively) (Table 1). The fourth group was grown with a sufficient amount of water (36 ml) for 10 weeks until irrigation was completely stopped, and the seedlings then went without water for 3 weeks (group D_total). The fifth group of seedlings was inoculated with Endoconidiophora polonica (isolate CBS 142283), a fungal pathogen associated with the European spruce bark beetle (I. typographus) that disturbs the flow of water and nutrients in the phloem and sapwood (group F). The amount of water given to the seedlings in the drought treatment groups (D75, D50, and D25) was adjusted during the experiment because the seedlings showed resistance to drought (Table 2). After 34 days from the start of the experiment, irrigation was reduced to twice a week; after 46 days, the amount of water given was cut to half; and finally after 56 days from the start of the experiment the irrigation was reduced to once a week. During the 12 weeks, 5–16 seedlings were randomly collected for TLS measurements at eight time intervals. Two or three seedlings were collected from each of the drought treatment groups (D75, D50, and D25) and eight seedlings from the fungal treatment group (F) for each MS-TLS measurement. Seedlings that showed severe symptoms during the final stages of the experiment, and which were unlikely to survive until the next measurement time were prioritized to avoid the loss of research material, resulting in uneven sample numbers toward the end of the experiment. Details of the measurements can be found in Table 3. The mean length of the seedlings was 30.3 cm (std ± 5.34 cm) during the experiment.
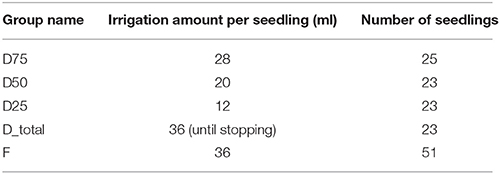
Table 1. Treatment groups and related statistics.
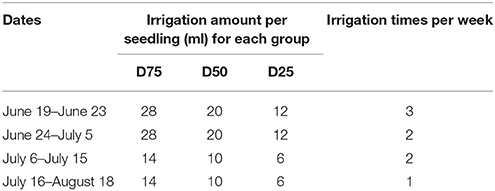
Table 2. Irrigation of the drought experiment groups.
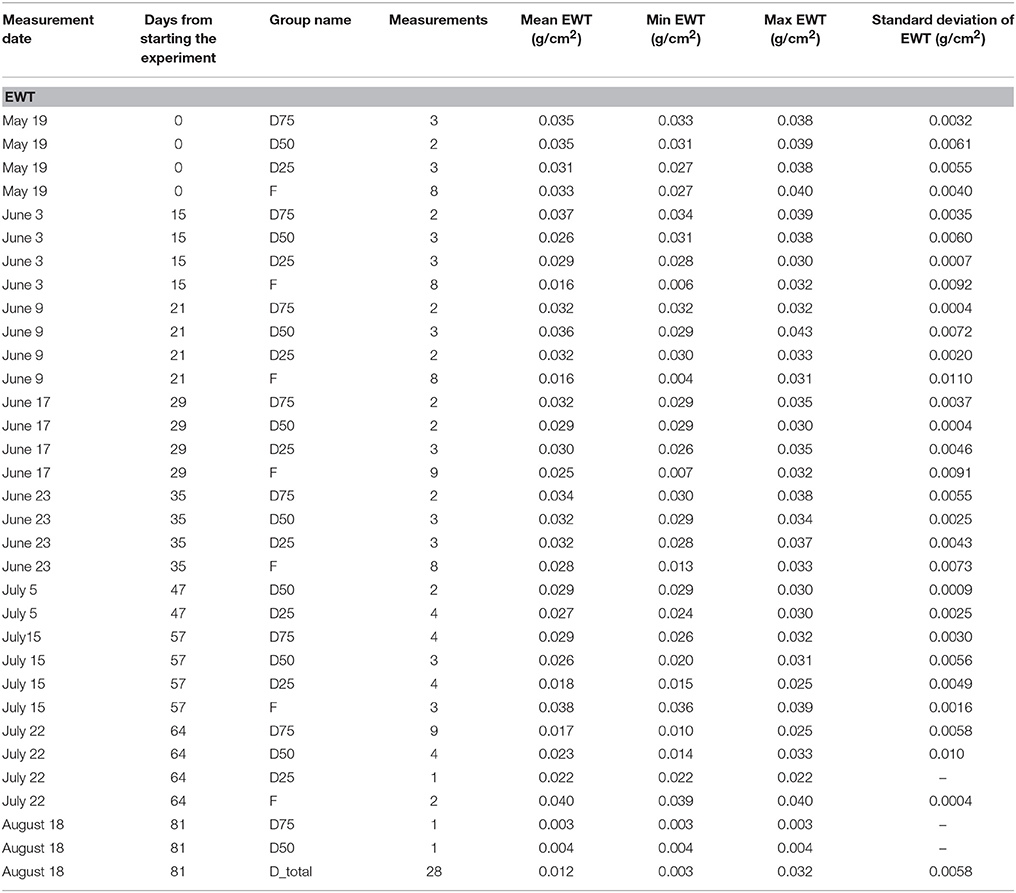
Table 3. EWT for each measurement and treatment group, and their respective statistics.
Terrestrial Laser Scanners
The seedlings were scanned consecutively with three different terrestrial laser scanners from the same position from a distance of 5.2 m inside the greenhouse. The terrestrial laser scanners used were a Leica HDS6100 (Leica Geosystems AG, Heerbrugg, Switzerland), a FARO S120 (FARO Europe GmbH & Co. KG, Korntal-Münchingen, Germany), and a FARO X330, utilizing wavelengths of 690, 905, and 1,550 nm, respectively. The technical specifications of the terrestrial laser scanners can be found in Table 4. The varying beam diameter at exit and beam divergence resulted in different spot sizes at target distance, which were 4.14, 3.99, and 3.24 mm for the Leica, the S120, and the X330, respectively. The scanning was done using the highest resolution available for each instrument, resulting in a point spacing of ~1 mm; thus, there was significant overlap between consecutive laser measurements.
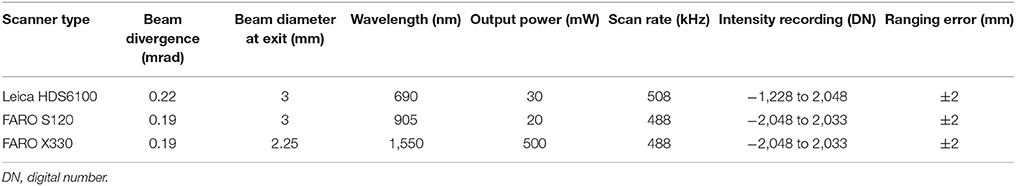
Table 4. Technical specifications for the terrestrial laser scanners.
Three white spheres were used as common targets to register the scans to the same coordinate system as each other, facilitating the segmentation of point clouds in the processing of the data. A four-grade Spectralon (Labsphere, North Sutton, NH, USA) panel was used as a reference target for intensity normalization. The size of the panel was 460 mm x 460 mm consisting of four different reflectance panels (nominal reflectances of 99, 50, 25, and 12%), each sized 115 × 460 mm. Approximately 65,000 points were received from each of the panels.
Ecophysiological Measurements
After scanning, the seedlings were transported to the laboratory for EWT measurements (Table 3). A sample of 30–40 needles was randomly collected from each seedling, constituting a single measurement of EWT. As the seedlings were growing during the experiment, only previous year needles were sampled to avoid the influence of needle development on the EWT measurements. The needles were weighed (with a precision of 0.0001 g) to measure fresh weight, scanned with an Epson V370 Photo Scanner (Epson America, Inc., CA, USA) at 800 dpi resolution to measure leaf area, and dried in an oven at 60°C for 48 h to measure dry weight. The images were analyzed with the open source software EasyLeafArea (Easlon and Bloom, 2014) to segment the needles and calculate leaf area based on the number of segmented pixels. The EWT was then calculated according to Danson et al. (1992):
where FW is the fresh weight of the needles (g), DW is the weight of the dried needles (g), and A is the surface area of the fresh needles (cm2).
Terrestrial Laser Scanning Data Processing
The TLS scans were registered to a common coordinate system using the Z + F LaserControl software package (Zoller + Fröhlich GmbH, Wangen im Allgäu, Germany), resulting in a mean accuracy of 2.7 mm between targets. The registration process was based on Helmert transformation and three sphere-shaped targets with known locations (Watson, 2006). The registration of the scans was visually inspected after the registration process to ensure the alignment of the point clouds at the range of the seedlings. Because the terrestrial laser scanners utilize a phase shift measurement technique to determine the range to the target, a large number of ghost points were produced in the scans (Balduzzi et al., 2011). To reduce the number of ghost points, the point clouds were filtered with a statistical outlier algorithm based on the distance between points by using the CloudCompare v.2.8.1 (Girardeau-Montaut, 2011) software. The algorithm calculates the maximum distance for a point to be included using the following equation:
where MaxD is the maximum distance for a point to be included, MeanD is the mean distance of the neighboring points, nSigma is a standard deviation multiplier threshold, and std is the standard deviation of the distance of the neighboring points. Thus, the algorithm requires two parameters: the number of neighbors and nSigma. The parameters were determined though iteration and visual estimation of the result. Fifty neighbors were used for every scan and the nSigma was set to 1.0 and 0.65 for the Leica and FARO scanners respectively.
Then, cloud-to-cloud distances were calculated for the point clouds in the CloudCompare software package where the FARO X330 was used as a reference cloud for calculating the distances because of its expected sensitivity to EWT (Junttila et al., 2016). The tool calculates the distance of each point to the nearest point in the reference cloud. A maximum distance of 2 mm (which is also the ranging accuracy of the terrestrial laser scanners) was used to filter the point clouds and match the geometry of the point clouds produced by different terrestrial laser scanners with each other.
Points from each seedling were then manually clipped from the georeferenced point clouds for further processing. The point clouds from each seedling were further manually segmented into stem and leaf points to evaluate their effect on the estimation of EWT.
Because the point clouds were produced using a very high-resolution scanning setting, the point clouds were randomly sampled to reduce the amount of points in each point cloud and investigate how the point density affects the estimation of EWT. The point clouds were randomly sampled to four different point cloud sizes: 2,000, 1,000, 500, and 250 points per seedling. The mean number of points for each seedling was 14,702 in the unsegmented point clouds; thus, the amount of points was greatly reduced.
Intensity Calibration
Terrestrial laser scanners are primarily designed for range measuring; thus, they are not optimized for reflectivity measurements. Some terrestrial laser scanners have been shown to have a nonlinear intensity scale (Kaasalainen et al., 2011); thus, the calibration of intensity data may be required. The stationary four-grade Spectralon panel was used as a reference target for the calibration procedure using the mean of ~65,000 points from each of the reflectance panels. The standard deviation of raw intensity values of these samples varied between 4.7 and 8.9. The panel's reflectance was also measured with a FieldSpec Pro FR (Analytical Spectral Devices, Inc., Longmont, CO, USA) field spectrophotometer. The relationship between the spectrophotometer measured reflectance and the laser scanner measured intensity was then investigated to detect any nonlinearities in the intensity response.
The relationship between measured intensity and reflectance was shown to be linear for the Leica scanner and logarithmic for the FARO scanners (Figure 1). The measured intensity from the FARO X330 scanner was shown to be saturated in the 99% panel because the maximum intensity of the digital number was reached; thus, the calibration of FARO X330 data was done using only the 50, 25, and 12% panels. To correct for the logarithmic effect of the FARO scanners, Equation 3 was used (Kaasalainen et al., 2009):
where A0 and A1 are empirical parameters determined by fitting the raw intensity measured by the FARO scanners to the spectrophotometer measured reflectance. Additionally, a linear regression model was developed to model the relationship between the raw intensity and reflectance for the Leica scanner to convert the raw intensity values to calibrated intensity. The fitted parameter values of A1 and A0 were 1833.8 and 446.9 for FARO S120, and 2018.7 and 379.9 for FARO X330. The linear regression model of the Leica scanner had a coefficient of 0.00119 and an intercept of −0.57186.
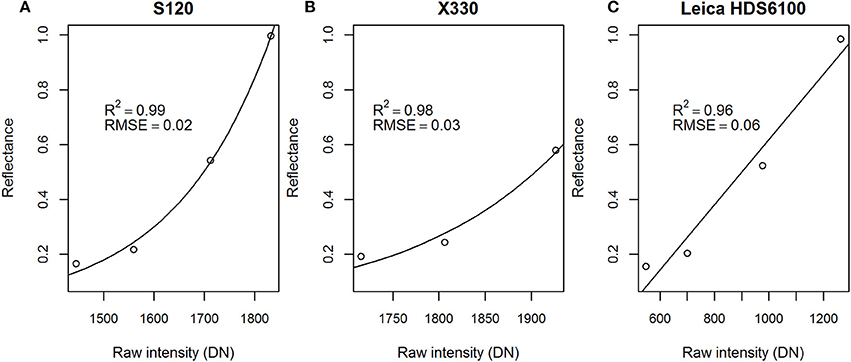
Figure 1. Regression models for reflectance and measured raw intensity for the (A) FARO S120, (B) FARO X330, (C) and Leica scanners, and their coefficients of determination (R2) and root mean square error (RMSE) values. DN, digital number.
The effect of ambient temperature, temperature of the scanner, and background illumination on measured intensity was then reduced by normalizing each scan with the mean intensity of ~20,000 returns from the 99% Spectralon panel in the case of the Leica and FARO S120, and from the 50% Spectralon panel for the FARO X330 due to the saturation of intensity values in the 99% panel. The intensity of the X330 points from the seedlings had values below the mean of the 50% Spectralon panel; thus, the intensity was within the calibrated range.
The result of this process is referred to as the calibrated intensity within this paper. Because the samples were scanned within a narrow range bin of less than 1 m, no range corrections were conducted. A range correction is required when the targets are located at different distances from the scanner, i.e., scanning trees in a forest environment (Kaasalainen et al., 2011).
Laser Intensity Features
A set of statistical features was calculated from the intensity data from each point cloud representing a seedling at each wavelength. Intensity features were calculated from the calibrated intensity data of each point cloud. These features were the mean, minimum, maximum, standard deviation and percentiles 10, 20, 30, 40, 60, 70, 80, and 90 (p-value, e.g., p20, p60) of the intensity value distribution. Within this paper these statistics are referred to with a wavelength and a subscript describing the feature (e.g., 1,550mean, 690p30). The included features are shown in Table 5.
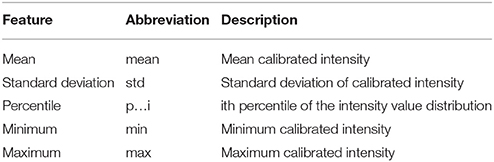
Table 5. Intensity features.
Based on these features, a set of spectral indices was calculated for each point cloud (Table 6). We aimed to observe combinations of the 690 and 1,550 nm and 905 and 1,550 nm wavelengths based on ratio and normalization operations by calculating a simple ratio (SR) index (Jordan, 1969) and a normalized difference index (NDI) (Hancock et al., 2017) as follows:
where ρ1i and ρ2i are the i feature of wavelength ρ1 and ρ2.
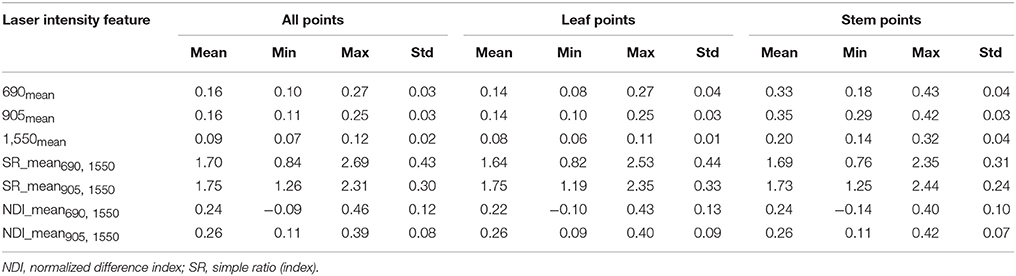
Table 6. Calibrated intensity values for the mean of each wavelength and each spectral index for all points, leaf points, and stem points.
The indices are referred to with the abbreviation, feature name, and a subscript describing the wavelengths used for the calculation (e.g., NDI_p80690, 1,550). The total number of calculated laser intensity features was 48.
Statistical Analysis
The Student's t-test was used to determine whether there were statistically significant differences in the length of the seedlings in the different treatment groups. The relationship between EWT and each laser intensity feature was investigated using simple linear regression. The regression models were developed for all points, leaf points and stem points separately. Regression models were also developed for the randomly sampled point clouds to investigate how point density affects the estimation of EWT. Multiple regression was used to investigate whether the estimation of EWT could be improved by including length of the seedling as a structural variable in the regression model with the best explanatory laser intensity feature. We used the coefficient of determination (R2) and RMSE with cross-validation to assess the goodness of fit between the dependent and the predictor using the following equations:
where n is the number of observations, yi is the observed value for the measurement i, ŷi is the predicted value for the measurement i, and ȳ is the mean of the observed data. All of the statistical analyses were performed using the open source software package R ver. 3.2.3 (R Core Team, 2013). Due to the large number of explanatory laser intensity features, only the 10 best explaining variables with the highest R2 were reported.
Results
Effects of Drought on Growth and Equivalent Water Thickness
The drought treatments resulted in varying lengths of the seedlings in the treatment groups (Figure 2). The D75 group had a mean length of 29.5 cm, while the D50 and D25 groups had significantly lower mean lengths of 26.0 and 23.7 cm, respectively. The drought treatments significantly affected the growth of the seedlings.
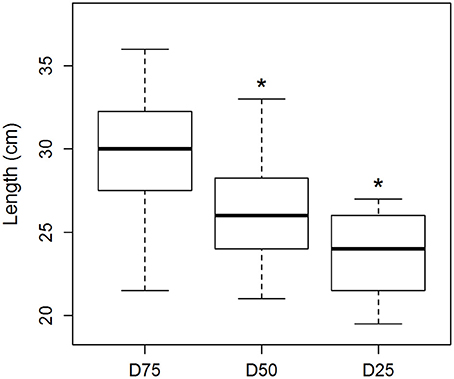
Figure 2. Length of the seedlings in the drought treatment groups (number of samples: D75: 21, D50: 17, D25: 13). Asterisk (*) on top of the bar denotes statistically significant difference between the groups. Black line denotes the median value, upper and lower edge of the box show 75 and 25% percentiles, respectively. The whiskers of the boxes extend to the extreme values of the data sets.
The seedlings showed resistance to drought. Despite the different amounts of water that the seedlings in the drought treatment groups received, EWT was shown to stay at relatively similar levels between treatment groups until the irrigation amount was further reduced after 35 days from starting the experiment (Figure 3). The seedlings still showed few visual symptoms due to drought, and after further reductions of irrigation the EWT decreased significantly. The lowest EWT levels in the experiment were found at the end of the experiment in the D_total group.
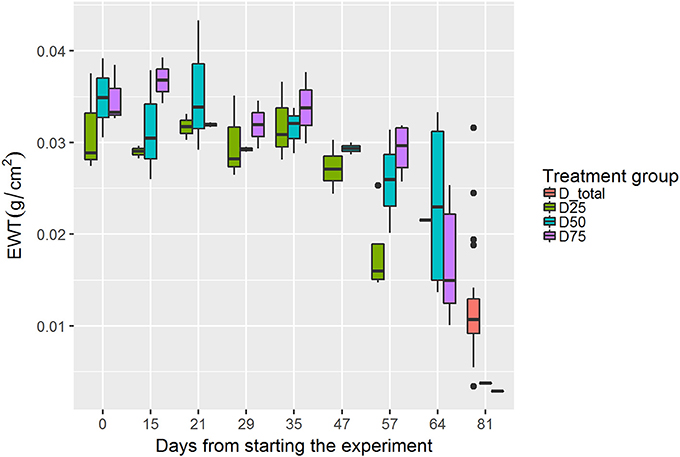
Figure 3. Changes in EWT in each drought treatment group during the experiment (each bar represents approximately 4 samples). Black line denotes the median value, upper and lower edges of the boxes show 75 and 25% percentiles, respectively. The whiskers of the boxes extend to extreme values no longer than 1.5 times the interquartile range. Values further than that are plotted as outliers.
Effects of E. polonica Treatment on Equivalent Water Thickness
The fungal pathogen treatment of the seedlings resulted in decreased EWT (Figure 4). The affected seedlings showed a rapid decrease in EWT because the effects were apparent only 14 days after the inoculation. The infected seedlings were shown to respond to the treatment during the first 35 days of the experiment. After that period, no signs of infection in the remaining seedlings were observed.
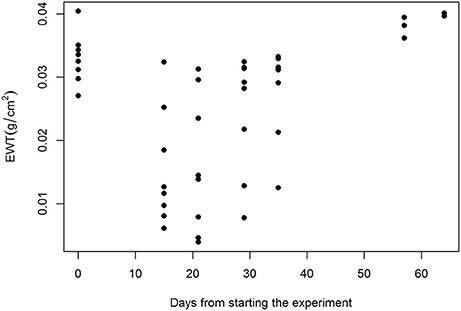
Figure 4. EWT alterations during the experiment in the fungal pathogen treatment group.
Does Equivalent Water Thickness Affect the Spectral Response of Multispectral Terrestrial Laser Scanning?
The calibrated intensity at 1550 nm wavelength from the FARO X330 showed significantly increasing values with decreasing EWT (Figure 5). The linear regression model of EWT and the best explanatory variable at 1,550 nm wavelength, 1,550p80, had a coefficient of determination of 0.7. For comparison, 1,550mean was able to explain only 47% of the variation in EWT. Spectral indices calculated from both combinations −905 and 1,550 nm and 690 and 1,550 nm – were able to predict EWT with improved accuracy. The combination of 905 and 1,550 nm showed the best prediction accuracy of EWT with R2 of 0.89 and 0.87 for NDI_p70905, 1,550 and NDI_p60905, 1,550, respectively (Table 7). Similar prediction accuracy, with an R2 of 0.87, was also observed for SR_p70905, 1,550 and NDI_p80905, 1,550. The best explanatory features for the combination of 690 and 1,550 nm showed prediction accuracies of R2 of 0.82 and 0.80 for NDI_p70690, 1,550 and SR_p70690, 1,550, respectively.
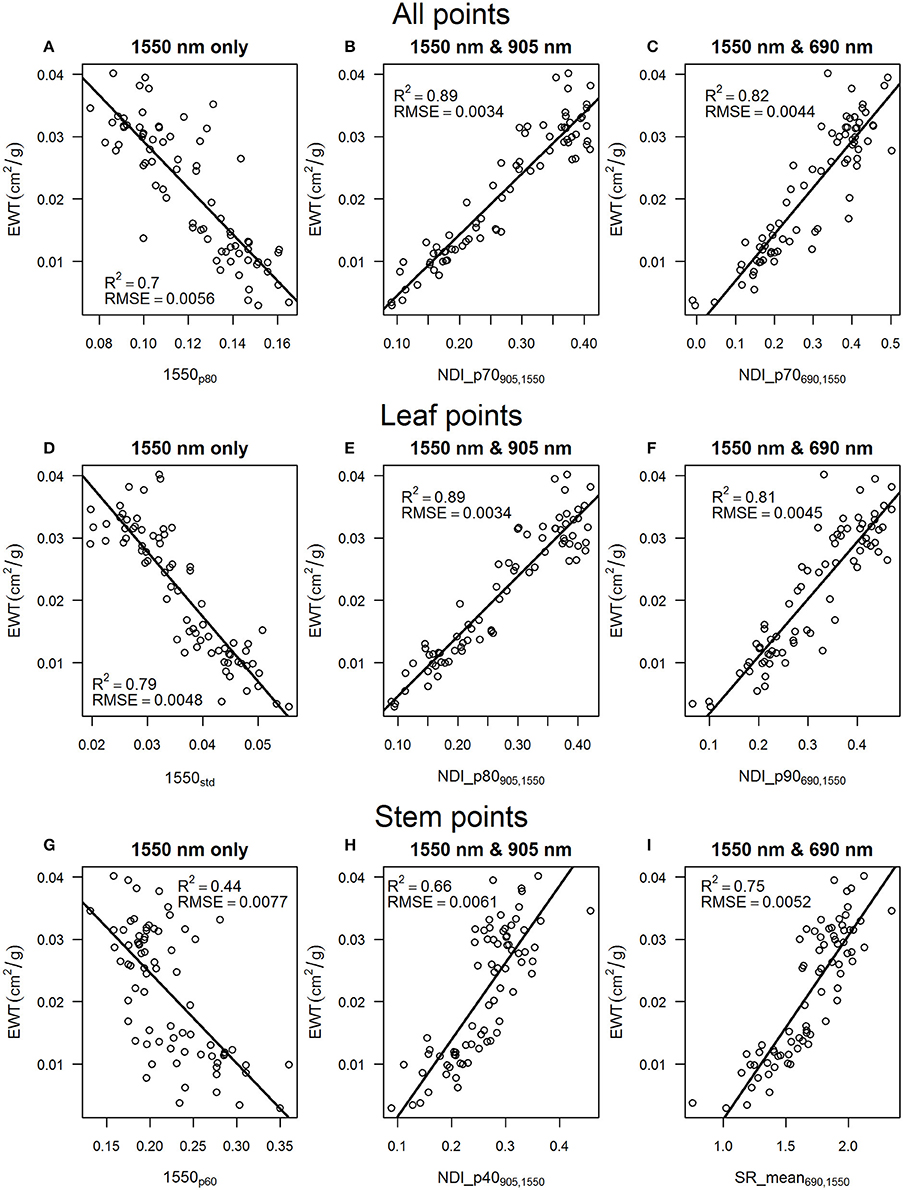
Figure 5. Relationships between EWT and the best explanatory laser intensity features with their respective R2 and RMSE values for all points for (A) 1,550 nm wavelength, (B) 1,550 and 905 wavelengths, (C) 1,550 and 690 nm wavelengths. The same for leaf points for (D) 1,550 nm wavelength, (E) 1,550 and 905 nm wavelengths, (F) 1,550 and 690 nm wavelengths, and the same for stem points for (G) 1,550 nm wavelength, (H) 1,550 and 905 nm wavelengths, (I) 1,550 and 690 nm wavelengths.
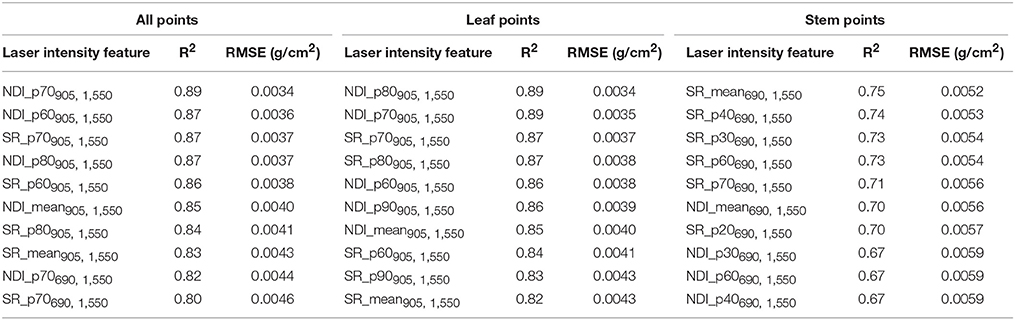
Table 7. R2 and RMSE values for the linear regression models of equivalent water thickness and laser intensity features for all points, leaf points, and stem points.
The best explanatory laser intensity features varied slightly for leaf points. The 1,550std feature could explain 79%, and 1,550p90 73%, of the variation in EWT as the best predicting features for single wavelength data. The spectral indices showed similar explanatory power compared with using all points, but the best features for estimating EWT were higher intensity percentiles than for all points. The NDI_p80905, 1,550 and the NDI_p70905, 1550 features explained 89% of the variation in EWT, while SR_p70905, 1,550 and SR_p80905, 1,550 explained 87% of the variation in EWT. The NDI_p90690, 1,550 and the SR_p90690, 1,550 features were the best predictors for the combination of 690 and 1,550 nm wavelengths, with R2 of 0.81 and 0.79, respectively.
The stem points were also shown to have statistically significant power in explaining the differences in EWT but with lower percentiles of the intensity value distribution and lower coefficients of determination of 0.49, 0.66, and 0.75 for 1550 nm only, 1,550 and 905 nm, and 1,550 and 690 nm, respectively. Single wavelength data explained 49% of the variation in EWT with the 1,550mean feature. The combination of 690 and 1,550 nm wavelengths showed the highest prediction accuracy, with the SR_mean690, 1,550 and SR_p40690, 1,550 features resulting in an R2 of 0.75 and 0.74, respectively. The NDI_p40905, 1,550 and the NDI_p10905, 1,550 features were able to predict EWT with R2 of 0.66 and 0.65, respectively.
The regression models explained 89% of the variation in EWT when 2,000 points from each seedling were randomly sampled. Thus, there was only a 0.0001 g/cm2 increase in RMSE for both spectral indices compared using all points (Table 8). A slight decrease of 0.02 in R2 and an increase of 0.0002 g/cm2 was present for NDI_p70905, 1,550 after random sampling of 1,000 points, whereas NDI_p70690, 1,550 showed no changes compared with 2,000 points. Reducing the number of points to 500 resulted in no changes in the estimation accuracy of EWT for NDI_p70905, 1,550 but R2 decreased to 0.79 and RMSE increased to 0.0048 g/cm2 for NDI_p70690, 1,550. When the number of points was reduced to 250, R2 decreased to 0.79 and 0.78 and RMSE increased to 0.0047 g/cm2 and 0.0049 g/cm2 for NDI_p70905, 1,550 and NDI_p70690, 1,550, respectively.
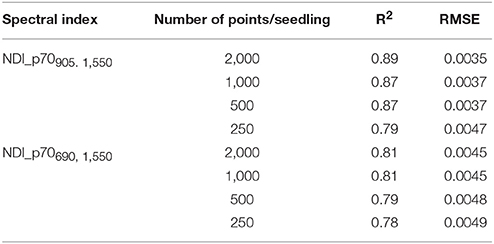
Table 8. R2 and RMSE values for the linear regression models of the spectral indices and equivalent water thickness after random sampling of the point clouds.
Multiple regression was able to improve the prediction of EWT. According to the multiple regression analysis, the length was statistically significant at p < 0.001. The estimation accuracy of EWT was improved compared with using simple regression models, with R2 = 0.91 and RMSE = 0.003 g/cm2 (Figure 6).
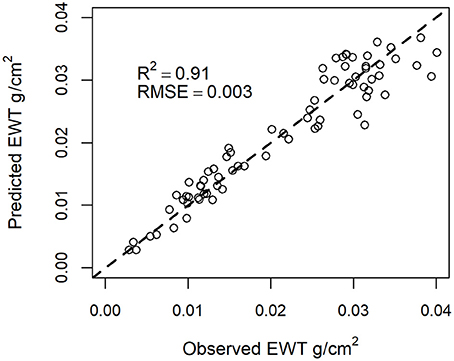
Figure 6. EWT estimation using NDI_p70905, 1,550 and length of the seedling as predictors.
Discussion
The seedlings showed surprisingly high resistance to drought despite the low amounts of irrigation for each seedling. The drought led to a significant reduction in growth, which correlated with the intensity of the drought treatment. The seedlings seemed to cope with drought by reducing growth, which led to reduced demand for water because there was less foliage to support and less transpiring leaf area. However, significant reduction in EWT was observed after further reduction in irrigation.
The results showed that the investigated laser intensity features were able to explain most of the variation in leaf EWT and provide a relatively good prediction accuracy. Single wavelength intensity features at 1,550 nm were able to explain 70–79% of the differences in EWT using all points and leaf points only. Similar results have been obtained before for broadleaf species after applying an incidence angle correction to the intensity data at 1,550 nm (Zhu et al., 2015; Junttila et al., 2016). The correlations obtained in this study are relatively high for single wavelength data considering that no radiometric corrections have been applied to the data. Due to the shape and size of the spruce needles, an incidence angle correction would be impossible to apply because the laser footprint illuminates several needles at a time.
The spectral indices calculated from the 690, 905, and 1,550 nm wavelengths showed higher correlations with leaf EWT than the single wavelength data, which is in accordance with previous research (Junttila et al., 2016). The regression model of EWT and NDI_p70690, 1,550 showed a coefficient of determination of 0.82 for all points, while NDI_p70905, 1,550 was able to explain 89% of the changes in EWT. The better correlation of the combination of 1,550 and 905 nm with EWT can be explained by the sensitivity of the 905 nm wavelength to internal structure and dry matter content, a property needed in the estimation of EWT according to the literature (Ceccato et al., 2001). Additionally, the scanners providing measurements at 1,550 and 905 nm wavelengths were both developed by FARO and seem to employ similar algorithms for producing the discrete point clouds. It can be seen from the relationships between raw intensity and reflectance (Figure 1) that FARO scanners are more similar compared with the Leica, which could have affected our results.
Leaf points were used to develop linear regression models of the relationship between EWT and laser intensity features. The models showed that the most accurate prediction of EWT was achieved with the NDI_p80905, 1,550 feature with an R2 of 0.89. The accuracy of the prediction of EWT with segmented leaf points was the same as with all points but with a different feature. The best explanatory feature using all points was NDI_p70690, 1,550. This suggests that there are a lot of “noise” points still present in the point clouds considering the estimation of EWT in the lowest intensity percentiles because a higher percentile of the intensity distribution best explained EWT using leaf points. An intensity threshold could be applied to reduce the amount of noise points from the needles, but applying such a threshold greatly affects the distribution of the intensity values. Thus, a robust method would be needed to apply a threshold to different scans without losing valuable information regarding the intensity distribution.
The point density in each point cloud representing a seedling was reduced using random sampling to investigate the effect of point density on the estimation of EWT. The results showed that a lower scanning resolution could be used because the spectral indices calculated from the sparser point clouds still explained EWT almost as well as with maximum point density. After reducing the number of points down to 500 per seedling, the amount of variation explained was only slightly reduced. A more severe reduction in the amount of variance explained was present after the number of points was reduced to 250 per seedling. The NDI_p70905, 1550 index seemed to be more affected than NDI_p70690, 1550 by the reduction in point density.
A multiple regression model was developed with a laser intensity feature and length as predictors to estimate EWT. The inclusion of the length of the seedling in the regression model increased the accuracy of the estimation of EWT, although it should be pointed out that the length of the seedling varied only from 16.5 to 42 cm. Presumably, the inclusion of the length of the seedling is able to explain a part of the variation in EWT due to physiological alterations that occur during the life span of the needles. During the growing season, the specific leaf area (i.e., dry matter content per leaf area) increases due to accumulation of dry matter resulting in a lower EWT (Jach and Ceulemans, 2000).
The measurements in this study were conducted in a greenhouse, where environmental conditions were similar between measurements. Temperature and ambient light conditions did change a little between measurements depending on whether it was a sunny or cloudy day, but otherwise no alterations in range or background of the seedlings were present. The change in temperature and light conditions is a limitation that needs to be taken into account considering the applicability of the method for the forest environment. Here, we also found that stem points responded to changes in EWT, which is likely due to the thin bark of the seedlings. Mature trees have thicker bark; thus, the estimation of EWT with multispectral TLS likely requires segmentation or classification of laser returns to leaf and stem points.
The terrestrial laser scanners had slightly different technical parameters: The FARO scanners had similar specifications except for the laser beam diameter at output, which was 2.25 and 3 mm for the X330 and S120, respectively. The different specifications resulted in a different laser footprint at target but it seems that having the same laser footprint size at target is not crucial for calculating spectral indices because the correlations were high despite this factor. However, an airborne laser scanning measurement would result in much larger laser footprints, ~5–30 cm in diameter depending on the flying altitude, and a significantly lower point density. At these resolutions, the separation of woody and leaf material is practically impossible. The results obtained in this study show that the separation is not always necessary, but mature trees with large branches are likely to show a different response in terms of laser intensity.
The effect of incidence angle on spectral indices developed from multispectral laser scanning has been recently studied (Kaasalainen et al., 2016; Hancock et al., 2017). An NDI utilizing 1,063 and 1,545 nm wavelengths was concluded to not be sensitive to incidence angle effects when retrieving leaf moisture content. The combination of 905 and 1,550 nm wavelengths could be assumed to have similar properties due to the physical similarity of the wavelengths. Here, the needles had varying incidence angles and also varying receiving area because needles are not evenly spaced along the branches. Using an NDI calculated from the 905 and 1,550 nm wavelengths seems to reduce the effect of such confounding factors because using single wavelength data at 1,550 nm did not provide estimates of EWT as accurate as the spectral index did.
A commercially available multispectral laser scanner has been developed for airborne measurements, called Optech Titan (Teledyne Optech, Concord, Canada), which employs three wavelengths at 532, 1,064, and 1,550 nm. The combination of 1,064 and 1,550 nm wavelengths is interesting from the forest health mapping aspect, because these bands have been used before for EWT estimation (Gaulton et al., 2013). However, the different wavelengths of the Optech Titan have different footprints in terms of spatial distribution due to the instrument design (Morsy et al., 2016). The 1,064 nm channel is looking at nadir while the 1,550 nm channel is looking forward at 3.5° angle. This feature of the instrument presumably complicates the use of NDIs with the data, but the matter requires further investigation on the extent of the effect of varying spatial footprints at the canopy scale. A multispectral laser scanner for airborne measurements with overlapping footprints would be of great benefit in exploiting all the gains of the multispectral domain.
Based on the results, multisensor MS-TLS is capable of explaining most of the variation in leaf EWT of trees (R2 = 0.91) in a controlled environment. The combination of 905 and 1,550 nm wavelengths explained variation in EWT better than the combination of 690 and 1,550 nm, which is also supported by previous research (Ceccato et al., 2001). The high coefficients of determination in the estimation of EWT with spectral indices did not seem to require a high point density like we had in the original scans, but the scanning could be conducted at a lower resolution. Single trees measured from the sample plots provide a base for mapping and monitoring forests. Considering the small scale of our study and the larger scale of information that is required for monitoring declining forests and trees, we suggest that in the next step, tree-level EWT estimation in forest environment should be investigated using multispectral laser scanning at the 905 and 1,550 nm wavelengths and by classifying leaf and stem points.
Author Contributions
SJ designed the experiment, conducted data processing and statistical analysis, and wrote the manuscript. JS contributed to the laboratory analysis and writing of the manuscript. MV assisted in designing the experiment, statistical analysis, and the writing of the manuscript. RL contributed to the design of the experiment, data collection, and commented on the manuscript. HK contributed to the design of the experiment, gave technical advice, and commented on the manuscript. AK assisted with the measurement set-up and provided technical support. MH, HH, and JH arranged all the required resources, supervised the experiment, and participated in the writing of the manuscript. All of the authors have contributed to the finalizing of the manuscript.
Funding
This work was supported by the Academy of Finland project Centre of Excellence in Laser Scanning Research (CoE-LaSR) under Grant 272195, Unmanned Airborne Vehicle–based 4D Remote Sensing for Mapping Rain Forest Biodiversity and Its Change in Brazil (Decision number 273806), the Finnish Cultural Foundation under Grant 2CE87B6E, the Finnish Society of Forest Science, and the Niemi Foundation.
Conflict of Interest Statement
The authors declare that the research was conducted in the absence of any commercial or financial relationships that could be construed as a potential conflict of interest.
Acknowledgments
We would like to thank the Natural Resources Institute Finland (Luke) for providing greenhouse and laboratory facilities, and for assistance in maintaining the seedlings.
References
Allen, C. D., Macalady, A. K., Chenchouni, H., Bachelet, D., McDowell, N., Vennetier, M., et al. (2010). A global overview of drought and heat-induced tree mortality reveals emerging climate change risks for forests. For. Ecol. Manage. 259, 660–684. doi: 10.1016/j.foreco.2009.09.001
Balduzzi, M. A., Van der Zande, D., Stuckens, J., Verstraeten, W. W., and Coppin, P. (2011). The properties of terrestrial laser system intensity for measuring leaf geometries: a case study with conference pear trees (Pyrus Communis). Sensors 11, 1657–1681. doi: 10.3390/s110201657
Carter, G. A. (1993). Responses of leaf spectral reflectance to plant stress. Am. J. Bot. 80, 239–243. doi: 10.1002/j.1537-2197.1993.tb13796.x
Ceccato, P., Flasse, S., Tarantola, S., Jacquemoud, S., and Grégoire, J.-M. (2001). Detecting vegetation leaf water content using reflectance in the optical domain. Remote Sens. Environ. 77, 22–33. doi: 10.1016/S0034-4257(01)00191-2
Chaerle, L., and Van Der Straeten, D. (2000). Imaging techniques and the early detection of plant stress. Trends Plant Sci. 5, 495–501. doi: 10.1016/S1360-1385(00)01781-7
Chuvieco, E., Cocero, D., Riano, D., Martin, P., Martinez-Vega, J., de la Riva, J., et al. (2004). Combining NDVI and surface temperature for the estimation of live fuel moisture content in forest fire danger rating. Remote Sens. Environ. 92, 322–331. doi: 10.1016/j.rse.2004.01.019
Danson, F., Steven, M., Malthus, T., and Clark, J. (1992). High-spectral resolution data for determining leaf water content. Int. J. Remote Sens. 13, 461–470. doi: 10.1080/01431169208904049
Dimitrakopoulos, A., and Papaioannou, K. K. (2001). Flammability assessment of Mediterranean forest fuels. Fire Technol. 37, 143–152. doi: 10.1023/A:1011641601076
Douglas, E. S., Strahler, A., Martel, J., Cook, T., Mendillo, C., Marshall, R., et al. (2012). “DWEL: a dual-wavelength echidna lidar for ground-based forest scanning,” in Geoscience and Remote Sensing Symposium (IGARSS), 2012 IEEE International: (Munich: IEEE), 4998–5001.
Easlon, H. M., and Bloom, A. J. (2014). Easy leaf area: automated digital image analysis for rapid and accurate measurement of leaf area. Appl. Plant Sci. 2:1400033. doi: 10.3732/apps.1400033
Fassnacht, F. E., Latifi, H., Ghosh, A., Joshi, P. K., and Koch, B. (2014). Assessing the potential of hyperspectral imagery to map bark beetle-induced tree mortality. Remote Sens. Environ. 140, 533–548. doi: 10.1016/j.rse.2013.09.014
Gaulton, R., Danson, F., Ramirez, F., and Gunawan, O. (2013). The potential of dual-wavelength laser scanning for estimating vegetation moisture content. Remote Sens. Environ. 132, 32–39. doi: 10.1016/j.rse.2013.01.001
Goodwin, N. R., Coops, N. C., Wulder, M. A., Gillanders, S., Schroeder, T. A., and Nelson, T. (2008). Estimation of insect infestation dynamics using a temporal sequence of Landsat data. Remote Sens. Environ. 112, 3680–3689. doi: 10.1016/j.rse.2008.05.005
Gschwantner, T., Lanz, A., Vidal, C., Bosela, M., Di Cosmo, L., Fridman, J., et al. (2016). Comparison of methods used in European National Forest Inventories for the estimation of volume increment: towards harmonisation. Ann. For. Sci. 73, 807–821. doi: 10.1007/s13595-016-0554-5
Hakala, T., Suomalainen, J., Kaasalainen, S., and Chen, Y. (2012). Full waveform hyperspectral LiDAR for terrestrial laser scanning. Opt. Express 20, 7119–7127. doi: 10.1364/OE.20.007119
Hancock, S., Gaulton, R., and Danson, F. M. (2017). Angular reflectance of leaves with a dual-wavelength terrestrial lidar and its implications for leaf-bark separation and leaf moisture estimation. IEEE Trans. Remote Sens. 55, 3084–3090. doi: 10.1109/TGRS.2017.2652140
Hanewinkel, M., Cullmann, D. A., Schelhaas, M.-J., Nabuurs, G.-J., and Zimmermann, N. E. (2013). Climate change may cause severe loss in the economic value of European forest land. Nat. Clim. Change 3, 203–207. doi: 10.1038/nclimate1687
Horntvedt, R., Christiansen, E., Solheim, H., and Wang, S. (1983). Artificial inoculation with [ps typographus-associated blue-stain fungi can kili healthy Norway spruce trees. Medd. Nor. Inst. Skogforsk. 38, 1–20.
Jach, M. E., and Ceulemans, R. (2000). Effects of season, needle age and elevated atmospheric CO2 on photosynthesis in Scots pine (Pinus sylvestris). Tree Physiol. 20, 145–157. doi: 10.1093/treephys/20.3.145
Jordan, C. F. (1969). Derivation of leaf-area index from quality of light on the forest floor. Ecology 50, 663–666. doi: 10.2307/1936256
Junttila, S., Vastaranta, M., Liang, X., Kaartinen, H., Kukko, A., Kaasalainen, S., et al. (2016). Measuring leaf water content with dual-wavelength intensity data from terrestrial laser scanners. Remote Sensing 9:8. doi: 10.3390/rs9010008
Kaasalainen, S., Jaakkola, A., Kaasalainen, M., Krooks, A., and Kukko, A. (2011). Analysis of incidence angle and distance effects on terrestrial laser scanner intensity: search for correction methods. Remote Sens. 3, 2207–2221. doi: 10.3390/rs3102207
Kaasalainen, S., Krooks, A., Kukko, A., and Kaartinen, H. (2009). Radiometric calibration of terrestrial laser scanners with external reference targets. Remote Sens. 1, 144–158. doi: 10.3390/rs1030144
Kaasalainen, S., Nevalainen, O., Hakala, T., and Anttila, K. (2016). Incidence angle dependency of leaf vegetation indices from hyperspectral lidar measurements. Photogramm. Fernerkundung Geoinform. 2016, 75–84. doi: 10.1127/pfg/2016/0287
Lausch, A., Heurich, M., Gordalla, D., Dobner, H.-J., Gwillym-Margianto, S., and Salbach, C. (2013). Forecasting potential bark beetle outbreaks based on spruce forest vitality using hyperspectral remote-sensing techniques at different scales. For. Ecol. Manage. 308, 76–89. doi: 10.1016/j.foreco.2013.07.043
Li, W., Niu, Z., Sun, G., Gao, S., and Wu, M. (2016). Deriving backscatter reflective factors from 32-channel full-waveform LiDAR data for the estimation of leaf biochemical contents. Opt. Express 24, 4771–4785. doi: 10.1364/OE.24.004771
Matikainen, L., Hyyppä, J., and Litkey, P. (2016). Multispectral airborne laser scanning for automated map updating. ISPRS Intern. Arch. Photogramm. Remote Sens. Spatial Inform. Sci. XLI-B3, 323–330. doi: 10.5194/isprsarchives-XLI-B3-323-2016
McDowell, N. G., and Allen, C. D. (2015). Darcy's law predicts widespread forest mortality under climate warming. Nat. Clim. Change 5, 669–672. doi: 10.1038/nclimate2641
Meddens, A. J., Hicke, J. A., Vierling, L. A., and Hudak, A. T. (2013). Evaluating methods to detect bark beetle-caused tree mortality using single-date and multi-date Landsat imagery. Remote Sens. Environ. 132, 49–58. doi: 10.1016/j.rse.2013.01.002
Morris, J. L., Cottrell, S., Fettig, C. J., Hansen, W. D., Sherriff, R. L., Carter, V. A., et al. (2016). Managing bark beetle impacts on ecosystems and society: priority questions to motivate future research. J. Appl. Ecol. 54, 750–760. doi: 10.1111/1365-2664.12782
Morsy, S., Shaker, A., El-Rabbany, A., and LaRocque, P. E. (2016). Airborne multispectral LiDAR data for land-cover classification and land/water mapping using different spectral indexes. ISPRS Ann. Photogramm. Remote Sens. Spatial Inform. Sci. 3, 217–224. doi: 10.5194/isprsannals-III-3-217-2016
Niu, Z., Xu, Z., Sun, G., Huang, W., Wang, L., Feng, M., et al. (2015). Design of a new multispectral waveform LiDAR instrument to monitor vegetation. IEEE Geosci. Remote Sens. Lett. 12, 1506–1510. doi: 10.1109/LGRS.2015.2410788
Raffa, K. F., Aukema, B., Bentz, B. J., Carroll, A., Erbilgin, N., Herms, D. A., et al. (2009). A literal use of forest health safeguards against misuse and misapplication. J. For. 107, 276–277. doi: 10.1093/jof/107.5.276
Senf, C., Seidl, R., and Hostert, P. (2017). Remote sensing of forest insect disturbances: current state and future directions. Int. J. Appl. Earth Observ. Geoinform. 60, 49–60. doi: 10.1016/j.jag.2017.04.004
Skakun, R. S., Wulder, M. A., and Franklin, S. E. (2003). Sensitivity of the thematic mapper enhanced wetness difference index to detect mountain pine beetle red-attack damage. Remote Sens. Environ. 86, 433–443. doi: 10.1016/S0034-4257(03)00112-3
Sow, M., Mbow, C., Hély, C., Fensholt, R., and Sambou, B. (2013). Estimation of herbaceous fuel moisture content using vegetation indices and land surface temperature from MODIS data. Remote Sens. 5, 2617–2638. doi: 10.3390/rs5062617
R Core Team (2013). A language and Environment For Statistical Computing. Vienna; R Foundation for Statistical Computing.
Trumbore, S., Brando, P., and Hartmann, H. (2015). Forest health and global change. Science 349, 814–818. doi: 10.1126/science.aac6759
Wallace, A., Nichol, C., and Woodhouse, I. (2012). Recovery of forest canopy parameters by inversion of multispectral LiDAR data. Remote Sens. 4, 509–531. doi: 10.3390/rs4020509
Watson, G. A. (2006). Computing helmert transformations. J. Comput. Appl. Math. 197, 387–394. doi: 10.1016/j.cam.2005.06.047
Wei, G., Shalei, S., Bo, Z., Shuo, S., Faquan, L., and Xuewu, C. (2012). Multi-wavelength canopy LiDAR for remote sensing of vegetation: design and system performance. ISPRS J. Photogramm. Remote Sens. 69, 1–9. doi: 10.1016/j.isprsjprs.2012.02.001
Wermelinger, B. (2004). Ecology and management of the spruce bark beetle Ips typographus — a review of recent research. For. Ecol. Manage. 202, 67–82. doi: 10.1016/j.foreco.2004.07.018
White, J. C., Wulder, M. A., Brooks, D., Reich, R., and Wheate, R. D. (2005). Detection of red attack stage mountain pine beetle infestation with high spatial resolution satellite imagery. Remote Sens. Environ. 96, 340–351. doi: 10.1016/j.rse.2005.03.007
Williams, A. P., Allen, C. D., Macalady, A. K., Griffin, D., Woodhouse, C. A., Meko, D. M., et al. (2013). Temperature as a potent driver of regional forest drought stress and tree mortality. Nat. Clim. Change 3, 292–297. doi: 10.1038/nclimate1693
Wulder, M. A., White, J., Bentz, B., Alvarez, M., and Coops, N. (2006). Estimating the probability of mountain pine beetle red-attack damage. Remote Sens. Environ. 101, 150–166. doi: 10.1016/j.rse.2005.12.010
Zarco-Tejada, P. J., Rueda, C., and Ustin, S. (2003). Water content estimation in vegetation with MODIS reflectance data and model inversion methods. Remote Sens. Environ. 85, 109–124. doi: 10.1016/S0034-4257(02)00197-9
Zhu, X., Wang, T., Darvishzadeh, R., Skidmore, A. K., and Niemann, K. O. (2015). 3D leaf water content mapping using terrestrial laser scanner backscatter intensity with radiometric correction. ISPRS J. Photogramm. Remote Sens. 110, 14–23. doi: 10.1016/j.isprsjprs.2015.10.001
Keywords: terrestrial laser scanning, tree health, drought stress, multispectral laser scanning, leaf water content, forest damage, Endoconidiophora polonica
Citation: Junttila S, Sugano J, Vastaranta M, Linnakoski R, Kaartinen H, Kukko A, Holopainen M, Hyyppä H and Hyyppä J (2018) Can Leaf Water Content Be Estimated Using Multispectral Terrestrial Laser Scanning? A Case Study With Norway Spruce Seedlings. Front. Plant Sci. 9:299. doi: 10.3389/fpls.2018.00299
Received: 30 September 2017; Accepted: 21 February 2018;
Published: 08 March 2018.
Edited by:
Alexander Bucksch, University of Georgia, United StatesReviewed by:
Asish Kumar Parida, CSIR-Central Salt & Marine Chemicals Research Institute, IndiaIoannis Konstantinos Christodoulakis, National and Kapodistrian University of Athens, Greece
András Zlinszky, Institute of Ecology Research Center (MTA), Hungary
Copyright © 2018 Junttila, Sugano, Vastaranta, Linnakoski, Kaartinen, Kukko, Holopainen, Hyyppä and Hyyppä. This is an open-access article distributed under the terms of the Creative Commons Attribution License (CC BY). The use, distribution or reproduction in other forums is permitted, provided the original author(s) and the copyright owner are credited and that the original publication in this journal is cited, in accordance with accepted academic practice. No use, distribution or reproduction is permitted which does not comply with these terms.
*Correspondence: Samuli Junttila, samuli.junttila@helsinki.fi