 Kunjiang Yu1,2,3†
 Xiaodong Wang1†Feng Chen1Qi Peng1Song Chen1
 Hongge Li1Wei Zhang1Sanxiong Fu1Maolong Hu1Weihua Long1
 Pu Chu2
 Rongzhan Guan2*
 Jiefu Zhang1*
- 1Key Laboratory of Cotton and Rapeseed, Ministry of Agriculture, Institute of Industrial Crops, Jiangsu Academy of Agricultural Sciences, Nanjing, China
- 2State Key Laboratory of Crop Genetics and Germplasm Enhancement, Nanjing Agricultural University, Nanjing, China
- 3College of Agriculture, Guizhou University, Guiyang, China
The apetalous trait of rapeseed (Brassica napus, AACC, 2n = 38) is important for breeding an ideal high-yield rapeseed with superior klendusity to Sclerotinia sclerotiorum. Currently, the molecular mechanism underlying the apetalous trait of rapeseed is unclear. In this study, 14 petal regulators genes were chosen as target genes (TGs), and the expression patterns of the 14 TGs in the AH population, containing 189 recombinant inbred lines derived from a cross between apetalous “APL01” and normal “Holly,” were analyzed in two environments using qRT-PCR. Phenotypic data of petalous degree (PDgr) in the AH population were obtained from the two environments. Both quantitative trait transcript (QTT)-association mapping and expression QTL (eQTL) analyses of TGs expression levels were performed to reveal regulatory relationships among TGs and PDgr. QTT mapping for PDgr determined that PLURIPETALA (PLP) was the major negative QTT associated with PDgr in both environments, suggesting that PLP negatively regulates the petal development of line “APL01.” The QTT mapping of PLP expression levels showed that CHROMATIN-REMODELING PROTEIN 11 (CHR11) was positively associated with PLP expression, indicating that CHR11 acts as a positive regulator of PLP expression. Similarly, QTT mapping for the remaining TGs identified 38 QTTs, associated with 13 TGs, and 31 QTTs, associated with 10 TGs, respectively, in the first and second environments. Additionally, eQTL analyses of TG expression levels showed that 12 and 11 unconditional eQTLs were detected in the first and second environment, respectively. Based on the QTTs and unconditional eQTLs detected, we presented a hypothetical molecular regulatory network in which 14 petal regulators potentially regulated the apetalous trait in “APL01” through the CHR11-PLP pathway. PLP acts directly as the terminal signal integrator negatively regulating petal development in the CHR11-PLP pathway. These findings will aid in the understanding the molecular mechanism underlying the apetalous trait of rapeseed.
Introduction
Flowers of angiosperms are typically composed of four organ types inclined to four floral whorls. From the outside of the flower to the center, these organs are orderly sepals, petals, stamens, and carpels (the subunits of the gynoecium). Over the last 20 years, the molecular mechanism of flower development have been adequately elucidated in several angiosperm species, such as Arabidopsis thaliana, Antirrhinum majus, Petunia hybrid, and Oryza sativa (Schwarz-Sommer et al., 1990; Bowman et al., 1991; van der Krol and Chua, 1993; Li et al., 2011; Hirano et al., 2014). Recently, the genetics of flower development in Ranunculales were also decoded successfully (Damerval and Becker, 2017). The “ABC model” as the basic model explaining both floral patterning and floral organ identity has been endlessly enriched by works in several eudicot species (Pelaz et al., 2000; Jack, 2001; Theissen and Saedler, 2001). Currently, the “ABCE model,” as the most detailed floral model, is guiding investigations that will aid in understanding the origin and diversification of angiosperm flowers.
Petal initiation, a key unit of flower development, is crucial in revealing the evolutionary history of flowering plants. According to the “floral quarter model,” A class (APETALA 1, AP1), B class (APETALA3 and PISTILLALA, AP3 and PI, respectively), and E class (SEPALLALA 1/2/3, SEP1/2/3) genes are simultaneously required for petal identity in Arabidopsis (Theissen and Saedler, 2001; Ditta et al., 2004). Molecular evolutionary studies indicated that B class genes underwent two vital duplication and divergence events, in which the first event generated the PI and paleoAP3 lineages, while the second event generated euAP3 and TM6 lineages (Kramer et al., 1998; Kim et al., 2004). Both paleoAP3 and TM6 have the same paleoAP3 motif regulating stamen development, but they are not involved in petal development (Kramer et al., 1998; Kim et al., 2004; Rijpkema et al., 2006). EuAP3 contains the euAP3 motif required for development of both petals and stamens (Vandenbussche et al., 2004; de Martino et al., 2006; Rijpkema et al., 2006; Drea et al., 2007; Kramer et al., 2007; Hileman and Irish, 2009). Strangely, although there are both euAP3 and TM6 in most eudicots, there is only euAP3 in Arabidopsis and snapdragon (Lamb and Irish, 2003; Vandenbussche et al., 2004). In addition to B class genes, there are a number of genes involved in petal development in Arabidopsis, many of which function upstream or downstream of ABE class genes (Kaufmann et al., 2009, 2010; Wuest et al., 2012). However, the locations of some genes in the regulatory network of petal development are unclear, such as PLURIPETALA (PLP) (Running et al., 2004) and CHROMATIN-REMODELING PROTEIN 11(CHR11) (Smaczniak et al., 2012).
Apetalous rapeseed, which is a novel floral mutant in which the whorl organs are perfectly developed separate from the petals, has advantages of low-energy consumption, high photosynthetic efficiency and superior klendusity to Sclerotinia sclerotiorum (Chapman et al., 1984; Yates and Steven, 1987; Morrall, 1996; Jamaux and Spire, 1999). Thus, apetalous rapeseed is considered the ideotype of high-yield rapeseed (Mendham and Rao, 1991; Rao et al., 1991), and it has attracted the attention of botanists and breeders since its appearance. Currently, the molecular mechanism underlying the apetalous characteristic of rapeseed is poorly known because of the lack of stable apetalous mutants and the complexity of polygenic inheritance (Kelly et al., 1995; Fray et al., 1997; Wang et al., 2015; Yu et al., 2016). The apetalous characteristic of rapeseed is mainly governed by recessive genes, usually by two to four loci (Kelly et al., 1995), and several quantitative trait loci (QTLs) regulating petal development on chromosomes A3, A4, A5, A6, A9, C4, and C8 have been identified (Fray et al., 1997; Wang et al., 2015). A deficiency in euAP3 expression may give rise to the apetalous characteristic, while the paleoAP3 expression ensures stamen development in Brassica napus (Zhang et al., 2011). This theory, coupled with the “ABCE model,” predicts that sepals of apetalous rapeseed should increase, but the number of sepals is actually normal (Zhang et al., 2011). This indicates that the molecular mechanism controlling the apetalous characteristic of rapeseed is more complex than initially believed.
In our previous study (Wang et al., 2015), nine QTLs associated with petalous degree (PDgr) have been detected on chromosomes A3, A5, A6, A9, and C8 in the AH population, containing 189 recombinant inbred lines derived from a cross between an apetalous line “APL01” and a normal petalled variety “Holly.” Interestingly, three QTLs, qPD.A9-2, qPD.C8-2, and qPD.C8-3, are stably expressed in multiple environments (Wang et al., 2015). In another study (Yu et al., 2016), genome-wide transcriptomic analyses of the apetalous line “APL01” and another normally petalled line “PL01” both derived from the F6 generation of crosses between apetalous “Apetalous No. 1” and normal petalous “Zhongshuang No. 4” rapeseed have been performed. Further analysis suggested that a large number of genes involved in protein biosynthesis were differentially expressed at the key stage of petal primordium initiation in “APL01” compared with in “PL01,” and 36 petal regulators implicated in the apetalous trait of line APL01 were identified (Yu et al., 2016). Interestingly, the 36 petal regulators were outside of the confidence intervals (CIs) of nine QTLs regulating PDgr, implying that these genes maybe function at the downstream of the QTLs (Yu et al., 2016). However, it's worth noting that mutants of the 36 petal regulators result in defective floral phenotypes other than abnormal petals in Arabidopsis, such as (PLP) (Running et al., 2004) and (CHR11) (Smaczniak et al., 2012). For the aptelous characteristic of rapeseed, these genes collaboratively participate in the regulation of petal development, leading to the unique floral phenotype of “APL01.” However, the specifics of this collaborative participation are unclear. Thus, it is necessary to analyze relationships among petal regulators and PDgr using multiple approaches.
A quantitative trait transcript (QTT) analysis is a mixed linear model approach of association mapping of a transcriptome (Zhang et al., 2015). So far, QTT has been applied to detect the transcripts associated with complex traits in mice (Zhang et al., 2015), rice (Zhou et al., 2016), and human (Chen et al., 2016) populations, and it has efficiently identified the genetic effects of individual loci, and epistatic interactions of pair-wise loci or gene-by-gene (G×G) (Zhang et al., 2015; Chen et al., 2016; Zhou et al., 2016). Expression QTL (eQTL) analysis based on linkage mapping is an approach to determining gene expression levels (Jansen and Nap, 2001). This approach can identify the genetic determinants of gene expression levels and has been successfully used to investigate gene regulatory pathways in plants (DeCook et al., 2005; Jordan et al., 2007; Yin et al., 2010; Wang et al., 2014), animals (Sun et al., 2003; Ghazalpour et al., 2006; Li et al., 2006), and humans (Cheung et al., 2003; Göring et al., 2007; Battle and Montgomery, 2014). Conditional QTL mapping is a method that can exclude the contribution of a causal trait to the variation of the resultant trait (Zhu, 1995). Unconditional QTL mapping coupled with conditional QTL analysis could dissect the genetic relationships between two traits at the QTL level, and then it has been broadly applied to exploring the relationships between QTLs and the corresponding conditional traits (Zhao et al., 2006; Cui et al., 2011; Zhang et al., 2013).
In this study, we analyzed the expression levels of the 36 petal regulators genes and 1 candidate gene CG1 (BnaC08g10840D), underlying the CI of the major QTL qPD.C8-2 in “APL01,” “PL01,” and “Holly” by using qRT-PCR. The comparative analyses indicated that both 13 petal regulators genes and CG1 showed the same dynamic expression levels between “APL01” and “PL01” as between “APL01” and “Holly.” Thus, the 14 genes were chosen as target genes (TGs) for quantitative reverse transcription-PCR (qRT-PCR) analyses. The expression patterns of the 14 TGs in the AH population were analyzed in two environments using qRT-PCR. Phenotypic data of PDgr in the AH population were obtained from the two environments. Regulatory relationships among TGs and PDgr were discovered, genomic regions influencing TGs expression were identified, and molecular networks regulating the petal development of an apetalous line “APL01” were constructed as a result of QTT-association mapping coupled with eQTL analyses of TGs expression levels.
Materials and Methods
Plant Materials
“APL01” and “PL01” was selected from the F6 generation of crosses between apetalous (“Apetalous No. 1”) and normal petalous (“Zhongshuang No. 4”) rapeseed in 1998. “Apetalous No. 1” had been developed from the F8 generation of crosses between a Chinese rapeseed cultivar with smaller petals (SP103) and B. rapa variety with a lower PDgr (LP153). “Zhongshuang No. 4” was bred at the Oil Crops Research Institute of the Chinese Academy of Agricultural Sciences, Wuhan, China. The AH population, containing 189 recombinant inbred lines (RILs), was derived from a cross between an apetalous line “APL01” and a normally petalled variety “Holly.” The genotype “Holly” is a completely petalled variety. The AH population was planted in two different districts, Lishui County (coded 2015a) and Xuanwu District (coded 2015b), in Nanjing of Jiangsu Province for one year (September-May of 2014-2015) with good field management measures. The subsequent works were independently performed in both environments.
Collection of Samples, and Evaluation of PDgr
According to our previous study (Yu et al., 2016) and with early flower development studies in B. napus (Polowick and Sawhney, 1986) and in Arabidopsis (Smyth et al., 1990), the petal primordia appear in the second whorl later in stage 5, but the petal primordia begin growing rapidly at the start of stage 9 in B. napus. The length of buds in stage 10 is at least double that of buds in stage 9. To minimize the sampling error, young inflorescences only containing buds at stages 1 to 9 were gathered for the subsequent works after removing stage 10 to 12 buds during flower bud development. At least five young inflorescences derived from five plants in each RIL of the AH population were collected in each environment. A total of two biological samples were collected in each RIL of the AH population. For lines “APL01,” “PL01,” and “Holly,” three biological samples of each line were separately collected. The actual and theoretic numbers of flower petals were recorded in each RIL at early blooming stage. The evaluation of PDgr was carried out as described in our previous study (Wang et al., 2015).
Total RNA Exaction, cDNA Synthesis, and qRT-PCR Assay
Total RNA was isolated using MagaZorb® Total RNA Mini-Prep Kit (Promega, Madison, WI, USA). RNA degradation and contamination were checked on 1% agarose gels. The RNA concentration was measured using the Q3000® Micro-Ultraviolet Spectrophotometer (Quawell, Sunnyvale, CA, USA). First-strand cDNAs were synthesized in a final volume of 20 μL containing 4 μL of 5 × PrimeScript RT Master Mix (Perfect Real Time), ≤1 μg of total RNA, and <16 μL of RNase Free dH2O using PrimeScript™ RT Master Mix (Perfect Real Time) (TaKaRa, Da Lian, China). Sequences of TGs and paralogs were obtained from the B. napus genome database (http://www.genoscope.cns.fr/brassicanapus/) (Chalhoub et al., 2014). Primers for the qRT-PCR assay were designed using Primer 5 software and synthesized by Sangon Biotech (Shanghai, China) (Table S1). The rapeseed ACTIN (BnaA05g21350D) gene was chosen as the endogenous reference gene to examine the sample-to-sample variation in the amount of cDNA. Each reaction (20 μL) contained 10 μL of 2 × SYBR Premix Ex Taq (Tli RNaseH Plus), 0.8 μL of 10 μM gene-specific primers, 0.4 μL of 50 × ROX Reference Dye II, <100 ng of first-strand cDNAs, and <8.8 μL of RNase Free dH2O according to SYBR® Premix Ex Taq™ (Tli RNaseH Plus) (TaKaRa). The three-step PCR (95°C for 30 s, followed by 40 cycles of 95°C for 5 s, 55°C for 30 s, and 72°C for 30 s) was performed with the ABI PRISM 7500 Real-Time PCR System (Applied Biosystems, Foster, CA, USA). For the qRT-PCR assay on “APL01” vs. “PL01,” or “Holly,” the later was chosen as the sample for reference. For the qRT-PCR assay in the AH population, RIL43 was chosen as the reference sample. Triplicate replicates for each qRT-PCR assay were performed independently.
Data Collection, Identification of TGs, and Drafting of Standard Curves
PCR cycles (Ct) for all genes were determined in each amplification reaction after removing the reactions with nonspecific and/or unrepeatable amplifications. The relative expression levels of the genes in different samples were calculated using 2−ΔΔCt method (Livak and Schmittgen, 2001), defined as: ΔΔCt = (Ct, target−Ct, actin)genotype−(Ct, target−Ct, actin)calibrator, in which “genotype” indicates the target sample and “calibrator” indicates the reference sample. In our previous study, 36 petal regulators and 1 candidate gene were identified as differentially expressed genes in line APL01 compared with line PL01 (Yu et al., 2016). In this study, whether the differences in these genes' expression levels between “APL01” and “PL01” or “Holly” are significant depends on the P-value estimated using SPSS Statistics 19.0 software (IBM, Armonk, NY, USA) (non-paired t-test, P < 0.05). Genes showing the same expression patterns between “APL01” and “PL01” as between “APL01” and “Holly” were regarded as TGs for the subsequent analyses. Standard cDNA was diluted 10, 15, 20, 25, 30, and 35 times before the qRT-PCR analysis. The cDNA's dilution ratio is the independent variable of the standard curve, while the Ct values of the TGs and ACTIN are the dependent variables. Standard curves of TGs were drawn using Sigma Plot 12.5 software (Systat Software Inc., San Jose, CA, USA). TG expression levels in the AH population were used for QTT mapping and eQTL analysis after removing low quality data. The non-specific PCR amplification of ACTIN in each cDNA sample was regarded as the standard for estimating low quality data because the ACTIN primer pair consisted of cross-intron primers. To further evaluate the reliability of qRT-PCR data, all of the TG expression data was normalized using the following formula:
in which “y” represents the normalized expression data of TG, “q” represents the TG expression level (2−ΔΔCt) in each RIL of the AH population, “a” indicates the average of the TG expression levels in the AH population, and “SD” is the standard deviation of the TG expression levels in the AH population.
The scatter plot diagram of the normalized expression data of TGs was drawn using Adobe Photoshop CS6 v13.0 software (Adobe Systems Inc., San Jose, CA, USA). The qualified qRT-PCR data should be located in the interval ranging from −2 to 2.
Correlation Analysis, and QTT-Association Mapping for PDgr and TGs
The correlations of PDgr with the TG expression levels in the AH population were assessed using SPSS Statistics 19.0 software (Bivariate correlation, Pearson, P < 0.05). QTT-association mapping of PDgr and TGs expression levels in the AH population was performed based on a mixed linear model approach using the QTT functional module of the QTXNetwork software (Zhang et al., 2015). For the QTT analysis of PDgr, the 14 TGs expression levels were the genotypic data, while PDgr was the phenotypic data in each assay. The transcript locus regulating PDgr was called QTT to correspond with the TG. Subsequently, QTT mapping of TGs were performed, and the expression levels of the TGs regulating PDgr served as the phenotypic data, while the remaining TG expression levels served as the genotypic data. QTT regulating TG expression level was called tQTT to correspond with the TG. To the same analogy, QTT-association mapping of the tQTTs (TGs) regulating the corresponding TG expression levels was performed in sequence. The mapping order and permutation time were set to 3 and 1000, respectively. The superior x-Ome prediction was also included. The P threshold for declaring a QTT (tQTT) significant was set as 0.05 (−LogP > 1.3). The normalized expression data of TG was used for QTT analysis. For mapping transcripts in homozygote population, the dependent variables (ykh) of the k-th subject in the h-th environment can be expressed by the following mixed linear model (Zhang et al., 2015):
where μ represents the population mean; eh represents the fixed effect of the h-th environment; qi represents the i-th locus effect with coefficient uik (using expression values in QTT mapping); qqij represents the epistasis effect of locus i × locus j with coefficients uijk (using expression values uik × ujk in QTT mapping); qeih represents the environment interaction effect of the i-th locus in the h-th environment with coefficient uikh; qqeijh represents the epistasis × environment interaction effect of locus i × locus j in the h-th environment with coefficient uijkh; and εkh represents the residual effect of the k-th individual in the h-th environment.
A QTT or tQTT with a heritability of at least 10% (h2 ≥ 10%) was considered the major QTT or tQTT, while QTT or tQTT that was detected repeatedly in the two environments was considered a stable QTT or tQTT. Both are considered as the key QTTs or tQTTs.
Unconditional and Conditional eQTL Mapping of TGs
In our recent study (Wang et al., 2015), the AH genetic linkage map was constructed based on 2755 single-nucleotide polymorphism markers and 57 simple sequence repeats, and the QTLs for PDgr were been successfully detected. In this study, the TG expression levels in the AH population were regarded as phenotypic data for QTL linkage mapping, which was termed unconditional eQTL mapping. The software Windows QTL Cartographer 2.5 (Raleigh, NC, USA) was applied to perform the unconditional eQTL analysis (Wang et al., 2007). The composite interval mapping model was deployed for estimating putative eQTLs with additive effects (Zeng, 1994). The working speed and window size were set to 2, and 10 cM, respectively. The logarithm of odds threshold for detecting a significant eQTL ranged from 2.2 to 3.4 based on permutation test analyses (1,000 permutations, 5% overall error level) as described previously (Churchill and Doerge, 1994). Thus, the false discovery rate for eQTL analysis was 0.05. A conditional eQTL analysis was carried out as described by Zhu (1995). The key tQTTs were regarded as the conditional independent variables, and conditional expression levels (conditional dependent variables) of TGs were generated using the QGAstation software.
Construction of the Molecular Network Involved in Petal Development
Based on tQTTs and unconditional eQTLs, combined with our previous research (Wang et al., 2015; Yu et al., 2016), a regulatory network for the apetalous characteristic in “APL01” was constructed using Adobe Photoshop CS6 v13.0 software (Adobe Systems Inc).
Results
Identification of TGs, and TG Expression Levels in the AH Population
In a previous study (Yu et al., 2016), 36 petal regulators and several candidate genes involved in the apetalous characteristic of line APL01 were obtained (Table S2). In this study, we determined that 13 petal regulators and 1 candidate gene CG1 (candidate gene 1, BnaC08g10840D) showed the same expression patterns between “APL01” and “Holly” as between “APL01” and “PL01” as determined by qRT-PCR assays (Figure 1, Table S2). Thus, the 14 genes were regarded as TGs for the subsequent analyses. For these TGs, the expression levels of 3 genes increased at least 1.5-fold, while those of 11 decreased more than 1.6-fold in “APL01” compared with in “Holly” (Table S2).
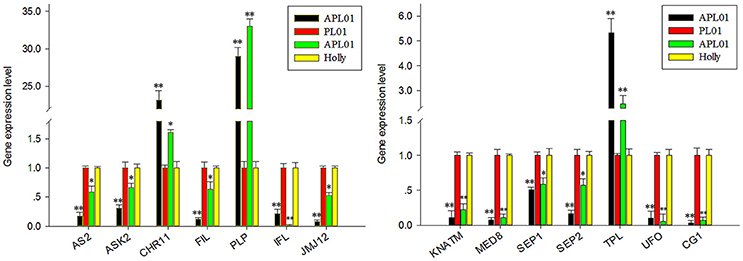
Figure 1. Verification of TG expression patterns by using qRT-PCR. Fourteen putative petal regulators showed the same expression patterns between “APL01” and “PL01” (black and red bars, respectively) as between “APL01” and “Holly” (green and yellow bars, respectively). Rapeseed ACTIN was chosen as the internal control to normalize the expression data. Data are the mean with standard error (SE) from three independent experiments. Single asterisk indicates that the difference is significant (non-paired t-test, P < 0.05), double asterisks indicate that the difference is extremely significant (non-paired t-test, P < 0.01).
To estimate the relative expression levels of TGs, the rapeseed ACTIN was used as the endogenous reference gene to determine the sample-to-sample variation in the amount of cDNA. As shown in Figure 2, the slopes of the curves for each TG are almost to the same as that of ACTIN, indicating that the amplification efficiency was the same for the 14 TGs and ACTIN (Table S3). Subsequently, the expression levels of 14 TGs in the AH population were generated from the two environments using qRT-PCR. After removing low quality data, a high-quality dataset derived from 174 RILs was obtained for the next experiment. The scatter plot diagram of the normalized expression data of TGs suggested that most of data were located in the interval from −2 to 2 (Figure S1), indicating that qRT-PCR data used in this study was reliable.
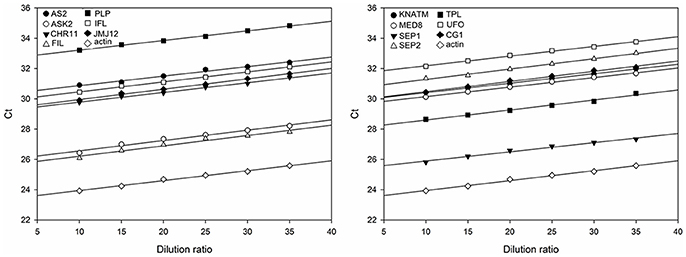
Figure 2. Standard curves for the amplification of 14 TGs and the endogenous reference gene ACTIN. The divisions on the horizontal axis represent the eight dilution ratio of standard cDNA, while the divisions on the vertical axis represent the threshold cycle values (Ct) of the amplification. The amplification reactions of the TGs are described by the corresponding regression formulae (Table S3). The slope of the curves reflects the amplification efficiency of the corresponding TGs.
Correlation Analysis
Correlation analyses between two biological replicates of TG expression within an environment determined that the Pearson correlation coefficient was at least 0.601, which means that qRT-PCR data was repeatable (Table S4). Correlation analysis of PDgr determined that the Pearson correlation coefficient was 0.806 between the two environments (Bivariate correlation, P = 2.01E-40) (Table 1), which suggests that there was a slight difference in PDgr between two environments. The expression levels of the TGs in the AH population, except for CHROMATIN-REMODELING PROTEIN 11 (CHR11), SEP1, and TOPLESS (TPL), showed highly significant correlations between the two environments, and the Pearson correlation coefficients ranged from 0.266 to 0.925 (Table 1), indicating that the TGs' expression levels were differentially affected by different environments. Furthermore, random errors have an obvious effect on the difference in TG expression between the two environments probably.
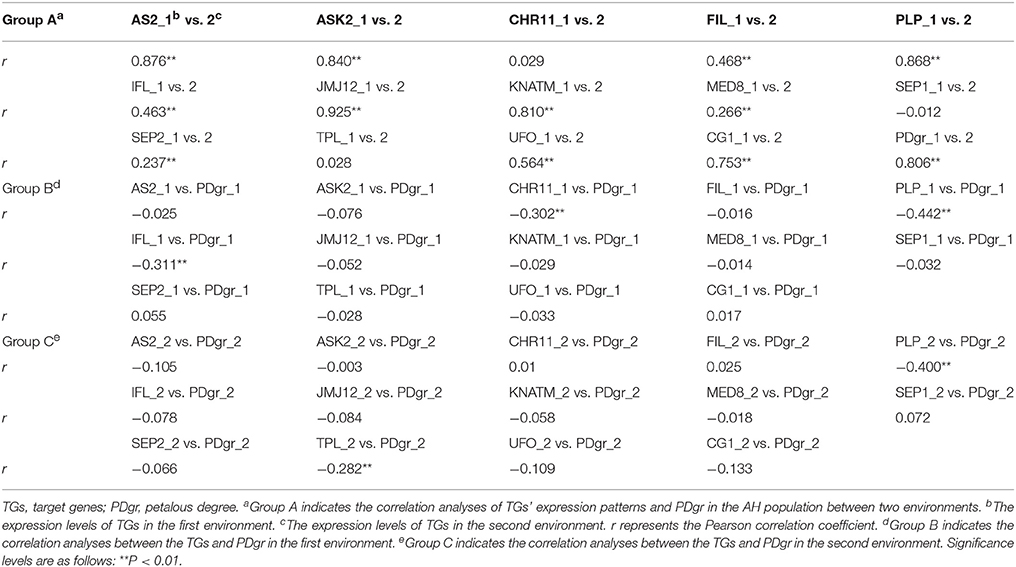
Table 1. Correlation analyses of both TGs and PDgr in the AH population.
The correlation analyses between TG expression levels and PDgr indicated that only three TGs, CHR11, PLP, and INTERFASCICULAR FIBERLESS (IFL), were significantly and negatively correlated with PDgr in the first environment, while two (PLP and TPL) were significantly and negatively correlated to PDgr in the second environment (Table 1). Noticeably, based only on the correlation between TGs and PDgr, it is impossible to explain the molecular mechanism underlying the apetalous characteristic of rapeseed. In fact, the correlation analysis cannot determine the regulatory relationship between genotype and phenotype, because many genes usually participate in the regulation of phenotypic variation in an indirect manner.
QTT-Association Mapping for PDgr and TG Expression Levels
To study relationships between PDgr and the TGs, QTT-association analyses of both PDgr and TG expression levels in the AH population were performed in two environments.
In the first environment, QTT-association analysis of PDgr indicated that PLP was the only QTT (−LogP = 9.86, h2 = 18.62%) associated with PDgr that had an obvious and negative effect on PDgr. As shown in Table 2, the effect of PLP on PDgr was −6.88, meaning that PDgr will be decreased 6.88% when the expression level of PLP increases one unit in value. The transcript-association mapping of PLP expression levels showed that only CHR11 (−LogP = 9.08, h2 = 17.28%) was associated with PLP expression, and the effect was 46.77, meaning that the expression level of PLP would be up-regulated 46.77 units in value when that of CHR11 was up-regulated one unit in value (Table 2). Subsequently, the QTT analysis of CHR11 expression levels detected two tQTTs regulating CHR11 expression, PLP and JUMONJI DOMAIN-CONTAINING PROTEIN 12 (JMJ12) × SEP2, and the transcript epistasis loci JMJ12×SEP2 had a negative effect on CHR11 (Table 2). By analogy, QTT-association mapping for JMJ12, SYMMETRIC LEAVES 2 (AS2), MEDIATOR SUBUNIT 8 (MED8), CG1, ARABIDOPSIS SKP1 HOMOLOGUE 2 (ASK2), KNOX ARABIDOPSIS THALIANA MEINOX (KNATM), UNUSUAL FLORAL ORGANS (UFO), SEP2, FILAMENTOUS FLOWER (FIL), TPL, SEP1, and IFL expression levels suggested the existence of one to six tQTTs (Table 2, Table S5). In addition to FIL and SEP1, there was at least one major tQTT (h2 ≥ 10%) for each TG. Furthermore, there was always one stable tQTT (repeatedly detected in the two environments) for eight TGs except for CHR11, TPL, and SEP1, while there are two for CG1. Specifically, AS2 was a stable tQTT with a positive effect for JMJ12, and JMJ12 acted as the positive and stable tQTT regulating AS2, CG1, and UFO expression. UFO, as a stable tQTT, played a positive role in the regulation of CG1 and SEP2 expressions. KNATM served as a stable tQTT positively regulating ASK2 and IFL expressions. ASK2, as the stable tQTT, had positive effects on KNATM and FIL expression levels. In addition, there was at least one transcript epistasis loci for TG expression apart from PLP, CG1, FIL, SEP1, and IFL (Table S5).
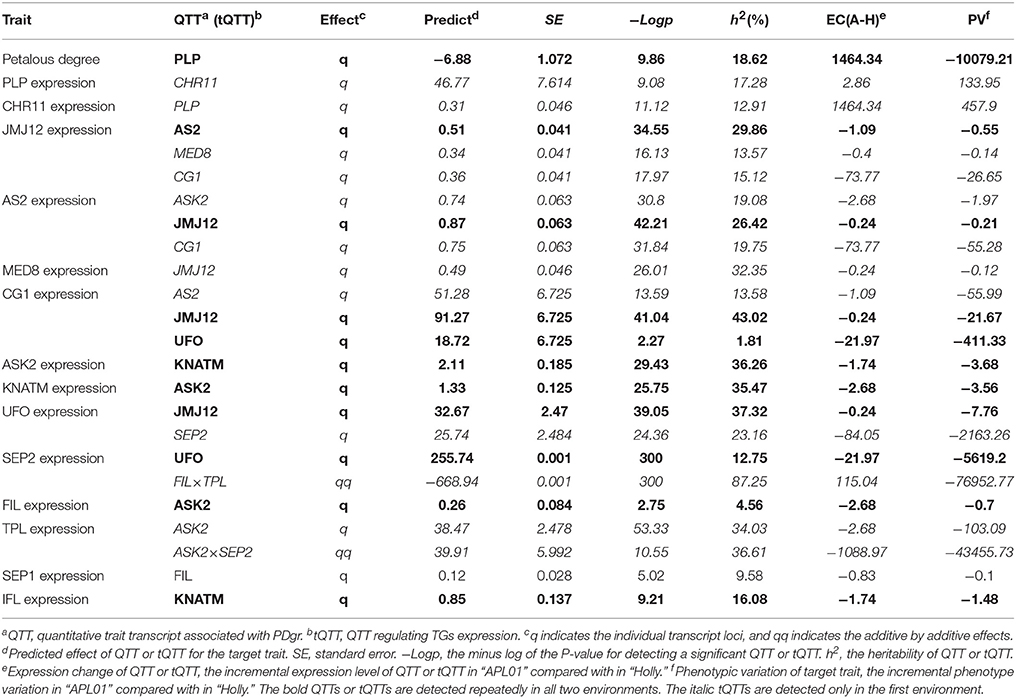
Table 2. The key QTTs and tQTTs for PDgr and TGs detected in the first environment.
In the second environment, QTT-association mapping for PDgr still showed that only PLP (−LogP = 7.79, h2 = 15.11%) was negatively associated with PDgr, and the effect was −6.13 (Table 3). However, the QTT analysis of PLP expression levels did not detect any tQTT associated with PLP, implying that genes other than the 14 TGs in the present study regulate PLP expression. In the same way, the QTT mapping of AS2, JMJ12, UFO, CG1, FIL, TPL, IFL, SEP2, ASK2, and KNATM expression levels suggested the existence of one to five tQTTs (Table 3, Table S6). Compared with the first environment, in addition to the 10 stable tQTTs, there was also at least one major tQTT (h2 ≥ 10%) that was only detected in the second environment for the six TGs, including PLP, JMJ12, UFO, CG1, TPL, and ASK2 (Table 3, Table S6). In particular, UFO was the major tQTT positively regulating JMJ12 expression. CG1, as a major tQTT, had a positive effect on UFO expression. The major transcript epistasis loci, FIL×TPL and IFL×SEP2, played positive roles in the regulation of CG1 expression. For the two major tQTTs regulating TPL expression, IFL×SEP2 served as a positive regulator, while KNATM×SEP2 acted as a negative regulator. Another major tQTT (FIL×KNATM) for ASK2 showed a positive effect on the regulation of ASK2 expression. Furthermore, just like in the first environment, there was a universal transcript epistatic effect among most of TGs (Table 3, Table S6), suggesting that the epistatic effect between TGs was vital regulator of TG expression. In addition, QTT analyses of CHR11, SEP1, and MED8 did not detect any tQTT.
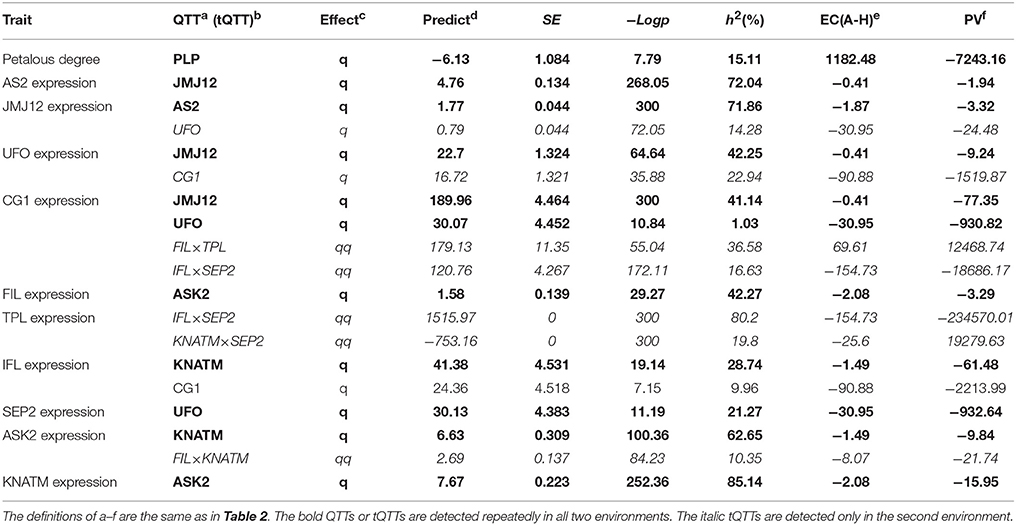
Table 3. The key QTTs and tQTTs for PDgr and TGs detected in the second environment.
Unconditional and Conditional eQTL Mapping of TGs
In addition to aforementioned tQTTs, the genomic region is another key factor influencing TG expression levels. In our previous work (Wang et al., 2015), the AH map, a high-density genetic linkage map of 2,027.53 cM with an average marker interval of 0.72 cM, has been constructed and used to identify QTLs for PDgr. An eQTL analysis for TGs was performed based on the AH map.
In the current study, unconditional eQTL linkage mapping of 14 TG expression levels in the first environment suggested the existence of one to three eQTLs (Figure 3, Table 4, Table S7), and uqCHR11C4-2, uqSEP1A5-1, and uqSEP1A5-1 explained 11.17, 10.76, and 10.11%, respectively, of the estimated phenotypic variation, while the remaining eQTLs explain less than 10% (Table 4, Table S7). Further analyses of the eQTLs determined that uqJMJ12A3 (43.5–44.4 cM) shared the same single-nucleotide polymorphism marker (Bn-A03-p15435174, 44.42 cM) with uqMED8A3 (43.6–44.4 cM), and the two eQTLs were close to qPD.A3 (46.9–49.5 cM) for PDgr (Wang et al., 2015), and may be regarded as pleiotropic effects caused by the same locus. However, none of the unconditional eQTLs colocalized with the QTLs identified in the previous study for PDgr (Figure 3, Table S7). Furthermore, all of the unconditional eQTLs mapped to chromosomes different from the corresponding TGs, which means that these eQTLs are trans-acting factors based on the classification rules of eQTL (Kliebenstein, 2008; Sasayama et al., 2012). To evaluate the reliability of QTT analysis results in the first environment, a conditional eQTL analysis was carried out as described by Zhu (1995). Because there is almost one key tQTT (h2 ≥ 10% or repeatedly detected in the two environments) for each TG, their conditional expression levels for the key tQTT can be generated using the QGAstation software. Conditional eQTL mapping suggested that only four conditional eQTLs, cqIFLA8, cqKNATMA6, cqKNATMC2, and cqTPLC7, were obtained (Table 4), and they were different from the unconditional eQTLs (Figure 3). The result suggested that the four conditional eQTLs were suppressed by the corresponding conditional independent variables, ASK2, IFL, and ASK2×SEP2, under the unconditional situation. Furthermore, the four conditional eQTLs had negative effects on the corresponding TGs expression, which implied that ASK2, IFL, and ASK2×SEP2 could act as the positive regulator of IFL, KNATM, and TPL expression. Interestingly, the results were consistent with the results of QTT analyses. Thus, conditional eQTL analyses further confirm the validity of QTT-association mapping for TGs expression levels.
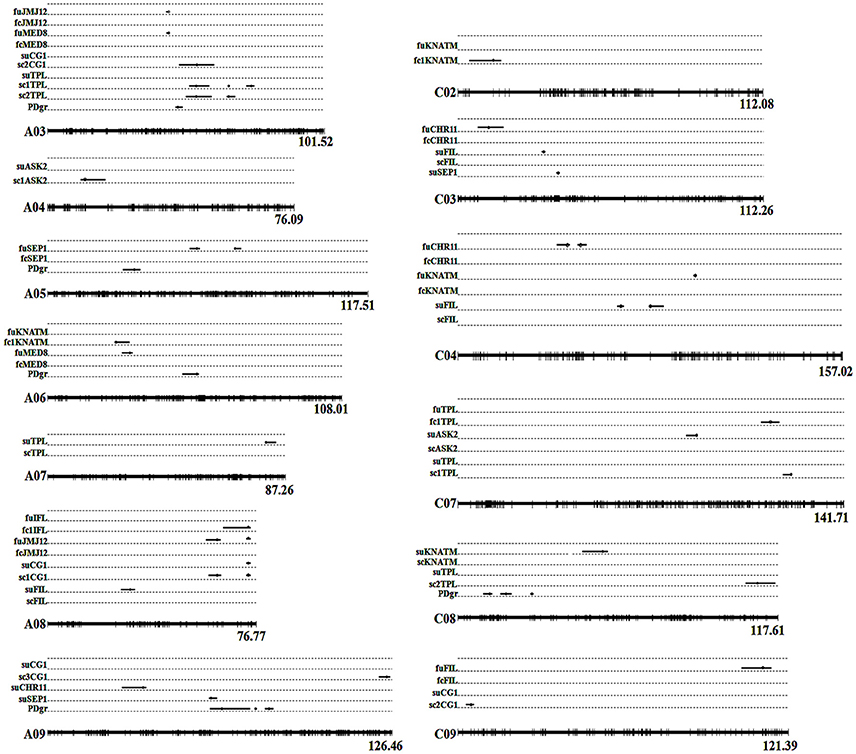
Figure 3. Alignments between unconditional and conditional eQTLs of TG expression levels in two environments. Whole linkage groups are represented by black lines labeled with molecular markers (short vertical bars) on the bottom. The Arabic numerals listed on the right side indicate the lengths of the linkage groups. The TGs' unconditional and conditional expression levels are listed on the left side. “fu” represents the TG's unconditional expression level, while “fc” represents the TG's conditional expression level in the first environment. “su” represents the TG's unconditional expression level, while “sc” represents the TG's conditional expression level in the second environment. The black lines on the linkage groups show the QTL confidence interval and the circles indicate the peak position. Detailed information of eQTLs is shown in Tables 4, 5. PDgr is the acronym of petalous degree. fcCHR11: CHR11|PLP, CHR11|MED8; fcFIL: FIL|ASK2, FIL|SEP1; fc1IFL: IFL|ASK2; fcKNATM: KNATM|ASK2, KNATM|IFL; fcJMJ12: JMJ12|AS2, JMJ12|MED8, JMJ12|CG1; fc1KNATM: KNATM|IFL; fcMED8: MED8|CHR11, MED8|JMJ12; fcSEP1: SEP1|FIL; fc1TPL: TPL|ASK2×SEP2. scASK2: ASK2|KANT, ASK2|FILxKNATM; sc1ASK2: ASK2|FIL×KNATM; scCG1: CG1|JMJ12, CG1|UFO, CG1|FIL×TPL, CG1|IFL×SEP2; sc1CG1: CG1|FIL×TPL; sc2CG1: CG1|IFL×SEP2; sc3CG1: CG1|UFO; scFIL: FIL|ASK2; scKNATM: KNATM|ASK2; scTPL: TPL|IFL×SEP2, TPL|KNATM×SEP2; sc1TPL: TPL|IFL×SEP2; sc2TPL: TPL|KNATM×SEP2.
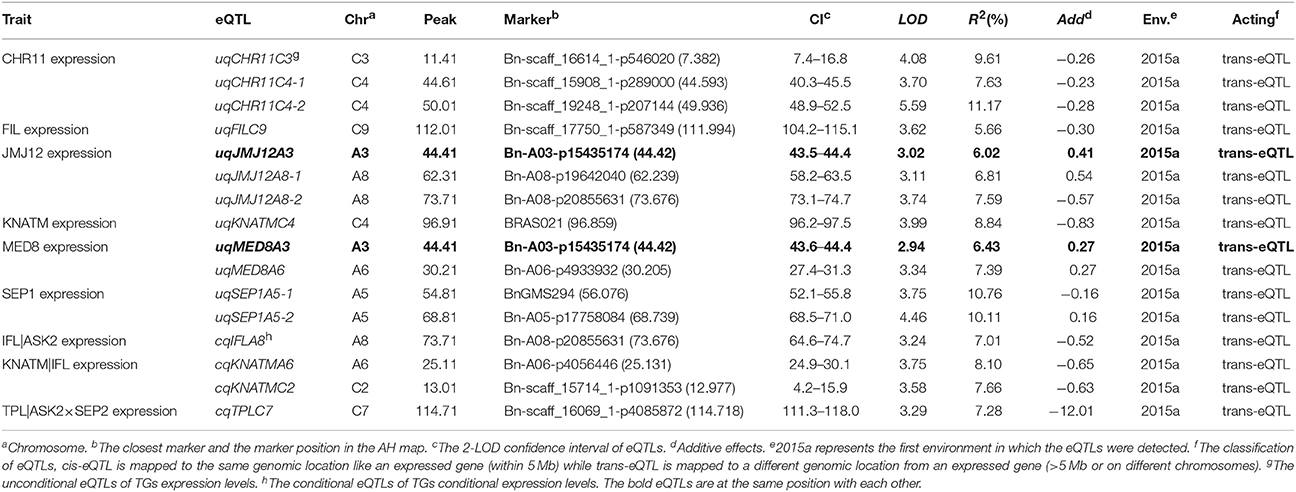
Table 4. The eQTLs for TGs unconditional and conditional expression levels in the first environment.
In the second environment, unconditional eQTL analyses of the 10 TGs showed that only 11 unconditional eQTLs for 7 TGs were detected (Figure 3, Table 5, and Table S8). All of the unconditional eQTLs were distinguishable from those detected in the first environment (Figure 3). Comparing to QTLs identified for PDgr in a previous study, the confidence interval of uqSEP1A9 (59.4–62.2 cM) overlapped that of qPD.A9-1 (59.66–74.36 cM) (Figure 3, Table S8), suggested that qPD.A9-1 participates in the petal development of line APL01 by regulating SEP1 expression. In the relationship between the unconditional eQTL and the corresponding TG, uqTPLA7 is a cis-acting factor (within 5 Mb), while the remaining 10 unconditional eQTLs are trans-acting factors (on different chromosomes). In addition, just as in the first environment, the conditional expression levels of the TGs were obtained using the key tQTTs. The conditional eQTL mapping of TGs showed that 13 conditional eQTLs for 6 TGs were obtained (Figure 3, Table 5). The conditional eQTL uqCG1A8 (73.1–74.7 cM) is the same as the unconditional eQTL cqCG1A8-2 (73.1–74.7 cM), while the remaining conditional eQTLs are novel compared with the unconditional eQTLs (Figure 3, Table 5). Over half conditional eQTLs had negative effects on the corresponding TGs, which was consistent with the QTT mapping results. More detailed information on the conditional eQTLs was provided in Table 5 and Table S8.
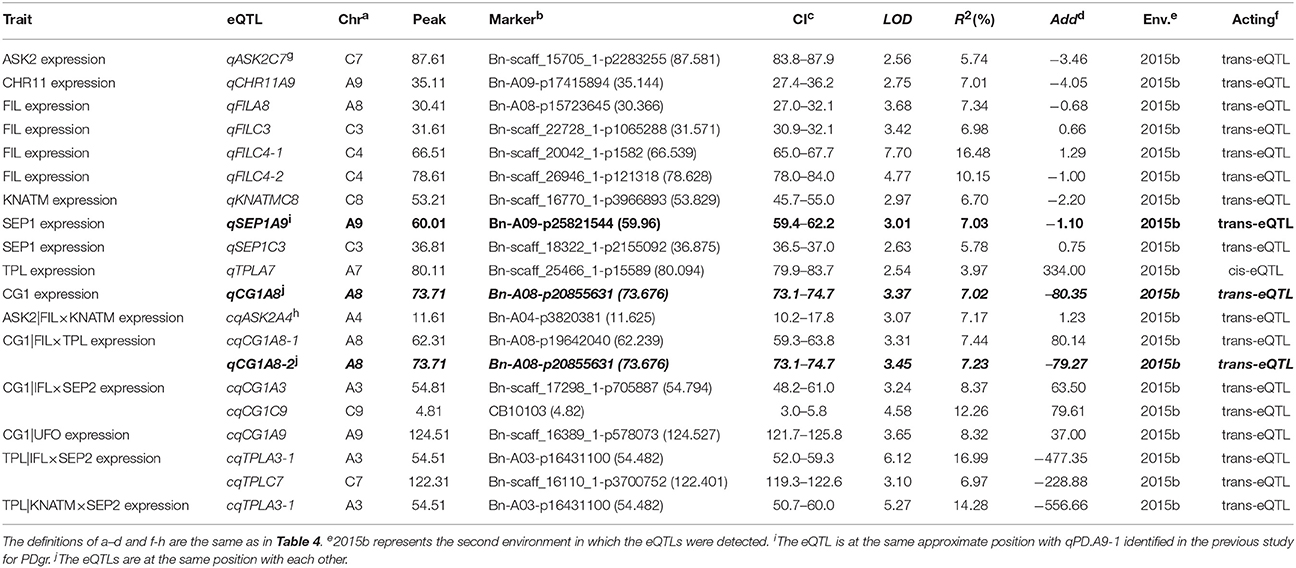
Table 5. The eQTLs for TGs unconditional and conditional expression levels in the second environment.
TGs Regulate Petal Development through CHR11-PLP Pathway
Based on the QTTs and unconditional eQTLs in this study, together with our previous works (Wang et al., 2015; Yu et al., 2016), a hypothetical regulatory network involved in petal development of “APL01” was constructed. As shown in Figure 4, the 14 petal regulators potentially regulate the petal development of “APL01” through the CHR11-PLP pathway. PLP acts as the terminal signal integrator negatively regulating petal development in the CHR11-PLP pathway. In addition, PLP expression level may be negatively regulated by AS2 in other manners as well.
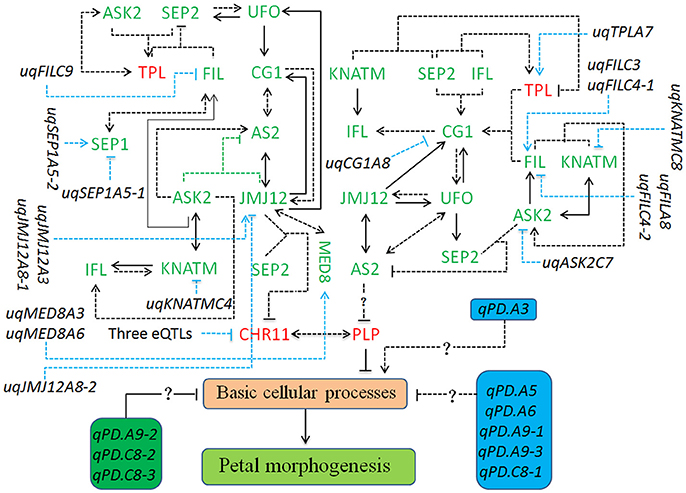
Figure 4. The regulatory network involved in the petal development of apetalous “APL01.” The regulatory network mainly consists of the CHR11-PLP pathway, 12 unconditional eQTLs of TGs, and nine QTLs for PDgr. The CHR11-PLP pathway contains 29 tQTTs and 12 unconditional eQTLs, representing 41 kinds of regulatory relationships. The three eQTLs negatively regulating CHR11 expression are uqCHR11C3, uqCHR11C4-1, and uqCHR11C4-2. Genes marked in red are up-regulated, while genes marked in green are down-regulated in “APL01” compared with those in “Holly.” Arrows represent the positive regulation of tQTTs for the downstream TGs, while blunted lines represent the negative regulation of tQTTs for the downstream TGs. Arrows or blunted solid lines marked indicate the regulatory relationships repeatedly detected in all two environments, while arrows or blunted dotted lines indicate the regulatory relationships only detected in one environment. In addition, there may be the AS2-PLP pathway regulating PLP expression, and this pathway consists of 21 tQTTs and 8 unconditional eQTLs, representing 29 kinds of regulatory relationships.
The CHR11-PLP pathway consists of 29 tQTTs and 12 unconditional eQTLs (Figure 4). PLP directly and negatively regulates petal development of line APL01 in the CHR11-PLP pathway. CHR11 acts as the main promoter of PLP expression, while CHR11 is positively regulated by PLP as well. The transcripts of the epistatic loci JMJ12×SEP2 are key negative regulator of CHR11. Three unconditional eQTLs with negative effects, uqCHR11C3, uqCHR11C4-1, and uqCHR11C4-2, also participate in the regulation of CHR11 expression. For the JMJ12 expression level, there are two positive closed regulatory circuits, in which JMJ12–CG1–AS2–JMJ12 is a bidirectional circuit while JMJ12–UFO–CG1–AS2–JMJ12 is a unidirectional circuit. Moreover, two unconditional eQTLs (uqJMJ12A3 and uqJMJ12A8-1) with positive effects and the repressive uqJMJ12A8-2 also participated in the regulation of JMJ12 expression. Additionally, JMJ12 positively regulates MED8. In the JMJ12–CG1–AS2–JMJ12 circuit, AS2 was also regulated by the promoter ASK2, and the transcript epistatic loci (ASK2×JMJ12) had a negative effect. In addition, ASK2 was positively regulated by ASK2–KNATM–IFL–ASK2, a unidirectional circuit. In the JMJ12–UFO–CG1–AS2–JMJ12 circuit, the UFO expression level was also regulated by the promoter SEP2, while SEP2 expression level was attributed to the integrated regulation of the promoter UFO and the transcripts of the epistatic loci (FIL×TPL) had a negative effect. Furthermore, FIL was regulated by both activators (ASK2 and SEP1) and the repressive uqFILC9, while TPL was positively regulated by both the activator ASK2 and the transcript epistatic loci (ASK2×SEP2), which had a positive effect. Finally, the regulatory effects of the tQTTs and unconditional eQTLs were integrated into the expression level of PLP and then prevented the basic cellular processes responsible for petal morphogenesis by up-regulating PLP (Figure 4).
In addition to CHR11, PLP expression level may be also regulated by the suppressor AS2 (Figure 4). However, the regulation of PLP by AS2 probably requires gene other than the above 14 petal regulators. The AS2 expression level was attributed to the integrated regulation of multi-factors containing 21 tQTTs and 8 unconditional eQTLs (Figure 4).
Discussion
There are a large number of upstream regulators involved in petal development in Arabidopsis (Zik and Irish, 2003; Kaufmann et al., 2009, 2010; Wuest et al., 2012). In a previous study (Yu et al., 2016), 36 petal regulators and several candidate genes involved in the regulation of the apetalous trait in B. napus were identified. However, how these genes collaboratively regulate petal development in both Arabidopsis and B. napus is unclear. In this study, we determined that 14 TGs participate in the regulation of apetalous characteristic in “APL01” by analyzing the expression patterns of 37 petal regulators in “APL01,” “PL01,” and “Holly.” The same slopes of the standard curvesof 14 TGs and the endogenous reference gene ACTIN indicated the same amplification efficiency. Thus, the use of qRT-PCR in the AH population is dependable (Yin et al., 2010).
From the Pearson correlation coefficients, the similarity level of PDgr in the AH population is high between the two environments (r = 0.806) but not completely the same, which can probably be ascribed to unknown environmental effects (Wang et al., 2015). The similarities of the TG expression patterns in the AH population are poor between the two environments (r < 0.8), except for five TGs, which congruously explains the variation in PDgr between the two environments. The correlation analyses between the 14 TGs and PDgr determined that only a few TGs were significantly correlated (P < 0.05) with PDgr in the two environments, implying that only a few genes were directly related to petal development. In fact, several previous researches have suggested that many transcriptional regulators indirectly regulate petal development in one way or another (Zik and Irish, 2003; Kaufmann et al., 2009, 2010; Wuest et al., 2012). However, a linear correlation analysis failed to discover the intricate relationships between genes and petal morphogenesis.
QTT-association mapping, based on a mixed linear model, is mainly used to analyze complex traits (Zhang et al., 2015). A QTT analysis of PDgr determined that PLP acts as the major negative QTT of PDgr in the two environments, indicating that PLP negatively regulates petal development in B. napus. In Arabidopsis, PLP encodes the alpha-subunit shared between protein farnesyltransferase and protein geranylgeranyltransferase-I (Running et al., 2004). plp mutant leads to dramatically enlarged meristems and increased floral organ number (Running et al., 2004). Based on the high degree of chromosomal colinearity between B. napus and Arabidopsis (Chalhoub et al., 2014), it is very likely that BnPLP plays the same role in regulating petal development as AtPLP. Except for PLP, the remaining TGs were not significantly associated with PDgr, suggesting that these TGs potentially participate in petal development of rapeseed by regulating PLP expression.
The QTT mapping of PLP expression levels showed that CHR11 was positively associated with PLP in the first environment, indicating that CHR11 acts as a positive regulator of PLP expression. However, we can not detect the effect of CHR11 on PLP in the second environment, implying that CHR11 regulates PLP expression in an environment dependent way. Previous reports suggested that CHR11 encoded a SWI2/SNF2 chromatin remodeling protein belonging to the ISWI family that was involved in the epigenetic regulation of eukaryotic genes (Li et al., 2012, 2015). In the second environment, the effect of CHR11 on PLP may be too weak to detect by QTT-association mapping because of some unqualified environmental conditions. By analogy, QTT mapping for the remaining TGs detected 38 tQTTs, associated with 13 TGs, and 31 tQTTs, associated with 10 TGs in the first and second environment, respectively. A total of 10 tQTTs can be repeatedly detected in the two environments, implying that these regulatory relationships may occur in vivo, as well as being required for petal development in B. napus. In addition, the detection of some tQTTs in one environment might be the result of the different expression patterns of TGs between two environments. Meanwhile, these tQTTs may act as the decisive factors that give rise to variable PDgr between the two environments because gene expression' diversity is a vital mechanism underlying phenotypic diversity among individuals (Yin et al., 2010). Thus, the different tQTTs between the two environments are also required for petal development.
For the molecular functions of QTT or tQTT, PLP, CHR11, and FIL×TPL, respectively, acted as a repressor of PDgr, an activator of PLP, and a repressor of SEP2 in the first environment, which echoes previous studies in Arabidopsis that suggested that PLP (Running et al., 2004), CHR11 (Li et al., 2012) and TPL (Krogan et al., 2012) acted as repressors regulating petal development. There are mostly positive regulatory relationships between the remaining 10 TGs in the first environment, which supports our recent inference that the 10 TGs play positive roles in petal development in B. napus (Yu et al., 2016). In the second environment, the regulatory signals of the tQTTs are finally integrated into the expression level of AS2 and may have then negatively regulated PLP expression by regulating some intermediate regulators (Figure 4); however, we cannot detect the negative effect of AS2 on PLP because only a limited number of genes are included in the present study. Although the regulatory relationships among TGs presented in this study need to be verified through more molecular experiments, these relationships are logically possible. For example, UFO, as an essential component of the SCF complex that is a key ubiquitin E3 ligase (Skowyra et al., 1997), is involved in both floral meristem and floral organ development in Arabidopsis (Levin and Meyerowitz, 1995). In this study, UFO probably regulates the expression of SEP2, CG1, and JMJ12 in a LEAFY-dependent manner, just like it regulates AP3 transcription in Arabidopsis (Chae et al., 2008). Moreover, CG1 as a candidate gene in the CI of qPD.C8-2 regulating the apetalous trait in line APL01 functions upstream of the CHR11-PLP pathway, implying that qPD.C8-2 potentially regulates the petal development of line APL01 through the CHR11-PLP pathway.
Unconditional eQTL mapping of TG expression levels in the AH population determined that only a few unconditional eQTLs were obtained for the TGs in two environments, and that all of the unconditional eQTLs were minor QTLs (R2 < 20%) (Shi et al., 2009). Thus, the strength of TG expression levels was mainly ascribed to effects of tQTTs. Based on the description for trans-eQTLs (Kliebenstein, 2008; Sasayama et al., 2012), all of the unconditional eQTLs presently identified are trans-eQTL, except for uqTPLA7, which indicates that most of the unconditional eQTLs act as transcription factors or transcriptional coactivators of the corresponding TGs. uqSEP1A9, a trans-eQTL identified in the second environment, overlapped a QTL (qPD.A9-1) for PDgr (Wang et al., 2015), indicating that the PDgr and SEP1 expression were causally related (Thumma et al., 2001) and that the qPD.A9-1 potentially participated in the regulation of PDgr by regulating SEP1 expression. Furthermore, the colocalization of TG expression levels may reflect the pleiotropism of a genomic region (QTL), such as JMJ12 and MED8 in the first assay.
In addition, conditional eQTL mapping of TGs determined that the unconditional eQTLs were lost, except for uqCG1A8 (cqCG1A8-2), in the two environments, implying that the effects of those unconditional eQTLs were completely attributed to the upstream tQTTs regarded as the conditional independent variables (Zhu, 1995). In other words, the effects of those unconditional eQTLs were passed from tQTTs to the corresponding downstream TGs, indicating that there is a relationship between the tQTT and the corresponding downstream TG, indirectly verifying the likelihood of tQTTs regulating TGs' expression levels (Zhu, 1995). Compared with the unconditional eQTLs, almost all of the conditional eQTLs are novel, indicating that these conditional eQTLs are generally suppressed by the corresponding upstream tQTTs under an unconditional situation (Zhu, 1995). That is, the upstream tQTTs participate in the positive regulation of TG expression by repressing the corresponding conditional eQTLs (Zhu, 1995). Thus, the conditional eQTLs should have negative effects on the TGs' expression, which is consistent with the results of conditional eQTL mapping in this study. Unconditional eQTL coupled with conditional QTL mapping indirectly verifies that the tQTTs detected in this study are valid.
The relationships among TGs and PDgr are presented in Figure 4. The apetalous characteristic of “APL01” is not only attributed to the regulators identified in this study, but it is possible that the aforementioned TGs participate in the petal development of “APL01” in the manner described in Figure 4. Although these regulatory relationships need to be further verified, our findings provided a basis for solving the puzzle of petal development in B. napus.
Author Contributions
KY and XW co-wrote the first draft of the manuscript. JZ and RG designed the project, acquired funding, and finalized the manuscript. KY and SC collected the young inflorescences of the AH population. KY and XW performed the qRT-PCR assays. QP and FC performed total RNA exaction. HL and WZ performed the first strand cDNA synthesis. SF and MH collected and processed the data used in this study. WL and PC assisted and analyzed the data. All authors have reviewed and approved the final version of the manuscript and therefore are equally responsible for the integrity and accuracy of its content.
Conflict of Interest Statement
The authors declare that the research was conducted in the absence of any commercial or financial relationships that could be construed as a potential conflict of interest.
Acknowledgments
The work was supported by National Key Research and Development Program of China (2016YFD0100202), National Natural Science Foundation of China (31371660, 31601334), the Industry Technology System of Rapeseed in China (CARS-12), Natural Science Foundation of Jiangsu Province (BK20160578), Jiangsu Agriculture Science and Technology Innovation Fund (CX(14)5011), and Jiangsu Collaborative Innovation Center for Modern Crop Production.
Supplementary Material
The Supplementary Material for this article can be found online at: https://www.frontiersin.org/articles/10.3389/fpls.2018.00089/full#supplementary-material
Figure S1. The scatter plot diagram of the normalized expression levels of TGs across the AH population in two environments.
Table S1. List of the primers used for qRT-PCR assays in this study.
Table S2. The expression patterns of 37 petal regulators in RNA-seq and qRT-PCR assays.
Table S3. The regression formulas of 14 TGs' amplification reactions in the standard cDNA.
Table S4. Correlation analysis between two biological replicates of TG expression within an environment.
Table S5. Highly significant QTTs and tQTTs for PDgr and TGs detected in the first environment.
Table S6. Highly significant QTTs and tQTTs for PDgr and TGs detected in the second environment.
Table S7. Comparison between QTLs for PDgr and eQTLs for TGs unconditional and conditional expression levels in the first environment.
Table S8. Comparison between QTLs for PDgr and eQTLs for TGs unconditional and conditional expression levels in the second environment.
References
Battle, A., and Montgomery, S. B. (2014). Determining causality and consequence of expression quantitative trait loci. Hum. Genet. 133, 727–735. doi: 10.1007/s00439-014-1446-0
Bowman, J. L., Smyth, D. R., and Meyerowitz, E. M. (1991). Genetic interactions among floral homeotic genes of Arabidopsis. Development 112, 1–20.
Chae, E., Tan, Q. K., Hill, T. A., and Irish, V. F. (2008). An Arabidopsis F-box protein acts as a transcriptional co-factor to regulate floral development. Development 135, 1235–1245. doi: 10.1242/dev.015842
Chalhoub, B., Denoeud, F., Liu, S., Parkin, I. A., Tang, H., Wang, X., et al. (2014). Early allopolyploid evolution in the post-Neolithic Brassica napus oilseed genome. Science 345, 950–953. doi: 10.1126/science.1253435
Chapman, J. F., Daniels, R. W., and Scarisbrick, D. H. (1984). Field studies on 14C assimilate fixation and movement in oil-seed rape (B. napus). J. Agric. Sci. 102, 23–31.
Chen, G., Zhang, F., Xue, W., Wu, R., Xu, H., Wang, K., et al. (2016). An association study revealed substantial effects of dominance, epistasis and substance dependence co-morbidity on alcohol dependence symptom count. Addict. Biol. 22, 1475–1485. doi: 10.1111/adb.12402
Cheung, V. G., Conlin, L. K., Weber, T. M., Arcaro, M., Jen, K., Morley, M., et al. (2003). Natural variation in human gene expression assessed in lymphoblastoid cells. Nat. Genet. 33, 422–425. doi: 10.1038/ng1094
Churchill, G. A., and Doerge, R. W. (1994). Empirical threshold values for quantitative trait mapping. Genetics 138, 963–971.
Cui, F., Li, J., Ding, A., Zhao, C., Wang, L., Wang, X., et al. (2011). Conditional QTL mapping for plant height with respect to the length of the spike and internode in two mapping populations of wheat. Theor. Appl. Genet. 122, 1517–1536. doi: 10.1007/s00122-011-1551-6
Damerval, C., and Becker, A. (2017). Genetics of flower development in Ranunculales–a new, basal eudicot model order for studying flower evolution. New Phytol. 216, 361–366. doi: 10.1111/nph.14401
de Martino, G., Pan, I., Emmanuel, E., Levy, A., and Irish, V. F. (2006). Functional analyses of two tomato APETALA3 genes demonstrate diversification in their roles in regulating floral development. Plant Cell 18, 1833–1845. doi: 10.1105/tpc.106.042978
DeCook, R., Lall, S., Nettleton, D., and Howell, S. H. (2005). Genetic regulation of gene expression during shoot development in Arabidopsis. Genetics 172, 1155–1164. doi: 10.1534/genetics.105.042275
Ditta, G., Pinyopich, A., Robles, P., Pelaz, S., and Yanofsky, M. F. (2004). The SEP4 gene of Arabidopsis thaliana functions in floral organ and meristem identity. Curr. Biol. 14, 1935–1940. doi: 10.1016/j.cub.2004.10.028
Drea, S., Hileman, L. C., de Martino, G., and Irish, V. F. (2007). Functional analyses of genetic pathways controlling petal specification in poppy. Development 134, 4157–4166. doi: 10.1242/dev.013136
Fray, M. J., Puangsomlee, P., and Goodrich, J. (1997). The genetics of stamenoid petal production in oilseed rape (Brassica napus) and equivalent variation in Arabidopsis thaliana. Theor. Appl. Genet. 94, 731–736.
Ghazalpour, A., Doss, S., Zhang, B., Wang, S., Plaisier, C., Castellanos, R., et al. (2006). Integrating genetic and network analysis to characterize genes related to mouse weight. PLoS Genet. 2:e130. doi: 10.1371/1journal.pgen.0020130
Göring, H. H., Curran, J. E., Johnson, M. P., Dyer, T. D., Charlesworth, J., Cole, S. A., et al. (2007). Discovery of expression QTLs using large-scale transcriptional profiling in human lymphocytes. Nat. Genet. 39, 1208–1216. doi: 10.1038/ng2119
Hileman, L. C., and Irish, V. F. (2009). More is better: the uses of developmental genetic data to reconstruct perianth evolution. Am. J. Bot. 96, 83–95. doi: 10.3732/ajb.0800066
Hirano, H. Y., Tanaka, W., and Toriba, T. (2014). “Grass flower development,” in Flower Development, eds J. L. Riechmann and F. Wellmer (New York, NY: Springer Science+Business Media), 57–84.
Jack, T. (2001). Relearning our ABCs: new twists on an old model. Trends Plant Sci. 6, 310–316. doi: 10.1016/S1360-1385(01)01987-2
Jamaux, D. I., and Spire, D. (1999). Comparison of responses of ascospores and mycelium by ELISA with anti-mycelium and anti-ascospore antisera for the development of a method to detect Sclerotinia sclerotiorum on petals of oilseed rape. Ann. Appl. Biol. 134, 171–179. doi: 10.1111/j.1744-7348.1999.tb05253.x
Jansen, R. C., and Nap, J. P. (2001). Genetical genomics: the added value from segregation. Trends Genet. 17, 388–391. doi: 10.1016/S0168-9525(01)02310-1
Jordan, M. C., Somers, D. J., and Banks, T. W. (2007). Identifying regions of the wheat genome controlling seed development by mapping expression quantitative trait loci. Plant Biotechnol. J. 5, 442–453. doi: 10.1111/j.1467-7652.2007.00253.x
Kaufmann, K., Muiño, J. M., Jauregui, R., Airoldi, C. A., Smaczniak, C., Krajewski, P., et al. (2009). Target genes of the MADS transcription factor SEPALLATA3: integration of developmental and hormonal pathways in the Arabidopsis flower. PLoS Biol. 7:e1000090. doi: 10.1371/journal.pbio.1000090
Kaufmann, K., Wellmer, F., Muiño, J. M., Ferrier, T., Wuest, S. E., Kumar, V., et al. (2010). Orchestration of floral initiation by APETALA1. Science 328, 85–89. doi: 10.1126/science.1185244
Kelly, A., Fray, M., Arthur, E. A., Lydiate, D. J., and Evans, E. J. (1995). “The genetic control of petalless flowers and upright pods,” in Proc. 9th Int. Rapeseed Congr. (Cambridge), 4–8.
Kim, S., Yoo, M. J., Albert, V. A., Farris, J. S., Soltis, P. S., and Soltis, D. E. (2004). Phylogeny and diversification of B-function MADS-box genes in angiosperms: evolutionary and functional implications of a 260-million-year-old duplication. Am. J. Bot. 12, 2102–2018. doi: 10.3732/ajb.91.12.2102
Kliebenstein, D. (2008). Quantitative Genomics: analyzing intraspecific variation using global gene expression polymorphisms or eQTL. Annu. Rev. Plant Biol. 60, 93–114. doi: 10.1146/annurev.arplant.043008.092114
Kramer, E. M., Dorit, R. L., and Irish, V. F. (1998). Molecular evolution of genes controlling petal and stamen development: duplication and divergence within the APETALA3 and PISTILLATA MADS-Box gene lineages. Genetics 2, 765–783.
Kramer, E. M., Holappa, L., Gould, B., Jaramillo, M. A., Setnikov, D., and Santiago, P. M. (2007). Elaboration of B gene function to include the identity of novel floral organs in the lower eudicot Aquilegia. Plant Cell 19, 750–766. doi: 10.1105/tpc.107.050385
Krogan, N. T., Hogan, K., and Long, J. A. (2012). APETALA2 negatively regulates multiple floral organ identity genes in Arabidopsis by recruiting the co-repressor TOPLESS and the histone deacetylase HDA19. Development 139, 4180–4190. doi: 10.1242/dev.085407
Lamb, R. S., and Irish, V. F. (2003). Functional divergence within the APETALA3/PISTILLATA floral homeotic gene lineages. Proc. Natl. Acad. Sci. U.S.A. 100, 6558–6563. doi: 10.1073/pnas.0631708100
Levin, J. Z., and Meyerowitz, E. M. (1995). UFO: an Arabidopsis gene lnvolved in both floral meristem and floral organ development. Plant Cell 7, 529–548.
Li, C., Chen, C., Gao, L., Yang, S., Nguyen, V., Shi, X., et al. (2015). The Arabidopsis SWI2/SNF2 chromatin remodeler BRAHMA regulates polycomb function during vegetative development and directly activates the flowering repressor gene SVP. PLoS Genet. 11:e1004944. doi: 10.1371/journal.pgen.1004944
Li, G., Zhang, J., Li, J., Yang, Z., Huang, H., and Xu, L. (2012). ISWI chromatin remodeling factors and their interacting RINGLET proteins act together in controlling the plant vegetative phase in Arabidopsis. Plant J. 72, 261–270. doi: 10.1111/j.1365-313X.2012.05074.x
Li, H., Liang, W., Yin, C., Zhu, L., and Zhang, D. (2011). Genetic interaction of OsMADS3, DROOPING LEAF, and OsMADS13 in specifying rice floral organ identities and meristem determinacy. Plant Physiol. 156, 263–274. doi: 10.1104/pp.111.172080
Li, Y., Alvarez, O. A., Gutteling, E. W., Tijsterman, M., Fu, J., Riksen, J. A., et al. (2006). Mapping determinants of gene expression plasticity by genetical genomics in C. elegans. PLoS Genet. 2:e222. doi: 10.1371/journal.pgen.0020222
Livak, K. J., and Schmittgen, T. D. (2001). Analysis of relative gene expression data using real-time quantitative PCR and the 2−ΔΔCT Method. Methods 25, 402–408. doi: 10.1006/meth.2001.1262
Mendham, N. J., and Rao, M. (1991). “The apetalous flower character as a component of a high yielding ideotype,” in Proceedings of the 8th International Rapeseed Congress. (Saskatoon, SK).
Morrall, C. (1996). Immunofluorescent staining of sclerotinia ascospores on canola petals. Can. J. Plant Pathol. 18, 237–241. doi: 10.1080/07060669609500618
Pelaz, S., Ditta, G. S., and Baumann, E. (2000). B and C floral organ identity functions require SEPALLATA MADS-box genes. Nature 6783, 200–203. doi: 10.1038/35012103
Polowick, P. L., and Sawhney, V. K. (1986). A scanning electron microscopic study on the initiation and development of floral organs of Brassica napus (Cv. Westar). Am. J. Bot. 2, 254–263. doi: 10.2307/2444180
Rao, M. S. S., Mendham, N. J., and Buzza, G. C. (1991). Effect of the apetalous flower characteristic on radiation distribution in the crop canopy, yield and its components in oilseed rape (Brassica napus L.). J. Agric. Sci. 117, 189–196.
Rijpkema, A. S., Royaert, S., and Zethof, J. (2006). Analysis of the Petunia TM6 MADS box gene reveals functional divergence within the DEF/AP3 lineage. Plant Cell 18, 1819–1832. doi: 10.1105/tpc.106.042937
Running, M. P., Lavy, M., Sternberg, H., Galichet, A., Gruissem, W., Hake, S., et al. (2004). Enlarged meristems and delayed growth in plp mutants result from lack of CaaX prenyltransferases. Proc. Natl. Acad. Sci. U.S.A. 101, 7815–7820. doi: 10.1073/pnas.0402385101
Sasayama, D., Hori, H., Nakamura, S., Miyata, R., Teraishi, T., Hattori, K., et al. (2012). Identification of single nucleotide polymorphisms regulating peripheral blood mRNA expression with Genome-Wide Significance: an eQTL study in the Japanese population. PLoS ONE 8:e54967. doi: 10.1371/journal.pone.0054967
Schwarz-Sommer, Z., Huijser, P., and Nacken, W. (1990). Genetic control of flower development by homeotic genes in Antirrhinum majus. Science 4983, 931–936. doi: 10.1126/science.250.4983.931
Shi, J., Li, R., Qiu, D., Jiang, C., Long, Y., Morgan, C., et al. (2009). Unraveling the complex trait of crop yield with quantitative trait loci mapping in Brassica napus. Genetics 182, 851–861. doi: 10.1534/genetics.109.101642
Skowyra, D., Craig, K. L., Tyers, M., Elledge, S. J., and Harper, J. W. (1997). F-box proteins are receptors that recruit phosphorylated substrates to the SCF ubiquitin-ligase complex. Cell 91, 209–219. doi: 10.1016/S0092-8674(00)80403-1
Smaczniak, C., Immink, R. G. H., Muiño, J. M., Blanvillain, R., Busscher, M., Busscher-Lange, J., et al. (2012). Characterization of MADS-domain transcription factor complexes in Arabidopsis flower development. Proc. Natl. Acad. Sci. U.S.A. 109, 1560–1565. doi: 10.1073/pnas.1112871109
Smyth, D. R., Bowman, J. L., and Meyerowitz, E. M. (1990). Early flower development in Arabidopsis. Plant Cell 2, 755–767.
Sun, W., Bennett, V. C., Eggins, S. M., Kamenetsky, V. S., and Arculus, R. J. (2003). Enhanced mantle-to-crust rhenium transfer in undegassed arc magmas. Nature 422, 294–297. doi: 10.1038/nature01482
Theissen, G., and Saedler, H. (2001). Plant biology. Floral quartets. Nature 6819, 469–471. doi: 10.1038/35054172
Thumma, B. R., Naidu, B. P., Chandra, A., Cameron, D. F., Bahnisch, L. M., and Liu, C. (2001). Identification of causal relationships among traits related to drought resistance in Stylosanthes scabra using QTL analysis. J. Exp. Bot. 52, 203–214. doi: 10.1093/jexbot/52.355.203
van der Krol, A. R., and Chua, N. (1993). Flower development in Petunia. Plant Cell 5, 1195–1203. doi: 10.1105/tpc.5.10.1195
Vandenbussche, M., Zethof, J., Royaert, S., Weterings, K., and Gerats, T. (2004). The duplicated B-class heterodimer model: whorl-specific effects and complex genetic interactions in Petunia hybrida flower development. Plant Cell 16, 741–754. doi: 10.1105/tpc.019166
Wang, S., Basten, C. J., and Zeng, Z. B. (2007). Windows QTL Cartographer 2.5. Department of Statistics, North Carolina State University, Raleigh, NC.
Wang, X., Yu, K., Li, H., Peng, Q., Chen, F., Zhang, W., et al. (2015). High-density SNP map construction and QTL identification for the apetalous character in Brassica napus L. Front. Plant Sci. 6:1164. doi: 10.3389/fpls.2015.01164
Wang, Y., Han, Y., Teng, W., Zhao, X., Li, Y., Wu, L., et al. (2014). Expression quantitative trait loci infer the regulation of isoflavone accumulation in soybean (Glycine max L. Merr.) seed. BMC Genomics 15:680. doi: 10.1186/1471-2164-15-680
Wuest, S. E., O'Maoileidigh, D. S., Rae, L., Kwasniewska, K., Raganelli, A., Hanczaryk, K., et al. (2012). Molecular basis for the specification of floral organs by APETALA3 and PISTILLATA. Proc. Natl. Acad. Sci. U.S.A. 109, 13452–13457. doi: 10.1073/pnas.1207075109
Yates, D. J., and Steven, M. D. (1987). Reflexion and absorption of solar radiation by flowering canopies of oil-seed rape (Brassica napus L.). J. Agric. Sci. 109, 495–502.
Yin, Z., Meng, F., Song, H., Wang, X., Xu, X., and Yu, D. (2010). Expression quantitative trait loci analysis of two genes encoding rubisco activase in soybean. Plant Physiol. 153, 1625–1637. doi: 10.1104/pp.109.148312
Yu, K., Wang, X., Chen, F., Chen, S., Peng, Q., Li, H., et al. (2016). Genome-wide transcriptomic analysis uncovers the molecular basis underlying early flowering and apetalous characteristic in Brassica napus L. Sci. Rep. 6:30576. doi: 10.1038/srep30576
Zhang, F. T., Zhu, Z. H., Tong, X. R., Zhu, Z. X., Qi, T., and Zhu, J. (2015). Mixed linear model approaches of association mapping for complex traits based on omics variants. Sci. Rep. 5:0298. doi: 10.1038/srep10298
Zhang, Y., Wang, X., Zhang, W., Yu, F., Tian, J., Li, D., et al. (2011). Functional analysis of the two Brassica AP3 genes involved in apetalous and stamen carpelloid phenotypes. PLoS ONE 6:e20930. doi: 10.1371/journal.pone.0020930
Zhang, Z., Liu, Z., Cui, Z., Hu, Y., Wang, B., and Tang, J. (2013). Genetic analysis of grain filling rate using conditional QTL mapping in maize. PLoS ONE 8:e56344. doi: 10.1371/journal.pone.0056344
Zhao, J., Becker, H. C., Zhang, D., Zhang, Y., and Ecke, W. (2006). Conditional QTL mapping of oil content in rapeseed with respect to protein content and traits related to plant development and grain yield. Theor. Appl. Genet. 113, 33–38. doi: 10.1007/s00122-006-0267-5
Zhou, L., Liu, S., Wu, W., Chen, D., Zhan, X., Zhu, A., et al. (2016). Dissection of genetic architecture of rice plant height and heading date by multiple-strategy-based association studies. Sci. Rep. 6:29718. doi: 10.1038/srep29718
Zhu, J. (1995). Analysis of conditional genetic effects and variance components in developmental genetics. Genetics 141, 1633–1639.
Keywords: Brassica napus L., apetalous, quantitative trait transcript, expression QTL, regulatory network
Citation: Yu K, Wang X, Chen F, Peng Q, Chen S, Li H, Zhang W, Fu S, Hu M, Long W, Chu P, Guan R and Zhang J (2018) Quantitative Trait Transcripts Mapping Coupled with Expression Quantitative Trait Loci Mapping Reveal the Molecular Network Regulating the Apetalous Characteristic in Brassica napus L. Front. Plant Sci. 9:89. doi: 10.3389/fpls.2018.00089
Received: 03 November 2017; Accepted: 16 January 2018;
Published: 01 February 2018.
Edited by:
Shuizhang Fei, Iowa State University, United StatesReviewed by:
Xusheng Wang, St. Jude Children's Research Hospital, United StatesXin Li, AgReliant Genetics, LLC, United States
Reka Howard, University of Nebraska System, United States
Copyright © 2018 Yu, Wang, Chen, Peng, Chen, Li, Zhang, Fu, Hu, Long, Chu, Guan and Zhang. This is an open-access article distributed under the terms of the Creative Commons Attribution License (CC BY). The use, distribution or reproduction in other forums is permitted, provided the original author(s) and the copyright owner are credited and that the original publication in this journal is cited, in accordance with accepted academic practice. No use, distribution or reproduction is permitted which does not comply with these terms.
*Correspondence: Rongzhan Guan, guanrzh@njau.edu.cn
Jiefu Zhang, jiefu_z@163.com
†These authors have contributed equally to this work.