 Yanxia He1
 Fude Shang
- 1Plant Germplasm Resources and Genetic Laboratory, College of Life Sciences, Henan University, Kaifeng, China
- 2Institute of Pharmacy, Pharmaceutical College of Henan University, Kaifeng, China
- 3Woe Key Laboratory of Plant Stress Biology, Henan University, Kaifeng, China
Osmanthus fragrans is an ornamental plant of substantial commercial value, and no genetic linkage maps of this species have previously been reported. Specific-locus amplified fragment sequencing (SLAF-seq) is a recently developed technology that allows massive single nucleotide polymorphisms (SNPs) to be identified and high-resolution genotyping. In our current research, we generated the first genetic map of O. fragrans using SLAF-seq, which is composed with 206.92 M paired-end reads and 173,537 SLAF markers. Among total 90,715 polymorphic SLAF markers, 15,317 polymorphic SLAFs could be used for genetic map construction. The integrated map contained 14,189 high quality SLAFs that were grouped in 23 genetic linkage groups, with a total length of 2962.46 cM and an average distance of 0.21 cM between two adjacent markers. In addition, 23,664 SNPs were identified from the mapped markers. As far as we know, this is the first of the genetic map of O. fragrans. Our results are further demonstrate that SLAF-seq is a very effective method for developing markers and constructing high-density linkage maps. The SNP markers and the genetic map reported in this study should be valuable resource in future research.
Introduction
Sweet osmanthus (Osmanthus fragrans Lour. 2n = 46) is a woody, evergreen shrub or small tree species in the Oleaceae family. It is widely distributed and owns cultural significance in China, and was introduced into Europe in the late eighteenth century (Zang et al., 2003). The genus Osmanthus has been categorized into 27 species, 24 species of which are distributed in China, and including the most representative species of O. fragrans. A total of 166 cultivars have been identified since China acquired International Cultivar Registration Authority (ICRA) status for O. fragrans cultivars in 2004. O. fragrans cultivars are divided into four groups depending on their flowering season and corolla coloration. Cultivars of the Asiaticus Group, Albus Group and Luteus Group bloom only in autumn, while cultivars of the Aurantiacus Group can flower for several times in different seasons except summer (Xiang and Liu, 2007). The maintenance and reproduction of the cultivars are accomplished through cuttage.
Cultivated for a long time in China, O. fragrans is one of the important commercial flowers and a traditional horticultural plant. So it has been widely cultivated due to its unique fragrance, aesthetic and cultural values (Shang et al., 2003; Yuan et al., 2011). Products derived from this plant, such as food, tea, beverages, perfumes, and cosmetics, are widely appreciated (Wang et al., 2009; Wu et al., 2009; Baldermann et al., 2010). The medicinal value of O. fragrans has long been recognized in traditional Chinese medicine according to the Compendium of Materia Medica (Xiang and Liu, 2007). Therefore, this plant is very popular among people and has been extensively researched.
Genetic study in O. fragrans achieved great progress. As an androdioecious species (Hao et al., 2011; Xu et al., 2014), the pollination and breeding systems of O. fragrans cultivars is complex, with selfing and crossing coexisting in the populations (Li, 2014). The karyotype of this species was reported as 2n = 2x = 46 (Li et al., 2004). With the development of the next-generation sequencing technology (NGS), several housekeeping genes, carotenogenic genes implied in corolla coloration, and other genes associated with fragrance and pigment biosynthesis were identified based on transcriptome dataset (Mu et al., 2014, 2017; Zhang et al., 2016). However, it still remains unknown about the genetic and molecular mechanisms underlying diverse biological traits. So far, little has been reported on the segregation analysis of genes or the molecular markers in a cross-population. Therefore, a genetic linkage map has become a vital tool for identifying functional genes (Graham et al., 2010), facilitating genome analysis (Takehisa et al., 2012), and elucidating the genetic basis of a trait of interest (Ward et al., 2013). Up to now, many genetic linkage maps have been reported for some tree species, including Eucommia ulmoides (Wang et al., 2014), Betula platyphylla (Jiang et al., 2011), Eucalyptus sp. (Freeman et al., 2006), and Populus sp. (Cervera et al., 2001). However, no a genetic map of O. fragrans has been developed until now. The availability of molecular markers is prerequisite for constructing a high-density linkage map, and the lack of these is one of the main reasons that hinder the development of genetic maps in many species.
Great efforts have been made on revealing genetic diversity of O. fragrans through using different molecular markers. High levels of genetic diversity among O. fragrans cultivars were detected by AFLP and RAPD markers (Shang et al., 2004; Yuan et al., 2011). And a similar result was demonstrated in the 139 individuals from natural populations by microsatellite (SSR) markers (Hu et al., 2014). However, the available information for these markers is insufficient to build the genetic map of O. fragrans. Single nucleotide polymorphism (SNP), a mainstream molecular marker, was identified as the most suitable for construction of a high-resolution genetic linkage map due to the abundance and ubiquity of SNPs in living organisms (Wang et al., 2009). The emergence of NGS technology makes it possible to quickly exploit large numbers of SNP in the genomic DNA. Specific-locus amplified fragment sequencing (SLAF-seq), an approach basing on NGS, was recently reported (Sun et al., 2013). This method can complete large-scale de novo SNP discovery and genotyping in a single process with a high-resolution strategy. Additionally, the use of an enhanced reduced representation library (RRL) sequencing technique enable greater specificity and accuracy of SLAF-seq compared to other NGS-based methods, such as complexity reduction of polymorphic sequences (CRoPS) (Van Orsouw et al., 2007), restriction site-associated DNA sequencing (RAD-seq) (Baird et al., 2008), and genotyping-by-sequencing (GBS) (Elshire et al., 2011). SLAF-seq has therefore become a preferred method for developing high-density genetic maps for species in the absence of a reference to genome sequences. Several high-density genetic maps have been successfully created using this method over the past 2 years, such as Agropyron cristatum (Zhang et al., 2015), Camellia sinensis (Ma et al., 2015), Prunus mume (Zhang et al., 2015), Paeonia sect. Moutan (Cai et al., 2015), and Juglans regia (Zhu et al., 2015).
The objective of this study is to construct the first genetic map for O. fragrans by the use of the SLAF-seq method. The framework genetic map is the initial step in understanding the genome organization of this important species, and a well-defined genetic map would further facilitate the cloning of trait related genes and QTL (quantitative trait locus) fine mapping of some important traits in O. fragrans.
Materials and Methods
Plant Material and Genomic DNA Extractions
Two cultivars, “Wan Yingui” (Albus Group) and “Huangchuan Jingui” (Luteus Group), were selected to be the hybrid parents. “Wan Yingui” is a 25 years old male cultivar. “Huangchuan Jingui” is a 20 years old hermaphrodite cultivar and was employed as female parent. So the bagging and emasculation are necessary in the process of artificial pollination. The parents showed obvious differences in gender, corolla color and leaf traits. The hybridization was performed at the Garden of Huangchuan Jingui (32°04′11.71″ N, 115°04′10.92″ E), Huangchuan County, Henan Province, in the fall of 2014, and the fruits were harvested in the spring of 2015. The seeds would usually take 1–2 years to germinate normally. To shorten this period, the hybrid seeds were subjected to in vitro embryo culturing according to Wangjun et al. (2005) at the Germplasm Resources and Genetic Engineering Laboratory of the College of Life Sciences, Henan University. They all became seedlings within 2 months. The leaves of 129 F1 progenies were collected during their subculturing phase and immediately frozen in liquid nitrogen. These and the leaves of the parent plants were utilized for genomic DNA extraction.
Genomic DNA samples were evaluated using 1% agarose gels and an ND-1000 spectrophotometer (Nano Drop, Wilmington, DE, USA) to ensure it suitable for SLAF-seq in terms of integrity and quality.
SLAF Library Construction and High-Throughput Sequencing
The SLAF library construction and high-throughput sequencing were conducted as the report of Sun et al. (2013) accompanied by a few modifications. The DNA samples of the 129 progenies and two parents were treated with RsaI, ATP, T4 DNA ligase, and Duplex Tag-labeled Sequencing adapters at 37°C. Then the digestion-ligation DNA was used for the subsequent polymerase chain reaction (PCR), together with the essential components of dNTP, Taq DNA polymerase, and primers. The products were then purified, pooled and separated via electrophoresis on 2% agarose gel. The fragments between 314 and 414 bps were extracted and sequenced using the Illumina HiSeq 2500 system (Illumina, Inc.; San Diego, CA, USA) at the Biomarker Technologies Corporation in Beijing.
SLAF-Seq Data Analysis and Genotyping
SLAF marker identification and genotyping were accomplished as following. Low-quality reads in each cycle (quality score <30; a quality score of 30 represents a 0.1% chance of error) were throw away by real-time monitoring during sequencing. Then, those with clear index information were mixed together in view of their sequence similarity, which can be ascertained by BLAT (Kent, 2002). The sequences with above 90% similarity would be grouped and identified as one SLAF marker (locus). The alleles of each SLAF were defined according to their parents, and individuals were genotyped by sequence similarity to their parents (Sun et al., 2013). The SLAFs in this study were classified into three types: Non-Polymorphic SLAF, Polymorphic SLAF, and Repetitive SLAF. As a diploid species, a SLAF can contain at most four genotype tags. Therefore, non-polymorphic SLAFs containing only one tag, together with repetitive SLAFs embracing more than four tags, were ruled out. Only a marker with two, three, or four tags was defined as a polymorphic SLAF and used for further analysis and specific molecular marker development. Polymorphic SLAFs were genotyped according to their population type, which followed eight segregation types (ab × cd, ef × eg, ab × cc, cc × ab, hk × hk, lm × ll, nn × np, and aa × bb). In this study, most Polymorphic SLAFs passed the final filter. Only those that contained <3 SNPs, had an average sequence depth of 10-fold or more in the parents and 2-fold or more in the progenies, and exhibited >70% integrity in mapping population individuals, were picked out for subsequent map construction. The aa × bb type markers, a full sub-type family where the parents are both homozygous, were filtered out.
Linkage Map Construction
In the process of genetic mapping, a chi-square test (χ2) was carried out to examine the Mendelian segregation ratio for each marker. Markers at the P < 0.05 significance level were initially excluded from the core linkage map and separately inserted as accessory markers at a later stage. Map construction was achieved according to the method of HighMap, which was detailed by Liu et al. (2014). Firstly, the markers with high qualities were grouped based on a pair-wise modified logarithm of odds (LOD) score for the recombination frequency. Secondly, those markers were ordered using gibbs sampling, spatial sampling, and a simulated annealing algorithm. At the same time, the map distance was estimated. Thirdly, the incorrect genotypes were recognized and eliminated through the k-nearest neighbor algorithm. The processes of marker ordering and error correcting were carried out iteratively so that the markers could be ordered correctly. Several cycles later, accurate linkage maps were achieved. The map function of Kosambi was used in the process. At last, heat maps and haplotype maps were used to evaluate the map quality.
Results
Analysis of SLAF-Seq Data and SLAF Markers
A total of 206.92 M paired-end reads were acquired from the high-throughput sequencing of the constructed SLAF library of both the parents and the 129 progenies. Among these reads, 93.23% of reads had quality scores >Q30, and the guanine cytosine (GC) content was 37.5% on average. Subsequently, 173,537 SLAF markers were derived from the high quality reads, of which 135,540 and 130,698, respectively, were exploited from the female and male parents. The read numbers for SLAFs were 5,575,444 in the female parent and 5,828,967 in the male parent, with the sequencing depth of each SLAF was 43.01- and 42.66-fold, respectively. In the 129 progenies, the reads numbers for the SLAFs varied from 556,112 to 1,592,274, and the development of SLAFs ranged from 100,910 to 122,711 with a marker depth of 5.27-fold on average for each individual (Figure 1). The raw sequence data has been deposited into NCBI SRA with project accession of PRJNA317048.
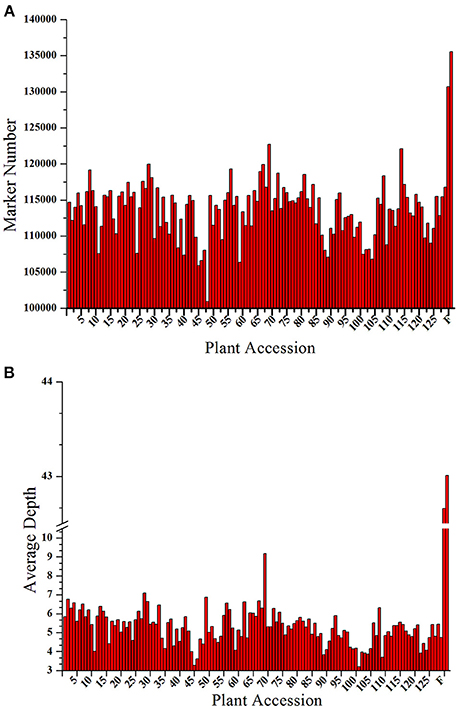
Figure 1. Number and depth of markers for each F1 individual and the two parents. The x-axes for both (A,B) indicate the plant accession. The designation consists of the 129 F1 progeny individuals followed by the female parent and the male parent; the y-axes show the number of markers in (A) and the marker depth in (B) for each sample.
In the 173,537 SLAFs, 52.27% markers were polymorphic, which were used for subsequent genetic genotyping (Table 1). The others, including repetitive SLAFs (0.35%) and non-polymorphism SLAFs (47.38%), were filtered out due to their location in the repeated sequence region or a lack of parent information. Out of all the polymorphic SLAFs, 71,395 markers were successfully genotyped in parents and resulted in eight segregation types according to the genotype encoding rule (Figure 2). The pseudo-testcross theory led to the removal of aa × bb and low-quality markers (the method for removing them is described in section SLAF-seq Data Analysis and Genotyping). This meant that 15,317 polymorphic SLAFs belonging to five segregation patterns (lm × ll, nn × np, hk × hk, ef × eg, and ab × cd) were left for developing the genetic linkage map.
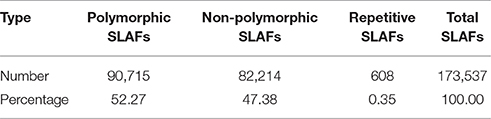
Table 1. SLAF mining results.
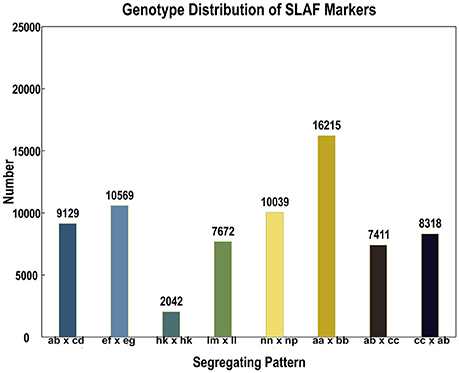
Figure 2. Number of markers in each of eight segregation patterns.
Construction of a High-Density Linkage Map
Among the 15,317 SLAFs available for the linkage map construction, 14,189 of these were distributed into 23 linkage groups (LGs) according to the modified LOD (MLOD) scores between markers and the linkage analysis. The percentage of SLAF markers available for mapping was about 92.64%, with 9,175 SLAFs available for the female map, 7,196 SLAFs for the male map, and 14,189 SLAFs for the final integrated map (Table 2, Figure 3). The average sequencing depths of the mapped markers were 70.33-fold in the female parent, 69.50-fold in the male parent, and 10.85-fold in the F1 individuals. The total genetic length of the genome was 2952.20 cM for the female map, 2872.91 cM for the male map, and 2962.46 cM for the integrated map. Meanwhile, the average distance between adjacent markers was 0.31, 0.40, and 0.21 cM in each map, respectively.
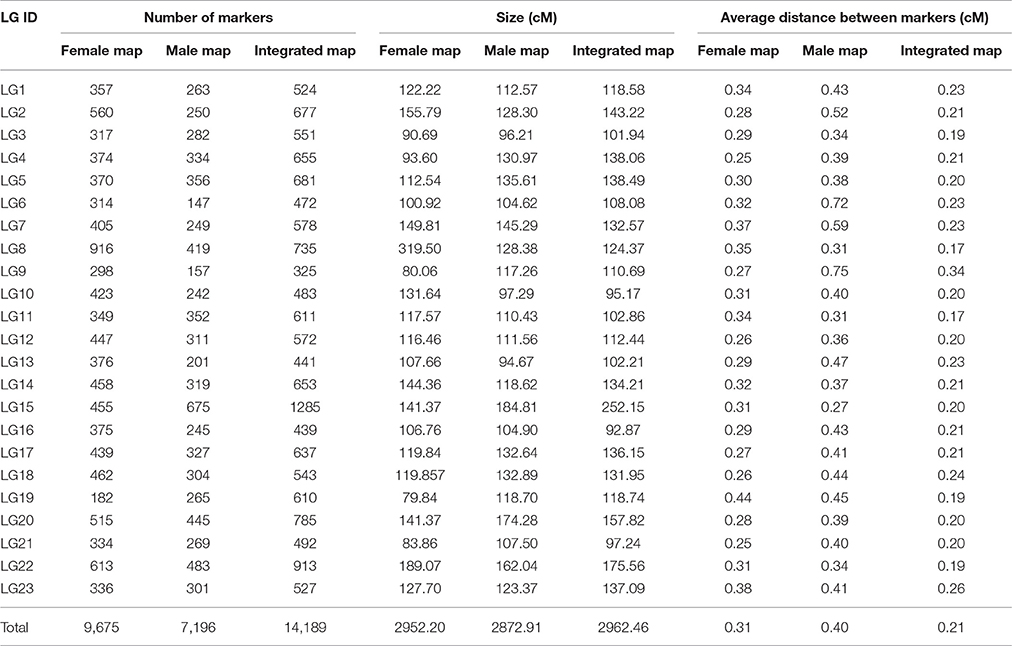
Table 2. Basic characteristics of the 23 linkage groups.
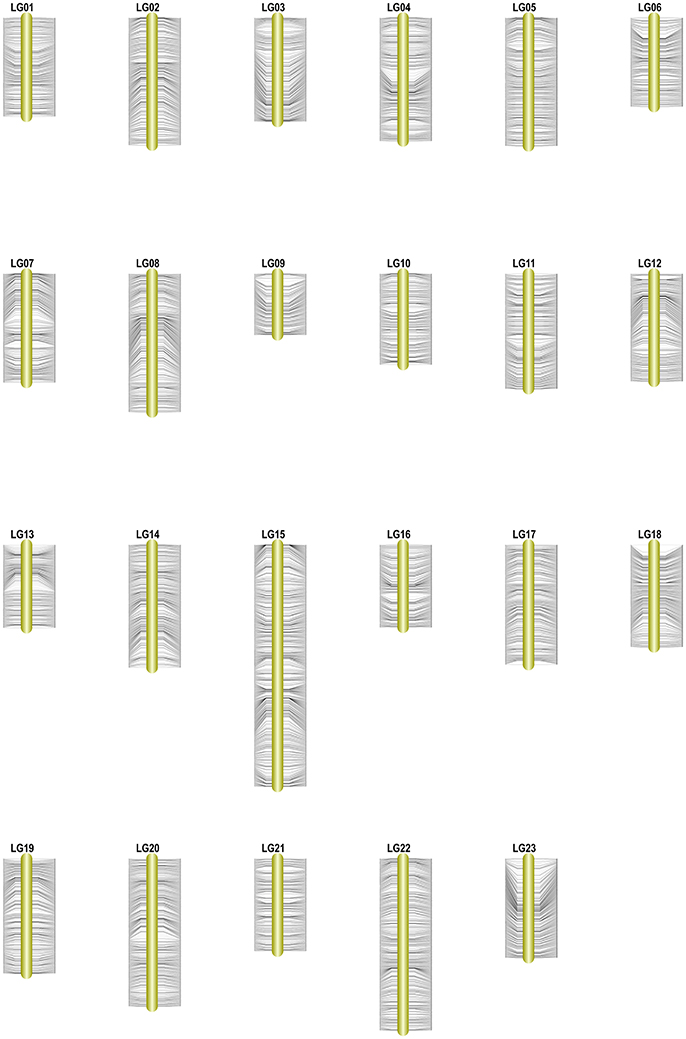
Figure 3. High-density genetic map of Osmanthus fragrans. The SLAF markers and their locations are shown on the right and left side, respectively.
Table 2 and Figure 3 show that the distribution of markers and the length of the 23 linkage groups were not the same. In the female map, LG8 was the longest (319.50 cM) and had the most markers (916 SLAFs), whereas LG19 was the shortest (79.84 cM) and had the fewest markers (182 SLAFs). In the male and integrated maps, LG15 was the longest (184.81 and 252.15 cM, respectively) and had the most markers (675 and 1,285 SLAFs, respectively). In the male map, LG6 contained the fewest markers (147 SLAFs) while LG13 was the shortest (94.67 cM). In the integrated map, LG9 had the fewest markers (325 SLAFs), whereas LG16 was the shortest (92.87 cM).
The basic characteristics of the markers for the final map are shown in Table 3 and Table S1. On the integrated map, 4,514 and 6,993 SLAF markers were specifically linked to the maternal and paternal progenitors, respectively, and the other 2,682 SLAFs were shared by parents. The results showed that there was a good one to one match of the 23 linkage groups between female and male maps. Most of markers on each linkage group exhibited good synteny (Figures S1–S5), though a few markers site were arranged differently. The female and integrated maps shared 9,675 SLAFs, 10.36% of which exhibited differences in position between two maps, and 669 of 7,196 markers (9.30%) shared by the male and integrated maps showed the different position between them. Out of a total 14,189 SLAFs, 950 showed distorted segregation at the P < 0.05 level on the map, which represented a frequency of 6.70%. The distorted markers were distributed unevenly on 19 groups except for LG8, LG16, LG19, and LG21. A total of 185 distorted markers were identified on LG7, which had the highest distorted markers percentage at 19.47%. Correspondingly, 14 of the total 50 segregation distortion regions (SDRs) were also on LG7. The others were scattered on 14 LGs with SDR numbers ranging from 1 to 5.
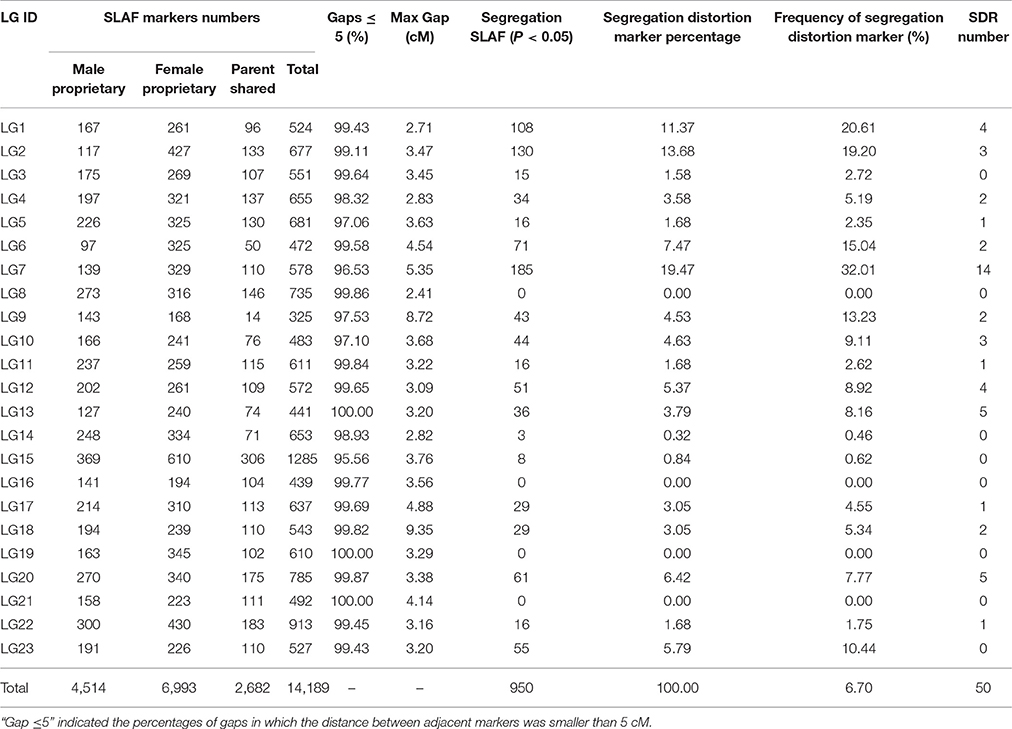
Table 3. Summary of integrated linkage map of Osmanthus fragrans.
Distribution of Markers Types on the Genetic Map
The 14,189 SLAFs on the integrated map were composed of three types of markers. These were 11,228 “SNP-only,” 559 “InDel-only,” and 2,402 “SNP & InDel” types, with percentages of 79.13, 3.94, and 16.93%, respectively. The marker distribution of the three types on the 23 LGs are shown in Figure 4. LG10 had the largest percentage of “SNP-only” markers (82.82%) and the smallest percentage of “SNP & InDel” (13.87%), LG3 had the highest percentage of “InDel-only” markers (4.90%). A total of 23,664 SNP loci were further detected from the 11,228 “SNP-only” SLAFs and 2402 from the “SNP & InDel” SLAFs on the integrated map. Table 4 showed a different proportion of SNP types. The majority (61.68%) of the SNP markers was transition-type SNPs: 30.21% R (G/A) and 31.47% Y (T/C). The transversion-type SNPs (38.32%) consisted of S (G/C), M (A/C), K (G/T), and W (A/T) with the percentages between 6.17 and 13.60%.
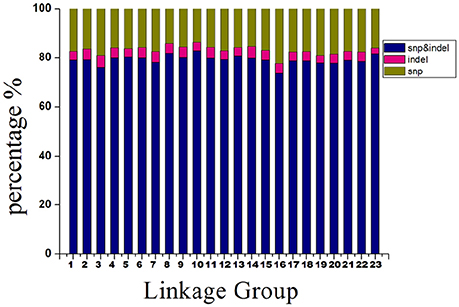
Figure 4. Percentages of different types of SLAFs on each linkage group.
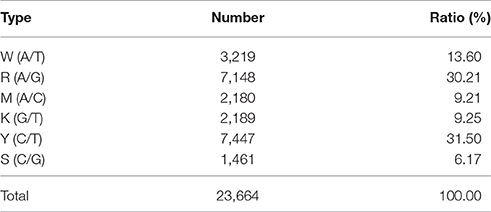
Table 4. Statistic of six types of mapped SNPs.
Evaluation of the Genetic Map
Heat map and haplotype map were used to estimate the map quality obtained in this work. The genetic map was based on multi-point recombination analysis. The closer the markers were, the smaller the recombination rate was. The heat map showed the recombination relationship between markers (Figure S6). The haplotype map reflects the double exchange and the genotyping of all the F1 individuals and parental controls. Graphical genotypes were generated based on the 14,189 SLAF markers. On the haplotype map, color change indicates the occurrence of a recombination event (Figure S7). A high percentage of the recombination blocks were defined by their color difference. Most of the LGs performed well according to the Figures S6, S7.
Discussion
Genetic linkage maps are useful tools for genomic studies. They can elucidate the genome structure and facilitate the identification of molecular markers pertinent to biological traits in an experimental segregating progeny. It is particularly important to construct maps for long generation species, such as tree species. This study has developed the first reference genetic linkage map for O. fragrans, a species for which there is relatively little genomic information. This could be a useful starting point for further genetic studies on this plant.
Sample Population
Establishing a suitable population is the first step in constructing a genetic map. As a long-lived and woody tree, it is very difficult to obtain the traditional mapping materials for O. fragrans, such as Double Haploid (DH), Recombination Inbred Lines (RILs) and F2 progeny, which have been widely used to construct the maps for many different crops. However, O. fragrans is a highly heterozygous species where the F1 hybrids often show substantial and different types of segregation (Wu et al., 2010). The pseudo-testcross strategy provides a simple way to undertake genetic mapping (Grattapaglia and Sederoff, 1994), and has been successfully applied to the varity of tree species, such as Malus pumila (Maliepaard et al., 1998), Anacardium occidentale (Cavalcanti and Wilkinson, 2007), Eucommia ulmoides (Wang et al., 2014), and Populus sp. (Cervera et al., 2001; Yin et al., 2004). Sweet osmanthus is a functional androdioecy (Hao et al., 2011). A controlled pollination was performed between “Huangchuan Jingui” (hermaphrodite) and “Wanyin Gui” (male). Then, the hybrid seeds were in vitro embryo cultured to circumvent the long and hazardous germination period caused by the existence of a hard seed coat and after-ripening. Usually, the seeds of this species would germinate after stratification for 1 year, which completes the after-ripening period and breaks dormancy (Yang and Zhu, 2000). However, seeds rot very easily during this long pre-germination period. In this study, the F1 population with 129 offspring was established in just 2 months with a seedling rate of 90%, which provided a mapping resource and ensured that the map could be successfully constructed.
The size of the mapping population determines the saturation degree of the genetic map (Zamir and Tadmor, 1986). The sample population should be as large as possible to improve mapping accuracy. The experimental workload and cost, however, typically confine the size of the F1 population, and the existing maps of tree species are generally based on 100–150 individuals or even less (Gao et al., 2007). In this study, 129 F1 progenies were used to construct the O. fragrans genetic map. The key features of the map suggested that the population size was large enough to accurately develop the first framework map.
The Feasibility and Advantages of the SLAF-Seq Technique
Conventional genetic mapping methods usually employ AFLP, RAPD, and SSR markers, especially for species where there is not enough genomic information (Wang et al., 1997; Brondani et al., 1998; Costa et al., 2000). Generally speaking, it is laborious and time-consuming to develop these markers for constructing maps using traditional experimental methods, particularly for a high-density linkage maps that need thousands of markers. The SLAF-seq method is a newly developed sequencing technique, which uses a simplified genome that has the specific loci needed for sequencing along with some restriction sites. Therefore, SLAF-seq can provide high numbers of accurate markers, and plays an important role in genetic analysis.
In this study, SLAF-seq yielded 173,537 markers from 206.92 M reads, and the polymorphic markers were successfully genotyped and sorted into five segregation types. After linkage analysis and filtering out the unsuitable SLAFs, 14,189 SLAF markers were mapped onto the LGs with a sequencing depth of 69.9-fold for parents and over 10-fold for progenies on average. The sequence depth showed a high degree of accuracy for the SLAF markers used in this research. In addition, 23,664 SNPs were developed from the mapped SLAFs that were sequence-tagged markers with co-dominant inheritance. These can be used for genetic diversity studies, germplasm identification, and comparative genomic studies on Osmanthus. This study suggests that the SLAF-seq method is a useful tool for developing molecular marker and constructing genetic map.
Characteristics of the Genetic Linkage Map
In this study, two comprehensive maps for the male and female progenitors have been constructed firstly, and then a integrated map consisting of a combination of the data from both progenitors was generated. The integrated map is 2962.46 cM in length with an average distance of 0.21 cM between adjacent markers. The average distance is considerably shorter than in the maps of other related species, such as Olea europaea (2n = 46) (De la Rosa et al., 2003; Charafi et al., 2007; Aabidine et al., 2010; İpek et al., 2016). The maximum gap larger than 5 cM was found in the LG7, LG9, and LG18, which may represent the regions lacking marker polymorphism, a failure to detect markers, or hot spots for recombination (Lindahl, 1991; Zhang et al., 2011; Wang et al., 2012). The number of linkage groups was 23, which was equal to the haploid chromosome for O. fragrans (Li et al., 2004). The length of 23 linkage groups was arranged in descending order, which was significantly correlated (r2 = 0.882, p < 0.01) with the size of chromosomes reported by Li et al. (2004). This data may also indicate the quality of the map constructed in this study. Once some markers or genes are located on a certain chromosome, the linkage groups could be accurately matched to the chromosomes. Table 2 showed that there were considerable differences in the number of markers present and the length of each LG. Furthermore, there was a strong correlation between the LG length and the marker numbers (r2 = 0.846, P < 0.01). The similar positive correlation was also detected in female and male maps (r2 = 0.885, r2 = 0.636, respectively, P < 0.01), so the different number of markers on the LGs would cause the difference length of the same LGs in both parent maps. LG8 showed the most difference in length and the order of some markers between the male and female maps, which may be caused because the relative positions of tightly linked markers are usually uncertain due to the effects of missing values and to differences in segregation information among markers (Maliepaard et al., 1997; Silfverberg-Dilworth et al., 2006).
Segregation distortion is a ubiquitous phenomenon in many species, which skews the frequency of alleles from the expected Mendelian ratio (Faris et al., 1998; Li et al., 2010, 2011). This phenomenon may be related to biological and environmental factors, such as a small mapping population size (Plomion et al., 1995), chromosome loss (Bradshaw and Stettler, 1994), or gametic and zygotic selection (Liebhard et al., 2003). The segregation distortion markers was uniformly distributed on the LGs, and no distorted markers were observed on LG8, LG16, LG19, and LG21. The information of the allele frequencies before and after fertilization is lacking. It is difficult to infer the segregation distortion due to the pre-zygotic selection or post-zygotic selection. However, about 20% seedlings died within a month before sampling without other conditions, which suggested that some post-zygotic selection mechanism may have played an important role in the segregation distortion ratios of this study. “Wan Yingui” and “Huangchuan Jingui” owned a far genetic relationship (Shang et al., 2004), diverging strongly in many important morphological traits, such as gender and corolla color, which were chosen as parents for hybridization, and may lead to segregation distortion more easily than the parents with close genetic relationship (Kianian and Quiros, 1992; Xian-Liang et al., 2006). Some reports have shown that segregation distortion markers can increase the LG genetic length of the map and improve QTL mapping when the segregation distortion was properly incorporated (Luo et al., 2005; Xu, 2008; Zhang et al., 2010). 950 skewed markers (P < 0.05) were added to the final map, which should improve any future QTL genotype mapping.
It is the first reference map that was reported in this study for O. fragrans. No phenotypic traits were located on the present map because the progenies in our study were still seedlings, and no traits of ornamental or agronomic interest could be segregated and evaluated because of the juvenile nature of the seedlings. The mapping population resources have been planted at the Garden of Huangchuan Jingui for several months where the climate is suitable for the growth of this species. Once the progenies become sexually mature, this high-density linkage map could offer a useful platform for future QTL mapping, including the important traits of flowering time, corolla color, flower fragrance, and cold resistance. The markers on this map were developed at level of the whole genome. Therefore, the constructed map also serves as an important reference for gene cloning and genome structure investigations into O. fragrans.
Author Contributions
FS and WY designed and organized the entire project. YxH, WY, MD, and YjH performed the experiments. YxH analyzed the data and drafted the manuscript, and FS revised it. All authors read and approved the final manuscript.
Funding
This study was funded by the National Natural Science Foundation of China (No. 31270738, No. 31500572 and No. U1604114).
Conflict of Interest Statement
The authors declare that the research was conducted in the absence of any commercial or financial relationships that could be construed as a potential conflict of interest.
The reviewer PG and handling Editor declared their shared affiliation
Acknowledgments
We would give thanks to Mr. Yunbin Wang (Biomarker Technologies Co., Ltd., Beijing) for technical support in bioinformatics and the Garden of Huangchuan Jingui for providing help of field experiments.
Supplementary Material
The Supplementary Material for this article can be found online at: http://journal.frontiersin.org/article/10.3389/fpls.2017.01621/full#supplementary-material
Figure S1. Linkage group 1 for Huangchuan Jingui (female), Wan Yingui (male) and their integration.
Figure S2. Linkage group 2 to 7 for Huangchuan Jingui (female), Wan Yingui (male) and their integration.
Figure S3. Linkage group 8–14 for Huangchuan Jingui (female), Wan Yingui (male) and their integration.
Figure S4. Linkage group 15–19 for Huangchuan Jingui (female), Wan Yingui (male) and their integration.
Figure S5. Linkage group 20–23 for Huangchuan Jingui (female), Wan Yingui (male) and their integration.
Figure S6. Heat map of the integrated maps.
Figure S7. Haplotype map of the integrated maps.
Table S1. Information of the marker on the19 linkage groups (LGs).
References
Aabidine, A. Z. E., Charafi, J., Grout, C., Doligez, A., Santoni, S., Moukhli, A., et al. (2010). Construction of a genetic linkage map for the olive based on AFLP and SSR markers. Crop Sci. 50, 2291–2302. doi: 10.2135/cropsci2009.10.0632
Baird, N. A., Etter, P. D., Atwood, T. S., Currey, M. C., Shiver, A. L., Lewis, Z. A., et al. (2008). Rapid SNP discovery and genetic mapping using sequenced RAD markers. PLoS ONE 3:e3376. doi: 10.1371/journal.pone.0003376
Baldermann, S., Kato, M., Kurosawa, M., Kurobayashi, Y., Fujita, A., Fleischmann, P., et al. (2010). Functional characterization of a carotenoid cleavage dioxygenase 1 and its relation to the carotenoid accumulation and volatile emission during the floral development of Osmanthus fragrans Lour. J. Exp. Bot. 61, 2967–2977. doi: 10.1093/jxb/erq123
Bradshaw, H. D., and Stettler, R. F. (1994). Molecular genetics of growth and development in Populus. II. Segregation distortion due to genetic load. Theor. Appl. Genet. 89, 551–558. doi: 10.1007/BF00222447
Brondani, R. P. V., Brondani, C., Tarchini, R., and Grattapaglia, D. (1998). Development, characterization and mapping of microsatellite markers in Eucalyptus grandis and Europhylla. Theor. Appl. Genet. 97, 816–827. doi: 10.1007/s001220050961
Cai, C., Cheng, F. Y., Wu, J., Zhong, Y., and Liu, G. (2015). The first high-density genetic map construction in tree peony (Paeonia Sect. Moutan) using genotyping by specific-locus amplified fragment sequencing. PLoS ONE 10:e0128584. doi: 10.1371/journal.pone.0128584
Cavalcanti, J. J. V., and Wilkinson, M. J. (2007). The first genetic maps of cashew (Anacardium occidentale L.). Euphytica 157, 131–143. doi: 10.1007/s10681-007-9403-9
Cervera, M. T., Storme, V., Ivens, B., Gusmão, J., Liu, B. H., Hostyn, V., et al. (2001). Dense genetic linkage maps of three Populus species (Populus deltoides, P. nigra and P. trichocarpa) based on AFLP and microsatellite markers. Genetics 158, 787–809.
Charafi, J., Zine El Aabidine, A., Grout, C., Rahioui, B., El Meziane, A., Moukhli, A., et al. (2007). “A genetic linkage map of Olea europaea L. using a Pseudo-Test cross-Mapping Strategy based on SSR, AFLP, ISSR, RAPD and SCAR markers,” in XII EUCARPIA Symposium on Fruit Breeding and Genetics 814 (Zaragoza), 609–614.
Costa, P., Pot, D., Dubos, C., Frigerio, J. M., Pionneau, C., Bodenes, C., et al. (2000). A genetic map of maritime pine based on AFLP, RAPD and protein markers. Theor. Appl. Genet. 100, 39–48. doi: 10.1007/s001220050006
De la Rosa, R., Angiolillo, A., Guerrero, C., Pellegrini, M., Rallo, L., Besnard, G., et al. (2003). A first linkage map of olive (Olea europaea L.) cultivars using RAPD, AFLP, RFLP and SSR markers. Theor. Appl. Genet. 106, 1273–1282. doi: 10.1007/s00122-002-1189-5
Elshire, R. J., Glaubitz, J. C., Sun, Q., Poland, J. A., Kawamoto, K., Buckler, E. S., et al. (2011). A robust, simple genotyping-by-sequencing (GBS) approach for high diversity species. PLoS ONE 6:e19379. doi: 10.1371/journal.pone.0019379
Faris, J. D., Laddomada, B., and Gill, B. S. (1998). Molecular mapping of segregation distortion loci in Aegilops tauschii. Genetics 149, 319–327.
Freeman, J. S., Potts, B. M., Shepherd, M., and Vaillancourt, R. E. (2006). Parental and consensus linkage maps of Eucalyptus globulus using AFLP and microsatellite markers. Silvae Genet. 55, 202–217.
Gao, J., Tang, H. R., Dong, X. L., and Luo, Y. (2007). Research progress of molecular genetic map in fruit trees. North Hortic. 10, 44–50. doi: 10.3969/j.issn.1001-0009.2007.10.019
Graham, I. A., Besser, K., Blumer, S., Branigan, C. A., Czechowski, T., Elias, L., et al. (2010). The genetic map of Artemisia annua L. identifies loci affecting yield of the antimalarial drug artemisinin. Science 327, 328–331. doi: 10.1126/science.1182612
Grattapaglia, D., and Sederoff, R. (1994). Genetic linkage maps of Eucalyptus grandis and Eucalyptus urophylla using a pseudo-testcross: mapping strategy and RAPD markers. Genetics 137, 1121–1137.
Hao, R. M., Zhao, H. B., Wang, J. H., and Zhou, L. H. (2011). Observation and study on breeding system of wild Osmanthus fragrans. J. Plant Resour. Environ. 20, 17–24. doi: 10.3969/j.issn.1674-7895.2011.01.003
Hu, W., Luo, Y., Yang, Y., Zhang, Z. Y., and Fan, D. M. (2014). Genetic diversity and population genetic structure of wild sweet osmanthus revealed by microsatellite markers. Acta Hortic. Sin. 41, 1427–1435.
İpek, A., Yılmaz, K., Sıkıcı, P., Tangu, N. A., Öz, A. T., Bayraktar, M., et al. (2016). SNP discovery by GBS in olive and the construction of a high-density genetic linkage map. Biochem. Genet. 54, 313–325. doi: 10.1007/s10528-016-9721-5
Jiang, T., Zhou, B., Gao, F., and Guo, B. (2011). Genetic linkage maps of white birches (Betula platyphylla Suk. and B. pendula Roth) based on RAPD and AFLP markers. Mol. Breed. 27, 347–356. doi: 10.1007/s11032-010-9436-y
Kent, W. J. (2002). BLAT—the BLAST-like alignment tool. Genome Res. 12, 656–664. doi: 10.1101/gr.229202
Kianian, S. F., and Quiros, C. F. (1992). Generation of a brassica oleracea, composite RFLP map: linkage arrangements among various populations and evolutionary implications. Theor. Appl. Genet. 84, 544–554. doi: 10.1007/BF00224150
Li, H., Kilian, A., Zhou, M., Wenzl, P., Huttner, E., Mendham, N., et al. (2010). Construction of a high-density composite map and comparative mapping of segregation distortion regions in barley. Mol. Genet. Genomics 284, 319–331. doi: 10.1007/s00438-010-0570-3
Li, X., Wang, X., Wei, Y., and Brummer, E. C. (2011). Prevalence of segregation distortion in diploid alfalfa and its implications for genetics and breeding applications. Theor. Appl. Genet. 123, 667–679. doi: 10.1007/s00122-011-1617-5
Li, Y., Yuan, W., Dong, M., and Shang, F. (2004). A study on karyotype of Osmanthus fragrans Lour. J. Nanjing For. Univ. Nat. Sci. Ed. 28, 87–90. doi: 10.3969/j.issn.1000-2006.2004.z1.014
Li, Z. (2014). Pollionation biology and cross breeding of Osmanthus fragrans Lour (in Chinese). MS thesis Nanjing: Nanjing Forestry University.
Liebhard, R., Koller, B., Gianfranceschi, L., and Gessler, C. (2003). Creating a saturated reference map for the apple (Malus × domestica Borkh) genome. Theor. Appl. Genet. 106, 1497–1508. doi: 10.1007/s00122-003-1209-0
Lindahl, K. F. (1991). His and hers recombinational hotspots. Trends Genet. 7, 273–276. doi: 10.1016/0168-9525(91)90306-B
Liu, D., Ma, C., Hong, W., Huang, L., Liu, M., Liu, H., et al. (2014). Construction and analysis of high-density linkage map using high-throughput sequencing data. PLoS ONE 9:e98855. doi: 10.1371/journal.pone.0098855
Luo, L., Zhang, Y. M., and Xu, S. (2005). A quantitative genetics model for viability selection. Heredity (Edinb) 94, 347–355. doi: 10.1038/sj.hdy.6800615
Ma, J. Q., Huang, L., Ma, C. L., Jin, J. Q., Li, C. F., Wang, R. K., et al. (2015). Large-scale SNP discovery and genotyping for constructing a high-density genetic map of tea plant using specific-locus amplified fragment sequencing (SLAF-seq). PLoS ONE 10:e0128798. doi: 10.1371/journal.pone.0128798
Maliepaard, C., Alston, F. H., Van Arkel, G., Brown, L. M., Chevreau, E., Dunemann, F., et al. (1998). Aligning male and female linkage maps of apple (Malus pumila Mill.) using multi-allelic markers. Theor. Appl. Genet. 97, 60–73. doi: 10.1007/s001220050867
Maliepaard, C., Jansen, J., and Van Ooijen, J. W. (1997). Linkage analysis in a full-sib family of an outbreeding plant species: overview and consequences for applications. Genet. Res. 70, 237–250. doi: 10.1017/S0016672397003005
Mu, H. N., Li, H. G., Wang, L. G., Yang, X. L., Sun, T. Z., and Xu, C. (2014). Transcriptome sequencing and analysis of sweet osmanthus (Osmanthus fragrans Lour.). Genes Genomics 36, 777–788. doi: 10.1007/s13258-014-0212-y
Mu, H., Sun, T., Xu, C., Wang, L., Yue, Y., Li, H., et al. (2017). Identification and validation of reference genes for gene expression studies in sweet osmanthus (Osmanthus fragrans) based on transcriptomic sequence data. J. Genet. 96, 273–281. doi: 10.1007/s12041-017-0769-8
Plomion, C., O'Malley, D. M., and Durel, C. E. (1995). Genomic analysis in maritime pine (Pinus pinaster). Comparison of two RAPD maps using selfed and open-pollinated seeds of the same individual. Theor. Appl. Genet. 90, 1028–1034. doi: 10.1007/BF00222917
Shang, F. D., Yin, Y. J., and Xiang, Q. B. (2003). The culture of sweet osmanthus in China. J. Henan Univ. Nat. Sci. 43, 136–139. doi: 10.3969/j.issn.1000-5242.2003.02.039
Shang, F. D., Yin, Y. J., and Zhang, T. (2004). The RAPD analysis of 17 Osmanthus fragrans cultivars in Henan province. Acta Hortic. Sin. 31, 685–687. doi: 10.3321/j.issn:0513-353X.2004.05.031
Silfverberg-Dilworth, E., Matasci, C. L., Van de Weg, W. E., Van Kaauwen, M. P. W., Walser, M., Kodde, L. P., et al. (2006). Microsatellite markers spanning the apple (Malus x domestica Borkh.) genome. Tree Genet. Genomes 2, 202–224. doi: 10.1007/s11295-006-0045-1
Sun, X., Liu, D., Zhang, X., Li, W., Liu, H., Hong, W., et al. (2013). SLAF-seq: an efficient method of large-scale de novo SNP discovery and genotyping using high-throughput sequencing. PLoS ONE 8:e58700. doi: 10.1371/journal.pone.0058700
Takehisa, I., Akito, K., Satoshi, T., Prakit, S., Peerasak, S., Takehiko, S., et al. (2012). Construction of a genetic linkage map and genetic analysis of domestication related traits in mungbean (Vigna radiata). PLoS ONE 7:e41304. doi: 10.1371/journal.pone.0041304
Van Orsouw, N. J., Hogers, R. C., Janssen, A., Yalcin, F., Snoeijers, S., Verstege, E., et al. (2007). Complexity reduction of polymorphic sequences (CRoPS™): a novel approach for large-scale polymorphism discovery in complex genomes. PLoS ONE 2:e1172. doi: 10.1371/journal.pone.0001172
Wang, D., Li, Y., Li, L., Wei, Y., and Li, Z. (2014). The first genetic linkage map of Eucommia ulmoides. J. Genet. 93, 13–20. doi: 10.1007/s12041-014-0322-y
Wang, L. M., Li, M. T., Jin, W. W., Li, S., Zhang, S. Q., and Yu, L. J. (2009). Variations in the components of Osmanthus fragrans Lour. essential oil at different stages of flowering. Food Chem. 114, 233–236. doi: 10.1016/j.foodchem.2008.09.044
Wang, W., Huang, S., Liu, Y., Fang, Z., Yang, L., Hua, W., et al. (2012). Construction and analysis of a high-density genetic linkage map in cabbage (Brassica oleracea L. var. capitata). BMC Genomics 13:523. doi: 10.1186/1471-2164-13-523
Wang, Y. H., Thomas, C. E., and Dean, R. A. (1997). A genetic map of melon (Cucumis melo L.) based on amplified fragment length polymorphism (AFLP) markers. Theor. Appl. Genet. 95, 791–798. doi: 10.1007/s001220050627
Wangjun, Y., Meifang, D., and Fude, S. (2005). In vitro culture of embryo of Osmanthus fragrans. Acta Hortic. Sin. 32:1136. doi: 10.3321/j.issn:0513-353X.2005.06.039
Ward, J. A., Bhangoo, J., Fernández-Fernández, F., Moore, P., Swanson, J. D., Viola, R., et al. (2013). Saturated linkage map construction in Rubus idaeus using genotyping by sequencing and genome-independent imputation. BMC Genomics 14:2. doi: 10.1186/1471-2164-14-2
Wu, L. C., Chang, L. H., Chen, S. H., Fan, N. C., and Ho, J. A. A. (2009). Antioxidant activity and melanogenesis inhibitory effect of the acetonic extract of Osmanthus fragrans: a potential natural and functional food flavor additive. LWT-Food Sci. Technol. 42, 1513–1519. doi: 10.1016/j.lwt.2009.04.004
Wu, S., Yang, J., Huang, Y., Li, Y., Yin, T., Wullschleger, S. D., et al. (2010). An improved approach for mapping quantitative trait loci in a pseudo-testcross: revisiting a poplar mapping study. Bioinf. Biol. Insights 4:1. doi: 10.4137/BBI.S4153
Xiang, Q., and Liu, Y. (2007). An illustrated monograph of the sweet osmanthus variety in China. Hangzhou: Zhejiang Science & Technology Press.
Xian-Liang, S., Xue-Zhen, S., and Tian-Zhen, Z. (2006). Segregation distortion and its effect on genetic mapping in plants. Chin. J. Agric. Biotechnol. 3, 163–169. doi: 10.1079/CJB2006110
Xu, S. (2008). Quantitative trait locus mapping can benefit from segregation distortion. Genetics 180, 2201–2208. doi: 10.1534/genetics.108.090688
Xu, Y. C., Zhou, L. H., Hu, S. Q., Hao, R. M., Huang, C., and Zhao, H. B. (2014). The differentiation and development of pistils of hermaphrodites and pistillodes of males in androdioecious Osmanthus fragrans L. and implications for the evolution to androdioecy. Plant Syst. Evol. 300, 843–849. doi: 10.1007/s00606-013-0923-6
Yang, K. M., and Zhu, W. J. (2000). Osmanthus fragrans. Shanghai: Shanghai Scientific and Technical Press.
Yin, T. M., DiFazio, S. P., Gunter, L. E., Riemenschneider, D., and Tuskan, G. A. (2004). Large-scale heterospecific segregation distortion in Populus revealed by a dense genetic map. Theor. Appl. Genet. 109, 451–463. doi: 10.1007/s00122-004-1653-5
Yuan, W. J., Han, Y. J., Dong, M. F., and Shang, F. D. (2011). Assessment of genetic diversity and relationships among Osmanthus fragrans cultivars using AFLP markers. Electron. J. Biotechnol. 14, 2–3. doi: 10.2225/vol14-issue1-fulltext-9
Zamir, D., and Tadmor, Y. (1986). Unequal segregation of nuclear genes in plants. Bot. Gaz. 147, 355–358. doi: 10.1086/337602
Zang, D. K., Xiang, Q. B., Liu, Y. L., and Hao, R. M. (2003). The studying history and the application to International Cultivar Registration Authority of sweet osmanthus (Osmanthus fragrans Lour.). J. Plant Resour. Environ. 12, 49–53. doi: 10.3969/j.issn.1674-7895.2003.04.011
Zhang, C., Wang, Y., Fu, J., Bao, Z., and Zhao, H. (2016). Transcriptomic analysis and carotenogenic gene expression related to petal coloration in Osmanthus fragrans, ‘yanhong gui’. Trees 30, 1207–1223. doi: 10.1007/s00468-016-1359-8
Zhang, F., Chen, S., Chen, F., Fang, W., Chen, Y., and Li, F. (2011). SRAP-based mapping and QTL detection for inflorescence-related traits in chrysanthemum (Dendranthema morifolium). Mol. Breed. 27, 11–23. doi: 10.1007/s11032-010-9409-1
Zhang, J., Zhang, Q., Cheng, T., Yang, W., Pan, H., Zhong, J., et al. (2015). High-density genetic map construction and identification of a locus controlling weeping trait in an ornamental woody plant (Prunus mume Sieb. et Zucc). DNA Res. 22, 183–191. doi: 10.1093/dnares/dsv003
Zhang, L., Wang, S., Li, H., Deng, Q., Zheng, A., Li, S., et al. (2010). Effects of missing marker and segregation distortion on QTL mapping in F2 populations. Theor. Appl. Genet. 121, 1071–1082. doi: 10.1007/s00122-010-1372-z
Zhang, Y., Zhang, J., Huang, L., Gao, A., Zhang, J., Yang, X., et al. (2015). A high-density genetic map for P genome of Agropyron Gaertn. based on specific-locus amplified fragment sequencing (SLAF-seq). Planta 242, 1335–1347. doi: 10.1007/s00425-015-2372-7
Zhu, Y., Yin, Y., Yang, K., Li, J., Sang, Y., Huang, L., et al. (2015). Construction of a high-density genetic map using specific length amplified fragment markers and identification of a quantitative trait locus for anthracnose resistance in walnut (Juglans regia L.). BMC Genomics 16:614. doi: 10.1186/s12864-015-1822-8
Keywords: genetic map, pseudo-testcross, SLAF-seq, SNP, Osmanthus fragrans
Citation: He Y, Yuan W, Dong M, Han Y and Shang F (2017) The First Genetic Map in Sweet Osmanthus (Osmanthus fragrans Lour.) Using Specific Locus Amplified Fragment Sequencing. Front. Plant Sci. 8:1621. doi: 10.3389/fpls.2017.01621
Received: 19 June 2017; Accepted: 05 September 2017;
Published: 22 September 2017.
Edited by:
Marcelino Perez De La Vega, Universidad de León, SpainReviewed by:
Cesar Benito, Universidad Complutense de Madrid, SpainPedro García, Universidad de León, Spain
Copyright © 2017 He, Yuan, Dong, Han and Shang. This is an open-access article distributed under the terms of the Creative Commons Attribution License (CC BY). The use, distribution or reproduction in other forums is permitted, provided the original author(s) or licensor are credited and that the original publication in this journal is cited, in accordance with accepted academic practice. No use, distribution or reproduction is permitted which does not comply with these terms.
*Correspondence: Fude Shang, fudeshang@henu.edu.cn