
- Department of Physics and Astronomy, Georgia State University, Atlanta, GA, USA
Previously we have shown that ONIOM type (QM/MM) calculations can be used to simulate isotope edited FTIR difference spectra for neutral ubiquinone in the QA binding site in Rhodobacter sphaeroides photosynthetic reaction centers. Here we considerably extend upon this previous work by calculating isotope edited FTIR difference spectra for reaction centers with a variety of unlabeled and 18O labeled foreign quinones incorporated into the QA binding site. Isotope edited spectra were calculated for reaction centers with 2,3-dimethoxy-5,6-dimethyl-1,4-benzoquinone (MQ0), 2,3,5,6-tetramethyl-1, 4-benzoquinone (duroquinone, DQ), and 2,3-dimethyl-l,4-naphthoquinone (DMNQ) incorporated, and compared to corresponding experimental spectra. The calculated and experimental spectra agree well, further demonstrating the utility and applicability of our ONIOM approach for calculating the vibrational properties of pigments in protein binding sites. The normal modes that contribute to the bands in the calculated spectra, their composition, frequency, and intensity, and how these quantities are modified upon 18O labeling, are presented. This computed information leads to a new and more detailed understanding/interpretation of the experimental FTIR difference spectra. Hydrogen bonding to the carbonyl groups of the incorporated quinones is shown to be relatively weak. It is also shown that there is some asymmetry in hydrogen bonding, accounting for 10–13 cm−1 separation in the frequencies of the carbonyl vibrational modes of the incorporated quinones. The extent of asymmetry in H-bonding could only be established by considering the spectra for various types of quinones incorporated into the QA binding site. The quinones listed above are “tail-less.” Spectra were also calculated for reaction centers with corresponding “tail” containing quinones incorporated, and it is found that replacement of the quinone methyl group by a phytyl or prenyl chain does not alter ONIOM calculated spectra.
Introduction
Quinones play an important role in biological proton and electron transfer processes that occur in both respiration and photosynthesis (Trumpower, 1982). In type II photosynthetic reaction centers two quinone molecules act as terminal electron acceptors (Ke, 2001a,b). The two quinones are often termed QA and QB. In this manuscript we will refer to the quinone binding site as QA and QB, however. The quinones that occupy the QA and QB binding sites have very different functions. The QA quinone is an intermediary cofactor involved in transferring electrons from (bacterio) pheophytin to QB, while the QB quinone couples proton and electron transfer processes (Ke, 2001b,c,d).
In this manuscript we focus on the QA binding site. The quinone occupying the QA binding site is species dependent. In Rhodobacter (Rb.) sphaeroides purple bacterial reaction centers (PBRCs) a ubiquinone (UQ) molecule occupies the QA binding site. In PBRCs from Blastochloris viridis (Shopes and Wraight, 1985) and Chloroflexus aurantiacus (Hale et al., 1983) a menaquinone occupies the QA binding site. In photosystem II reaction centers from oxygen evolving organisms, a plastoquinone (PQ) molecule occupies the QA binding site. In photosystem I the secondary electron acceptor, termed A1, is a vitamin K1 (VK) molecule (also called phylloquinone). Menaquinone and VK are both naphthoquinone (NQ) moieties that differ only in the degree of saturation of the tail at C6.
Figure 1 shows the structure, numbering and abbreviations we will use for the various quinones discussed in this manuscript. MQ0 and DMNQ are UQ and VK analogues, respectively, in which the hydrocarbon tail has been replaced with a methyl group. DQ is a PQ analogue in which the hydrocarbon chain at C6 is replaced with a methyl group.
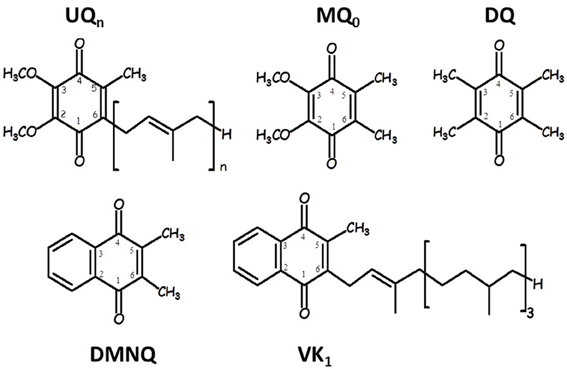
Figure 1. Structure and numbering of ubiquinone (2,3-dimethoxy, 5-methyl,6-prenyl benzoquinone) (UQn), 2,3-dimethoxy, 5,6-methyl benzoquinone (MQ0), 2,3,5,6-methyl benzoquinone (duroquinone, DQ), 2,3-dimethyl, 1,4-naphthoquinone (DMNQ) and 2-methyl, 3-phytyl 1,4-naphthoquinone (VK). The numbering scheme employed here for the naphthoquinone structures is nonstandard, and was chosen to facilitate comparison between naphthoquinone and ubiquinone structures.
It has been suggested, at least for the UQ that occupies the QA site in PBRCs, that the role of the hydrocarbon chain at C6 is to anchor and orient the quinone head-group in a specific way (Warncke et al., 1994). Data is available that may argue against this proposal, however, (McComb et al., 1990; Srinivasan and Golbeck, 2009; Wraight and Gunner, 2009).
Comparison of the properties of PBRCs with MQ0 and UQn, or VK and DMNQ, incorporated into the QA binding site will allow one to assess how or if the hydrocarbon chain at C6 modifies the quinones functional properties. Similarly, comparison of the properties of PBRCs with MQ0 and DQ incorporated into the QA binding site will allow one to assess how or if the methoxy groups at C2 and C3 modifies the quinones functional properties. Calculated spectra for Rb. sphaeroides PBRCs with VK in the QA binding site can be compared to experimental spectra. These calculated spectra may also serve as a useful model for B. viridis PBRCs that naturally have VK incorporated into the QA binding site.
Fourier transform infrared (FTIR) difference spectroscopy (DS) is a sensitive molecular-level probe of pigment-protein interactions, and it is widely used to study both the neutral and reduced states of quinones in PBRCs (Breton and Nabedryk, 1996) and in photosystem II (Noguchi and Berthomieu, 2005). In this manuscript we focus on Q−A/QA FTIR DS. Many molecular species contribute to Q−A/QA FTIR DS, and in the past it has been difficult to identify which bands are associated specifically with UQ in the QA site. However, fully functional quinones can be incorporated into QA depleted PBRCs, and by collecting Q−A/QA FTIR DS using PBRCs with unlabeled and isotopically labeled quinones incorporated, so called isotope edited FTIR difference spectra can be constructed, and from these spectra it has proven possible to separate contributions of the quinones from those of the protein in Q−A/QA FTIR DS (Breton and Nabedryk, 1996). Previously, a variety of unlabeled and 18O labeled quinones have been incorporated into the QA binding site in PBRC's, and 18O isotope edited FTIR DS have been obtained (Breton et al., 1994a). The goal in this manuscript is the simulation of these experimental 18O isotope edited FTIR DS associated with the neutral state of the quinone in the QA binding site. Calculated IR spectra associated with the quinone anion state are considerably more complicated (Lamichhane and Hastings, 2013) and are currently being undertaken.
Although experimental Q−A/QA FTIR DS have been obtained using PBRCs with various unlabeled and isotope labeled quinones incorporated, virtually no computational work aimed at modeling the experimental FTIR DS have been undertaken. Calculations aimed at modeling the vibrational properties of quinones in the QA binding site must account for the protein environment. Quantum mechanical (QM) calculations of such a large molecular system (pigment plus protein environment) are unfeasible. To circumnavigate this problem methods have been developed that allow one to separate the molecular system into distinct layers that can be treated at different levels of theory. In one layer the chemical properties of the principle species of interest (the pigment) can be calculated using “high-level” QM methods. The surrounding protein environment is included in the calculation but it is treated using computationally less expensive molecular mechanics (MM) methods.
Recently, we have undertaken QM:MM calculations for UQ in the QA binding site using the ONIOM method (Vreven et al., 2006). ONIOM is an acronym for: our Own N-layered Integrated molecular Orbital + Molecular mechanics package. In these calculations we showed that we could simulate experimental isotope edited FTIR difference spectra obtained using PBRCs with neutral UQ in the QA binding site. Here we extend upon these previous studies by attempting to simulate experimental isotope edited FTIR difference spectra obtained using PBRCs with symmetric tail-less and corresponding tail containing quinones incorporated into the QA binding site. We show that the calculated spectra agree well with the experimental spectra, further supporting the notion that the ONIOM method is a useful approach for understanding complex FTIR difference spectra associated with pigments in protein binding sites. We are also able to assess to what extent the quinone hydrocarbon chain may influence the calculated spectra.
Materials and Methods
Structural Model Used in Calculations
The molecular model used in ONIOM calculations was generated from the crystal structure of Rb. sphaeroides PBRCs at 2.2 Å resolution (Stowell et al., 1997) (PDB file 1AIJ). From the PDB file all atoms within 10 Å of either carbonyl oxygen atom of UQ were selected. This subset of atoms formed the basis of the QA binding site structural model. Hydrogen atoms (not included in the PDB file) were added to the model using the software Gaussview4, resulting in a final structural model consisting of 1024 atoms. Following the addition of hydrogen atoms the structural model was optimized (energy minimized) using ONIOM methods with all atoms associated with the protein backbone, and the non-heme iron atom, being held fixed. All atoms of the amino acid side chains and the incorporated quinone are unconstrained. For calculations of UQ/VK the hydrocarbon tail was modeled as a single prenyl/phytyl unit, respectively. Inclusion of further prenyl/phytyl units did not alter the calculated spectra (not shown).
The structural models for the different incorporated quinones are initially set up by simply replacing the molecular substituents of the originally incorporated UQ species. So, the C=O groups of the different quinones incorporated will initially have the same orientation and position to that found for UQ in the QA binding site. DMNQ and VK structures were constructed starting from the UQ structure, by replacing the methoxy groups with the NQ aromatic ring, without alteration of the quinone ring (Figure 2F). This orientation of the NQ ring (of DMNQ and VK) was chosen as previous docking calculations have suggested it is the most favorable (Hucke et al., 2002).
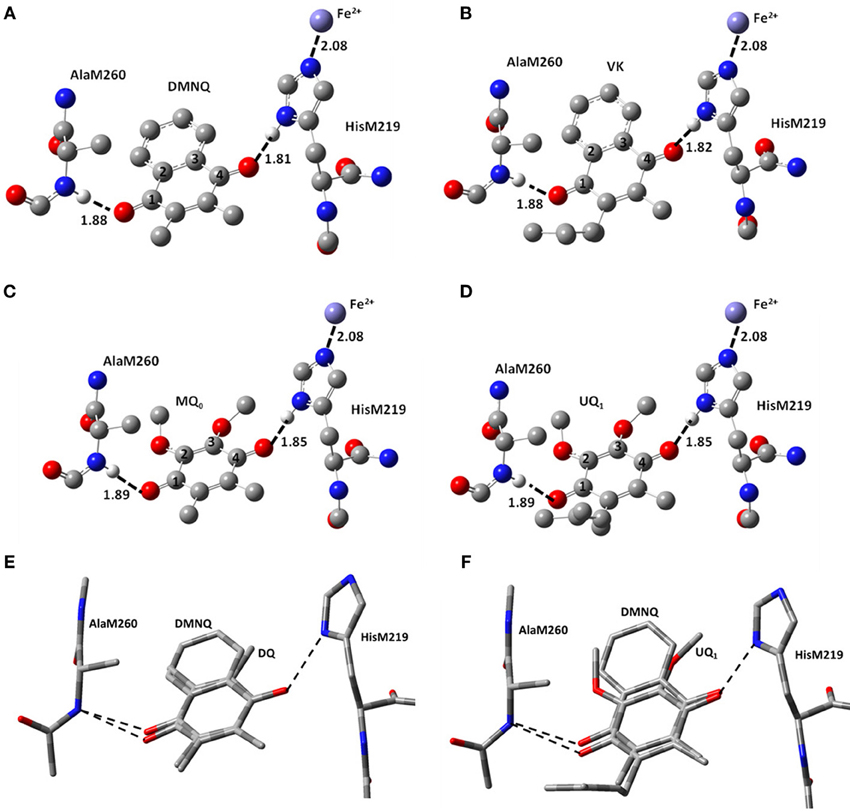
Figure 2. Ball and stick representation of the calculated structure of (A) DMNQ, (B) VK, (C) MQ0 and (D) UQ1 in the QA binding site in PBRCs from Rb. sphaeroides. Structure shown is after geometry optimization using ONIOM methods. Possible H-bonds are shown (dotted). Hydrogen atoms, except the ones involved in H-bonding, have been omitted. Distances quoted are in Å. (E,F) Overlap of structures obtained from ONIOM calculations for (E) DMNQ and DQ and (F) DMNQ and UQ1. Overlap is based on using the (fixed) backbone atoms of HisM219 and AlaM260. The amino acid side chains are virtually unaltered in the structures shown.
Calculations
All calculations were undertaken using Gaussian 03 (Frisch et al., 2004) software. For calculation of UQ molecules in the gas phase, and for the QM part of ONIOM calculations, molecular geometry optimizations and harmonic vibrational frequency calculations were undertaken using hybrid DFT methods, employing the B3LYP functional and the 6–31+G(d) basis set. This choice of functional and basis set are appropriate for calculation of the vibrational properties of quinones (Wheeler, 2001; Bandaranayake et al., 2006). The MM part of the ONIOM calculation is undertaken using the AMBER force field (Case et al., 2005). Following ONIOM geometry optimization of the structural model, the optimized quinone molecule from the model is considered separately for vibrational frequency calculations.
Normal Mode Assessment
Assignment of calculated vibrational frequencies to molecular groups is based on a consideration of the calculated atomic displacements (in Cartesian coordinates) associated with the normal modes. These atomic displacements can be animated using software (GaussView4), and the molecular groups that most prominently contribute to the normal modes can be assessed visually [see Figure 2 in Bandaranayake et al. (2006)]. In addition, potential energy distributions (PEDs) of the normal modes are calculated using the freeware GAR2PED (Martin and Van Alsenoy, 1995). For the various quinones in the QA binding site we calculate both vibrational mode frequencies and intensities. With both the frequency and intensity information “stick spectra” can be constructed. These stick spectra are representative of IR absorption spectra, as described previously (Bandaranayake et al., 2006; Parameswaran et al., 2008; Lamichhane et al., 2010). The calculated stick spectra are convolved with a Gaussian function with half-width of 4 cm−1 to produce more realistic looking IR absorption spectra (Bandaranayake et al., 2006; Parameswaran et al., 2008; Lamichhane et al., 2010).
Results
UQ Structure and Numbering
Figure 1 shows the structure and numbering scheme used here for UQn, MQ0, DQ, DMNQ, and VK. NQ's generally have a different numbering scheme. We have applied the UQ numbering scheme to DMNQ and VK for the sake of easy comparison. Figure 2 shows a picture of (A) DMNQ, (B) VK, (C) MQ0, and (D) UQ1 in the QA binding site along with the two H-bonding amino acids. The structures shown are after geometry optimization using ONIOM methods. Possible hydrogen bonds (or ligand to the non-heme iron atom) are indicated by dotted lines.
To gain a better sense of the relative orientation of the different quinones in the QA binding site Figure 2 also shows the (E) DMNQ/DQ and (F) DMNQ/UQ structures from two ONIOM calculations overlapped. These overlapped structures are created by considering the (fixed) atoms of the protein backbone. Figures 2E,F indicates that the side chains of HisM219 and AlaM260 are unaltered when a different quinone is incorporated into the binding site.
Table 1 lists several bond lengths and bond angles derived from our ONIOM calculated optimized geometries of the various quinones in the QA binding site. For comparison, Table 1 also lists corresponding bond lengths and angles derived from our DFT calculated optimized geometries of the various quinones in the gas phase. Table 1 also list results obtained from previous QM/MM calculations (Sinnecker et al., 2006), and data taken from the 1AIJ crystal structure (Stowell et al., 1997).
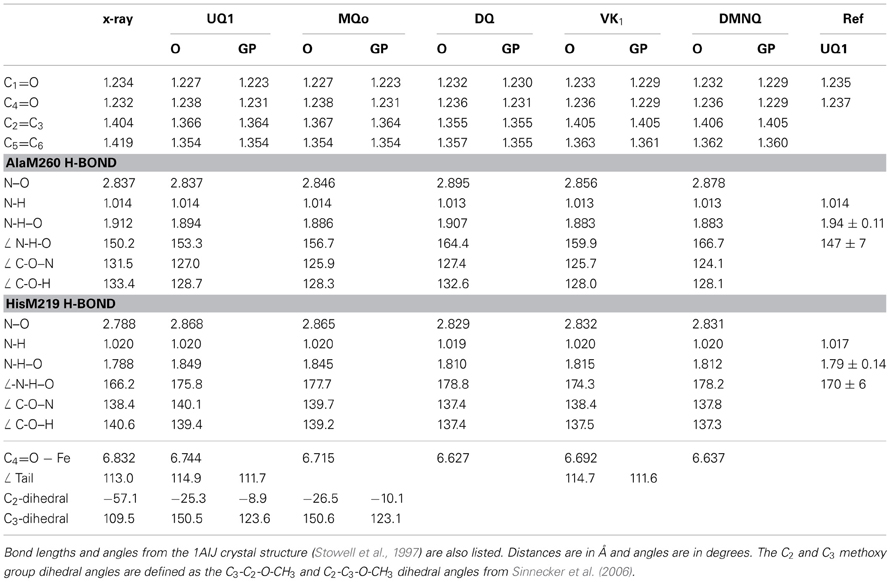
Table 1. Comparison of bond lengths and angles derived from the ONIOM calculated (O) and gas phase calculated (GP) optimized geometry of neutral UQ1, MQ0, DQ, VK, and DMNQ.
Table 1 list the three distances associated with the peptide or imidazole H-bond to the carbonyl oxygen atoms of the quinone (N-H, NH–O and N–O distances). These distances completely determine the N-H–O H-bond geometry. Associated angles are also listed in Table 1.
For UQ10 in the QA site the 1AIJ crystal structure (Stowell et al., 1997) indicates that the C1=O bond is marginally longer than the C4=O bond. (1.234 vs. 1.232 Å). In contrast, from ONIOM calculations of all the quinones listed in Table 1 the C1=O bond is shorter than the C4=O bond.
In gas phase calculations the C1=O and C4=O bond lengths are shorter than that found in ONIOM calculations (except the C1=O of DQ). This lengthening of the C=O bonds of the quinones in the QA binding site is related to hydrogen bonding and other electrostatic interactions of the pigment with the protein environment.
For UQ1 and MQ0 the C1=O bond is shorter than the C4=O bond in both ONIOM and gas phase calculations. In gas phase calculations this difference in C1=O and C4=O bond lengths of UQ1 and MQ0 must relate to the differing orientations of the C2 and C3 methoxy groups. The ONIOM calculated C2 and C3 methoxy group dihedral angles for UQ1 are −25.3 and 150.5° (Table 1). Similar angles are calculated for MQ0. The calculated dihedral angles for UQ1 in the gas phase, and the observed angles for UQ10 in the QA binding site (from the crystal structure) are within 32° of that calculated for UQ1 using ONIOM methods.
For UQ10 in the QA site the crystal structure indicates that the C2=C3 bond is shorter than the C5=C6 bond. (1.404 vs. 1.419 Å). In contrast, for all quinones except DQ, in both ONIOM and gas phase calculations the C2=C3 bond is longer than the C5=C6 bond. For VK and DMNQ the calculated C2=C3 and C5=C6 bond lengths are considerably different.
For UQ1 and VK the hydrocarbon chain attached at C6 makes a distinct “kink” after the first carbon atom (Figures 2B,D). The C-C-C bond angle is 112–115° for both quinones in both the ONIOM and gas phase calculations. The calculated angles are virtually the same as that found in the crystal structure. Given these similarities (between the ONIOM and gas phase calculations for both UQ1 and VK, as well as between calculation and experiment) the suggestion is that the protein environment does not constrain the orientation of the quinone ring relative to the C6 hydrocarbon chain.
Figure 3A shows ONIOM calculated 18O isotope edited difference spectra for neutral VK and DMNQ. Figure 3D shows corresponding DFT calculated spectra for VK and DMNQ in the gas phase. Experimental spectra are also shown (Figures 3B,C) for comparison. Positive/negative bands in the isotope edited spectra are due to the unlabeled/18O labeled quinone species, respectively. The ONIOM calculated spectra clearly better describe the experimental spectra. Calculations including the protein environment appear to be necessary in order to adequately simulate the experimental spectra.
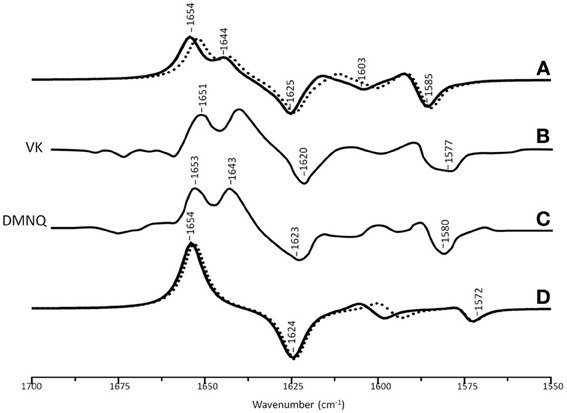
Figure 3. (A) ONIOM calculated 18O isotope edited DDS for neutral VK (dotted) and DMNQ (solid) in the QA binding site. Experimental spectra for VK (B) and DMNQ (C) are also shown, and were taken from Breton et al., (1994a), with permission. (D) DFT calculated 18O isotope edited DDS for neutral VK (dotted) and DMNQ (solid) are also shown. ONIOM/gas phase calculated spectra were scaled by 0.9718/0.9608, respectively.
In the DFT calculated 18O isotope edited spectrum for DMNQ/VK in the gas phase (Figure 3D) the antisymmetric vibration of both C=O groups gives rise to the band at ~1654 cm−1 (Figure 3D), which downshifts 30 cm−1 upon 18O labeling (Bandaranayake et al., 2006). The calculated isotope-edited gas phase spectrum is in excellent agreement with the experimental spectrum for DMNQ in solution (Breton et al., 1994a).
Figure 3 shows that except for a small frequency shift in some of the modes, the calculated spectra for DMNQ and VK are virtually the same. Replacement of the methyl group at C6 with an isoprene unit therefore, has no influence on the calculated spectra.
The normal modes (frequencies and intensities) that give rise to the various bands in the ONIOM calculated 18O isotope edited spectra of DMNQ and VK are listed in Table 2. The PEDs, which quantify to what extent various internal coordinates contribute to the normal modes, are also listed in Table 2. Results for DMNQ and VK are very similar. Below we will discuss calculated data obtained for DMNQ with the recognition that very similar results and conclusions also apply to VK.
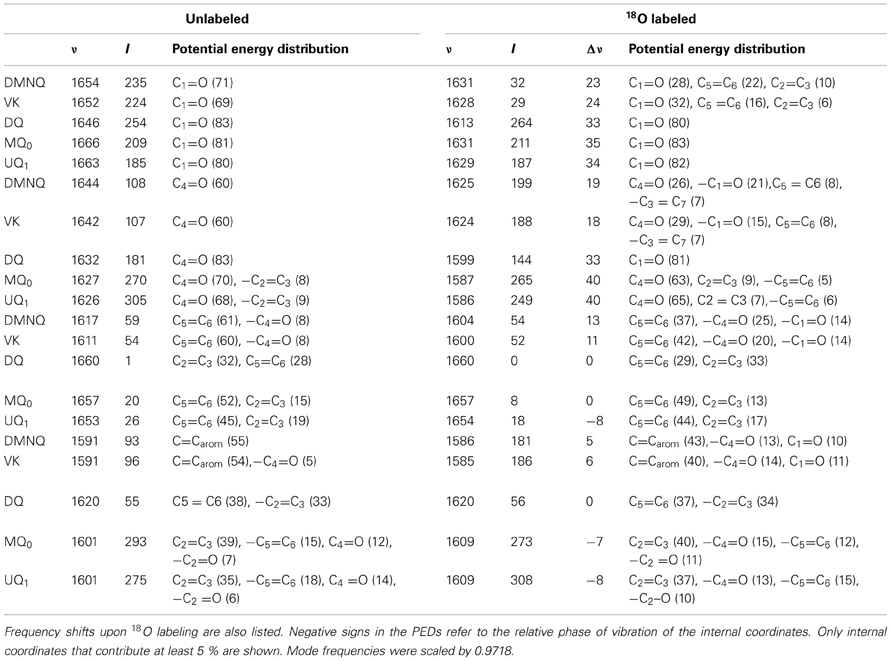
Table 2. Normal mode frequencies (in cm−1), intensities (in km/mol) and PEDs (in %) calculated using ONIOM methods for unlabeled and 18O labeled neutral DMNQ, VK, DQ, MQ0, and UQ1.
In the ONIOM calculated 18O isotope edited spectra for DMNQ the two bands at 1654 and 1644 cm−1 are due to C1=O and C4=O stretching vibrations, respectively (Table 2). These bands almost certainly correspond to the at 1653 and 1643 cm−1 bands in the experimental spectrum (Figure 3C). So our calculations predict that the 1653 and 1643 cm−1 bands in the experimental spectrum are due to C1=O and C4=O stretching vibrations, respectively. This is in fact the first direct evidence that the 1653 and 1643 cm−1 bands in the experimental spectrum are due to C1=O and C4=O stretching vibrations. A direct assignment has never been made because specific 13C1 and 13C4 isotopic labeled VK or DMNQ has never been incorporated into the QA binding site in PBRCs.
In contrast to the observation of two separate C=O modes in ONIOM calculations, in gas phase calculations the two C=O modes of DMNQ are anti-symmetrically coupled (Bandaranayake et al., 2006), giving rise to a single intense band at 1654 cm−1 (Figure 3D).
In ONIOM calculations it is found that upon 18O labeling the C1=O and C4=O modes of DMNQ downshift 23 and 19 cm−1, to 1631 and 1625 cm−1, respectively (Table 2). Upon 18O labeling the 1625 cm−1 mode is more than six times more intense than the 1631 cm−1 mode. The 1625 cm−1 mode in 18O labeled DMNQ is due mainly to the antisymmetric coupled vibration of both C=O groups. That is, two separate C=O modes of unlabeled DMNQ couple upon 18O labeling. This behavior is not predicted based upon consideration of the experimental spectra, where it is “assumed” that the two C=O modes remain separate upon 18O labeling (Breton et al., 1994b; Breton, 1997).
A C=C mode of the quinone ring of DMNQ is found at 1617 cm−1. This quinonic C=C mode downshifts 13 cm−1, to 1604 cm−1, upon 18O labeling, with little change in intensity. The 1604 cm−1 mode composition in 18O labeled DMNQ displays considerable mixing of the C=O and C=C modes (the C=O modes account for 39% of the PED). This behavior might be expected given that the C=O and C=C modes are closer in frequency upon 18O labeling.
A C=C mode of the aromatic ring of DMNQ occurs at 1591 cm−1. This aromatic C=C mode downshifts 5 cm−1 to 1586 cm−1 upon 18O labeling. The 1586 cm−1 mode in 18O labeled DMNQ displays some mixing with C=O modes (23%), and the intensity of the aromatic C=C mode nearly doubles upon 18O labeling. The calculated C=C normal modes and their interpretation in terms of internal coordinates, as well as the calculated 18O induced frequency shifts are similar to that suggested on the basis of the experimental spectra (Breton et al., 1994a).
Figure 4A shows ONIOM calculated 18O isotope edited IR difference spectra for neutral DQ in the QA binding site. Figure 4C shows the corresponding DFT calculated spectrum for DQ in the gas phase. The experimental spectrum is shown in Figure 4B. Again, the ONIOM calculated spectrum agrees well with the experimental spectrum while the calculated gas phase spectrum does not. The ONIOM calculated normal modes (frequencies and intensities) that give rise to the bands in the 18O isotope edited spectrum for DQ, as well as the PEDs, are listed in Table 2.
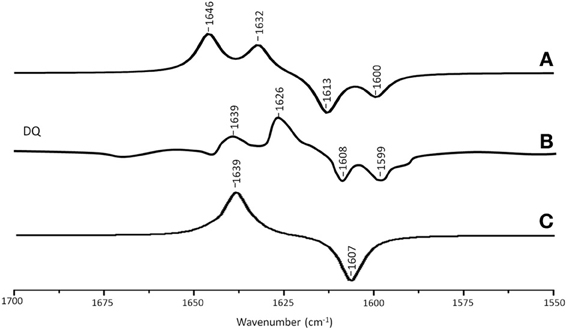
Figure 4. (A) ONIOM calculated 18O isotope edited DDS for neutral DQ in the QA binding site. Experimental spectra are shown in (B), and were taken from Breton et al., (1994a) with permission. (C) DFT calculated 18O isotope edited DDS for neutral DQ. ONIOM and gas phase calculated spectra were scaled by 0.9718 and 0.9608, respectively.
In the ONIOM calculated 18O isotope edited spectrum for DQ the two bands at 1646 and 1632 cm−1 are due to C1=O and C4=O stretching vibrations, respectively (Table 2). Upon 18O labeling the C4=O and C1=O modes both downshift 33 cm−1 with little change in mode intensities (Table 2). This 33 cm−1 downshift is large compared to that calculated for DMNQ (19–23 cm−1). For DQ, the ONIOM calculated mode composition is virtually unchanged upon 18O labeling. This is also markedly different to that calculated for DMNQ. The normal modes that give rise to the isotope edited spectra of DQ and DMNQ in the gas phase are very similar, so replacing the methyl groups of DQ with the aromatic ring of DMNQ in the QA binding site leads to an alteration in the electronic structure of the quinone ring. This modification is not obvious given the similar orientation of DQ and DMNQ in the QA binding site (Figure 2E).
In the DFT calculated 18O isotope edited spectrum for DQ in the gas phase, the two C=O modes are strongly coupled, and give rise to the band at 1639 cm−1 in Figure 4C. The calculated gas phase spectrum is in line with the experimental FTIR spectrum for DQ in solution (Breton et al., 1994a).
From ONIOM calculations for DQ, C=C modes do not couple with the C=O modes. The C2=C3 and C5=C6 groups couple to produce in phase and out of phase vibrational modes. The in phase mode has negligible IR intensity. The out of phase C=C mode is calculated to be at 1620 cm−1. This C=C mode is virtually unaltered in frequency, intensity, and mode composition upon 18O labeling (Table 2).
Figure 5A shows ONIOM calculated 18O isotope edited IR spectra for neutral MQ0 (solid) and UQ1 (dotted) in the QA binding site. Figure 5D shows DFT calculated spectra for MQ0 and UQ1 in the gas phase. The experimental spectra for UQ1 and MQ0 are shown in Figures 5B,C, respectively. The normal modes (frequencies and intensities) that give rise to the various bands in the ONIOM calculated spectra, as well as the PEDs, are listed in Table 2. The data for UQ1 has been presented previously (Lamichhane and Hastings, 2011), and we show here that very similar spectra are calculated for both MQ0 and UQ1. Replacement of an isoprene unit at C6 with a methyl group does not greatly alter the calculated spectra.
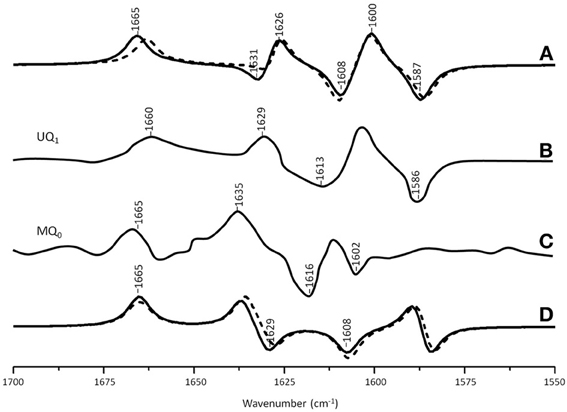
Figure 5. (A) ONIOM calculated 18O isotope edited DDS for neutral MQ0 (solid) and UQ1 (dotted) in the QA binding site. Experimental spectrum for (B) MQ0 and (C) UQ1 are also shown, and were taken from (Breton et al., 1994a) with permission. (D) DFT calculated 18O isotope edited DDS for neutral MQ0 (solid) and UQ1 (dotted). ONIOM and gas phase calculated spectra were scaled by 0.9718 and 0.9608, respectively.
In the ONIOM calculated 18O isotope edited spectra for neutral MQ0 the two bands at 1666 and 1627 cm−1 (Figure 5C) are due to C1=O and C4=O stretching vibrations, respectively (Table 2). Upon 18O labeling the C1=O and C4=O modes downshift 35 and 40 cm−1, respectively (Table 2). The mode intensities and composition are little altered by 18O labeling. The C=C mode of MQ0/UQ1 at 1601 cm−1 up-shifts 8/7 cm−1 upon 18O labeling (Table 2). An explanation for this 18O induced frequency upshift has been presented (Lamichhane and Hastings, 2011).
In the DFT calculated 18O isotope edited spectra for UQ1/MQ0 in the gas phase, the two C=O modes are well separated, and give rise to bands at ~1665 and ~1635 cm−1 (Figure 5D), which downshift 36 and 27 cm−1, respectively, upon 18O labeling, as described previously (Lamichhane et al., 2011).
Discussion
Previously we have shown that ONIOM methods can be used to calculate isotope edited difference spectra for UQ1 in the QA binding site, and that these calculated spectra model very well the corresponding experimental spectra (Lamichhane and Hastings, 2011). Here we considerably extend these studies, and show that ONIOM calculated isotope edited spectra for different quinones in the QA binding site model very well the corresponding experimental spectra. We further show that the calculated spectra for quinones in the gas phase are totally inappropriate for modeling the vibrational properties of quinones in the QA binding site. This is also very likely to be the case for modeling the properties of any protein bound pigment.
Without normal mode vibrational frequency calculations interpretation of experimental spectra is limited, and here we clearly show that our computational methods lead to a greatly increased understanding of the normal modes that contribute to the bands in the experimental spectra.
In our ONIOM calculations for neutral UQ1 in the QA binding site we considered all amino acids included in the model only at the molecular mechanics level of computation. Previously, ONIOM calculations have been undertaken in order to model EPR data associated with the UQ anion in the QA binding site (Lin and O'Malley, 2008). In these calculations key amino acids, such as HisM219 and AlaM260, were considered at the higher quantum mechanical level of calculation. Taken together these results may indicate differences in the nature of H-bonding for the neutral and anion UQ species. Changes in H-bonding upon radical formation may be a mechanism for (de)stabilizing cofactors to fine-tune electron transfer processes in biological systems. Clearly it will be useful to undertake calculations similar to that presented here (modeling isotope edited FTIR difference spectra) for the UQ anion in the QA binding site, and such calculations are underway in our lab. Based on the above one could argue that the methods used here, with only the quinone treated at the QM level, will be inadequate to simulate the experimental spectra associated with quinone anions in the QA binding site. Or, for simulating the vibrational properties of quinone anions in the QA binding site it will be necessary to treat key amino acids at a quantum mechanical level. Again, calculations are underway in our lab to test this proposal.
For the neutral state of quinones occupying the QA binding site, calculations with the H-bonding amino acids treated at the MM level lead to calculated spectra that are in excellent agreement with experimental spectra (Figures 3–5). Clearly, treating H-bonding amino acids quantum mechanically will not lead to improved modeling of the experimental spectra. We have in fact undertaken calculations in which neutral UQ and the H-bonding amino acids are treated using QM, and we have found that the calculated spectra are very similar to that obtained when only neutral UQ is treated using QM (and the surrounding amino acids are treated using MM) (Zhao et al., J. Phys. Chem. B in press). Thus, it is very clear that, at least for the case of neutral quinones occupying the QA binding site, and as far as modeling isotope edited FTIR spectra is concerned, QM/MM calculations with only the quinone treated at the QM level need to be considered.
An experimental 18O isotope edited FTIR difference spectrum for UQ in the QA binding site is shown in Figure 5B. Three positive bands at 1660, 1629, and 1601 cm−1 are observed. By considering FTIR difference spectra obtained using PBRCs with unlabeled and specifically 13C1 and 13C4 labeled UQ occupying the QA binding site, it was concluded that the 1660 and 1601 cm−1 bands are due to the C1=O and C4=O vibrations of unlabeled neutral UQ, respectively. It was also concluded that the 1628 cm−1 band is due to a UQ C=C vibration (Breton et al., 1994c). Since the C4=O mode was so massively downshifted (from ~1660 cm−1 for UQ in solvent to 1601 cm−1 for UQ in the QA binding site) it was suggested that this group must be engaged in very strong hydrogen bonding, presumably with HisM219 (Figure 2) (Breton et al., 1994c). This conclusion is difficult to rationalize based on the crystal structural data and other experimental data [see Wraight and Gunner (2009) for a review]. Such a conclusion is also not supported by the data presented here. Specifically, the C1=O and C4=O modes of DMNQ and VK are found at 1653 and 1643 cm−1 (Table 2), respectively, compared to ~1662 cm−1 for the coupled C=O vibration in solution (Bandaranayake et al., 2006). Thus, the C1=O/C4= O mode of DMNQ or VK in the QA site is downshifted 9/19 cm−1, respectively, compared to that found in solution. Such shifts suggest that both C=O modes of DMNQ or VK are H-bonded in the QA site, albeit quite weakly.
From the experimental spectrum of VK (or DMNQ) in Figure 3B two positive bands are observed at 1651 and 1640 cm−1 and one negative band at 1620 cm−1. The two C=O modes of unlabeled VK give rise to the positive bands at 1651 and 1640 cm−1, but only a single band is observed at 1620 cm−1 upon 18O labeling. Two interpretations for these observations have been proposed (Breton et al., 1994b). One suggestion is that upon 18O labeling the 1640 cm−1 band downshifts to ~1620 cm−1, while the 1651 cm−1 band downshifts to near 1640 cm−1 and decreases in intensity. The negative band near 1640 cm−1 due to a C = 18O group of VK is then masked by the positive band (also at 1640 cm−1) due to the unlabeled C=O group. A second hypothesis is that the two C=O modes of unlabeled VK (at 1651 and 1640 cm−1) both downshift to ~1620 cm−1 upon 18O labeling. The different 18O induced shifts of the two C=O modes results from differential coupling to C=C modes.
The calculated data presented here allow us to address which of these interpretations could be appropriate, or if either is appropriate. The ONIOM calculations show that the C1=O and C4=O modes of unlabeled VK occur at 1652 and 1642 cm−1, and that neither of these modes are coupled to C=C modes (Table 2). Upon 18O labeling the C1=O/C4=O mode downshifts 24/18 cm−1, respectively. The modes of 18O labeled VK also display considerable coupling with C=C modes. Upon 18O labeling the C1=O/C4=O group couples with C=Cring in-phase/out-of-phase vibrations, respectively. Coupling of the C4=O group to the out of phase C=C vibration leads to a large intensity enhancement, while coupling of the C1=O group to the in-phase C=C vibration leads to a large intensity decrease (Table 2). So, the calculations indicate that two separate uncoupled C=O modes in unlabeled VK give rise to predominantly a single mixed mode (that carries most of the intensity) in 18O labeled VK. These calculated results indicate that neither of the two previously proposed interpretations of the experimental spectra is correct. Clearly, the calculations presented here allow a more detailed insight into the nature of the bands in the experimental isotope edited FTIR difference spectra.
Experimentally, the vibrational modes of DMNQ are at a slightly higher frequency (~3 cm−1) than corresponding modes of VK. Presumably replacing the C6 methyl group with a phytyl unit causes this difference. Interestingly, this small frequency difference in the modes of DMNQ and VK is also found in our ONIOM calculated spectra (compare spectra in Figures 5C,B). This result is not entirely specific to the ONIOM method, however, as a small shift is also found in the gas phase calculations (Figure 3D).
The C1=O and C4=O modes of DMNQ and VK are calculated to be separated by 10 cm−1. This separation cannot be due to differences in the molecular group attached at C6. It must be due to differences in how the two C=O groups interact with the protein. Similarly, the two C=O modes of DQ are calculated to be separated by 13 cm−1, and this separation is also likely due to differences in how the two C=O groups of DQ interact with the protein.
For UQ1 (and MQ0) the separation of the C=O modes is ~32 cm−1 (1660–1628). Some of the differences in frequency of the C=O modes of UQ are due to the different orientation of the methoxy groups. If we assume that protein interactions with the C=O groups gives rise to a 13 cm−1 separation in the frequencies of the two C=O modes then this would indicate that the difference in the orientation of the methoxy groups of UQ (or MQ0) gives rise to a frequency difference of 19 cm−1 for the two C=O groups. This result is in quite good agreement with results from experimental spectra of UQ in solution, which show that the two C=O modes are separated by ~16 cm−1 (Breton et al., 1994c; Brudler et al., 1994).
Normal mode vibrational frequencies are governed by molecular bonding force constants. These force constants relate to the electronic structure of the molecule. Since the calculated and experimental spectra for DMNQ and VK are virtually the same it is concluded that the replacing the phytyl unit at C6 of VK with a methyl group does not appreciably perturb the electronic structure of the NQ ring. In addition, the tail does not perturb the protein in a way that significantly modifies any pigment protein interactions.
In VK and UQ1, the “kink” in the hydrocarbon chain after the first carbon atom is 3.1–3.2° higher in ONIOM calculations compared to gas phase calculations. It seems therefore, that the hydrocarbon chain is somewhat constrained relative to the quinone ring when incorporated into the QA binding site. It is not clear if this is a significant constraint, however. The C1=O and C4=O bonds of MQ0 and UQ1 (and of DMNQ and VK) are virtually unaltered in ONIOM calculations (Table 1). The hydrogen bond lengths for the C=O groups are also little altered (Table 1). The distance of the C4=O oxygen to the non heme iron atom is 0.029/0.055 Å longer for UQ1/VK compared to MQ0/DMNQ, respectively, suggesting a very small change in orientation of the UQ1/VK head-group (since the iron atom is fixed) compared to MQ0/DMNQ in the QA binding site. The hydrocarbon chain may therefore, lead to a very slight change in the orientation of the quinone ring in the QA binding site. Figure 2F shows that there is only a very small difference in the orientation of DMNQ relative to UQ1.
The experimental 18O isotope edited spectra for MQ0 and UQ1 are quite different (compare Figures 5B,C). This difference cannot be modeled computationally (Figure 5A). The experimental isotope edited spectrum for MQ0 is considerably noisier than the spectrum for UQ (Breton et al., 1994a). As far as we are aware the Q−A/QA FTIR difference spectrum for RCs with MQ0 in the binding site have never been reproduced, so the accuracy of the spectrum may be somewhat questionable. On the other hand MQ0 may be able to incorporate into the QA binding site with the methoxy groups oriented in several different ways. As described previously, each of these methoxy group conformers will have slightly different spectra (Lamichhane et al., 2010). This heterogeneity in orientation of MQ0 in the QA binding site may be a factor that contributes to differences in the experimental spectra for MQ0 and UQ, as demonstrated in Figures 5B,C. In spite of this, there are some overall similarities in the MQ0 and UQ1 experimental spectra in Figures 5B,C. For the MQ0 spectrum positive bands are found at 1665, 1631, and 1608 cm−1. For UQ1 the bands are at 1660, 1628, and 1601 cm−1. For the MQ0 spectrum negative bands are found at 1616 and 1602 cm−1. For UQ the bands are at 1613 and 1586 cm−1.
The ONIOM calculated and experimental isotope edited spectra for VK are very similar, although the intensity ratios of the different bands do not appear to match well. For example, the intensity ratio of 1652 and 1644 cm−1 bands in the calculated spectrum (Figure 3A, dotted) is ~2.1, compared to a ratio of ~0.95 in the experimental spectrum. To investigate this further we have also calculated the 13C isotope edited spectrum for VK in the QA binding site (Figure 6A) (global 13C labeling of VK), and compared it to the corresponding experimental spectrum (Figure 6B). For completeness the calculated 13C isotope edited spectrum for VK in the gas phase is shown in Figure 6C. Again, it is evident that the calculated gas phase spectrum in no way resembles the experimental spectrum (compare Figures 6B,C). The normal modes (frequencies, intensities, and PEDs) that give rise to the various bands in the ONIOM calculated 13C isotope edited spectra of VK in Figure 6A are listed in Table 3.
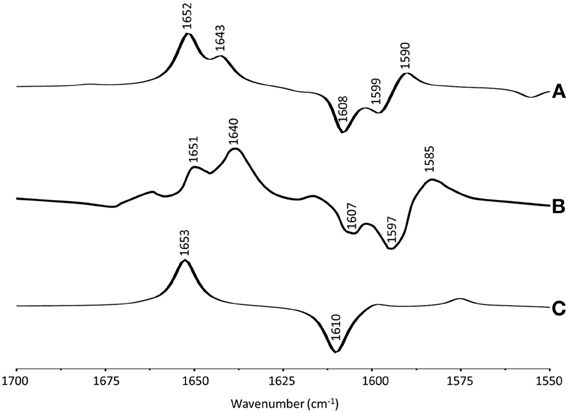
Figure 6. (A) ONIOM calculated 13C isotope edited DDS for neutral VK in the QA binding site. Experimental spectrum is also shown (B), taken from (Breton, 1997) (with permission). (C) DFT calculated 13C isotope edited DDS for neutral VK in the gas phase. ONIOM and gas phase calculated spectra were scaled by 0.9718 and 0.9608, respectively.
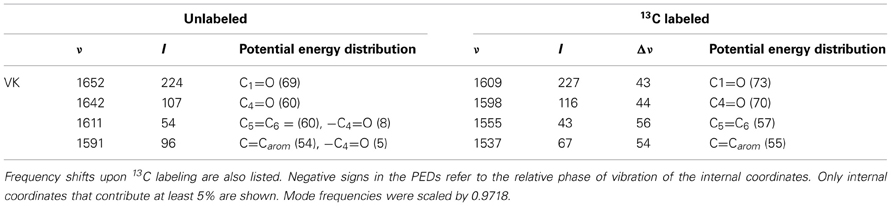
Table 3. Normal mode frequencies (in cm−1), intensities (in km/mol) and PEDs (in %) calculated using ONIOM methods for unlabeled and 13C labeled neutral VK.
Notice that the ONIOM calculation predicts that the two C=O modes remain completely separate (do not mix) upon 13C labeling (Table 3), which is unlike the behavior observed for the C=O modes upon 18O labeling (see above). Also notice that in the experimental isotope edited spectrum (Figure 6B) the 1640 cm−1 band is now considerably more intense than the 1651 cm−1 band, whereas in the calculated spectrum the higher frequency band is considerably more intense. The origin of these mode intensity differences are not entirely clear and are currently being investigated by considering calculations associated with VK in the presence of various types of H-bonding molecules.
Conclusions
We have shown that ONIOM type QM/MM calculations can be used to model experimental isotope edited FTIR difference spectra obtained using PBRCs that have had several different quinones incorporated into the QA binding site. The fact that the many different spectra can all be modeled is a clear indicator of the appropriateness of the approach.
The calculated spectra appear not to depend on whether the quinone incorporated has a prenyl/phytyl unit or a methyl group attached at C6. The electronic structure of the quinone ring is therefore, not sensitive to the presence or absence of a hydrocarbon side chain at C6. This suggests that the hydrocarbon side chain does not significantly constrain the quinone ring in the QA binding site.
Comparison of the calculated and experimental spectra, in combination with a consideration of the calculated PEDs of the normal modes, allows a direct assessment of the appropriateness of previous suggestions as to the origin of the bands in the experimental spectra.
Conflict of Interest Statement
The authors declare that the research was conducted in the absence of any commercial or financial relationships that could be construed as a potential conflict of interest.
Acknowledgments
This work was supported in part by a grant from the Qatar National Research Fund to Gary Hastings (grant # NPRP 4-183-1-034). Nan Zhao acknowledges support from a fellowship from the Molecular Basis of Disease program at GSU. Calculations were undertaken using the IBM System p7 supercomputer (called CARINA) at GSU. This computer was acquired through a partnership of the Southeastern Universities Research Association and IBM, with additional support from the Georgia Research Alliance.
Abbreviations
Ala, alanine; DS, difference spectra/spectrum spectroscopy or spectroscopic; C=O, carbonyl; DQ, duroquinone or 2,3,5,6-tetramethyl-1,4-benzoquinone; DFT, density functional theory; DMNQ, dimethyl naphthoquinone; ET, electron transfer; FTIR, Fourier Transform Infra-red; H-bond, hydrogen bond; His, histidine; MQ0, 2,3-dimethoxy-5,6-dimethyl-1,4-benzoquinone; MM, molecular mechanics; NQ, naphthoquinone; PQ, plastoquinone; PBRC, purple bacterial reaction center; PED, potential energy distribution; Rb., Rhodobacter; QM, quantum mechanics; UQn, ubiquinone-n; VK, vitamin K1 (phylloquinone).
References
Bandaranayake, K., Sivakumar, V., Wang, R., and Hastings, G. (2006). Modeling the A1 binding site in photosystem I. Density functional theory for the calculation of “Anion – Neutral” FTIR difference spectra of phylloquinone. Vib. Spectrosc. 42, 78–87. doi: 10.1016/j.vibspec.2006.01.003
Breton, J. (1997). Efficient exchange of the primary quinone acceptor QA in isolated reaction centers of Rhodopseudomonas viridis. Proc. Natl. Acad. Sci. U.S.A. 94, 11318–11323. doi: 10.1073/pnas.94.21.11318
Breton, J., Burie, J. R., Boullais, C., Berger, G., and Nabedryk, E. (1994a). Binding sites of quinones in photosynthetic bacterial reaction centers investigated by light-induced FTIR difference spectroscopy: binding of chainless symmetrical quinones to the QA site of Rhodobacter sphaeroides. Biochemistry 33, 12405–12415. doi: 10.1021/bi00207a007
Breton, J., Burie, J. R., Berthomieu, C., Berger, G., and Nabedryk, E. (1994b). The binding sites of quinones in photosynthetic bacterial reaction centers investigated by light-induced FTIR difference spectroscopy: assignment of the QA vibrations in Rhodobacter sphaeroides using 18O- or 13C-labeled ubiquinone and vitamin K1. Biochemistry 33, 4953–4965. doi: 10.1021/bi00182a026
Breton, J., Boullais, C., Burie, J. R., Nabedryk, E., and Mioskowski, C. (1994c). Binding sites of quinones in photosynthetic bacterial reaction centers investigated by light-induced FTIR difference spectroscopy: assignment of the interactions of each carbonyl of QA in Rhodobacter sphaeroides using site-specific 13C-labeled ubiquinone. Biochemistry 33, 14378–14386. doi: 10.1021/bi00252a002
Breton, J., and Nabedryk, E. (1996). Protein-quinone interactions in the bacterial photosynthetic reaction center: light-induced FTIR difference spectroscopy of the quinone vibrations. Biochim. Biophys. Acta. 1275, 84–90. doi: 10.1016/0005-2728(96)00054-0
Brudler, R., de Groot, H. J., van Liemt, W. B., Steggerda, W. F., Esmeijer, R., Gast, P., et al. (1994). Asymmetric binding of the 1- and 4-C=O groups of QA in Rhodobacter sphaeroides R26 reaction centres monitored by Fourier transform infra-red spectroscopy using site-specific isotopically labelled ubiquinone-10. EMBO J. 13, 5523–5530.
Case, D. A., Cheatham, T. E., Darden, T., Gohlke, H., Luo, R., Merz, K. M., et al. (2005). The Amber biomolecular simulation programs. J. Comput. Chem. 26, 1668–1688. doi: 10.1002/jcc.20290
Frisch, M. J., Trucks, G. W., Schlegel, H. B., Scuseria, G. E., Robb, M. A., Cheeseman, J. R., et al. (2004). Gaussian 03, Revision C.02. Gaussian 03, Revision D.01.
Hale, M. B., Blankenship, R. E., and Fuller, R. C. (1983). Menaquinone is the sole quinone in the facultatively aerobic green photosynthetic bacterium Chloroflexus aurantiacus. Biochim. Biophys. Acta 723, 376–382. doi: 10.1016/0005-2728(83)90044-0
Hucke, O., Schmid, R., and Labahn, A. (2002). Exploring the primary electron acceptor (QA)-site of the bacterial reaction center from Rhodobacter sphaeroides. Binding mode of vitamin K derivatives. Eur. J. Biochem. 269, 1096–1108. doi: 10.1046/j.0014-2956.2001.02699.x
Ke, B. (2001a). “The bacterial photosynthetic reaction center: chemical composition and crystal structure,” in Photosynthesis: Photobiochemistry and Photobiophysics, (Dordrecht; Boston: Kluwer Academic Publishers), 47–62.
Ke, B. (2001b). “The stable primary acceptor QA and the secondary electron acceptor QB,” in Photosynthesis: Photobiochemistry and Photobiophysics, (Dordrecht; Boston: Kluwer Academic Publishers), 289–304.
Ke, B. (2001c). “The “Stable” primary electron acceptor (QA) of photosynthetic bacteria,” in Photosynthesis: Photobiochemistry and Photobiophysics, (Dordrecht; Boston: Kluwer Academic Publishers), 101–110.
Ke, B. B. (2001d). “The secondary electron acceptor (QB) of photosynthetic bacteria,” in Photobiochemistry and Photobiophysics, (Dordrecht; Boston: Kluwer Academic Publishers), 111–128.
Lamichhane, H. P., and Hastings, G. (2011). Calculated vibrational properties of pigments in protein binding sites. Proc. Natl. Acad. Sci. U.S.A. 108, 10526–10531. doi: 10.1073/pnas.1104046108
Lamichhane, H. P., and Hastings, G. (2013). Calculated vibrational properties of ubisemiquinones. Comput. Biol. J. 2013:11. doi: 10.1155/2013/807592
Lamichhane, H., Wang, R., and Hastings, G. (2010). Comparison of calculated and experimental FTIR spectra of specifically labeled ubiquinones. Vib. Spectrosc. 55, 279–286. doi: 10.1016/j.vibspec.2010.12.008
Lamichhane, H., Wang, R. L., and Hastings, G. (2011). Comparison of calculated and experimental FTIR spectra of specifically labeled ubiquinones. Vib. Spectrosc. 55, 279–286. doi: 10.1016/j.vibspec.2010.12.008
Lin, T., and O'Malley, P. (2008). An ONIOM study of the Q(A) site semiquinone in the Rhodobacter sphaeroides photosynthetic reaction centre. J. Mol. Struct. Theochem. 870, 31–35. doi: 10.1016/j.theochem.2008.08.034
McComb, J. C., Stein, R. R., and Wraight, C. A. (1990). Investigations on the influence of headgroup substitution and isoprene side-chain length in the function of primary and secondary quinones of bacterial reaction centers. Biochim. Biophys. Acta 1015, 156–171. doi: 10.1016/0005-2728(90)90227-U
Noguchi, T., and Berthomieu, C. (2005). “Molecular analysis by vibrational spectroscopy,” in Photosystem II The Light Driven Water:Plastoquinone Oxidoreductase, eds T. Wydrzynski and K. Satoh (Dordrecht: Springer), 367–387.
Parameswaran, S., Wang, R., and Hastings, G. (2008). Calculation of the vibrational properties of chlorophyll a in solution. J. Phys. Chem. B 112, 14056–14062. doi: 10.1021/jp806115q
Shopes, R. J., and Wraight, C. A. (1985). The acceptor quinone complex of Rhodopseudomonas viridis reaction centers. Biochim. Biophys. Acta 806, 348–356. doi: 10.1016/0005-2728(85)90242-7
Sinnecker, S., Flores, M., and Lubitz, W. (2006). Protein-cofactor interactions in bacterial reaction centers from Rhodobacter sphaeroides R-26: effect of hydrogen bonding on the electronic and geometric structure of the primary quinone. A density functional theory study. Phys. Chem. Chem. Phys. 8, 5659–5670. doi: 10.1039/b612568a
Srinivasan, N., and Golbeck, J. H. (2009). Protein-cofactor interactions in bioenergetic complexes: the role of the A1A and A1B phylloquinones in Photosystem I. Biochim. Biophys. Acta 1787, 1057–1088. doi: 10.1016/j.bbabio.2009.04.010
Stowell, M. H., McPhillips, T. M., Rees, D. C., Soltis, S. M., Abresch, E., and Feher, G. (1997). Light-induced structural changes in photosynthetic reaction center: implications for mechanism of electron-proton transfer. Science 276, 812–816. doi: 10.1126/science.276.5313.812
Trumpower, B. (1982). Function of Quinones in Energy Conserving Systems. New York, NY: Academic Press.
Vreven, T., Byun, K. S., Komaromi, I., Dapprich, S., Montgomery, J. A., Morokuma, K., et al. (2006). Combining quantum mechanics methods with molecular mechanics methods in ONIOM. J. Chem. Theory Comput. 2, 815–826. doi: 10.1021/ct050289g
Warncke, K., Gunner, M. R., Braun, B. S., Gu, L. Q., Yu, C. A., Bruce, J. M., et al. (1994). Influence of hydrocarbon tail structure on quinone binding and electron-transfer performance at the Q(a) and Q(B) sites of the photosynthetic reaction-center protein. Biochemistry 33, 7830–7841. doi: 10.1021/bi00191a010
Keywords: ONIOM, FTIR, QA, quinone, reaction center, density functional theory (DFT) calculations
Citation: Zhao N, Lamichhane HP and Hastings G (2013) Comparison of calculated and experimental isotope edited FTIR difference spectra for purple bacterial photosynthetic reaction centers with different quinones incorporated into the QA binding site. Front. Plant Sci. 4:328. doi: 10.3389/fpls.2013.00328
Received: 29 June 2013; Paper pending published: 17 July 2013;
Accepted: 02 August 2013; Published online: 30 August 2013.
Edited by:
Harvey J. M. Hou, Alabama State University, USAReviewed by:
Suleyman I. Allakhverdiev, Russian Academy of Sciences, RussiaArt Van Der Est, Brock University, Canada
Copyright © 2013 Zhao, Lamichhane and Hastings. This is an open-access article distributed under the terms of the Creative Commons Attribution License (CC BY). The use, distribution or reproduction in other forums is permitted, provided the original author(s) or licensor are credited and that the original publication in this journal is cited, in accordance with accepted academic practice. No use, distribution or reproduction is permitted which does not comply with these terms.
*Correspondence: Gary Hastings, Department of Physics and Astronomy, Georgia State University, 26 Park Place, Suite 605., Atlanta, GA 30303, USA e-mail: ghastings@gsu.edu