 Yongsheng Zhang1,2,3
 Guang Zhang
- 1Health Management Center, The First Affiliated Hospital of Shandong First Medical University and Shandong Provincial Qianfoshan Hospital, Jinan, China
- 2Institute of Health Management, The First Affiliated Hospital of Shandong First Medical University and Shandong Provincial Qianfoshan Hospital, Jinan, China
- 3Shandong Engineering Laboratory of Health Management, The First Affiliated Hospital of Shandong First Medical University and Shandong Provincial Qianfoshan Hospital, Jinan, China
- 4Department of Pharmacology, Jinan Central Hospital Affiliated to Shandong First Medical University, Jinan, China
Objectives: An accurate prediction model for hyperuricemia (HUA) in adults remain unavailable. This study aimed to develop a stacking ensemble prediction model for HUA to identify high-risk groups and explore risk factors.
Methods: A prospective health checkup cohort of 40899 subjects was examined and randomly divided into the training and validation sets with the ratio of 7:3. LASSO regression was employed to screen out important features and then the ROSE sampling was used to handle the imbalanced classes. An ensemble model using stacking strategy was constructed based on three individual models, including support vector machine, decision tree C5.0, and eXtreme gradient boosting. Model validations were conducted using the area under the receiver operating characteristic curve (AUC) and the calibration curve, as well as metrics including accuracy, sensitivity, specificity, positive predictive value, negative predictive value, and F1 score. A model agnostic instance level variable attributions technique (iBreakdown) was used to illustrate the black-box nature of our ensemble model, and to identify contributing risk factors.
Results: Fifteen important features were screened out of 23 clinical variables. Our stacking ensemble model with an AUC of 0.854, outperformed the other three models, support vector machine, decision tree C5.0, and eXtreme gradient boosting with AUCs of 0.848, 0.851 and 0.849 respectively. Calibration accuracy as well as other metrics including accuracy, specificity, negative predictive value, and F1 score were also proved our ensemble model’s superiority. The contributing risk factors were estimated using six randomly selected subjects, which showed that being female and relatively younger, together with having higher baseline uric acid, body mass index, γ-glutamyl transpeptidase, total protein, triglycerides, creatinine, and fasting blood glucose can increase the risk of HUA. To further validate our model’s applicability in the health checkup population, we used another cohort of 8559 subjects that also showed our ensemble prediction model had favorable performances with an AUC of 0.846.
Conclusion: In this study, the stacking ensemble prediction model for HUA was developed, and it outperformed three individual models that compose it (support vector machine, decision tree C5.0, and eXtreme gradient boosting). The contributing risk factors were identified with insightful ideas.
Introduction
Hyperuricemia (HUA) is a disease characterized by elevated blood uric acid due to disorders of purine metabolism and/or impaired uric acid excretion in the body. In recent years, the prevalence and disease burden of HUA have gradually increased globally (Dehlin et al., 2020), and a cross-sectional study shows that the overall prevalence of HUA in China has increased from 11.1% to 14.0% within 3 years, which demonstrates a significant ascending trend (Zhang et al., 2021). Many studies indicate that HUA often develops into gout and is closely related to the development of cardiovascular diseases, hypertension, obesity and other diseases (Maloberti et al., 2020; McCormick et al., 2022; Han et al., 2023; Lin et al., 2024), which has become a serious public health problem.
Machine learning is a type of artificial intelligence that enables computer to automatically extract useful information from large amounts of data and make intelligent decisions and predictions. Ensemble learning is one of the machine learning strategies that aggregate the power of multiple models to enhance prediction. There are three main types of ensemble learning algorithms: bagging, boosting, and stacking, each with its unique way of model combination (Zhou, 2021). Stacking trains multiple first-level models with different algorithms on the same dataset and combines their predictions using a second-level model, known as the meta-learner, to produce one more accurate and robust prediction (Mahajan et al., 2023). We aimed to use the stacking ensemble technique to build an accurate HUA risk prediction model, integrating the results of support vector machine (SVM), decision tree C5.0 (C5.0), and eXtreme gradient boosting (XGBoost) to improve the final performance.
Thus far, various studies worldwide have identified different risk factors associated with the occurrence of HUA, such as age, gender, waist circumference, drinking, smoking, obesity, hypertension, dyslipidemia and triglyceride-glucose index (Dong et al., 2022; Piao et al., 2022; Wang et al., 2022; Ding et al., 2023; Lyu et al., 2023; Teramura et al., 2023; Liu et al., 2024). Moreover, several prediction models for HUA have been developed using machine learning algorithms (Lee et al., 2019; Zeng et al., 2020; Gao et al., 2021; Huang et al., 2022; Zhu et al., 2023). However, these models were either tailored for specific subgroup or did not incorporate sufficient predictors. Additionally, none of them attempted the ensemble approach, resulting in poor predictive performance and a lack of practical application. Therefore, it is very necessary to develop a more accurate prediction model for the risk of HUA using the ensemble strategy and develop an easy-to-use risk calculator for clinical settings.
In the following sections, we initiate with an overview of the research methodology, encompassing the study population, data preprocessing, and all the statistical methods. Then, we present a statistical description of the study population, detailing the feature selection, model construction, and evaluation processes, unveiling the black box our model, and building a risk calculator. At last, we engage in an extensive discussion highlighting the superiority of our methods, comparing our model with existing ones, and delving into the risk factors.
Materials and methods
Study design and participants
This study was a prospective cohort study based on a large longitudinal health checkup cohort in the First Affiliated Hospital of Shandong First Medical University and was approved by the Ethics Committee of this hospital. Subjects without HUA at their first checkup in the year 2021 and without any missing variables were enrolled. All subjects were followed up for 1 year, and their HUA status were checked at the end of follow up in the year of 2022.
Data collection and preprocessing
By reviewing previous studies, we identified 23 variables from routine health checkup data that are possibly associated with HUA. They were age, gender, body mass index (BMI), systolic blood pressure (SBP), diastolic blood pressure (DBP), alanine aminotransferase (ALT), aspartate aminotransferase (AST), γ-glutamyl transpeptidase (GGT), total bilirubin (TBil), total protein (TP), albumin (Alb), blood urea nitrogen (BUN), creatinine (Cr), estimated glomerular filtration rate (EGFR), triglycerides (TG), total cholesterol (TC), high-density lipoprotein cholesterol (HDL), low-density lipoprotein cholesterol (LDL), fasting blood glucose (FBG), white blood cell count (WBC), neutrophil count (NEUT), baseline uric acid (BUA) and the fatty liver status. BMI was determined as dividing the weight (kg) by the square of the height (m2). SBP and DBP were measured on the right upper arm after the subjects seated for a 5-min rest. After a 12-h fasting period, peripheral blood samples were collected in the morning to measure the following blood variables: ALT, AST, GGT, TBil, TP, Alb, BUN, Cr, EGFR, TG, TC, HDL, LDL, FBG, WBC, NEUT and BUA. All laboratory tests were performed following standard protocols at the Department of Laboratory. Fatty liver status was diagnosed by certified imaging physicians through abdominal ultrasound examination. The diagnostic threshold for HUA was established as serum uric acid level of 420 μmol/L for males and 360 μmol/L for females (Endocrinology, 2020).
Statistical analysis
Descriptive analysis for the baseline characteristics was performed. Statistical significance for quantitative data was evaluated using Student’s t-test or nonparametric Wilcoxon test, and the Chi-square test was employed for the qualitative data.
Prediction model was constructed and evaluated, as shown in Figure 1. Firstly, the final dataset was randomly divided into the training set, comprising 70% of the subjects, and the validation set, comprising the remaining 30% (Lyu et al., 2020; Chen et al., 2021). Then, we utilized LASSO regression for feature selection (Friedman et al., 2010; Sauerbrei et al., 2011), and screened 15 important features among the 23 clinical variables by adding a penalty function. Next, to handle the disparity in the frequencies of the observed classes and generate a steady prediction model, the ROSE sampling from the R ROSE package was used (Nicola et al., 2014), which down-sampled the majority class and synthesized new data in the minority class. Then, our models were trained using the platform provided by the R caretEnsemble package. The SVM, C5.0, XGBoost, and the stacking ensemble model assembling these three models were developed based on the training set using 15 selected features. Then, we conducted internal validation of our models using the validation set and obtained estimates of the area under the receiver operating characteristic curve (AUC) as well as multiple metrics for evaluating the performance of our models, including accuracy, sensitivity, specificity, positive predictive value (PPV), negative predictive value (NPV) and F1 score. At the same time, the calibration curve of each model was depicted. All of the above evaluations were employed to assess the discrimination of our models, which refers to their ability to effectively distinguish between individuals who had high risks of diseases and those who did not. Furthermore, a model agnostic instance level variable attributions technique (iBreakdown) was used to illustrate the black-box nature of our ensemble model (Gosiewska and Biecek, 2019), and contributing risk factors were identified. Lastly, we developed a dynamic risk calculator based on the R shiny package for ease of clinical use, and further estimated its validity using decision curve analysis.
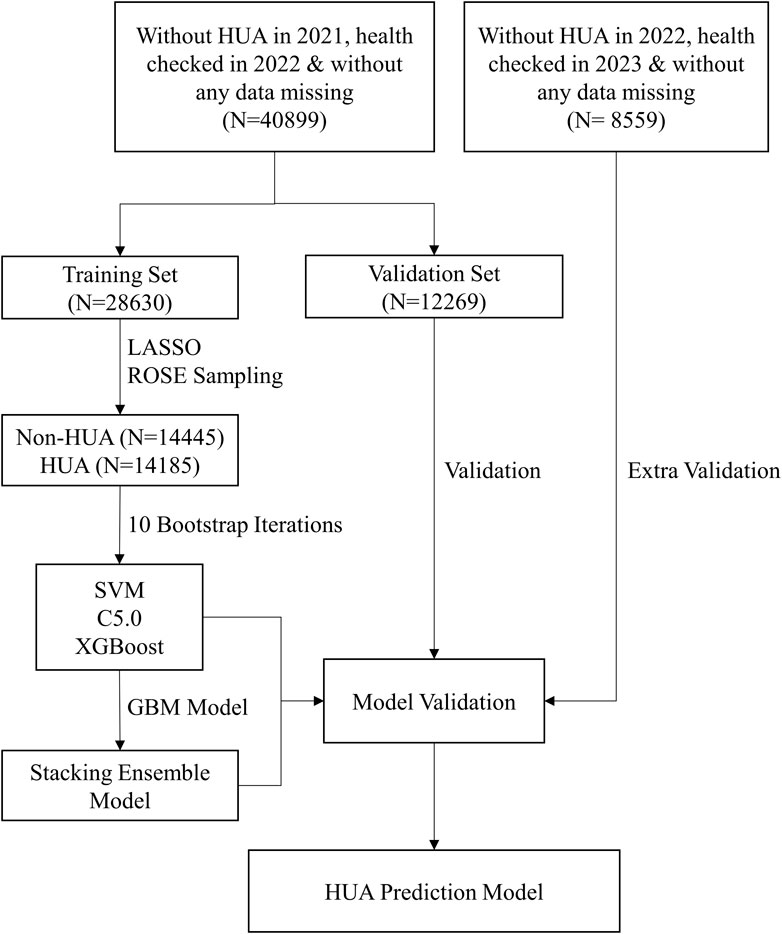
Figure 1. The flowchart of our ensemble prediction model. Abbreviations: HUA, hyperuricemia; SVM, support vector machine; C5.0, decision tree C5.0; XGBoost, eXtreme gradient boosting; GBM, gradient boosting machine model.
All statistical tests were two-sided with a type I error of 0.05, and p-value <0.05 were considered statistically significant. Statistical analysis was carried out using software R version 4.2.2 and Python version 3.10.8.
Results
Baseline characteristics
For the health checkup cohort of 40899 subjects, the mean (SD) ages for males and females were 47.4 (14.0) and 45.4 (13.6) years old, respectively. At the end of the follow-up period, 4055 HUA cases (2770 males and 1285 females) were diagnosed, resulting in an incidence rate of 99.15/1000 person-years. The baseline characteristics of 36844 non-HUA subjects and 4055 HUA subjects were listed below, as shown in Table 1.
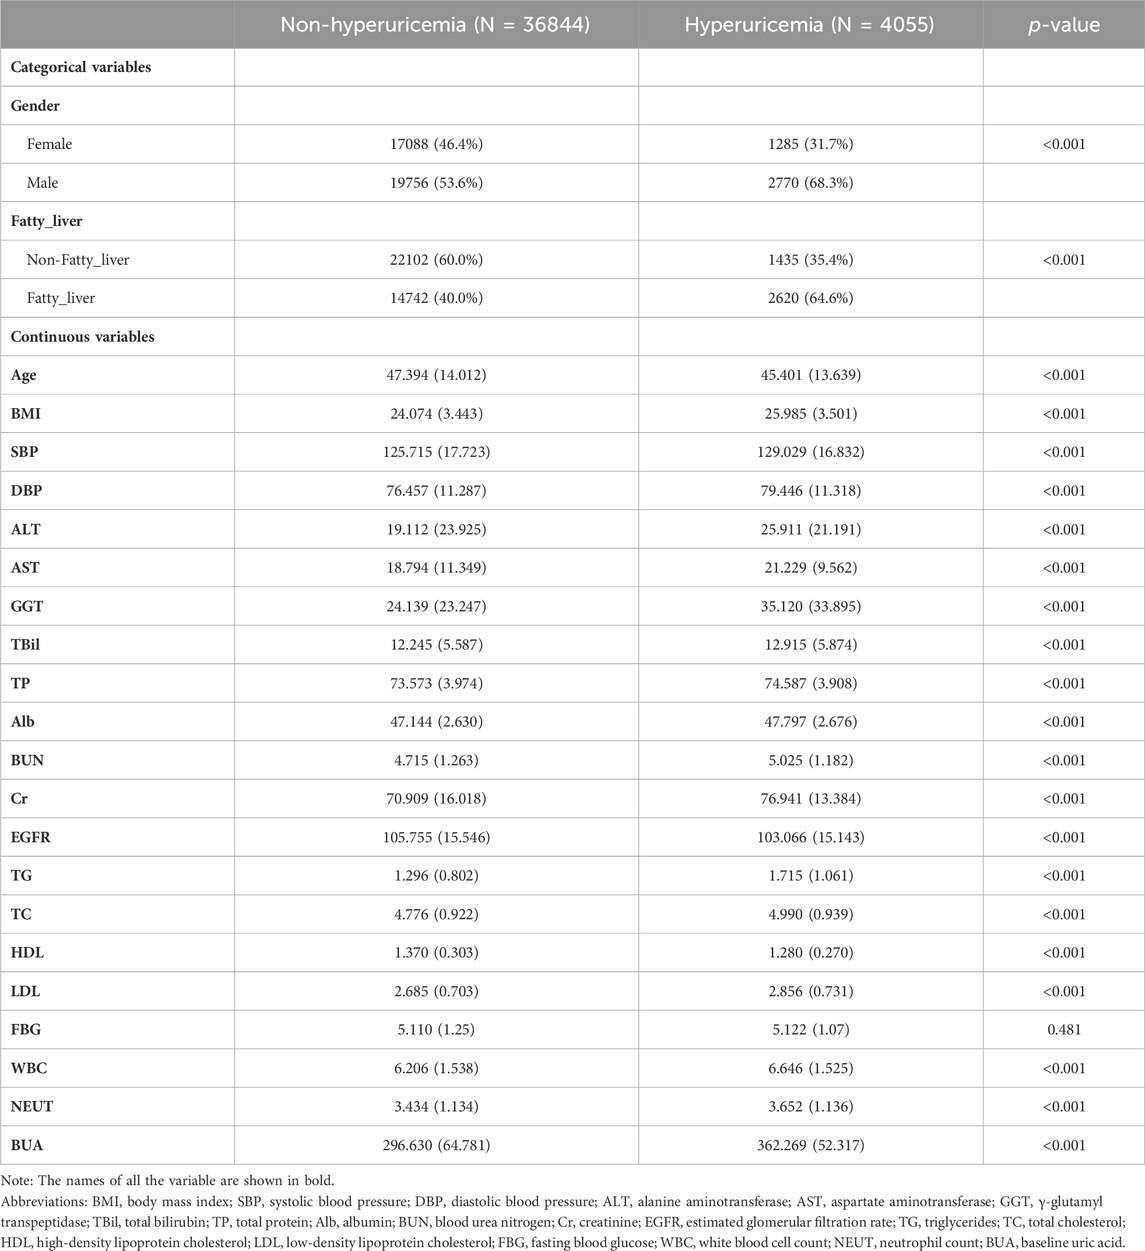
Table 1. Baseline characteristics of subjects in different groups.
Feature selection
Predicting features were filtered by LASSO regression, and 15 features were finally screened out of 23 variables, including age, gender, BMI, GGT, TBil, TP, BUN, Cr, EGFR, TG, TC, FBG, WBC, BUA and the fatty liver status, as shown in Figure 2. The figure on the left was the LASSO coefficient path diagram, where each curve represents the trajectory of the coefficient of each variable, and the variables first reached to point 0 were excluded. The figure on the right is the feature importance diagram, which shows how much every feature is related to the outcome by ranking their coefficients.
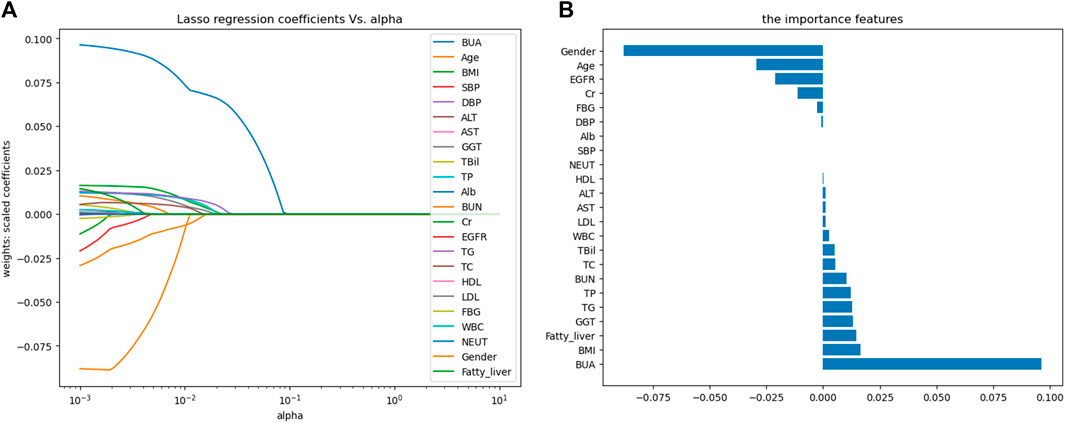
Figure 2. Variable selection based on LASSO regression. (A) LASSO coefficient path map; (B) Feature importance map. Abbreviations: BMI, body mass index; SBP, systolic blood pressure; DBP, diastolic blood pressure; ALT, alanine aminotransferase; AST, aspartate aminotransferase; GGT, γ-glutamyl transpeptidase; TBil, total bilirubin; TP, total protein; Alb, albumin; BUN, blood urea nitrogen; Cr, creatinine; EGFR, estimated glomerular filtration rate; TG, triglycerides; TC, total cholesterol; HDL, high-density lipoprotein cholesterol; LDL, low-density lipoprotein cholesterol; FBG, fasting blood glucose; WBC, white blood cell count; NEUT, neutrophil count; BUA, baseline uric acid.
Construction of prediction models
First of all, 14445 non-HUA subjects and 14185 HUA subjects were generated from the training set using the ROSE sampling method. 10 bootstrapped datasets from the training set were used to train three individual machine learning models, SVM, C5.0, and XGBoost. The grid search strategy was used for hyperparameters selection. Then, the gradient boosting machine model was applied as the meta learner to stack these three individual models together into our ensemble model. We can see that the XGBoost takes the largest proportion of influence in our ensemble model, as shown in Figure 3A. The hyperparameter tuning process of the component models, XGBoost, C5.0, and SVM are shown in Figures 3B–D respectively. The area under the receiver operating characteristic curve (ROC) showed increasing trends with boosting iterations.
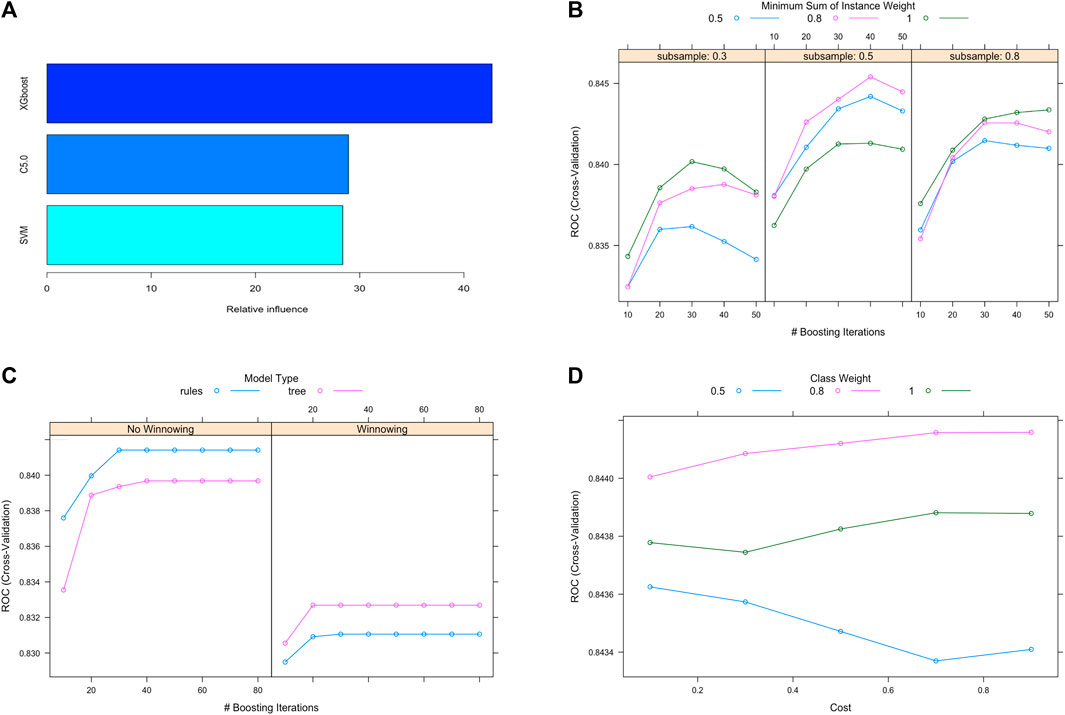
Figure 3. Ensemble model construction and hyperparameter tuning. (A) Contributions of individual models in the stacking ensemble model. (B), (C), (D) Hyperparameter tuning process for the XGBoost, C5.0 and SVM models. Abbreviations: XGBoost, eXtreme gradient boosting; C5.0, decision tree C5.0; SVM, support vector machine.
The AUC for each of the 10 bootstrapped datasets were obtained, as depicted in Figure 4, and they varied across different subsets for the three machine learning models. Also, the correlations between each pair of models were examined, and they showed significant statistical differences, which indicated that each model captured distinct aspects of the data. In this case, there is a good chance that our ensemble model can enhance predictive performance even further while stacking these three machine learning models together.
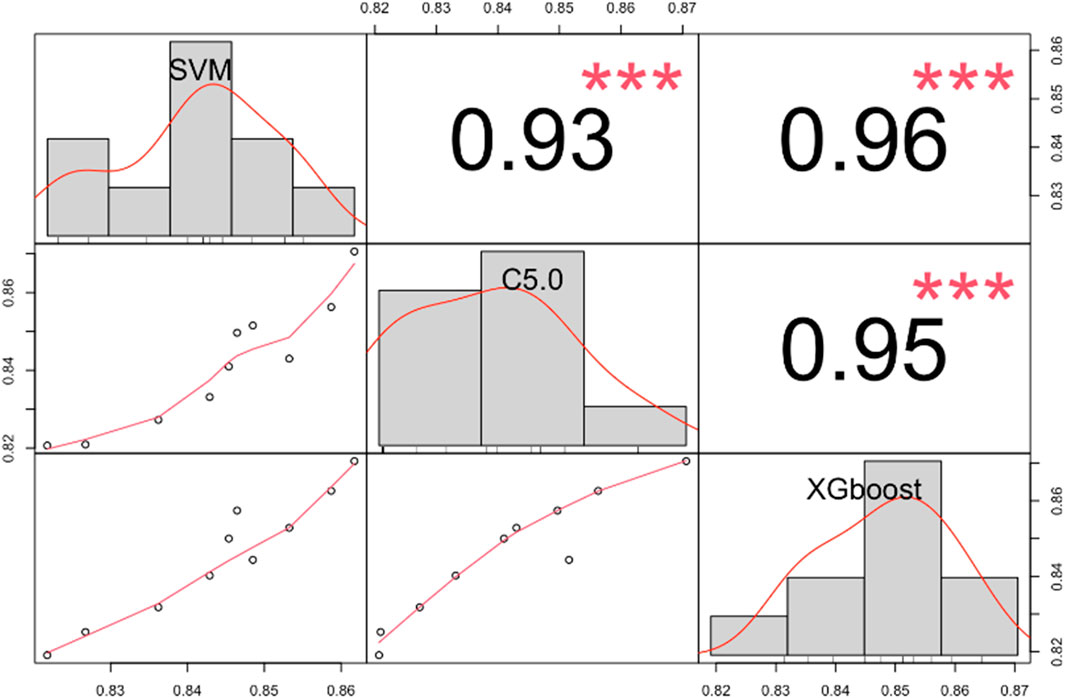
Figure 4. The correlation matrix shows the AUC for SVM, C5.0, and XGBoost models in different bootstrapped datasets. ***, p < 0.001. Abbreviations: AUC, the area under the receiver operating characteristic curve; SVM, support vector machine; C5.0, decision tree C5.0; XGBoost, eXtreme gradient boosting.
Evaluation of prediction models
For ease of comparison, the ROC curves of four models on the validation set were depicted in a single plot, as shown in Figure 5A. The stacking ensemble model with an AUC of 0.854, outperformed the other three models, SVM, C5.0, and the XGBoost with AUCs of 0.848, 0.851 and 0.849, respectively. Moreover, the ensemble model outperformed the other three models in terms of calibration accuracy with fewer deviations from the diagonal, as shown in Figure 5B. Other metrics for evaluating our models, including accuracy, sensitivity, specificity, PPV, NPV, and F1 score were also presented, which further proved the ensemble model’s superiority over the other three models, as shown in Table 2.
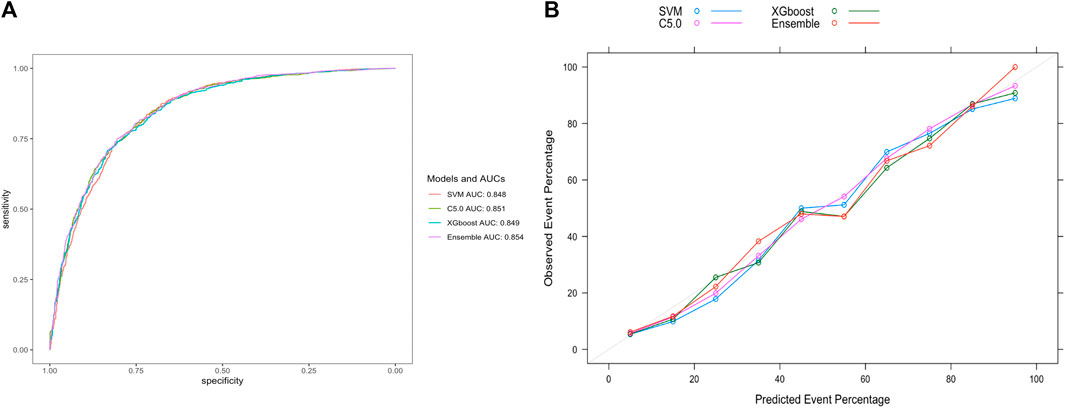
Figure 5. Evaluation of model performance on the validation set. (A) ROC curve determines which model has better classification ability. (B) Calibration curve shows the consistency between observed and predicted probabilities. Abbreviations: ROC, the receiver operating characteristic curve; AUC, the area under the receiver operating characteristic curve; XGBoost, eXtreme gradient boosting; C5.0, decision tree C5.0; SVM, support vector machine; Ensemble, stacking ensemble model.
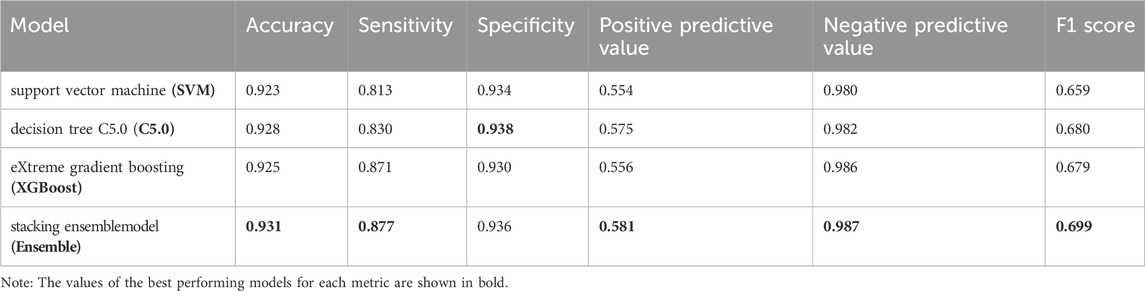
Table 2. Other performance metrics of different models on the validation set.
Ensemble model interpretation
To better illustrate our stacking ensemble model, the iBreakdown algorithm was used for detecting interactions for subject-level explanations. The contributing features of developing HUA in the future were estimated using six randomly selected subjects, which showed that BUA, gender, age, GGT, EFGR, BMI, TP, TG, Cr were associated with an increased risk of developing HUA. Being Female and relatively younger, together with having higher BUA, BMI, GGT, TP, TG, Cr, FBG values can increase the risk of developing HUA, as shown in Figure 6.
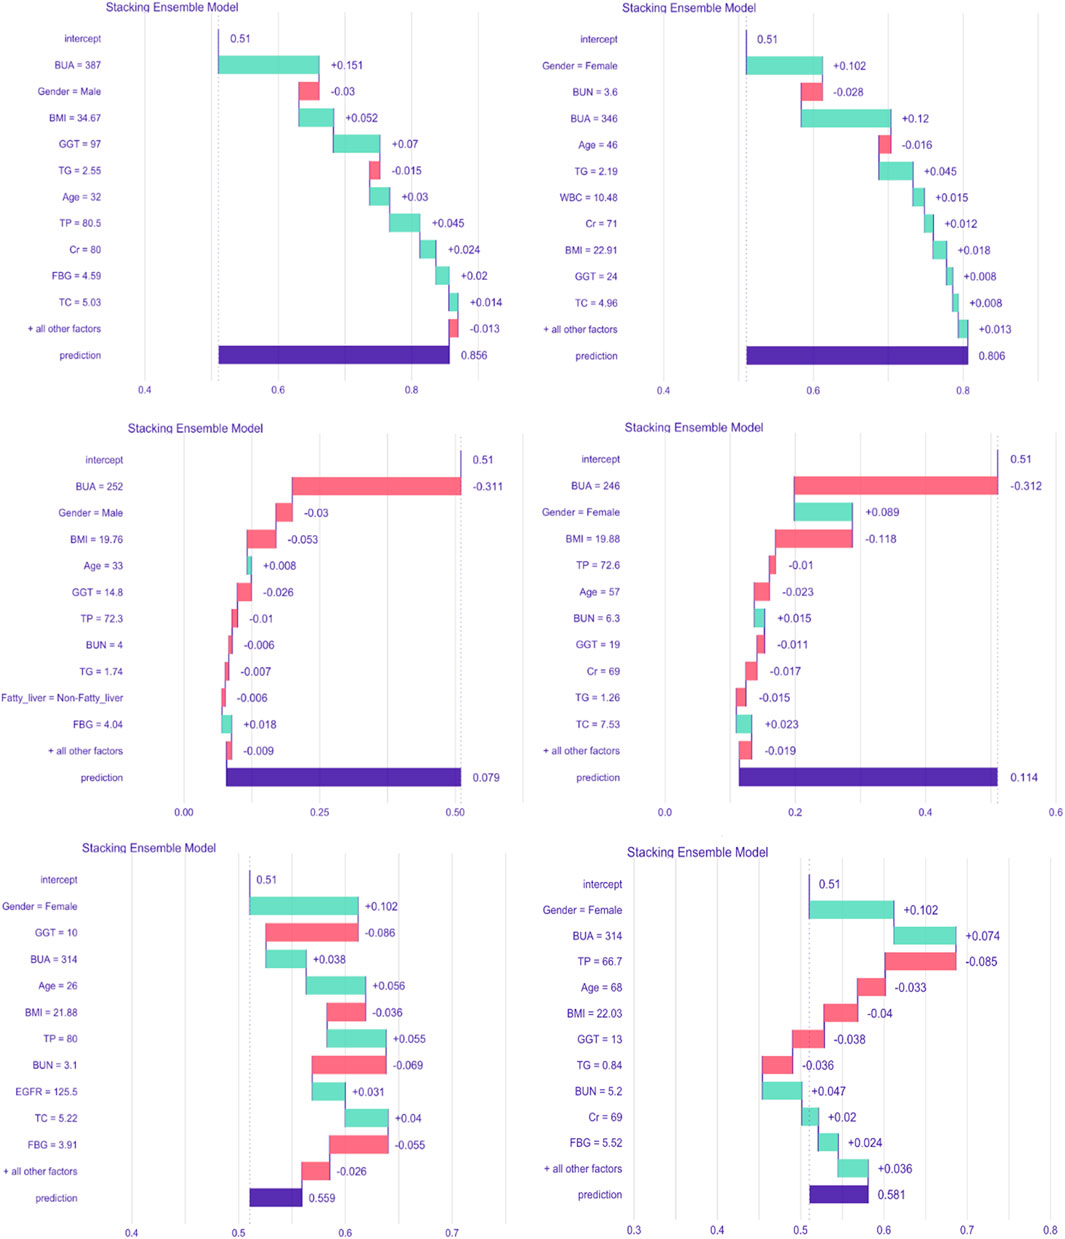
Figure 6. Break-down plot showing feature contributions for the stacking ensemble model. Abbreviations: BMI, body mass index; GGT, γ-glutamyl transpeptidase; TP, total protein; BUN, blood urea nitrogen; Cr, creatinine; EGFR, estimated glomerular filtration rate; TG, triglycerides; TC, total cholesterol; FBG, fasting blood glucose; WBC, white blood cell count; BUA, baseline uric acid.
Extra validation of the ensemble model
To further validate our model’s applicability in the health checkup population, we used another cohort from a different timespan enrolled from 1 Jan 2022, to 31 May 2023 in the same hospital, whose baseline characteristics were shown in Table 3. At the end of the follow-up period for 8559 subjects, 804 incident HUA cases were diagnosed, resulting in an incidence rate of 93.94/1000 person-years. The stacking ensemble model with an AUC of 0.846, outperformed the other three models, SVM, C5.0, and the XGBoost with AUCs of 0.839, 0.835 and 0.840, respectively, as shown in Figure 7A. The calibration curves and other metrics were also depicted, which showed our ensemble model had favorable performances in those evaluations, as shown in Figure 7B and Table 4.
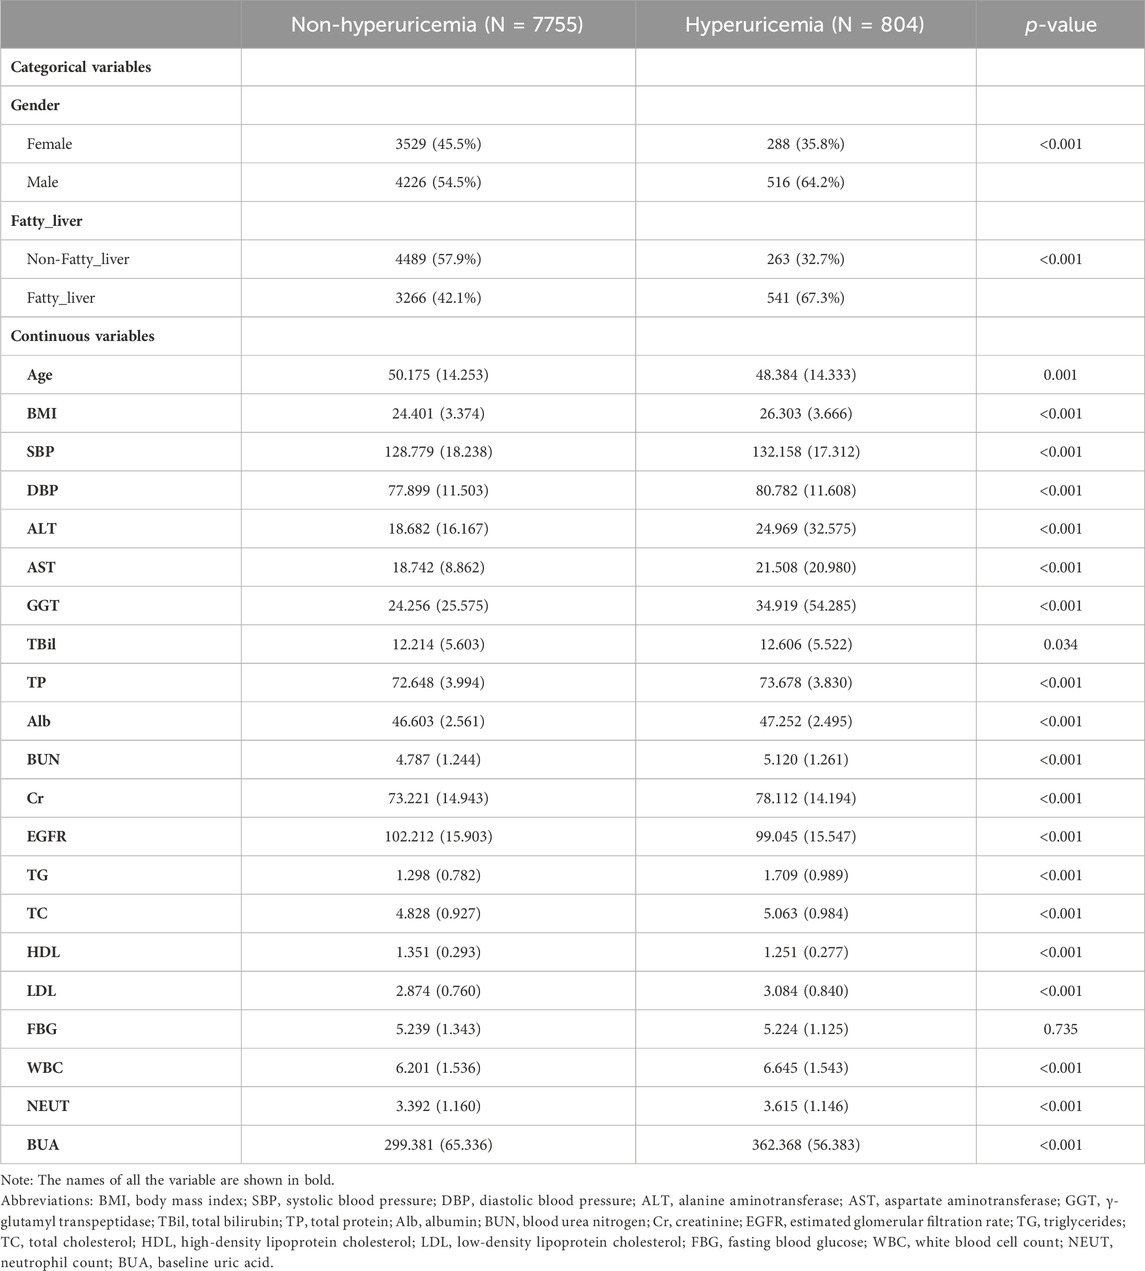
Table 3. Baseline characteristics of the extra-validation set in different groups.
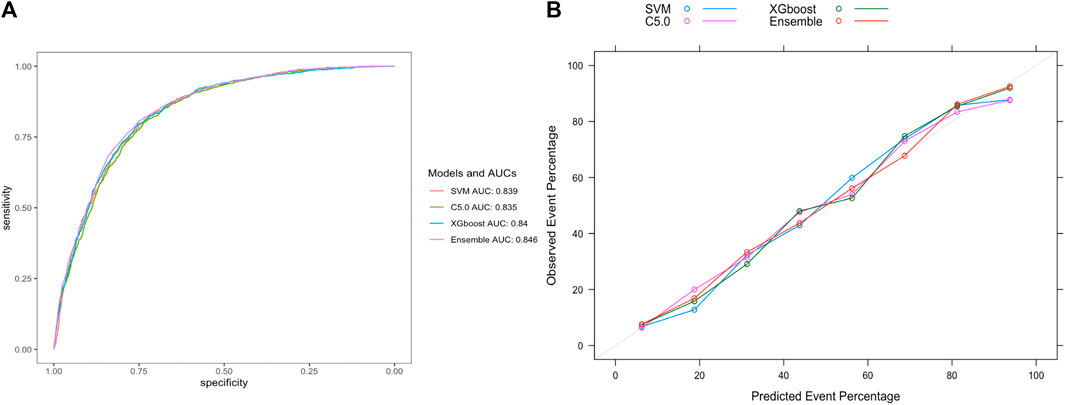
Figure 7. Evaluation of model performance in the extra-validation set. (A) ROC curve determines which model has better classification ability. (B) Calibration curve shows the consistency between observed and predicted probabilities. Abbreviations: ROC, the receiver operating characteristic curve; AUC, the area under the receiver operating characteristic curve; XGBoost, eXtreme gradient boosting; C5.0, decision tree C5.0; SVM, support vector machine; Ensemble, stacking ensemble model.
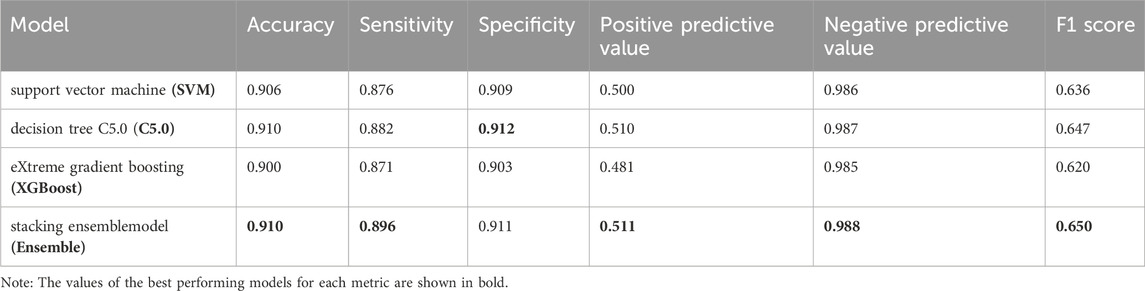
Table 4. Other performance metrics of different models on the extra validation set.
Clinical use of the ensemble model
To facilitate the use of our ensemble model in clinical practice, we built a dynamic risk calculator for HUA, as shown in Figure 8. To use the dynamic calculator, select or type in the correct values in the corresponding options, and click “Submit” to get the probability of developing HUA in the future. To further support our calculator’s worth, the threshold probability was analyzed using decision curve analysis, which found the minimum probability of disease at which further intervention would be warranted. As we can see from the decision curve that using the calculator based on the ensemble model to predict the risk of HUA can be clinically beneficial if the threshold ranging from around 10%–80% and more advantageous than the other three models, as shown in Figure 9.
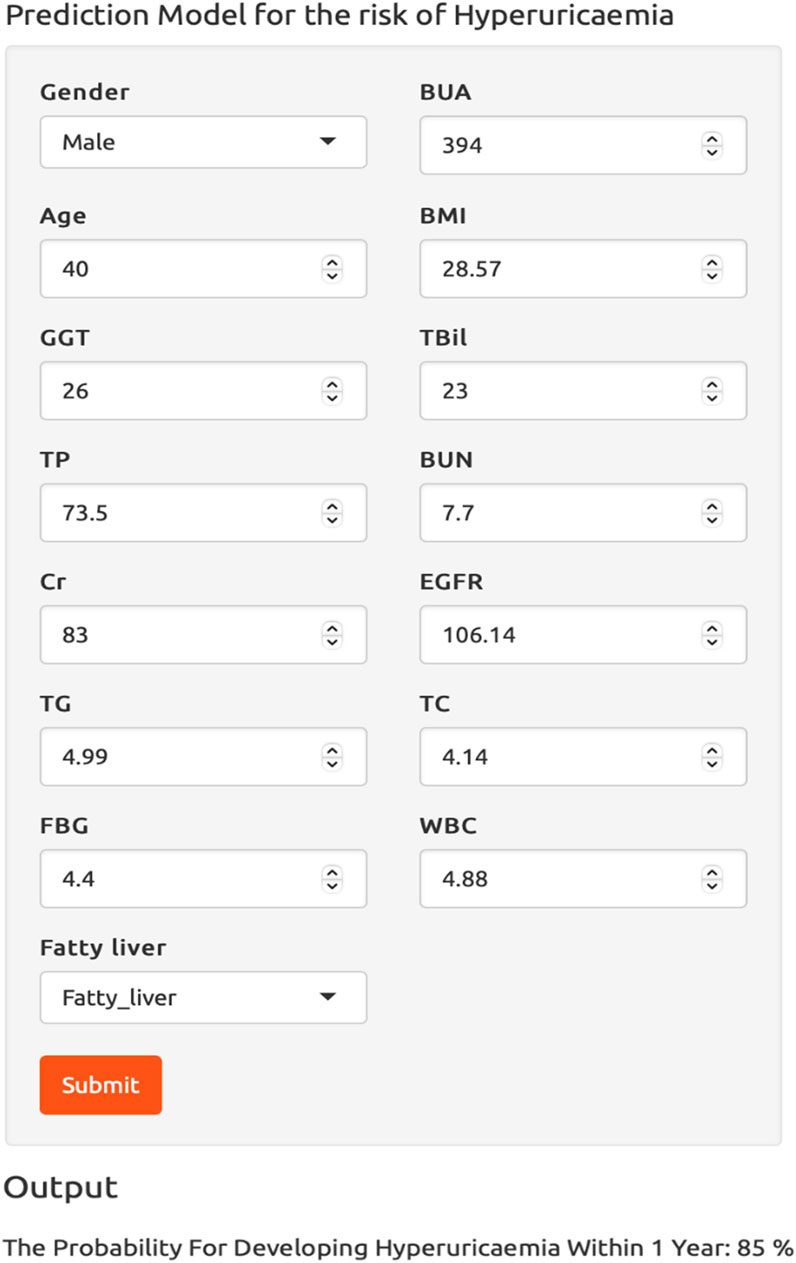
Figure 8. The dynamic risk calculator for hyperuricemia. Abbreviations: BMI, body mass index; GGT, γ-glutamyl transpeptidase; TBil, total bilirubin; TP, total protein; BUN, blood urea nitrogen; Cr, creatinine; EGFR, estimated glomerular filtration rate; TG, triglycerides; TC, total cholesterol; FBG, fasting blood glucose; WBC, white blood cell count; BUA, baseline uric acid.
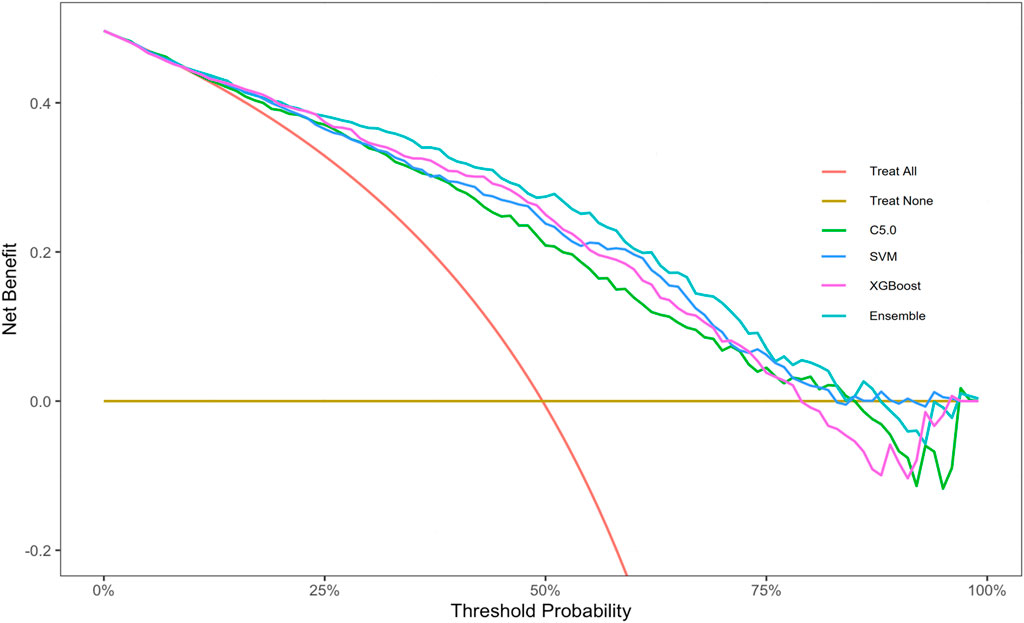
Figure 9. Decision curve analysis graph of the dynamic risk calculator. Abbreviations: XGBoost, eXtreme gradient boosting; C5.0, decision tree C5.0; SVM, support vector machine; Ensemble, stacking ensemble model.
Discussion
In this study, a stacking ensemble prediction model for the risk of HUA was developed using data obtained from a prospective health checkup population. Our ensemble model was built up on 15 features selected by LASSO regression and demonstrated favorable performance with AUCs of 0.854 and 0.846 in the validation and extra-validation sets respectively, which outperformed the SVM, C5.0, XGBoost models. Other metrics, including accuracy, specificity, NPV, F1 score, and calibration accuracy, likewise indicated the superiority of our ensemble model and made it a powerful tool in HUA predicting.
Machine learning gives computers the ability to develop human-like learning capabilities, which allows them to solve medical problems, such as medical diagnosis, image recognition, and disease risk prediction, etc. Li et al. developed an accurate and non-invasive diagnostic model for tuberculous pleural effusion, and Fei et al. contributed to the field by creating a diagnostic model for brain diseases, showcasing the effectiveness of advanced machine learning methodologies (Li et al., 2018; Fei et al., 2020). To optimize the performance of disease classification, Xia and Houssein et al. introduced two optimization techniques, further enhancing the precision and reliability of the diagnostic models (Xia et al., 2022; Houssein and Sayed, 2023). Zhao et al. dedicated the development of accurate brain magnetic resonance images segmentation, while Emam et al. focused on refining retinal vessel segmentation algorithms (Zhao et al., 2020; Emam et al., 2023). Wei et al. constructed a useable machine learning model to predict the risk of acute kidney injury in acute respiratory distress syndrome patients (Wei et al., 2023). These breakthroughs made significant progress in solving medical problems, contributing to the improvement of diagnostic tools and techniques.
Ensemble learning is a machine learning approach that attempts to improve prediction performance by combining several weak learners into one powerful learner, which aims to reduce prediction generalization errors (Harangi, 2018; Hera et al., 2022; Zaini and Awang, 2023). Verma et al. built six different machine learning models and then developed an ensemble model using stacking and improved the performance of skin disease prediction with a final accuracy of 99.67% (Verma et al., 2020). Abdollahi and Nouri-Moghaddam used the stacking ensemble method to predict diabetes and achieved a 98.8% accuracy in disease diagnosis (Abdollahi and Nouri-Moghaddam, 2022). Our ensemble model outperformed the existing HUA prediction models in discrimination and calibration. Lee et al. explored multiple machine learning algorithms to predict HUA status in Korean individuals over the age of 40, and the random forests model performed the best with an AUC of 0.775 (Lee et al., 2019). Zeng et al. developed an artificial neural network prediction model incorporating dietary factors in Chinese adults achieving an AUC of 0.814 (Zeng et al., 2020). Gao et al. developed two different HUA random forest prediction model for male and female based on a Chinese health checkup population, and achieved AUCs of 0.730 and 0.815, respectively (Gao et al., 2021). Huang et al. developed a logistic regression prediction model for diabetic kidney disease patients based on a retrospective study achieving a C-index of 0.761 (Huang et al., 2022). Zhu et al. established a XGBoost algorithm to make an early detection of HUA risk in people taking low-dose aspirin achieving an AUC of 0.811 (Zhu et al., 2023). All these proved the advantages of the stacking ensemble strategy.
Our findings are consistent with the risk factors of HUA found in established studies. Six randomly selected subjects were analyzed using iBreakdown algorithm, which found that BUA, gender, age, GGT, EFGR, BMI, TP, TG, and Cr were associated with an increased risk of HUA. Cao and Piao both confirmed age and gender were very important factors in the development of HUA (Cao et al., 2017; Piao et al., 2022). Age is a complex influencing factor because the amount of uric acid produced varies with age. In our study, we found being relatively younger can increase the risk of developing HUA. The abovementioned two studies also proved that uric acid levels of males and females reached their apex in their 20s or so, and then declined with aging. Relatively younger people tend to have higher physical activity intensities and higher metabolic levels with different dietary habits from elderly people, which might promote them to produce more uric acid that increases the risk of developing HUA. We also found being female can increase the risk of developing HUA, which might contradict the common sense. Considering different diagnostic criteria of HUA for different genders, a female with relatively low levels of uric acid may be diagnosed with HUA, while a male must have very high levels of uric acid that could be diagnosed with HUA, two different models designed for male and female separately might be a good solution. Several other studies conducted in different countries had demonstrated significant associations between HUA and BMI, TP, and TG levels (Wang et al., 2022; Ding et al., 2023; Lyu et al., 2023). Other studies had proven smoking, drinking, sedentary lifestyle that our study did not involve could contribute to the development of HUA (Kim et al., 2018; He et al., 2022; Teramura et al., 2023). Besides these indicators studied in previous studies, we found that having relatively higher GGT and FBG values can increase the risk of HUA.
Our study has several advantages. Firstly, this cohort study included a large sample size of the cohort, which can minimize the risk of bias. Secondly, the stacking ensemble strategy was employed, which brought high predicting performance with fair robustness. Thirdly, we developed a dynamic risk calculator to predict the risk of HUA. The calculator was clear and intuitive, which could be used to quickly and accurately identify individuals at high risk of HUA. Our study has several limitations at the same time. Firstly, our results were all based on one-time measurement, which may not reflect the status of the subjects accurately and may be overestimating the incidence rate of HUA. Secondly, our HUA risk prediction model was extra-validated using datasets from the same hospital in a different timespan, while the validation data from other places were necessary. Thirdly, more variables like smoking, drinking, and dietary habits, etc. need to be explored in our analysis.
Conclusion
Our current research has developed an accurate prediction model for the risk of HUA using a stacking ensemble technique, which has the potential to be clinically useable. The most contributing risk factors associated with HUA was also identified. This ensemble model could help in identifying high-risk HUA groups and encouraging them to pay attention to those risk factors and their unhealthy lifestyles. Although other variables like dietary habits are important factors for HUA, prediction models constructed solely from health checkup variables can be more convenient in clinical setting. In the future, we will try to include indicators for dietary habits and use external datasets to further explore our research.
Data availability statement
The raw data supporting the conclusion of this article will be made available by the authors, without undue reservation.
Ethics statement
This work was approved by the Ethics Committee of the First Affiliated Hospital of Shandong First Medical University (2021S128). The studies were conducted in accordance with the local legislation and institutional requirements. The participants provided their written informed consent to participate in this study.
Author contributions
YZ: Formal Analysis, Methodology, Software, Writing–original draft. LZ: Investigation, Writing–review and editing. HL: Investigation, Writing–review and editing. GZ: Writing–review and editing, Conceptualization, Data curation, Supervision.
Funding
The author(s) declare financial support was received for the research, authorship, and/or publication of this article. This work was supported by grants from the Natural Science Foundation of Shandong Province (ZR2020MF026) and the cultivation Foundation of National Natural Science Foundation of Shandong Provincial Qianfoshan Hospital (QYPY2020NSFC0603).
Conflict of interest
The authors declare that the research was conducted in the absence of any commercial or financial relationships that could be construed as a potential conflict of interest.
Publisher’s note
All claims expressed in this article are solely those of the authors and do not necessarily represent those of their affiliated organizations, or those of the publisher, the editors and the reviewers. Any product that may be evaluated in this article, or claim that may be made by its manufacturer, is not guaranteed or endorsed by the publisher.
References
Abdollahi J., Nouri-Moghaddam B. (2022). Hybrid stacked ensemble combined with genetic algorithms for diabetes prediction. Iran. J. Comput. Sci. 5 (3), 205–220. doi:10.1007/s42044-022-00100-1
Cao J., Wang C., Zhang G., Ji X., Liu Y., Sun X., et al. (2017). Incidence and simple prediction model of hyperuricemia for urban han Chinese adults: a prospective cohort study. Int. J. Environ. Res. Public Health 14 (1), 67. doi:10.3390/ijerph14010067
Chen Y., Huang S., Chen T., Liang D., Yang J., Zeng C., et al. (2021). Machine learning for prediction and risk stratification of lupus nephritis renal flare. Am. J. Nephrol. 52 (2), 152–160. doi:10.1159/000513566
Dehlin M., Jacobsson L., Roddy E. (2020). Global epidemiology of gout: prevalence, incidence, treatment patterns and risk factors. Nat. Rev. Rheumatol. 16 (7), 380–390. doi:10.1038/s41584-020-0441-1
Ding Y., Xu Z., Zhou X., Luo Y., Xie R., Li Y. (2023). Association between weight-adjusted-waist index and the risk of hyperuricemia in adults: a population-based investigation. Front. Endocrinol. (Lausanne) 14, 1236401. doi:10.3389/fendo.2023.1236401
Dong J., Yang H., Zhang Y., Hu Q. (2022). Triglyceride-glucose index is a predictive index of hyperuricemia events in elderly patients with hypertension: a cross-sectional study. Clin. Exp. Hypertens. 44 (1), 34–39. doi:10.1080/10641963.2021.1984499
Emam M. M., Houssein E. H., Ghoniem R. M. (2023). A modified reptile search algorithm for global optimization and image segmentation: case study brain MRI images. Comput. Biol. Med. 152, 106404. doi:10.1016/j.compbiomed.2022.106404
Endocrinology C. (2020). Guideline for the diagnosis and management of hyperuricemia and gout in China(2019). Chin. J. Endocr. Metab. 36, 1–13. doi:10.3760/cma.j.issn.1000-6699.2020.01.001
Fei X., Wang J., Ying S., Hu Z., Shi J. (2020). Projective parameter transfer based sparse multiple empirical kernel learning Machine for diagnosis of brain disease. Neurocomputing 413, 271–283. doi:10.1016/j.neucom.2020.07.008
Friedman J. H., Hastie T., Tibshirani R. (2010). Regularization paths for generalized linear models via coordinate descent. J. Stat. Softw. 33 (1), 1–22. doi:10.18637/jss.v033.i01
Gao Y., Jia S., Li D., Huang C., Meng Z., Wang Y., et al. (2021). Prediction model of random forest for the risk of hyperuricemia in a Chinese basic health checkup test. Biosci. Rep. 41 (4). doi:10.1042/bsr20203859
Gosiewska A., Biecek P. (2019). Do not trust additive explanations. arXiv: Learning, arXiv:1903.11420. doi:10.48550/arXiv.1903.11420
Han Y., Cao Y., Han X., Di H., Yin Y., Wu J., et al. (2023). Hyperuricemia and gout increased the risk of long-term mortality in patients with heart failure: insights from the National Health and Nutrition Examination Survey. J. Transl. Med. 21 (1), 463. doi:10.1186/s12967-023-04307-z
Harangi B. (2018). Skin lesion classification with ensembles of deep convolutional neural networks. J. Biomed. Inf. 86, 25–32. doi:10.1016/j.jbi.2018.08.006
He H., Guo P., He J., Zhang J., Niu Y., Chen S., et al. (2022). Prevalence of hyperuricemia and the population attributable fraction of modifiable risk factors: evidence from a general population cohort in China. Front. Public Health 10, 936717. doi:10.3389/fpubh.2022.936717
Hera S. Y., Amjad M., Saba M. K. (2022). Improving heart disease prediction using multi-tier ensemble model. Netw. Model. Anal. Hlth. 11 (1), 41. doi:10.1007/s13721-022-00381-3
Houssein E. H., Sayed A. (2023). A modified weighted mean of vectors optimizer for Chronic Kidney disease classification. Comput. Biol. Med. 155, 106691. doi:10.1016/j.compbiomed.2023.106691
Huang G., Li M., Mao Y., Li Y. (2022). Development and internal validation of a risk model for hyperuricemia in diabetic kidney disease patients. Front. Public Health 10, 863064. doi:10.3389/fpubh.2022.863064
Kim J. Y., Yang Y., Sim Y. J. (2018). Effects of smoking and aerobic exercise on male college students' metabolic syndrome risk factors. J. Phys. Ther. Sci. 30 (4), 595–600. doi:10.1589/jpts.30.595
Lee S., Choe E. K., Park B. (2019). Exploration of machine learning for hyperuricemia prediction models based on basic health checkup tests. J. Clin. Med. 8 (2), 172. doi:10.3390/jcm8020172
Li C., Hou L., Sharma B. Y., Li H., Chen C., Li Y., et al. (2018). Developing a new intelligent system for the diagnosis of tuberculous pleural effusion. Comput. Meth. Prog. Bio. 153, 211–225. doi:10.1016/j.cmpb.2017.10.022
Lin Z., Wu S., Chen Z., Luo W., Lin Z., Su H., et al. (2024). Poor serum uric acid control increases risk for developing hypertension: a retrospective cohort study in China. Front. Endocrinol. (Lausanne) 15, 1343998. doi:10.3389/fendo.2024.1343998
Liu M., Cao B., Luo Q., Song Y., Shi Y., Cheng M., et al. (2024). A gender-age-and weight status-specific analysis of the high prevalence of hyperuricemia among Chinese children and adolescents with obesity. Diabetes Metab. Syndr. Obes. 17, 381–391. doi:10.2147/dmso.S448638
Lyu J., Li Z., Wei H., Liu D., Chi X., Gong D. W., et al. (2020). A potent risk model for predicting new-onset acute coronary syndrome in patients with type 2 diabetes mellitus in Northwest China. Acta Diabetol. 57 (6), 705–713. doi:10.1007/s00592-020-01484-x
Lyu X., Du Y., Liu G., Mai T., Li Y., Zhang Z., et al. (2023). Prevalence and influencing factors of hyperuricemia in middle-aged and older adults in the Yao minority area of China: a cross-sectional study. Sci. Rep. 13 (1), 10185. doi:10.1038/s41598-023-37274-y
Mahajan P., Uddin S., Hajati F., Moni M. A. (2023). Ensemble learning for disease prediction: a review. Healthc. (Basel) 11 (12), 1808. doi:10.3390/healthcare11121808
Maloberti A., Giannattasio C., Bombelli M., Desideri G., Cicero A. F. G., Muiesan M. L., et al. (2020). Hyperuricemia and risk of cardiovascular outcomes: the experience of the URRAH (uric acid right for heart health) project. High. Blood Press. Cardiovasc. Prev. 27 (2), 121–128. doi:10.1007/s40292-020-00368-z
McCormick N., Yokose C., Lu N., Joshi A. D., Curhan G. C., Choi H. K. (2022). Impact of adiposity on risk of female gout among those genetically predisposed: sex-specific prospective cohort study findings over >32 years. Ann. Rheum. Dis. 81 (4), 556–563. doi:10.1136/annrheumdis-2021-221635
Nicola L., Giovanna M., Nicola T. (2014). ROSE: a package for binary imbalanced learning. R. J. 6, 79. doi:10.32614/RJ-2014-008
Piao W., Zhao L., Yang Y., Fang H., Ju L., Cai S., et al. (2022). The prevalence of hyperuricemia and its correlates among adults in China: results from CNHS 2015-2017. Nutrients 14 (19), 4095. doi:10.3390/nu14194095
Sauerbrei W., Boulesteix A. L., Binder H. (2011). Stability investigations of multivariable regression models derived from low- and high-dimensional data. J. Biopharm. Stat. 21 (6), 1206–1231. doi:10.1080/10543406.2011.629890
Teramura S., Yamagishi K., Umesawa M., Hayama-Terada M., Muraki I., Maruyama K., et al. (2023). Risk factors for hyperuricemia or gout in men and women: the circulatory risk in communities study (CIRCS). J. Atheroscler. Thromb. 30 (10), 1483–1491. doi:10.5551/jat.63907
Verma A. K., Pal S., Tiwari B. B. (2020). Skin disease prediction using ensemble methods and a new hybrid feature selection technique. Iran. J. Comput. Sci. 3 (4), 207–216. doi:10.1007/s42044-020-00058-y
Wang J., Chen Y., Chen S., Wang X., Zhai H., Xu C. (2022). Prevalence and risk factors of hyperuricaemia in non-obese Chinese: a single-centre cross-sectional study. BMJ Open 12 (6), e048574. doi:10.1136/bmjopen-2020-048574
Wei S., Zhang Y., Dong H., Chen Y., Wang X., Zhu X., et al. (2023). Machine learning-based prediction model of acute kidney injury in patients with acute respiratory distress syndrome. BMC Pulm. Med. 23 (1), 370. doi:10.1186/s12890-023-02663-6
Xia J., Cai Z.-N., Heidari A. A., Ye Y., Chen H., Pan Z. (2022). Enhanced moth-flame optimizer with quasi-reflection and refraction learning with application to image segmentation and medical diagnosis. Curr. Bioinform. 18 (2), 109–142. doi:10.2174/1574893617666220920102401
Zaini N. A. M., Awang M. K. (2023). Hybrid feature selection algorithm and ensemble stacking for heart disease prediction. Int. J. Adv. Comput. Sc. 14 (2), 158–165. doi:10.14569/IJACSA.2023.0140220
Zeng J., Zhang J., Li Z., Li T., Li G. (2020). Prediction model of artificial neural network for the risk of hyperuricemia incorporating dietary risk factors in a Chinese adult study. Food Nutr. Res. 64. doi:10.29219/fnr.v64.3712
Zhang M., Zhu X., Wu J., Huang Z., Zhao Z., Zhang X., et al. (2021). Prevalence of hyperuricemia among Chinese adults: findings from two nationally representative cross-sectional surveys in 2015-16 and 2018-19. Front. Immunol. 12, 791983. doi:10.3389/fimmu.2021.791983
Zhao H., Qiu X., Lu W., Huang H., Jin X. (2020). High-quality retinal vessel segmentation using generative adversarial network with a large receptive field. Int. J. Imaging Syst. Technol. 30, 828–842. doi:10.1002/ima.22428
Zhou Z.-H. (2021). “Ensemble learning,” in Machine learning. Editor Z.-H. Zhou (Singapore: Springer Singapore), 181–210.
Zhu B., Yang L., Wu M., Wu Q., Liu K., Li Y., et al. (2023). Prediction of hyperuricemia in people taking low-dose aspirin using a machine learning algorithm: a cross-sectional study of the National Health and Nutrition Examination Survey. Front. Pharmacol. 14, 1276149. doi:10.3389/fphar.2023.1276149
Keywords: hyperuricemia, prediction model, machine learning, stacking ensemble, risk factors
Citation: Zhang Y, Zhang L, Lv H and Zhang G (2024) Ensemble machine learning prediction of hyperuricemia based on a prospective health checkup population. Front. Physiol. 15:1357404. doi: 10.3389/fphys.2024.1357404
Received: 21 December 2023; Accepted: 11 March 2024;
Published: 11 April 2024.
Edited by:
Christian Baumgartner, Graz University of Technology, AustriaReviewed by:
Chengye Li, Wenzhou Medical University, ChinaYouxi Luo, Hubei University of Technology, China
Joan Vila-Francés, University of Valencia, Spain
Jan Kubicek, VSB-Technical University of Ostrava, Czechia
Copyright © 2024 Zhang, Zhang, Lv and Zhang. This is an open-access article distributed under the terms of the Creative Commons Attribution License (CC BY). The use, distribution or reproduction in other forums is permitted, provided the original author(s) and the copyright owner(s) are credited and that the original publication in this journal is cited, in accordance with accepted academic practice. No use, distribution or reproduction is permitted which does not comply with these terms.
*Correspondence: Guang Zhang, zgpap2015@126.com