 Haili Huang
 Lijia Tian
 Xinghuai Sun
 Yuhong Chen1,2*
- 1Department of Ophthalmology and Visual Science, Eye and ENT Hospital, Shanghai Medical College, Fudan University, Shanghai, China
- 2NHC Key Laboratory of Myopia, Shanghai Key Laboratory of Visual Impairment and Restoration, Chinese Academy of Medical Sciences, Fudan University, Shanghai, China
- 3State Key Laboratory of Medical Neurobiology and MOE Frontiers Center for Brain Science, Institutes of Brain Science, Fudan University, Shanghai, China
Purpose: To compare the morphological characteristics of Schlemm’s canal (SC) in patients with primary open-angle glaucoma (POAG) and healthy controls, using swept-source optical coherence tomography (SS-OCT) with en face reconstruction.
Methods: In this Prospective comparative study, we included 100 eyes from 50 patients diagnosed with POAG and 50 healthy controls. Three-dimensional cube and line scans of the temporal and nasal quadrants of the anterior segment of the limbus were acquired using SS-OCT. SC was identified using en face and cross-sectional images. The diameter and area of SC in cross-sectional images and the visible percentage and area of SC in en face images were measured using ImageJ.
Results: SC was observed in 84% of en face images and 81% of cross-sectional images in eyes with POAG but in 92% of en face images and 86% of cross-sectional images in control eyes. Significant differences between the POAG and normal control eyes were found in the en face area (0.35 ± 0.14 mm2 vs. 0.56 ± 0.22 mm2 in the temporal quadrant and 0.36 ± 0.14 mm2 vs. 0.58 ± 0.23 mm2 in the nasal quadrant; both p < 0.001) and visible percentage of SC (85.71% vs. 94.91% and 87.10% vs. 95.52% in the temporal and nasal quadrant respectively, both p < 0.001) in en face images as well as the cross-sectional area (2790.9 ± 942.2 μm2 vs. 4138.6 ± 2027.8 μm2 in the temporal quadrant and 2805.7 ± 947.2 μm2 vs. 4224.0 ± 2002.2 μm2 in the nasal quadrant, both p < 0.001) and diameter of SC (123.1 ± 25.4 μm vs. 149.5 ± 34.7 μm in the temporal quadrant and 126.3 ± 28.9 μm vs. 155.3 ± 36.0 μm in the nasal quadrant, both p < 0.001) in cross-section images. In addition, the mean intraocular pressure (IOP) significantly correlated with the en face area, visible percentage of SC, and cross-sectional area in the temporal and nasal quadrants.
Conclusion: SS-OCT can obtain high-quality en face images of SC without post-acquisition processing. Eyes with POAG had a decreased en face SC area compared with normal eyes. A correlation between SC area, visible percentage of en face images, and IOP was also observed.
1 Introduction
Glaucoma is the leading cause of irreversible blindness worldwide (Flaxman et al., 2017). Primary open-angle glaucoma (POAG), a major subtype of glaucoma, is highly prevalent and affects over 60 million adults globally (Zhang et al., 2021). The foremost risk factor for POAG is elevated intraocular pressure (IOP), which is affected by aqueous humor outflow. The elevated outflow resistance of the aqueous humor leads to an elevated IOP. The primary pathway for aqueous humor outflow is via the trabecular meshwork, followed by Schlemm’s canal (SC), collector channels, and scleral veins, which is responsible for the most of the aqueous humor drainage (Dautriche et al., 2015; Lewczuk et al., 2022).
SC is a circular channel in the eye that lies directly adjacent to the juxtacanalicular trabecular meshwork in the outer portion of the inner scleral sulcus. It is an elongated ellipse with its longer axis measuring 150–350 μm on cross-section (Lewczuk et al., 2022). Accumulating studies (Johnstone and Grant, 1973; Van Buskirk, 1982; Johnson and Kamm, 1983; Allingham et al., 1996; Kagemann et al., 2014a) have reported constriction or progressive collapse of SC in glaucomatous eyes, which may be responsible for increased aqueous outflow resistance and elevated IOP. Furthermore, surgical procedures have been developed to target mechanical dilation of SC or removal of the inner walls of SC to lower IOP (Okamoto et al., 2022). Therefore, SC structure imaging is helpful in facilitating therapeutic decision-making and evaluating the efficacy of glaucoma surgeries in patients with POAG.
Many different imaging techniques, such as confocal and light microscopy (Battista et al., 2008), high-frequency ultrasound biomicroscopy (Yan et al., 2016), micro-computed tomography (Hann et al., 2011), and anterior segment optical coherence tomography (AS-OCT) (Hong et al., 2013), have been used to evaluated the structure of SC. AS-OCT is a non-contact imaging technique that enables high-resolution three-dimensional visualization and real-time assessment of SC (Ang et al., 2018). Several studies (Chen et al., 2013; Li M et al., 2017; Chen et al., 2018b; Chen et al., 2018a) have reported in vivo SC imaging using OCT, and most of them used OCT B-scan imaging to measure the cross-sectional dimensions of SC in the nasal and/or temporal quadrants. On B-scan OCT, SC appears as a thin, black lucent space located in the deeper area of the corneoscleral limbus. Studies (Wang et al., 2012; Hong et al., 2013; Kagemann et al., 2014b) have indicated that POAG patients have smaller cross-sectional SC dimensions. Conventional B-scan OCT can only image a small segment of SC at a time, which may not reflect the overall condition of SC. En face OCT, on the other hand, can image a larger area of SC in one view, providing a more comprehensive assessment of SC structure. However, the analysis of SC using en face OCT imaging has not been previously reported.
Accordingly, we aimed to evaluate the clinical use of en face OCT in characterizing in vivo SC microstructures and to investigate inter-individual and regional variations between POAG and normal eyes.
2 Materials and methods
This prospective cross-sectional observational study was approved by the Ethics Committee of Eye and ENT Hospital, Fudan University, Shanghai, China. All study methods adhered to the tenets of the Declaration of Helsinki. Written informed consent was obtained from all participants.
2.1 Participants
Fifty patients diagnosed with POAG between August 2021 and June 2022 at the Department of Ophthalmology, Eye and ENT Hospital of Fudan University were included. To avoid the effect of ametropia on SC measurement, patients with POAG and normal participants whose myopic refractive error <−3D or > 3D were excluded. The diagnostic criteria for POAG included IOP >21 mmHg, characteristic glaucomatous visual field abnormality compatible with a retinal nerve fiber layer defect, and a peripheral anterior chamber depth deeper than one-fourth of the corneal thickness. Patients with systemic diseases and those who underwent prior ocular surgeries or had a history of ocular trauma or other eye diseases, including secondary glaucoma, were excluded from the study. Age-matched healthy volunteers without ocular or systemic conditions that could affect SC structures or compromise the OCT image quality were recruited. For all participants, a detailed medical history was obtained, and ophthalmic examinations were performed on the same day before the enrollment and imaging, which included visual acuity, refractive error, slit-lamp examination, Goldmann applanation tonometry, fundus photography, central corneal thickness, and axial length measurement using a LENSTAR Optical Biometer (Haag-Streit, United States). In addition, visual field testing (Humphrey perimetry) was also done. Each test was performed by a single examiner.
2.2 Measurements
The AS-OCT instrument used in this study was a high-resolution swept-source optical coherence tomography (SS-OCT) system (VG200D, SVision Imaging, Henan, China) with a wavelength of 1,050 nm, scan speed of 100,000 A-scans per second, imaging depth of 6 mm in the tissue, lateral resolution of 10 µm and axial resolution of 5 µm. Participants were seated and instructed to stare at a nasal or temporal fixation light to ensure that the iridocorneal angle was centered in the instrument’s field of view. The scans were performed independently at the 3 and 9 o’clock positions with the B-scan model of a 6 mm line and at the nasal and temporal quadrants with a 6 × 6 mm2 anterior segment cube model containing 256 × 256 axial scans. A built-in automatic evaluation system software was applied to assess the quality of images, considering factors such as signal strength, contrast, and noise. Each site was scanned three times, and the image with the best quality at each position was selected for the final analysis. En face OCT images were created by built-in automated software (van Gogh v2.1.016; SVision Imaging, Henan, China). The software aligns and averages the cross-sectional images from cube model scans. This visualization displays the volume data on the XY plane while projecting it in the axial (Z) direction. Scleral spur was chosen as a reference point to identify the layer of SC. The depth and thickness of en face projection were manually adjusted by observers. The projection calculation was performed within that specific range for optimal visualization of SC. Digital images were processed by a single operator using the ImageJ software (ImageJ 1.53q, National Institutes of Health, Bethesda, MD). The SC diameter was measured from the posterior to the anterior SC endpoints in the B-scan cross-sections. The SC area was drawn freehand and depicted as the area surrounded by its outline (Figure 1A). In en face images, the en face area (EFA) of SC was also drawn freehand based on its outlines (Figure 1B). The visible percentage of SC was calculated as the percentage of the length of the visible SC to the total length of SC (Figure 1C). For each image, SC parameters in each quadrant were assessed and quantified manually by two independent and well-trained observers.
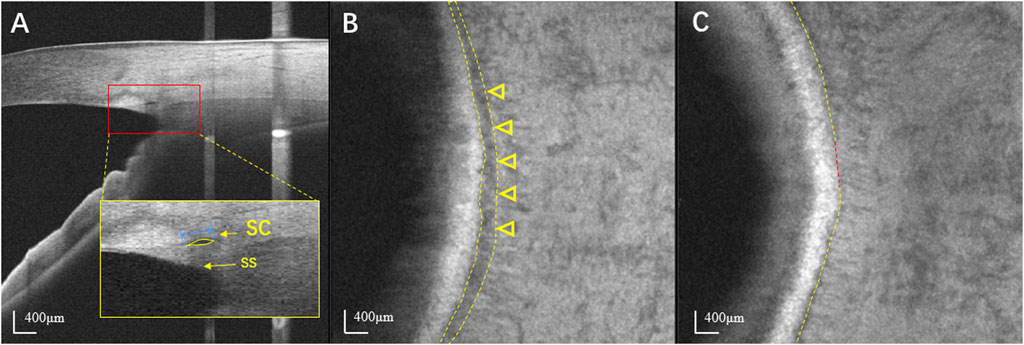
FIGURE 1. Identification of SC using swept-source optical coherence tomography. (A) The horizontal B scan image of SC in a normal eye. SC is seen as black, lucent ellipsoid space outside of the trabecular meshwork. The SS appears wedge shaped, resembling a spur. The SC diameter was measured from the anterior to the posterior endpoint of SC (blue line). The SC area was drawn freehand and was depicted as the area surrounded by the outline of SC (yellow arrow). (B) En face image at the level of SC in the same normal eye. SC is seen as a dark curved line parallel to the corneal limbus (yellow arrowheads). (C) The visible percentage of SC was defined as the percentage of the length of the visible SC (yellow line) to its total length. SC: Schlemm’s canal; SS: Scleral spur.
2.3 Data analysis
When both eyes met the diagnostic criteria, one eye was randomly selected for analysis, and qualified OCT images were acquired. All continuous variables are presented as mean ± standard deviation and categorical variables are as counts and percentages for each category. Inter-group differences were determined using the independent sample t-test (continuous data) or Fisher’s exact test (categorical data). The clinical data and morphological features of SC were compared between eyes with POAG and normal control eyes. Pearson’s correlation coefficient was used to determine the association between SC parameters and IOP. The intraclass correlation coefficient (ICC), which measures the proportion of total variability in measurements contributed by the variability in measurements between different participants, was determined using the random-effects mixed model. All statistical analyses were performed using the SPSS software (SPSS Statistics version 22.0; IBM Corp., Armonk, NY, United States). Statistical significance was defined as p < 0.05.
3 Results
3.1 Demographic characteristics of patients
One hundred individuals, including 50 POAG patients (50 eyes, 50%) and 50 healthy controls (50 eyes, 50%), participated in this study. The POAG group included 27 (54%) males and 23 (46%) females, whereas the control group included 26 (52%) males and 24 (48%) females. The mean age (mean ± SD) of the POAG and control groups was 42.74 ± 9.16 years and 40.16 ± 11.13 years, respectively. The mean IOP at imaging was significantly higher in the POAG group (20.21 ± 3.82 mmHg) than that in the control group (14.84 ± 2.62 mmHg). The mean refractions were −1.38 ± 1.19 D and −1.19 ± 1.18 D, the central corneal thickness (CCTs) were 541.18 ± 30.79 µm and 544.94 ± 25.57 µm, and the axial lengths were 23.64 ± 0.68 mm and 23.49 ± 0.66 mm in the POAG and control groups, respectively. The two groups showed no significant differences in sex, mean age, refractive error, CCT, or axial length. These data are summarized in Table 1.
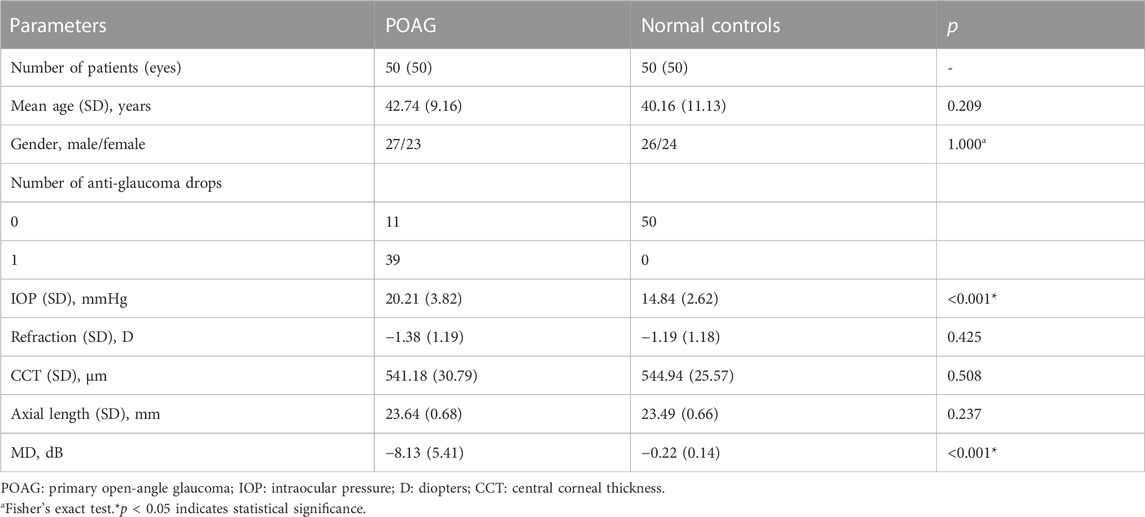
TABLE 1. Clinical characteristics of study subjects.
3.2 Comparison of SC parameters between POAG and normal controls
The number and proportion of eyes in which SC was observable are summarized in Table 2. SC was a black lucent ellipsoid space outside the trabecular meshwork on cross-section images and a dark curved line parallel to the corneal limbus in en face images, which was defined as observable based on both examiners’ judgments. En face images were reconstructed using a commercially available automated algorithm based on SS-OCT. The percentages of en face images with detectable SCs were 84% and 92% in the POAG and control groups, respectively, without a statistically significant difference between the temporal and nasal quadrants (p = 0.357). In cross-sectional images, the differences in the percentage of detectable SCs between the nasal and temporal quadrants were not significant in either POAG patients or normal controls. The intraclass correlation coefficient of SC parameters measured by the same observer (HH) was 0.95, and that measured by different observers (HH and TL) was 0.90. The repeatability and reproducibility of these parameters were excellent.
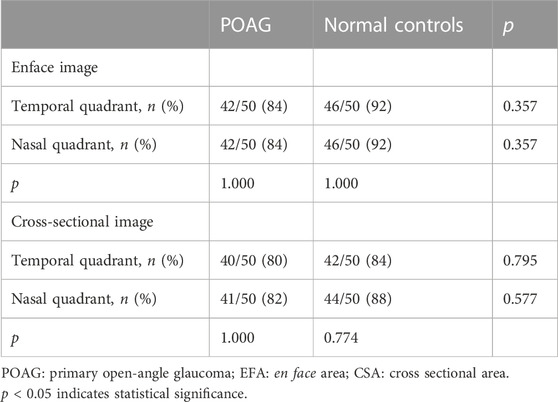
TABLE 2. Proportion of eyes with detectable SC in the POAG and the normal control groups.
Significant differences in SC parameters were observed between patients with POAG and normal controls (Table 3). Based on the en face images, the areas of SC in the temporal and nasal quadrants were significantly smaller in POAG patients (0.35 ± 0.14 mm2 in temporal quadrant and 0.36 ± 0.14 mm2 in nasal quadrant) than in normal controls (0.56 ± 0.22 mm2 in temporal quadrant and 0.58 ± 0.23 mm2 in nasal quadrant; both p < 0.001). The visible percentages of SC in the temporal and nasal quadrants of POAG patients (85.71% ± 14.26% in temporal quadrant and 87.10% ± 14.39% in nasal quadrant) were significantly lower than those of normal controls (94.91% ± 7.45% in temporal quadrant and 95.52% ± 6.70% in nasal quadrant; both p < 0.001). Based on cross-sectional images, the diameters of SC in the temporal and nasal quadrants in patients with POAG were also smaller than those in normal controls. In detail, the areas of SC in cross-sectional images of SCs in the POAG and control groups were respectively 2790.9 ± 942.2 µm2 and 4138.6 ± 2027.8 µm2 in the temporal quadrants and 2805.7 ± 947.2 µm2 and 4224.0 ± 2002.2 µm2 in the nasal quadrants (both p < 0.001). The diameters of SC in the temporal and nasal quadrants were respectively 123.1 ± 25.4 µm and 126.3 ± 28.9 µm in POAG patients and 149.5 ± 34.7 µm and 155.3 ± 36.0 µm in normal controls (both p < 0.001). Representative SC images obtained from control and POAG eyes are shown in Figure 2.
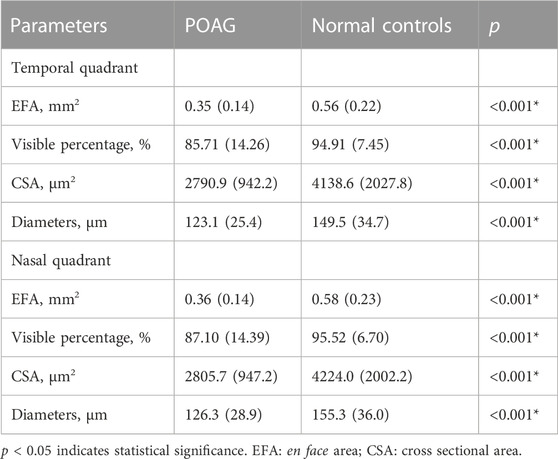
TABLE 3. The parameters of SC in the POAG and normal control groups.
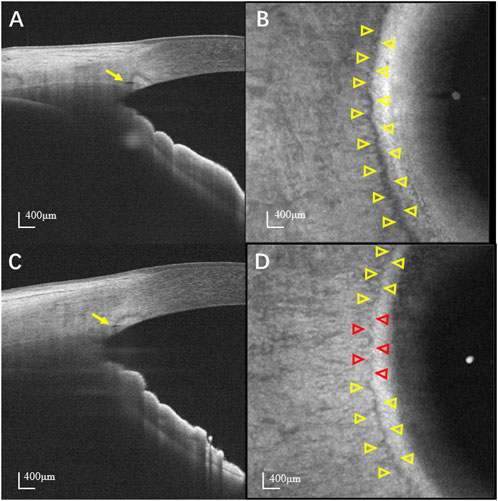
FIGURE 2. Representative images of SC. (A) Cross-sectional and (B) en face image of a normal eye. (C) Cross-sectional and (D) en face image of a POAG eye. Yellow and red arrowheads indicate the detectable and non-detectable SC, respectively. The SC is more prominent and continuous in normal eyes than that in POAG eyes. SC: Schlemm’s canal; POAG: Primary open angle glaucoma.
3.3 Correlation between IOP, MD and SC parameters
The associations of IOP, mean deviation (MD) of the visual field, and SC parameters in the POAG group are presented in Table 4 and Figure 3. There was a negative correlation between IOP and en face area (r = −0.453 and p = 0.003 in temporal quadrant, r = −0.426 and p = 0.005 in nasal quadrant) and visible percentage of SC (r = −0.357 and p = 0.020 in temporal quadrant, r = −0.357 and p = 0.020 in nasal quadrant). Meanwhile, IOP was also statistically significantly correlated with the cross-sectional area of SC in temporal quadrant (r = −0.368, p = 0.019) and nasal quadrant (r = −0.390, p = 0.012) in cross-section images. However, the diameters of SC in cross-sectional images had no correlation with IOP in either the temporal quadrant (r = −0.161, p = 0.322) or the nasal quadrant (r = −0.216, p = 0.175). Furthermore, no significant correlations were found between the MD of visual field and SC parameters (p > 0.05).
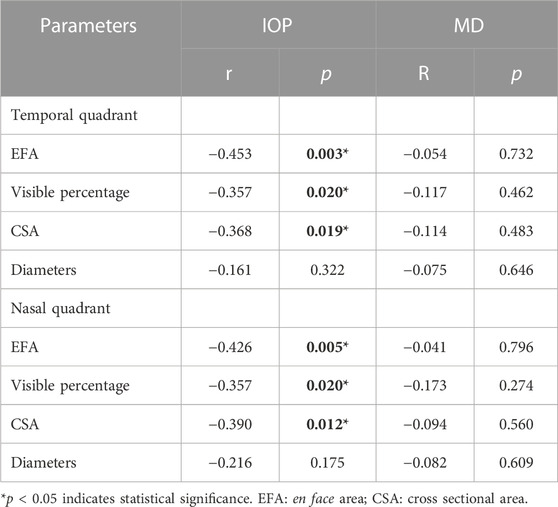
TABLE 4. Correlations between IOP, MD and SC parameters.

FIGURE 3. Correlations between EFA, CSA, and IOP. The EFA (A) and CSA (B) in the temporal and nasal quadrants in all POAG subjects were negatively correlated with IOP in the POAG patients with statistical significance. EFA: en face area; CSA: cross-sectional area; IOP: intraocular pressure.
4 Discussion
En face imaging showed that eyes with POAG had smaller SC diameters and areas and decreased visible percentages of SC compared with normal eyes. In addition, correlation analysis showed a significant relationship between IOP and SC parameters in both cross-sectional and en face images. These findings demonstrate the value of en face imaging using SS-OCT for identifying SC structures. To the best of our knowledge, this study is the first to describe and characterize the morphological features of SC in eyes with POAG using en face OCT.
SC is a circular channel in the eye that drains the majority of aqueous humor from the anterior chamber into the bloodstream (Dautriche et al., 2015; Lewczuk et al., 2022). SC’s shape, size, and function depend on the intraocular pressure (IOP). High IOP can cause SC to collapse (Battista et al., 2008; Grieshaber et al., 2010), the trabecular meshwork to herniate (Battista et al., 2008), and the collector channels to occlude, leading to increased outflow resistance and primary open-angle glaucoma (POAG). To date, OCT is the only device that supports noninvasive and contrast-free imaging of SC with high resolution. OCT visualization has enabled precise measurements of SC, with its meridional diameter ranging from 127 to 283 μm and cross-sectional area ranging from 4,064 to 13,991 μm2 in the normal eyes (Shi et al., 2012; Wang et al., 2012; Hong et al., 2013; Chen et al., 2018a; Chen et al., 2018b). Our results in the normal control group are consistent with these findings. Using OCT, Kagemann et al. (2014b) found that acute IOP elevation significantly reduced the SC area in healthy eyes. Moreover, several previous studies (Wang et al., 2012; Hong et al., 2013; Yan et al., 2016; Yuan et al., 2021) showed that eyes with POAG had a lower SC area and smaller SC diameter than that in normal eyes. Our results align with those of in vivo human OCT studies. However, in vivo SC cross-sectional imaging varies considerably among different participants and regions of the same eye (Li P et al., 2017). The location of the scan line also has a potential impact on SC imaging. Thus, two single cross-sectional slices of SC may not represent the entire SC of the eye. Accordingly, the cross-sectional imaging protocol used in most previous studies might have a measurement bias in SC.
En face OCT, which is widely used in retinal and choroidal diseases (Gallo et al., 2022; Kongwattananon et al., 2022), has been used to visualize vasculatures. Recent advancements in hardware and software have facilitated the incorporation of posterior segment OCT technologies into anterior segment OCT systems, enabling imaging that is free from motion artifacts and providing enhanced resolution and depth penetration. Within the AS-OCT systems, the en face section, also known as the coronal section, is a reconstructed plane that is tangential to the limbus and perpendicular to the ocular surface. Unlike radial cross-sections, which provide a sectional view of the SC lumen, en face sections offer a circumferential representation of SC. Huang et al. (Huang et al., 2017) demonstrated the ability to perform a 360° three-dimensional reconstruction of SC in one healthy volunteer eye using a commercial SD-OCT instrument that included an active eye tracker to compensate for motion artifacts. Meanwhile, Yao et al. (Yao et al., 2021) utilized SS-OCT to perform complete circumferential imaging of SC in two healthy human eyes. They reconstructed three-dimensional renderings of SC by stitching the segmented SCs from the volumetric datasets. The entire imaging session and extensive post-acquisition processing required a duration of 1–2 days for completion. In our study, an ultrahigh-speed SS-OCT system with an eye-tracker technique and a commercial fully automated segmentation algorithm was used to acquire and rebuild motion-free en face images with a size of 6 mm × 6 mm in the nasal and temporal limbal area quadrants within a short period, which provides more clinical viability. On en face images of the deep layer, SC was detected as a dark curved line parallel to the corneal limbus. The location and structural morphology of SC are similar to those reported in previous histopathological studies (Moses, 1979; Hann et al., 2011). In the POAG group, the structure of SC in en face images was presented as a vague discontinuous curved line parallel to the corneal limbus, which is in agreement with previous studies. Allingham et al. (1996) examined five enucleated POAG eyes and showed that POAG eyes had more histological variability in SC, the canal could not be delineated, and the anterior portion of SC was more collapsed and closed, probably owing to trabecular meshwork herniation and collector channel obstruction.
Furthermore, the notion of the visible percentage of en face SC was introduced in our study because of the variations in SC. The percentage of visible SC in the entire pathway indicates the patency of SC lumen, which represents the outflow facilities of the aqueous humor. As expected, the visible percentage of SC in en face images in POAG eyes was significantly lower than that in normal eyes. The visible percentage of SC in the POAG group was reduced by 9.2% and 8.42% in the temporal and nasal quadrants, respectively, compared with that in the normal group. In addition, the relationships between IOP and the visible percentage or en face area of SC were investigated separately. The visible percentage and en face area of SC were negatively correlated with IOP as well as the cross-sectional area of SC in POAG patients. These results suggest that changes in the shape of SC in glaucomatous eyes may increase the resistance of the aqueous humor outflow leading to a vicious cycle of IOP elevation, which is consistent with previous research (Allingham et al., 1996; Wang et al., 2012). The finding of an inverse correlation between the parameters of SC in en face imaging and IOP is a novel observation that provides further evidence that the three-dimensional shape of SC is significantly associated with IOP and probably with even better sensitivity. Our findings further support the minimally invasive glaucoma surgeries that target SC to reduce IOP, such as dilation of SC or removal of the inner wall of SC based on the results of en face imaging to modify aqueous humor outflow.
Typically, visualizing SC in en face images has several advantages. First, the detection and localization of en face SC become more straightforward. Second, en face SC imaging provides a more holistic assessment of the aqueous outflow structure, especially in glaucomatous eyes. Third, this intuitive visualization of SC structure may guide clinicians to achieve the maximum reduction of IOP at the surgical site. However, our study also has the following limitations: First, we did not assess the effect of antiglaucomatous drugs on SC measurements. Most patients (39/50) received prostaglandin analog eye drops to lower the IOP, which might have affected SC assessments. Second, we obtained SC morphology and parameters only for the nasal and temporal quadrants because the superior and inferior sections had low visibility and poor imaging quality owing to the eyelid interference, so we did not apply this method in our research. Future work will include a more comprehensive circumferential morphological analysis of SC. Third, the sample size was relatively small, rendering it challenging to investigate SC morphology at different POAG stages. Future research will enroll more patients.
In conclusion, we demonstrated that 1,060 nm SS-OCT could be used to perform nasal and temporal en face SC imaging and quantification in both POAG and normal eyes. By avoiding extensive post-acquisition processing, en face SC imaging enabled a more sophisticated analysis of SC morphology than cross-sectional imaging alone. The en face imaging offers a new way of visualizing and evaluating SC in POAG. This technique may guide the glaucoma procedures targeting SC and help to assess the post-surgical improvement in SC in the future.
Data availability statement
The original contributions presented in the study are included in the article/Supplementary Material, further inquiries can be directed to the corresponding author.
Ethics statement
The studies involving human participants were reviewed and approved by the Ethics Committee of Eye and ENT hospital, Fudan University, Shanghai, China. The patients/participants provided their written informed consent to participate in this study.
Author contributions
HH and LT performed the experiments, analyzed the data, and drafted the manuscript. XS provided financial support and edited the manuscript. YC designed the study, supervised the project, and edited the manuscript. All authors contributed to the article and approved the submitted version.
Funding
This work was generously supported by the funds from the National Natural Science Foundation of China (Grant No. 81870692), the Shanghai Committee of Science and Technology, China (Grant No. 20S31905800), and the Clinical Research Plan of SHDC (Grant No. SHDC2020CR6029).
Conflict of interest
The authors declare that the research was conducted in the absence of any commercial or financial relationships that could be construed as a potential conflict of interest.
Publisher’s note
All claims expressed in this article are solely those of the authors and do not necessarily represent those of their affiliated organizations, or those of the publisher, the editors and the reviewers. Any product that may be evaluated in this article, or claim that may be made by its manufacturer, is not guaranteed or endorsed by the publisher.
References
Allingham R. R., de Kater A. W., Ethier C. R. (1996). Schlemm’s canal and primary open angle glaucoma: correlation between Schlemm’s canal dimensions and outflow facility. Exp. Eye Res. 62 (1), 101–109. Available at. doi:10.1006/exer.1996.0012
Ang M., Baskaran M., Werkmeister R. M., Chua J., Schmidl D., Dos Santos V., et al. (2018). Anterior segment optical coherence tomography. Prog. Retin. Eye Res., 132–56. Available at. doi:10.1016/j.preteyeres.2018.04.002
Battista S. A., Lu Z., Hofmann S., Freddo T., Overby D. R., Gong H. (2008). Reduction of the available area for aqueous humor outflow and increase in meshwork herniations into collector channels following acute IOP elevation in bovine eyes. Investigative Ophthalmol. Vis. Sci. 49 (12), 5346–5352. Available at. doi:10.1167/iovs.08-1707
Chen J., Huang H., Zhang S., Chen X., Sun X. (2013). Expansion of Schlemm’s canal by travoprost in healthy subjects determined by Fourier-domain optical coherence tomography. Investigative Ophthalmol. Vis. Sci. 54 (2), 1127–1134. Available at. doi:10.1167/iovs.12-10396
Chen Z., Song Y., Li M., Chen W., Liu S., Cai Z., et al. (2018b). Schlemm’s canal and trabecular meshwork morphology in high myopia. Ophthalmic Physiological Opt. 38 (3), 266–272. Available at. doi:10.1111/opo.12451
Chen Z., Sun J., Li M., Liu S., Chen L., Jing S., et al. (2018a). Effect of age on the morphologies of the human Schlemm’s canal and trabecular meshwork measured with swept-source optical coherence tomography. Eye Lond. Engl. 32 (10), 1621–1628. Available at. doi:10.1038/s41433-018-0148-6
Dautriche C. N., Tian Y., Xie Y., Sharfstein S. T. (2015). A closer look at schlemm’s canal cell Physiology: implications for biomimetics. J. Funct. Biomaterials 6 (3), 963–985. Available at. doi:10.3390/jfb6030963
Flaxman S. R., Bourne R. R. A., Resnikoff S., Ackland P., Braithwaite T., Cicinelli M. V., et al. (2017). Global causes of blindness and distance vision impairment 1990-2020: a systematic review and meta-analysis. Lancet. Glob. Health 5 (12), e1221–e1234. Available at. doi:10.1016/S2214-109X(17)30393-5
Gallo B., de Silva S. R., Mahroo O. A, Saihan Z., Patel P. J., Dowler J. G., et al. (2022). Choroidal macrovessels: multimodal imaging findings and review of the literature. Br J Ophthalmol. 106 (4), 568–75. Available at. doi:10.1136/bjophthalmol-2020-318095
Grieshaber M. C., Pienaar A., Olivier J., Stegmann R. (2010). Clinical evaluation of the aqueous outflow system in primary open-angle glaucoma for canaloplasty. Investigative Ophthalmol. Vis. Sci. 51 (3), 1498–1504. Available at. doi:10.1167/iovs.09-4327
Hann C. R., Bentley M. D., Vercnocke A., Ritman E. L., Fautsch M. P. (2011). Imaging the aqueous humor outflow pathway in human eyes by three-dimensional micro-computed tomography (3D micro-CT). Exp. Eye Res. 92 (2), 104–111. Available at. doi:10.1016/j.exer.2010.12.010
Hong J., Xu J., Wei A., Wen W., Chen J., Yu X., et al. (2013). Spectral-domain optical coherence tomographic assessment of Schlemm’s canal in Chinese subjects with primary open-angle glaucoma. Ophthalmology 120 (4), 709–715. Available at. doi:10.1016/j.ophtha.2012.10.008
Huang A. S., Belghith A., Dastiridou A., Chopra V., Zangwill L. M., Weinreb R. N., et al. (2017). Automated circumferential construction of first-order aqueous humor outflow pathways using spectral-domain optical coherence tomography. J. Biomed. Opt. 22 (6), 66010. Available at. doi:10.1117/1.JBO.22.6.066010
Johnson M. C., Kamm R. D. (1983). The role of Schlemm’s canal in aqueous outflow from the human eye. Investigative Ophthalmol. Vis. Sci. 24 (3), 320–325.
Johnstone M. A., Grant W. G. (1973). Pressure-dependent changes in structures of the aqueous outflow system of human and monkey eyes. Am. J. Ophthalmol. 75 (3), 365–383. Available at. doi:10.1016/0002-9394(73)91145-8
Kagemann L., Nevins J. E., Jan N. J., Wollstein G., Ishikawa H., Kagemann J., et al. (2014a). Characterisation of Schlemm’s canal cross-sectional area. Br. J. Ophthalmol. 98 (2), ii10–ii14. Available at. doi:10.1136/bjophthalmol-2013-304629
Kagemann L., Wang B., Wollstein G., Ishikawa H., Nevins J. E., Nadler Z., et al. (2014b). IOP elevation reduces schlemm’s canal cross-sectional area. Investigative Ophthalmol. Vis. Sci. 55 (3), 1805–1809. Available at. doi:10.1167/iovs.13-13264
Kongwattananon W., Grasic D., Lin H., Oyeniran E., Nida Sen H., Kodati S., et al. (2022). Role of optical coherence tomography angiography in detecting and monitoring inflammatory choroidal neovascularization. Retina (Philadelphia, Pa) 42 (6), 1047–56. Available at. doi:10.1097/IAE.0000000000003420
Lewczuk K., Jabłońska J., Konopińska J., Mariak Z., Rękas M. (2022). Schlemm’s canal: the outflow “vessel”. Acta Ophthalmol. 100 (4), e881–e890. Available at. doi:10.1111/aos.15027
Li M., Zhao Y., Yan X., Zhang H. (2017). The relationship between the 24-hour fluctuations in schlemm’s canal and intraocular pressure: an observational study using high-frequency ultrasound biomicroscopy. Curr. Eye Res. 42 (10), 1389–1395. Available at. doi:10.1080/02713683.2017.1324631
Li P., Butt A., Chien J. L., Ghassibi M. P., Furlanetto R. L., Netto C. F., et al. (2017). Characteristics and variations of in vivo Schlemm’s canal and collector channel microstructures in enhanced-depth imaging optical coherence tomography. Br. J. Ophthalmol. 101 (6), 808–813. Available at. doi:10.1136/bjophthalmol-2016-309295
Moses R. A. (1979). Circumferential flow in Schlemm’s canal. Am. J. Ophthalmol. 88 (2), 585–591. Available at. doi:10.1016/0002-9394(79)90519-1
Okamoto Y., Akagi T., Kameda T., Suda K., Miyake M., Ikeda H. O., et al. (2022). Changes in the deep vasculature assessed using anterior segment OCT angiography following trabecular meshwork targeted minimally invasive glaucoma surgery. Sci. Rep. 12 (1), 17187. Available at. doi:10.1038/s41598-022-22104-4
Shi G., Wang F., Li X., Lu J., Ding Z., Sun X., et al. (2012). Morphometric measurement of Schlemm’s canal in normal human eye using anterior segment swept source optical coherence tomography. J. Biomed. Opt. 17 (1), 016016. Available at. doi:10.1117/1.JBO.17.1.016016
Van Buskirk E. M. (1982). Anatomic correlates of changing aqueous outflow facility in excised human eyes. Investigative Ophthalmol. Vis. Sci. 22 (5), 625–632.
Wang F., Shi G., Li X., Lu J., Ding Z., Sun X., et al. (2012). Comparison of Schlemm’s canal’s biological parameters in primary open-angle glaucoma and normal human eyes with swept source optical. J. Biomed. Opt. 17 (11), 116008. Available at. doi:10.1117/1.JBO.17.11.116008
Yan X., Li M., Chen Z., Zhu Y., Song Y., Zhang H. (2016). Schlemm’s canal and trabecular meshwork in eyes with primary open angle glaucoma: a comparative study using high-frequency ultrasound biomicroscopy. PloS One 11 (1), e0145824. Available at. doi:10.1371/journal.pone.0145824
Yao X., Tan B., Ho Y., Liu X., Wong D., Chua J., et al. (2021). Full circumferential morphological analysis of Schlemm’s canal in human eyes using megahertz swept source OCT. Biomed. Opt. Express 12 (7), 3865–77. Available at. doi:10.1364/BOE.426218
Yuan Y., Lin T. P. H., Gao K., Zhou R., Radke N. V., Lam D. S. C., et al. (2021). Aerobic exercise reduces intraocular pressure and expands Schlemm’s canal dimensions in healthy and primary open-angle glaucoma eyes. Indian J. Ophthalmol. 69 (5), 1127–1134. Available at. doi:10.4103/ijo.IJO_2858_20
Keywords: Schlemm’s canal, primary open angle glaucoma, swept source optical coherence tomography, three-dimension, en face
Citation: Huang H, Tian L, Sun X and Chen Y (2023) En face optical coherence tomography detection of Schlemm’s canal in primary open angle glaucoma. Front. Physiol. 14:1214427. doi: 10.3389/fphys.2023.1214427
Received: 29 April 2023; Accepted: 23 October 2023;
Published: 02 November 2023.
Edited by:
Xiaobo Qu, Xiamen University, ChinaReviewed by:
Kari Vienola, University of Turku, FinlandPengfei Zhang, Dalian University of Technology, China
Copyright © 2023 Huang, Tian, Sun and Chen. This is an open-access article distributed under the terms of the Creative Commons Attribution License (CC BY). The use, distribution or reproduction in other forums is permitted, provided the original author(s) and the copyright owner(s) are credited and that the original publication in this journal is cited, in accordance with accepted academic practice. No use, distribution or reproduction is permitted which does not comply with these terms.
*Correspondence: Yuhong Chen, yuhongchen@fudan.edu.cn
†These authors have contributed equally to this work