 Hong-Jia Yang
 Meng-Yao Cui
- College of Plant Protection, Northeast Agricultural University, Harbin, China
Trehalose is a substrate for the chitin synthesis pathway in insects. Thus, it directly affects chitin synthesis and metabolism. Trehalose-6-phosphate synthase (TPS) is a crucial enzyme in the trehalose synthesis pathway in insects, but its functions in Mythimna separata remain unclear. In this study, a TPS-encoding sequence in M. separata (MsTPS) was cloned and characterized. Its expression patterns at different developmental stages and in diverse tissues were investigated. The results indicated that MsTPS was expressed at all analyzed developmental stages, with peak expression levels in the pupal stage. Moreover, MsTPS was expressed in the foregut, midgut, hindgut, fat body, salivary gland, Malpighian tubules, and integument, with the highest expression levels in the fat body. The inhibition of MsTPS expression via RNA interference (RNAi) resulted in significant decreases in the trehalose content and TPS activity. It also resulted in significant changes in Chitin synthase (MsCHSA and MsCHSB) expression, and significantly decrease the chitin content in the midgut and integument of M. separata. Additionally, the silencing of MsTPS was associated with a significant decrease in M. separata weight, larval feed intake, and ability to utilize food. It also induced abnormal phenotypic changes and increased the M. separata mortality and malformation rates. Hence, MsTPS is important for M. separata chitin synthesis. The results of this study also suggest RNAi technology may be useful for enhancing the methods used to control M. separata infestations.
1 Introduction
Trehalose, which is an important blood sugar in insects, accounts for 80%–90% of the carbohydrate content in the insect hemolymph. It is present in almost all insect tissues and is a crucial source of energy (Hottiger et al., 1987). Trehalose synthesis is an important process affecting insect growth and development, physiological homeostasis, ovum formation, and energy metabolism (Santos et al., 2012). In insects, trehalose is synthesized mainly through the TPS/TPP pathway. Specifically, trehalose-6-phosphate is a product of a reaction between uridine diphosphate glucose and glucose-6-phosphate catalyzed by trehalose-6-phosphate synthase (TPS). Trehalose-6-phosphate phosphatase (TPP) then converts trehalose-6-phosphate to trehalose (Giaever et al., 1988; Strom and Kaasen, 1993; Shukla et al., 2015; Yang et al., 2017). Previous studies revealed that trehalose is synthesized in the fat body of insects (Shukla et al., 2015; Yang et al., 2017). Subsequent research confirmed that TPS genes are highly expressed in insect fat body (Chen et al., 2020). TPS is a key enzyme in the trehalose synthesis pathway in insects. Although TPP has been detected in some insects, most insects contain only TPS (Tang et al., 2014). To date, the TPS sequences in more than 50 insect species have been cloned (Tang et al., 2018). Among insects, Drosophila melanogaster was the first to have its TPS gene cloned (Chen et al., 2002), after which the TPS genes of Locusta migratoria (Cui and Xia, 2009), Leptinotarsa decemlineata (Shi et al., 2016), Diaphorina citri (Song et al., 2021) and other insects were cloned. These genes encode proteins comprising approximately 800 amino acids, with two highly conserved TPS and TPP domains.
The synthesis, transformation, and modification of chitin are critical for insect growth and development. Trehalose is considered to be the main substrate for chitin synthesis (Shi et al., 2016; Xiong et al., 2016). The silencing of TPS genes in insects can affect the trehalose and chitin contents, while also leading to abnormal molting, growth, and development, and may even lead to death. In an earlier study, after TcTPS expression was inhibited in Tribolium castaneum, the CHS1 expression level increased significantly at 72 h, whereas the CHS2 expression level decreased significantly at 48 and 72 h. Moreover, some of the tested insects were unable to pupate normally and their chitin content decreased (Chen et al., 2018). Another study demonstrated that the inhibition of SeTPS expression in Spodoptera exigua leads to a decrease in the trehalose content as well as mortality rates of 50.94% and 66.76% at 48 and 204 h, respectively (Tang et al., 2010). The injection of Bactrocera minax larvae with dsRNA to silence BmTPS expression reportedly significantly decreases the TPS activity, trehalose content, and the expression of three key genes in the chitin biosynthesis pathway, ultimately resulting in an abnormal phenotype and a mortality rate of 52% (Xiong et al., 2016).
Mythimna separata (Lepidoptera: Noctuidae) is a polyphagous insect that mainly infests corn, wheat, rice, sorghum, and other food crops. It is distributed worldwide (Zhang et al., 2018). At sufficiently high densities, M. separata can seriously decrease agricultural production. In this study, we identified a TPS cDNA sequence in the M. separata transcriptome database. The spatiotemporal expression pattern of MsTPS was analyzed. Furthermore, MsTPS was functionally characterized on the basis of RNA interference (RNAi) experiments. The results of this study may be useful for developing new methods for controlling M. separata.
2 Materials and methods
2.1 Insect rearing
Mythimna separata larvae were collected from Xiangyang Station of Northeast Agricultural University (Harbin, China) and transferred to an artificial climate chamber for the rearing of several generations. The incubation conditions were as follows: temperature, 25°C ± 1°C; humidity, 60%–70%; photoperiod, 14-h light:10-h dark cycle. Larvae were fed fresh corn leaves and adults were fed 5% honey water until they laid eggs.
2.2 Cloning of MsTPS cDNA
Various larval instars were collected and flash-frozen in liquid nitrogen for the subsequent transcriptome sequencing, which was performed by Annoroad Gene Technology company (Beijing, China). The M. separata transcriptome database was screened for the TPS sequence, which was then analyzed and compared with the sequences in the NCBI database.
Total RNA was extracted from fourth instar larvae using TRIzol (Invitrogen, Carlsbad, CA, United States) according to the manufacturer’s instructions. First-strand cDNA was synthesized from 1.0 µg total RNA using the ReverTra Ace qPCR RT Master Mix with gDNA Remover (Toyobo, Shanghai, China). On the basis of the screened sequence, primers MsTPS-F and MsTPS-R (Supplementary Table S1) were designed using the Primer Premier 5.0 software for the PCR amplification of the MsTPS sequence. The synthesized cDNA served as the template for the PCR. The PCR amplification product was then purified using the Monarch Gel Extraction kit (NEB, Ipswich, MA, United States), inserted into the Trans1-T1 cloning vector (TransGen Biotech, Beijing, China), and sequenced to confirm its accuracy.
2.3 Amino acid sequence analysis and phylogenetic tree construction
The obtained MsTPS sequence was registered and deposited in the NCBI database (https://www.ncbi.nlm.nih.gov/). The MsTPS open reading frame was predicted and translated using ORF Finder (https://www.ncbi.nlm.nih.gov/orffinder/). The isoelectric point and molecular weight of the encoded amino acid sequence were predicted using the Expasy Compute pI/Mw online tool (https://www.expasy.org/). Its conserved domains were detected using the SMART online program (http://smart.embl-heidelberg.de/). Additionally, 31 known insect TPS amino acid sequences were downloaded from the NCBI database for the construction of a phylogenetic tree according to the maximum likelihood method with best-fitting model of MEGA7.0, with 1,000 bootstrap replicates (Kumar et al., 2016).
2.4 Spatiotemporal MsTPS expression pattern
Total RNA was extracted from insects at different developmental stages (i.e., first-day first to sixth instar larvae, prepupae, pupae, and adults) and from various tissues (i.e., foregut, midgut, hindgut, fat body, salivary gland, Malpighian tubules, and integument). The MsTPS expression levels in different M. separata developmental stages and tissues were analyzed by quantitative real-time PCR (qRT-PCR), with Msβ-actin (GenBank accession number: GQ856238) and MsGAPDH (glyceraldehyde-3-phosphate dehydrogenase; GenBank accession number: HM055756) used as reference genes. Primer Premier 5.0 was used to design qRT-PCR primer pairs MsTPS-q-F and MsTPS-q-R, Msβ-actin-q-F and Msβ-actin-q-R, and MsGAPDH-q-F and MsGAPDH-q-R (Supplementary Table S1). The qRT-PCR mixture comprised 2 µl cDNA, 6.8 µl ddH2O, 0.6 µl sense and anti-sense primers, and 10 µl THUNDERBIRD SYBR qPCR Mix kit (Toyobo, Shanghai, China). The qRT-PCR was performed using the SimpliAmp PCR instrument (Thermo Fisher Scientific, MA, United States of America), with the following PCR conditions: 95°C for 3 min; 40 cycles of 94°C for 10 s and 57°C for 30 s. The data were recorded using the Bio-Rad CFX Manager 3.1 software. Melting curves were checked to assess the specificity of the qRT-PCR. Moreover, primer efficiency was validated before analyzing gene expression. The qRT-PCR was completed using three technical replicates and three biological replicates.
2.5 SiRNA synthesis and interference
For the RNAi analysis, siRNA sequences for MsTPS (GCGUUACAGGAACAGGUUUTT and AAACCUGUUCCUGUAACGCTT) as well as for the negative control (UUCUCCGAACGUGUCACGUTT and ACGUGACACGUUCGGAGAATT) were synthesized (GenePharma, Shanghai, China) (Guo et al., 2018). The siRNA sequences were diluted and dissolved in DEPC-treated water for a final concentration of 20 µM. The first-day fourth instar larvae were injected with 2 µl siRNA for MsTPS or the negative control using a microsyringe. The larvae were fed normally after the injection.
2.6 Post-RNAi MsTPS expression
Larvae were collected at 3, 6, 12, 24, 48, 72, and 96 h after the injection of siRNA. Total RNA was extracted from the larvae and then reverse transcribed to cDNA for an analysis of MsTPS expression by qRT-PCR.
2.7 Effect of MsTPS silencing on chitin synthase gene expression
To explore the effect of MsTPS silencing on the expression of MsCHSA (GenBank accession number: KT948989) and MsCHSB (GenBank accession number: KY348776), Primer Premier 5.0 was used to design qRT-PCR primer pairs MsCHSA-q-F and MsCHSA-q-R as well as MsCHSB-q-F and MsCHSB-q-R (Supplementary Table S1). The MsCHSA and MsCHSB expression levels were analyzed using the cDNA that was used for the post-RNAi examination of MsTPS expression.
2.8 Post-RNAi TPS activity
Larvae collected at 3, 6, 12, 24, 48, 72, and 96 h after the injection of siRNA were used to measure the MsTPS activity according to the instructions for the Insect TPS Enzyme-linked Immunoassay (ELISA) kit (Jiangsu Meibiao Biotechnology Co., Ltd., Jiangsu, China). The protein concentrations of the samples were determined on the basis of Coomassie brilliant blue staining as previously described (Bradford, 1976), with a standard curve prepared using bovine serum albumin (Takara, Dalian, China). Briefly, 20 µl each sample and 180 µL Coomassie brilliant blue dye (Takara) were added to a 96-well plate, which was then incubated at room temperature for 5 min before the absorbance at 595 nm was measured.
2.9 Post-RNAi trehalose content
A previously reported method was used to determine the trehalose content (Steele, 1988; Ge et al., 2011) of three replicates of larvae collected at 3, 6, 12, 24, 48, 72, and 96 h after the injection of siRNA. A standard curve was prepared with trehalose concentrations of 0.05, 0.1, 0.2, 0.4, 0.6, 0.8, and 1.6 mmol/L. Each sample was placed in a sterilized homogenizer and then ground after 1 mL PBS (pH 7.4) was added. The samples were centrifuged at 5,000 g for 20 min at 4°C. The supernatants were collected and added to a 96-well plate. Following the addition of 5 µl 1% H2SO4 solution to each well, the 96-well plate was heated at 90°C for 10 min and then cooled on ice. Next, 5 µl 30% KOH solution was added to each well and then the 96-well plate was heated at 90°C for 10 min. After cooling the 96-well plate on ice, 100 µl chromogenic agent (0.02 g anthranone in 10 ml 80% H2SO4 solution) was added to each well, after which the 96-well plate was heated at 90°C for 10 min and then inserted into a microplate reader (Tecan, Hombrechtikon, Switzerland). The absorbance at 630 nm was recorded for each sample. The protein concentrations of the samples were determined as previously described (Bradford, 1976).
2.10 Post-RNAi chitin contents in the midgut and integument
A previously reported method was used to determine the chitin content (Arakane et al., 2005) of larvae collected and weighed at 3, 6, 12, 24, 48, 72, and 96 h after the injection of siRNA. Each analysis was performed using three replicates of 15 larvae. The larvae were dissected in normal saline to obtain the midgut and integument samples, which were placed in a 1.5-mL centrifuge tube and then ground to a powder in liquid nitrogen. After adding 500 µl 6% KOH solution, the ground samples were heated at 80°C for 90 min and then centrifuged at 12,000 g for 20 min at 4°C. The supernatant was discarded and each sample was suspended in 1 mL PBS buffer and then centrifuged at 12,000 g for 20 min at 4°C. After discarding the supernatant, each sample was resuspended in 200 µl Mcllvaine buffer (pH 6.0) (Tianzd, Beijing, China). To hydrolyze chitin to N-acetyl glucosamine (GlcNAc), 50 µl chitinase from Streptomyces griseus (Sigma-Aldrich, Shanghai, China) was added to individual samples, which were then incubated for 72 h at 37°C.
The GlcNAc concentrations were determined using a modified Morgan-Elson assay (Reissig et al., 1955). Briefly, various GlcNAc concentrations (0.00025, 0.0005, 0.001, 0.002, 0.004, and 0.008 mol/L) were used as standards. The samples incubated for 72 h were centrifuged at 12,000 g for 20 min at 4°C. For each sample, 10 µl supernatant and different GlcNAc standards were added to new centrifuge tubes. Next, 10 µL 0.27 mol/L sodium tetraborate was added to individual samples, which were then heated at 99.9°C for 10 min. The samples were immediately cooled to room temperature and then mixed with 100 µl 10% DMAB solution (10 g p-dimethylaminobenzaldehyde in a solution comprising 12.5 ml concentrated hydrochloric acid and 87.5 ml glacial acetic acid, diluted 1:10 with glacial acetic acid). The samples were heated at 37°C for 20 min and then centrifuged at 12,000 g for 5 min at 4°C. An 80-µl aliquot of each sample was transferred to a 96-well plate, and the absorbance at 585 nm was recorded. Standard curves were prepared using the different GlcNAc concentrations.
2.11 Effects of MsTPS silencing on the ability of M. separata to utilize food
Fourth instar larvae were injected with 2 µL siRNA targeting MsTPS using a microsyringe. The control larvae were injected with 2 µl negative control siRNA. The larvae were subsequently fed normally (i.e., fresh corn leaves). At 3, 6, 12, 24, 48, 72, and 96 h after the injection of siRNA, larvae, remaining corn leaves, and excreta were placed in a 70°C oven and dried until they reached a constant weight. The following indices were recorded: 1) fresh weight of the larvae before the experiment; 2) fresh weight of the corn leaves before feeding; 3) dry weight of the remaining corn leaves for each time-point; 4) dry weight of the excreta (Zhao et al., 2017). The analysis was completed using three replicates of 15 larvae.
To determine the dry weight of the larvae before the experiment, 45 larvae from the same batch were selected at the beginning of the experiment and divided into three replicates. The fresh weight of the larvae was recorded. The larvae were then dried to obtain the dry weight. The larval dry weight:fresh weight ratio was calculated. The dry weight of the larvae before the experiment was calculated according to the dry weight:fresh weight ratio. The dry weight of the fresh corn leaves before feeding was similarly determined.
The ability of insects to digest and use food was evaluated on the basis of nutritional indices, including increase in dry weight W), larval feed intake B), relative growth rate (RGR), relative consumption rate (RCR), efficiency of the conversion of digested food (ECD), efficiency of the conversion of ingested food (ECI), and approximate digestibility (AD). These indices were calculated as follows (Waldbauer, 1968; Mole and Zera, 1993).
• W (g) = dry weight of larvae after the experiment − dry weight of larvae before the experiment
• B (g) = leaf dry weight before feeding − leaf dry weight after feeding
• RGR [g∙(g∙h)−1] = W/(dry weight of larvae before the experiment × experiment time)
• RCR [g∙(g∙h)−1] = B/(dry weight of larvae before the experiment × experiment time)
• ECD (%) = [W/(B− dry weight of excreta)] × 100
• ECI (%) = (W/B) × 100
• AD (%) = [(B− dry weight of excreta)/B] × 100
2.12 Effects of MsTPS silencing on M. separata growth and development
Fourth instar larvae were injected with 2 µl siRNA targeting MsTPS using a microsyringe. The control larvae were injected with 2 µl negative control siRNA. The larvae were subsequently fed normally (i.e., fresh corn leaves). Five replicates were prepared, with 30 larvae per group. The larvae were examined every 6 h. The time of death, the time of each molting, and the weight after each molting were recorded to detect abnormal molting. Finally, the mortality rates at 24, 48, and 72 h were calculated. The time required for the fifth instar larvae, sixth instar larvae, and pupae to develop was recorded. The weight of the fifth instar larvae, sixth instar larvae, and pupae was determined. The rates of abnormal molting and pupation were calculated.
The Helicon Focus digital photograph depth-of-field processing tool and the Helicon Remote camera control software were used to photograph and analyze (5–20 focal planes) the insects that exhibited abnormal development.
2.13 Statistical analysis
The qRT-PCR data were analyzed according to a published 2−ΔΔCT method (Jo et al., 2002). Statistical analysis was carried out with GraphPad Prism 9.3.0 software. Outliers were removed using Grubbs’ test (GraphPad online software). Shapiro-Wilk’s test was used to check normality in distribution. Resulting pairs were compared using the Student’s t-test. One-way ANOVA was applied to determine the significant differences (p < 0.05) for different groups by using the Tukey’s test. Then the results were plotted using the software GraphPad Prism 9.3.0.
3 Results
3.1 Analysis of the MsTPS cDNA and amino acid sequences
A novel M. separata TPS cDNA sequence (MsTPS; GenBank accession number: MN832898) was identified on the basis of transcriptome sequencing data. A sequence analysis revealed that the MsTPS cDNA is 4,551 bp long, with an open reading frame comprising 2,490 bp. The encoded protein (829 amino acids) has an isoelectric point of 6.68 and a molecular weight of 93.01 kDa. Moreover, it includes two conserved domains, namely, TPS (amino acids 19–499) and TPP (amino acids 537–762).
3.2 Phylogenetic analysis of MsTPS
In the phylogenetic tree constructed for MsTPS and other insect TPS sequences, MsTPS was clustered with the TPS of S. exigua (ABM66814), Spodoptera litura (XP_022814358), and Spodoptera frugiperda (XP_035433508), indicative of a relatively close relationship. It was also clustered with the TPS of Helicoverpa armigera (XP_021201246), Bombyx mori (XP_004926812), Manduca sexta (XP_030020846), Papilio xuthus (XP_013178239), Antheraea pernyi (ARD05072), and Heortia vitessoides (AYO46920). In contrast, MsTPS was distantly related to the TPS of Aphis glycines (QII15889) (Supplementary Figure S1). The clustering of TPS from various species was basically consistent with the morphological classification of these insects.
3.3 Spatiotemporal MsTPS expression pattern
To clarify the MsTPS expression pattern during different M. separata developmental stages, the larvae, prepupae, pupae, and adults were analyzed by qRT-PCR. The results showed that MsTPS was expressed in all examined M. separata developmental stages, but the relative MsTPS expression level was lowest in the first instar larvae. Additionally, MsTPS was expressed at significantly higher levels in the prepupal, pupal, and adult stages than in the larval stages. The peak MsTPS expression level, which was detected in the pupal stage, was 107.76-fold and 1.19-fold higher than the corresponding expression levels in the first instar larval stage and the adult stage, respectively (Figure 1A).
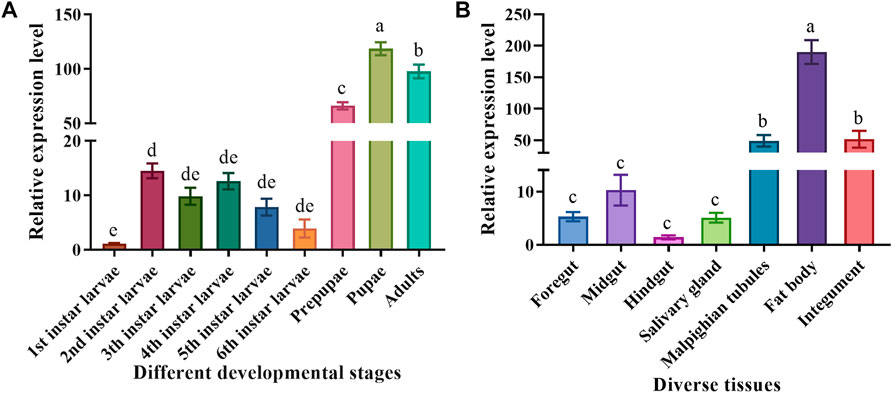
FIGURE 1. Spatiotemporal MsTPS expression pattern in different developmental stages (A) and in diverse tissues (B) of M. separata. The qRT-PCR data for MsTPS were analyzed using the 2−ΔΔCT method to determine relative expression levels, which were calculated as the mean ± SE. The expression data were normalized on the basis of the geometric mean of the expression of two reference genes (encoding β-actin and glyceraldehyde-3-phosphate dehydrogenase). The GraphPad Prism software was used for the data analysis. Different letters indicate significant differences (p < 0.05) according to the Tukey’s test.
To explore the MsTPS expression pattern in diverse M. separata tissues, the fourth instar larvae were dissected to obtain the following seven tissues: foregut, midgut, hindgut, fat body, salivary gland, Malpighian tubules, and integument. The results of the qRT-PCR analysis indicated MsTPS was expressed in all examined tissues. The relative MsTPS expression level was lowest in the hindgut. The MsTPS expression levels were significantly higher in the Malpighian tubules and integument than in the foregut, midgut, hindgut, and salivary gland. The MsTPS expression level in the integument was higher than that in the Malpighian tubules, but this difference was not significant. The highest MsTPS expression level, which was detected in the fat body, was 3.51-fold and 134.87-fold higher than the corresponding expression levels in the integument and the hindgut, respectively (Figure 1B).
3.4 Post-RNAi MsTPS silencing efficiency
To assess how efficiently MsTPS was silenced by RNAi, the fourth instar larvae were injected with equal amounts of siRNA for MsTPS and the negative control. The MsTPS expression level was analyzed at 3, 6, 12, 24, 48, 72, and 96 h after the injection. At the 3, 6, 12, 24, and 48 h time-points, the MsTPS expression levels were extremely significantly lower in the treated group than in the control group, with inhibition rates of 72.48%, 86.46%, 85.80%, 29.58%, and 69.35%, respectively. Although the MsTPS expression levels increased at 72 and 96 h, there was no significant difference in the expression levels of the treated and control groups (Figure 2). Therefore, MsTPS was most efficiently silenced at 6 h post-injection.
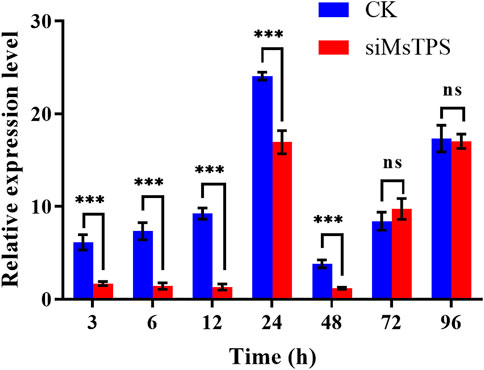
FIGURE 2. Expression of MsTPS at different post-RNAi time-points. The relative MsTPS expression levels were determined by qRT-PCR and the 2−ΔΔCT data analysis method. The expression data are provided as the mean ± SE. Data were normalized against the expression data for two reference genes (encoding β-actin and glyceraldehyde-3-phosphate dehydrogenase). Statistical analyses were performed using the GraphPad Prism software. Statistically significant differences by t-test at same treatment time shown as asterisks (*p < 0.05, **p < 0.01, ***p < 0.001, ns > 0.05).
3.5 Changes in the TPS activity and trehalose content after the silencing of MsTPS
To functionally characterize MsTPS, the TPS activity and trehalose content in M. separata were analyzed at 3, 6, 12, 24, 48, 72, and 96 h post-RNAi treatment. Compared with the control, the TPS activity at 3, 6, and 12 h post-RNAi treatment decreased by 76.52%, 52.86%, and 54.22%, respectively. In contrast, there were no significant differences in TPS activity between the treated and control groups at the 24, 48, 72, and 96 h time-points (Figure 3A). Compared with the control level, the trehalose content decreased extremely significantly when MsTPS was silenced for 3, 6, and 96 h (decreased by 23.17%, 24.88%, and 27.15%, respectively). There were no significant differences in the trehalose content between the treated and control groups at the 12, 24, 48, and 72 h time-points (Figure 3B).
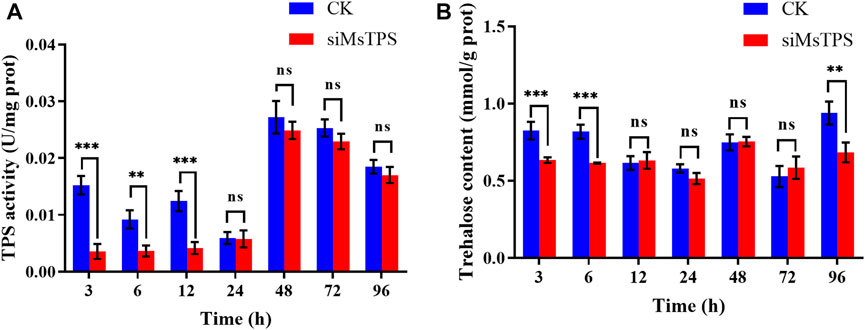
FIGURE 3. M. separata TPS activity (A) and trehalose content (B) at different time-points after the MsTPS RNAi treatment. Data are presented as the mean ± SE. Statistical analyses were performed using the GraphPad Prism software. Statistically significant differences by t-test at same treatment time shown as asterisks (*p < 0.05, **p < 0.01, ***p < 0.001, ns > 0.05).
3.6 Analysis of chitin synthase gene expression and chitin content after the silencing of MsTPS
To investigate whether the silencing of MsTPS affected the expression of MsCHS, larvae were collected at 3, 6, 12, 24, 48, 72, and 96 h after the RNAi treatment for an examination of MsCHSA and MsCHSB expression. At the 12 h time-point, MsCHSA was expressed at a significantly lower level in the treated group than in the control group, and the silencing of MsTPS significantly increased the MsCHSA expression at the 24 and 72 h time-points (Figure 4A). In addition, the silencing of MsTPS significantly increased the MsCHSB expression at 72 h time-point and significantly decreased at 96 h time-point (Figure 4B). The results implying that inhibited MsTPS expression adversely affected MsCHS expression.
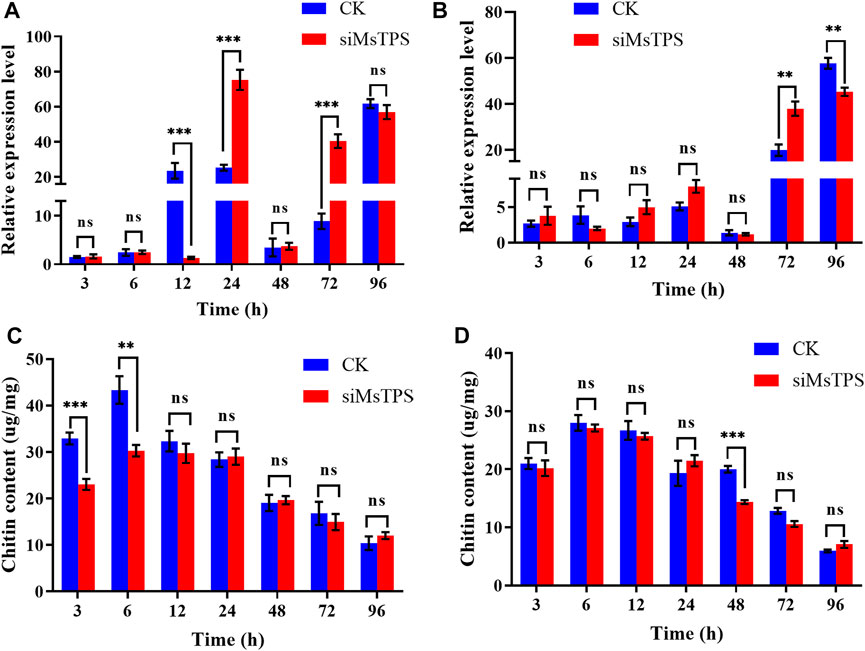
FIGURE 4. Effect of the silencing of MsTPS on chitin synthase gene expression and the chitin content. (A) Expression of MsCHSA at different time-points after the MsTPS RNAi treatment. (B) Expression of MsCHSB at different time-points after the MsTPS RNAi treatment. (C) Chitin content in the M. separata integument at different time-points after the MsTPS RNAi treatment. (D) Chitin content in the M. separata midgut at different time-points after the MsTPS RNAi treatment. Relative MsTPS expression levels were determined by qRT-PCR and the 2−ΔΔCT data analysis method. Expression data are provided as the mean ± SE. Data were normalized against the expression data for two reference genes (encoding β-actin and glyceraldehyde-3-phosphate dehydrogenase). Statistical analyses were performed using the GraphPad Prism software. Statistically significant differences by t-test at same treatment time shown as asterisks (*p < 0.05, **p < 0.01, ***p < 0.001, ns > 0.05).
To elucidate the effect of MsTPS on the M. separata chitin content, the larvae were dissected at 3, 6, 12, 24, 48, 72, and 96 h after the RNAi treatment to obtain the midgut and integument, which were subsequently examined regarding their chitin contents. The results showed that the silencing of MsTPS extremely significantly decreased the integument chitin content by 29.99% and 30.12% at the 3 and 6 h time-points, respectively (Figure 4C). Additionly, the silencing of MsTPS significantly decreased the midgut chitin content by 28.31% at 48 h time-point (Figure 4D).
3.7 Effects of the silencing of MsTPS on the ability of M. separata to utilize food
To investigate the effect of the silencing of MsTPS on the ability of M. separata to utilize food, the larvae at 3, 6, 12, 24, 48, 72, and 96 h after the RNAi treatment were examined regarding specific nutritional indices. The silencing of MsTPS resulted in a significant decrease in the M. separata dry weight at 96 h post-RNAi treatment. Moreover, the larval feed intake significantly decreased at the 6, 12, 24, 48, and 96 h post-RNAi treatment time-points. The silencing of MsTPS significantly decreased the relative growth rate and the relative consumption rate at 6 and 96 h. Furthermore, the RNAi treatment also significantly decreased the efficiency of the conversion of ingested food at 6 h, the approximate digestibility at 24 h, and the efficiency of the conversion of digested food at 6, 48, and 96 h Table 1. Accordingly, the silencing of MsTPS adversely affected the ability of M. separata to utilize food.
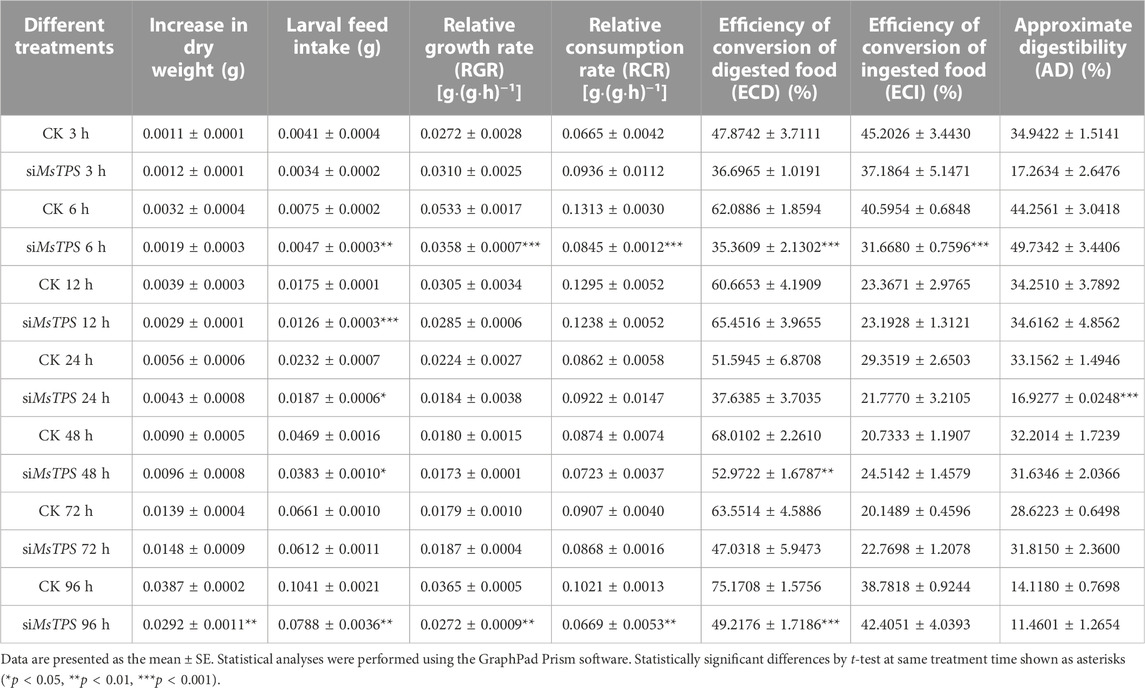
TABLE 1. Nutritional indices for M. separata at different time-points after the silencing of MsTPS by RNA interference.
3.8 Effects of the silencing of MsTPS on M. separata growth and development
To determine the effect of the silencing of MsTPS on growth and development, the M. separata growth and molting processes following the RNAi treatment were analyzed. The silencing of MsTPS resulted in a significant increase in the M. separata mortality rate at 24, 48, and 72 h (Figure 5A). The RNAi treatment also significantly prolonged the time required for M. separata larvae to develop into 5th-instar larvae, 6th-instar larvae, and pupae (Figure 5B). Furthermore, the RNAi treatment also resulted in a significant decrease in the weight of the sixth instar larvae (Figure 5C). Additionally, compared with the control samples, three distinct phenotypic differences were evident in the M. separata in which MsTPS was silenced (Figure 6A). First, larvae were unable to molt normally before dying. Second, partially deformed fifth instar larvae retained the cuticle from the fourth instar larvae. Third, some larvae were too small after molting. Moreover, M. separata pupation abnormalities were detected (Figure 6B). More specifically, some larvae failed to pupate and some pupae were too small. The rates of abnormal molting and pupation were 7.33% and 12.67%, respectively. The phenotypes of the control samples were relatively consistent.
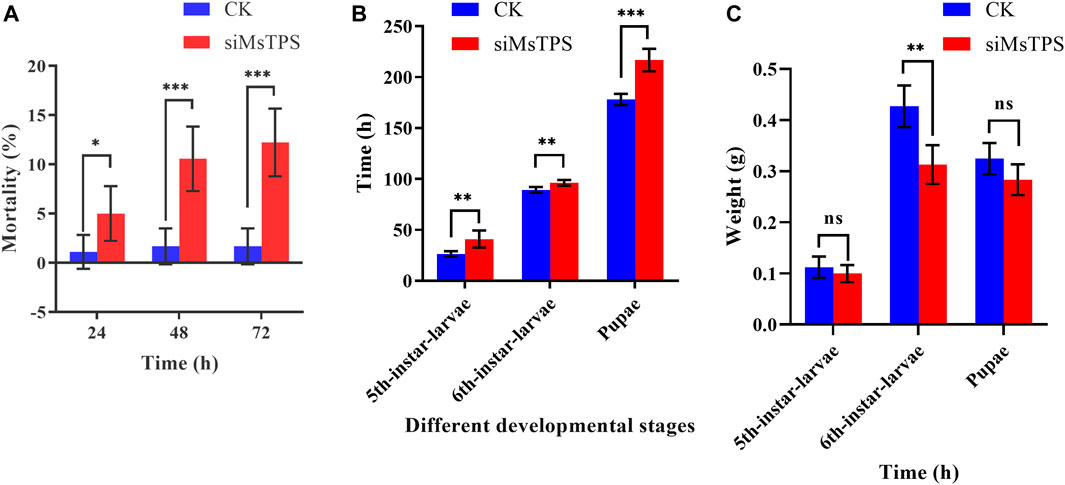
FIGURE 5. Effect of the silencing of MsTPS on M. separata mortality (A), developmental time (B), and weight (C). Data are presented as the mean ± SE. Statistically significant differences by t-test at same treatment time shown as asterisks (*p < 0.05, **p < 0.01, ***p < 0.001, ns > 0.05).
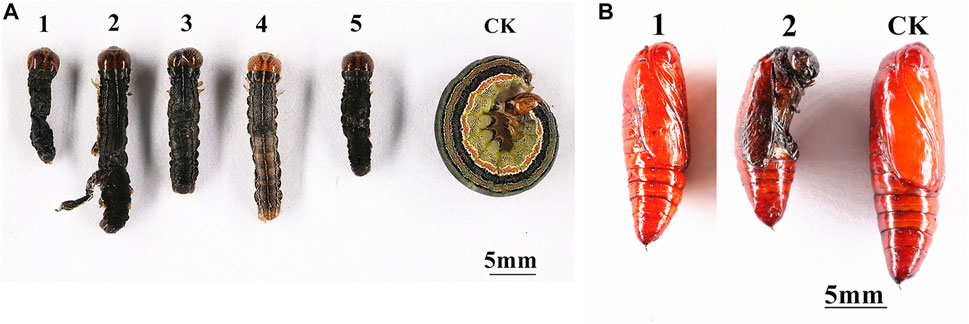
FIGURE 6. Effects of the silencing of MsTPS on M. separata molting (A) and pupation (B). (A) 1, 3, and 5: larvae were unable to molt normally before dying; 2: larvae retained the cuticle from the fourth instar larvae; 4: larvae were too small after molting. (B) 1: larvae failed to pupate; 2: pupae were too small.
4 Discussion
As a stress protectant, reserve carbohydrate, transport sugar, stress-related metabolite, and energy source, trehalose affects insect growth and development, molting, flying, overwintering, and other life cycle-related activities (Delorge et al., 2015). making it the most important carbohydrate in insect hemolymphs. In insects, trehalose is primarily synthesized in the TPS/TPP pathway. In this study, the M. separata TPP sequence was not detected in the screened transcriptome database. Earlier research revealed that TPS alone can mediate trehalose synthesis (Tang et al., 2018).
The H. armigera HaTPS gene is reportedly expressed during all developmental stages, with peak expression in the late sixth larval instar stage (Xu et al., 2009). In the current study, MsTPS was expressed in all examined M. separata developmental stages, with the lowest and highest expression levels detected in the first instar larvae and pupae, respectively.
The MsTPS expression pattern detected in this study was basically consistent with the published expression data for other insects. For example, in L. migratoria, LmTPS is reportedly mainly expressed in the fat body, but it is also expressed at low levels in the muscle tissue, hemolymph, and intestinal tract (Cui and Xia, 2009). In insects, trehalose is produced in fat body, which is also where TPS is mainly expressed (Chung, 2008; Tang et al., 2010). Trehalose, which is considered to be a source of stored energy and carbon, provides energy for insect growth and development, molting, and flying (Chung, 2008). The differential expression of TPS can affect the trehalose content in insects (Chen et al., 2010). Because TPS is a key enzyme in the trehalose synthesis pathway, it substantially affects trehalose production. In arthropods, TPS expression directly affects the trehalose content (Shi and Chung, 2014). In the current study, MsTPS expression was inhibited via RNAi, which resulted in changes to TPS activity and the trehalose content in M. separata.
Insect molting requires chitin synthesis and degradation pathways (Zhu et al., 2016). Trehalose is a substrate for insect chitin synthesis pathways. Studies have demonstrated that an imbalance in the trehalose synthesis and degradation in insects is associated with changes in the expression levels of related genes in the chitin synthesis pathway, with significant decreases in the chitin contents resulting in molting abnormalities and high mortality rates (Tang et al., 2016; Zhao et al., 2016). Moreover, suppressed TPS expression in insects leads to abnormal molting and death (Tang et al., 2016; Yang et al., 2017; Chen et al., 2018). In the current study, the silencing of MsTPS significantly affected MsCHSA and MsCHSB expression and significantly decreased the integument and midgut chitin content. Additionly, the RNAi treatment significantly increased the M. separata mortality rate and the time required for larvae and pupae to develop, whereas it significantly decreased the weight of the sixth instar larvae, while also leading to abnormal molting and pupation. These findings are in accordance with the results of earlier analyses of other insects. In previous investigations involving Nilaparvata lugens, inhibited NlTPS1 expression resulted in malformation and mortality rates of 20% and 30%, respectively (Chen et al., 2010; Yang et al., 2017). In another study, decreases in the TPS expression level in S. exigua led to mortality rates of 50.94% and 66.76% at 48 and 204 h, respectively (Tang et al., 2010). Additionally, injecting the third instar larvae of B. minax with dsRNA for BmTPS reportedly results in abnormal phenotypic changes and a mortality rate of 52% (Xiong et al., 2016). Our results are also in keeping with previous research showing that inhibition of TPS gene can lead to malformation and increased mortality rate of insects.
Previous research on L. decemlineata revealed that compared with the controls, insects in which LdTPS expression is inhibited consume more leaves and are heavier, but they have less chitin (Shi et al., 2016). In the present study, the silencing of MsTPS had significant detrimental effects on the ability of M. separata to utilize food. These findings were not completely consistent with the reported results for L. decemlineata. After the RNAi-based silencing of MsTPS, the M. separata dry weight and larval feed intake decreased significantly, but the change in the chitin content was consistent with that detected in L. decemlineata. An earlier study indicated that the trehalose concentration in insects can modulate insect feeding behaviors (Thompson, 2003). In this study, the silencing of MsTPS in M. separata resulted in a significant decrease in the trehalose content, thus the decrease of the ability to utilize food which may be related to the decrease in the trehalose content. In this study, it was found the chitin content in the peritrophic membrane significantly decreased in response to the silencing of MsTPS. The significant decrease in the ability of M. separata to utilize food might be associated with alterations to the peritrophic membrane structure and decreases in the chitin content, but this will need to be experimentally verified.
Data availability statement
The datasets presented in this study can be found in online repositories. The names of the repository/repositories and accession number(s) can be found below: The MsTPS cloned in this study has been recorded into NCBI repository. GenBank accession number: MN832898. https://www.ncbi.nlm.nih.gov/nuccore/MN832898.1/; Transcriptome Sequencing clean reads were submitted to NCBI SRA database: PRJNA919163.
Author contributions
Conceptualization, H-JY and DF; methodology, H-JY and M-YC; software, H-JY; validation, M-YC and X-HZ; formal analysis, H-JY; data curation, H-JY, Y-SH, and C-YZ; writing–original draft preparation, H-JY; writing–review and editing, DF; funding acquisition, DF. All authors have read and agreed to the published version of the manuscript.
Funding
This research was funded by the National Key Research and Development Program (grant no. 2018YFD0201000).
Acknowledgments
We thank Liwen Bianji (Edanz) (www.liwenbianji.cn) for editing the English text of a draft of this manuscript.
Conflict of interest
The authors declare that the research was conducted in the absence of any commercial or financial relationships that could be construed as a potential conflict of interest.
Publisher’s note
All claims expressed in this article are solely those of the authors and do not necessarily represent those of their affiliated organizations, or those of the publisher, the editors and the reviewers. Any product that may be evaluated in this article, or claim that may be made by its manufacturer, is not guaranteed or endorsed by the publisher.
Supplementary material
The Supplementary Material for this article can be found online at: https://www.frontiersin.org/articles/10.3389/fphys.2023.1109661/full#supplementary-material
References
Arakane, Y., Muthukrishnan, S., Kramer, K. J., Specht, C. A., Tomoyasu, Y., Lorenzen, M. D., et al. (2005). The Tribolium chitin synthase genes TcCHS1 and TcCHS2 are specialized for synthesis of epidermal cuticle and midgut peritrophic matrix. Insect Mol. Biol. 14 (5), 453–463. doi:10.1111/j.1365-2583.2005.00576.x
Bradford, M. M. (1976). A rapid and sensitive method for the quantitation of microgram quantities of protein utilizing the principle of protein-dye binding. Anal. Biochem. 72 (1-2), 248–254. doi:10.1006/abio.1976.9999
Chen, J. X., Lu, Z. H., Wang, C. Y., Chen, J., and Lin, T. (2020). RNA interference of a trehalose-6-phosphate synthase gene reveals its roles in the biosynthesis of chitin and lipids in Heortia vitessoides (Lepidoptera: Crambidae). Insect Sci. 27 (2), 212–223. doi:10.1111/1744-7917.12650
Chen, J., Zhang, D., Yao, Q., Zhang, J., Dong, X., Tian, H., et al. (2010). Feeding-based RNA interference of a trehalose phosphate synthase gene in the Brown planthopper. Nil. Lugens. Insect Mol. Biol. 19 (6), 777–786. doi:10.1111/j.1365-2583.2010.01038.x
Chen, Q., Ma, E., Behar, K. L., Xu, T., and Handan, G. G. (2002). Role of trehalose phosphate synthase in anoxia tolerance and development in Drosophila melanogaster. J. Biol. Chem. 277 (5), 3274–3279. doi:10.1074/jbc.M109479200
Chen, Q. W., Jin, S., Zhang, L., Shen, Q. D., Wei, P., Wei, Z. M., et al. (2018). Regulatory functions of trehalose-6-phosphate synthase in the chitin biosynthesis pathway in Tribolium castaneum (Coleoptera: Tenebrionidae) revealed by RNA interference. B. Entomol. Res. 108 (3), 388–399. doi:10.1017/S000748531700089X
Chung, J. S. (2008). A trehalose 6-phosphate synthase gene of the hemocytes of the blue crab, Callinectes sapidus: Cloning, the expression, its enzyme activity and relationship to hemolymph trehalose levels. Saline Syst. 4 (1), 18. doi:10.1186/1746-1448-4-18
Cui, S. Y., and Xia, Y. X. (2009). Isolation and characterization of the trehalose-6-phosphate synthase gene from Locusta migratoria manilensis. Insect Sci. 16 (4), 287–295. doi:10.1111/j.1744-7917.2009.01268.x
Delorge, I., Figueroa, C. M., Feil, R., Lunn, J. E., and Van, D. P. (2015). Trehalose-6-phosphate synthase 1 is not the only active TPS in Arabidopsis thaliana. Arabidopsis thaliana. Biochem. J. 466 (2), 283–290. doi:10.1042/BJ20141322
Ge, L. Q., Zhao, K. F., Huang, L. J., and Wu, J. C. (2011). The effects of triazophos on the trehalose content, trehalase activity and their gene expression in the Brown planthopper Nilaparvata lugens (Hemiptera: Delphacidae). Pestic. Biochem. Physiol. 100 (2), 172–181. doi:10.1016/j.pestbp.2011.03.007
Giaever, H. M., Styrvold, O. B., Kaasen, I., and Strom, A. R. (1988). Biochemical and genetic characterization of osmoregulatory trehalose synthesis in Escherichia coli. J. Bacteriol. 170 (6), 2841–2849. doi:10.1128/jb.170.6.2841-2849.1988
Guo, X., Wang, Y., Sinakevitch, I., Lei, H., and Smith, B. H. (2018). Comparison of RNAi knockdown effect of tyramine receptor 1 induced by dsRNA and siRNA in brains of the honey bee, Apis mellifera. J. Insect Physiol. 111, 47–52. doi:10.1016/j.jinsphys.2018.10.005
Hottiger, T., Boller, T., and Wiemken, A. (1987). Rapid changes of heat and desiccation tolerance correlated with changes of trehalose content in Saccharomyces cerevisiae cells subjected to temperature shifts. FEBS Lett. 220 (1), 113–115. doi:10.1016/0014-5793(87)80886-4
Jo, V., Katleen, D. P., Filip, P., Bruce, P., Nadine, V. R., Anne, D. P., et al. (2002). Accurate normalization of real-time quantitative RT-PCR data by geometric averaging of multiple internal control genes. Genome Biol. 3 (7), RESEARCH0034. doi:10.1186/gb-2002-3-7-research0034
Kumar, S., Stecher, G., and Tamura, K. (2016). MEGA7: Molecular evolutionary genetics analysis version 7.0 for bigger datasets. Mol. Biol. Evol. 33 (7), 1870–1874. doi:10.1093/molbev/msw054
Mole, S., and Zera, A. J. (1993). Differential allocation of resources underlies the dispersal-reproduction trade-off in the wing-dimorphic cricket, Gryllus rubens. Oecologia 93 (1), 121–127. doi:10.1007/BF00321201
Reissig, J. L., Strominger, J. L., and Leloir, L. F. (1955). A modified colorimetric method for the estimation of N-acetylamino sugars. J. Biol. Chem. 217 (2), 959–966. doi:10.1016/s0021-9258(18)65959-9
Santos, R., Alves-Bezerra, M., Rosas-Oliveira, R., Majerowicz, D., Meyer-Fernandes, J. R., Gondim, K. C., et al. (2012). Gene identification and enzymatic properties of a membrane-bound trehalase from the ovary of Rhodnius prolixus. Arch. Insect Biochem. Physiol. 81 (4), 199–213. doi:10.1002/arch.21043
Shi, J. F., Xu, Q. Y., Sun, Q. K., Meng, Q. W., Mu, L. L., Guo, W. C., et al. (2016). Physiological roles of trehalose in Leptinotarsa larvae revealed by RNA interference of trehalose-6-phosphate synthase and trehalase genes. Insect biochem. Mol. Biol. 77, 52–68. doi:10.1016/j.ibmb.2016.07.012
Shi, Q., and Chung, J. S. (2014). Trehalose metabolism in the blue crab Callinectes sapidus: Isolation of multiple structural cDNA isoforms of trehalose-6-phosphate synthase and their expression in muscles. Gene 536 (1), 105–113. doi:10.1016/j.gene.2013.11.070
Shukla, E., Thorat, L. J., Nath, B. B., and Gaikwad, S. M. (2015). Insect trehalase: Physiological significance and potential applications. Glycobiology 25 (4), 357–367. doi:10.1093/glycob/cwu125
Song, J. C., Lu, Z. J., Yi, L., and Yu, H. Z. (2021). Functional Characterization of a trehalose-6-phosphate synthase in Diaphorina citri revealed by RNA interference and transcriptome sequencing. Insects 12 (12), 1074. doi:10.3390/insects12121074
Steele, J. E. (1988). Occurrence of a hyperglycæmic factor in the corpus cardiacum of an insect. Nature 192 (4803), 680–681. doi:10.1038/192680a0
Strom, A. R., and Kaasen, I. (1993). Trehalose metabolism in Escherichia coli: Stress protection and stress regulation of gene expression. Mol. Microbiol. 8 (2), 205–210. doi:10.1111/j.1365-2958.1993.tb01564.x
Tang, B., Chen, J., Yao, Q., Pan, Z. Q., Xu, W. H., Wang, S. G., et al. (2010). Characterization of a trehalose-6-phosphate synthase gene from Spodoptera exigua and its function identification through RNA interference. J. Insect Physiol. 56 (7), 813–821. doi:10.1016/j.jinsphys.2010.02.009
Tang, B., Qin, Z., Shi, Z. K., Wang, S., Guo, X. J., Wang, S. G., et al. (2014). Trehalase in Harmonia axyridis (Coleoptera: Coccinellidae): Effects on beetle locomotory activity and the correlation with trehalose metabolism under starvation conditions. Appl. Entomol. Zool. 49 (2), 255–264. doi:10.1007/s13355-014-0244-4
Tang, B., Wang, S., Wang, S. G., Wang, H. J., Zhang, J. Y., and Cui, S. Y. (2018). Invertebrate trehalose-6-phosphate synthase gene: Genetic architecture, biochemistry, physiological function, and potential applications. Front. Physiol. 9, 30. doi:10.3389/fphys.2018.00030
Tang, B., Wei, P., Zhao, L. N., Shi, Z. K., Shen, Q. D., Yang, M. M., et al. (2016). Knockdown of five trehalase genes using RNA interference regulates the gene expression of the chitin biosynthesis pathway in Tribolium castaneum. Bmc Biotechnol. 16 (1), 67. doi:10.1186/s12896-016-0297-2
Thompson, S. N. (2003). Trehalose-the insect ‘blood’ sugar. Adv. Insect Physiol. 31, 205–285. doi:10.1016/S0065-2806(03)31004-5
Waldbauer, G. P. (1968). The consumption and utilization of food by insects. Adv. Insect Physiol. 5, 229–288. doi:10.1016/s0065-2806(08)60230-1
Xiong, K. C., Wang, J., Li, J. H., Deng, Y. Q., Pu, P., Fan, H., et al. (2016). RNA interference of a trehalose-6-phosphate synthase gene reveals its roles during larval-pupal metamorphosis in Bactrocera minax (Diptera: Tephritidae). J. Insect Physiol. 91-92, 84–92. doi:10.1016/j.jinsphys.2016.07.003
Xu, J., Bao, B., Zhang, Z. F., Yi, Y. Z., and Xu, W. H. (2009). Identification of a novel gene encoding the trehalose phosphate synthase in the cotton bollworm, Helicoverpa armigera. Glycobiology 19 (3), 250–257. doi:10.1093/glycob/cwn127
Yang, M. M., Zhao, L. N., Shen, Q. D., Xie, G. Q., Wang, S. G., and Tang, B. (2017). Knockdown of two trehalose-6-phosphate synthases severely affects chitin metabolism gene expression in the Brown planthopper Nilaparvata lugens. Pest Manag. Sci. 73 (1), 206–216. doi:10.1002/ps.4287
Zhang, Z., Zhang, Y. H., Wang, J., Liu, J., Tang, Q. B., Li, X. R., et al. (2018). Analysis on the migration of first-generation Mythimna separata (Walker) in China in 2013. J. Integr. Agric. 17 (7), 1527–1537. doi:10.1016/S2095-3119(17)61885-9
Zhao, L. N., Yang, M. M., Shen, Q. D., Liu, X. J., Shi, Z. K., Wang, S. G., et al. (2016). Functional characterization of three trehalase genes regulating the chitin metabolism pathway in rice Brown planthopper using RNA interference. Sci. Rep. 6, 27841. doi:10.1038/srep27841
Zhao, L. Q., Liao, H. Y., Zeng, Y., Wu, H. J., and Zhu, D. H. (2017). Food digestion capability and digestive enzyme activity in female adults of the wing-dimorphic cricket Velarifictorus ornatus. Entomol. Exp. Appl. 163 (1), 35–42. doi:10.1111/eea.12563
Keywords: Mythimna separata, trehalose-6-phosphate synthase, chitin, trehalose, RNAi
Citation: Yang H-J, Cui M-Y, Zhao X-H, Zhang C-Y, Hu Y-S and Fan D (2023) Trehalose-6-phosphate synthase regulates chitin synthesis in Mythimna separata. Front. Physiol. 14:1109661. doi: 10.3389/fphys.2023.1109661
Received: 28 November 2022; Accepted: 02 February 2023;
Published: 13 February 2023.
Edited by:
Bimalendu B. Nath, Savitribai Phule Pune University, IndiaReviewed by:
Pin-Jun Wan, China National Rice Research Institute (CAAS), ChinaLinQuan Ge, Yangzhou University, China
Copyright © 2023 Yang, Cui, Zhao, Zhang, Hu and Fan. This is an open-access article distributed under the terms of the Creative Commons Attribution License (CC BY). The use, distribution or reproduction in other forums is permitted, provided the original author(s) and the copyright owner(s) are credited and that the original publication in this journal is cited, in accordance with accepted academic practice. No use, distribution or reproduction is permitted which does not comply with these terms.
*Correspondence: Dong Fan, dnfd@163.com