 Jonathan Wagner1†
 Max Niemeyer2†
 Denis Infanger1
 Otmar Pfister3
 Jonathan Myers4
 Arno Schmidt-Trucksäss1*
 Raphael Knaier1
- 1Division of Sports and Exercise Medicine, Department of Sport, Exercise and Health, University of Basel, Basel, Switzerland
- 2Department of Medicine, Training and Health, Institute of Sports Science and Motologie, Philipps-University Marburg, Marburg, Germany
- 3Department of Cardiology, University Hospital Basel, University of Basel, Basel, Switzerland
- 4Cardiology Division, Veterans Affairs (VA) Palo Alto Health Care System, Stanford University, Palo Alto, CA, United States
Objective: The aim of this study was to analyze whether V̇O2-kinetics during cardiopulmonary exercise testing (CPET) is a useful marker for the diagnosis of heart failure (HF) and to determine which V̇O2-kinetic parameter distinguishes healthy participants and patients with HF.
Methods: A total of 526 healthy participants and 79 patients with HF between 20 and 90 years of age performed a CPET. The CPET was preceded by a 3-min low-intensity warm-up and followed by a 3-min recovery bout. V̇O2-kinetics was calculated from the rest to exercise transition of the warm-up bout (on-kinetics), from the exercise to recovery transition following ramp test termination (off-kinetics) and from the initial delay of V̇O2 during the warm-up to ramp test transition (ramp-kinetics).
Results: V̇O2 off-kinetics showed the highest z-score differences between healthy participants and patients with HF. Furthermore, off-kinetics was strongly associated with V̇O2peak. In contrast, ramp-kinetics and on-kinetics showed only minimal z-score differences between healthy participants and patients with HF. The best on- and off-kinetic parameters significantly improved a model to predict the disease severity. However, there was no relevant additional value of V̇O2-kinetics when V̇O2peak was part of the model.
Conclusion: V̇O2 off-kinetics appears to be superior for distinguishing patients with HF and healthy participants compared with V̇O2 on-kinetics and ramp-kinetics. If V̇O2peak cannot be determined, V̇O2 off-kinetics provides an acceptable substitute. However, the additional value beyond that of V̇O2peak cannot be provided by V̇O2-kinetics.
Introduction
The incidence and prevalence of heart failure (HF) are high and continue to increase in the developed world with aging of the population. Concomitant deaths and healthcare costs related to this syndrome are increasing (Virani et al., 2020). Accurate diagnostic and risk assessment methods for HF are essential to guide clinical decisions for therapeutic strategies with the ultimate goal of decreasing risk and improving health outcomes. Gas exchange variables obtained through cardiopulmonary exercise testing (CPET) are an established method for accurately stratifying risk in patients with HF; many CPET responses now have a substantial evidence base (Wagner et al., 2018). However, maximal CPET parameters can be difficult to interpret as they are highly dependent on subject effort (Wagner et al., 2020). As many patients with HF are not familiar with severe exercise intensities, pushing these patients to their physiological limit remains a challenge. Therefore, there have been many efforts to investigate submaximal markers such as oxygen uptake kinetics (V̇O2-kinetics) in patients with HF.
V̇O2-kinetics represent the rate at which generation of aerobic adenosine triphosphate (ATP) adjusts to changes in the exercise intensity (Poole and Jones, 2012). This parameter depends on the ability of the cardiovascular system to rapidly increase or decrease the oxygen supply to the working muscles (Kemps et al., 2009; Chatterjee et al., 2013) as well as on the ability of the muscles to rapidly utilize oxygen (Weiss et al., 2017). Therefore, V̇O2-kinetics can provide critical information regarding the regulating capacity of the cardiovascular system and the skeletal muscles to utilize oxygen (Chatterjee et al., 2013) and, thus, exercise intolerance and functional mobility (Sietsema et al., 1994; Pavia et al., 1999; Hummel et al., 2016).
Studies investigating whether V̇O2-kinetics is a useful marker for risk stratification in HF have reported conflicting findings (de Groote et al., 1996; Meyer et al., 1998; Pavia et al., 1999; Nanas et al., 2001; Schalcher et al., 2003; Fortin et al., 2015; Hummel et al., 2016). While some have reported that the prognostic value of V̇O2-kinetics is even superior to V̇O2peak (Schalcher et al., 2003; Fortin et al., 2015), others have reported only moderate or minimal additional value beyond V̇O2peak (de Groote et al., 1996; Pavia et al., 1999; Hummel et al., 2016). These conflicting results are likely caused by the fact that varying features of V̇O2-kinetics were analyzed (i.e., on-kinetics or off-kinetics), and different calculation approaches were used.
V̇O2-kinetics is traditionally measured by performing a constant load test. CPET using a ramp protocol is, however, the preferred method to perform an exercise test in the clinical setting (Ross et al., 2016). The current manuscript therefore focused only on the utility of V̇O2-kinetics during a ramp protocol. The aims of the study were (1) to analyze whether V̇O2-kinetics parameters obtained from a CPET can distinguish between healthy participants and cardiac patients with HF and between New York Heart Association (NYHA) functional classes; (2) to determine which V̇O2-kinetic parameter and which calculation are most useful; and (3) whether the most promising V̇O2 on- and V̇O2 off-kinetic parameter can add additional value to V̇O2peak.
Materials and Methods
Cohort and Recruitment
The COmPLETE-Study is a cross-sectional single-center study and consists of two parts, namely, COmPLETE-Health and COmPLETE-Heart. COmPLETE-Health included healthy men and women without any known exercise-limiting diseases between 20 and 90 years of age equally distributed across age decades and sex. COmPLETE-Heart included cardiac patients with stable HF with NYHA functional classes I–III, with symptoms and signs stable for at least 1 month. Diagnosis of HF was confirmed by clinical history, physical examination, assessment of natriuretic peptide (NT-proBNP), and echocardiographically documented structural heart disease or diastolic dysfunction according to the European Society of Cardiology guidelines (Ponikowski et al., 2016). Details on recruitment procedures and complete inclusion and exclusion criteria can be found in the study protocol (Wagner et al., 2019).
Setting
The study was carried out at the Department of Sport, Exercise, and Health at the University of Basel, Switzerland, and was funded by the Swiss National Science Foundation (grant no. 182815). The study complies with the Declaration of Helsinki and was approved by the Ethics Committee of Northwestern and Central Switzerland (EKNZ 2017-01451). Written informed consent was obtained from all participants before the start of the study.
Acquisition of Participant Characteristics
Resting systolic and diastolic blood pressures were measured with the participant in the supine position using a non-invasive vascular screening system (VaSera VS-1500N; Fukuda Denshi, Tokyo, Japan). Physicians assessed medical history and medications by the questionnaire onsite. Based on clinical data, structured questions, and self-reported exercise tolerance, each patient with HF was assigned to an NYHA functional class by a physician who was blinded to both CPET results and laboratory data. Blood samples were drawn via venipuncture by trained medical staff in fasting state (at least 3 h). Samples were immediately centrifuged, the plasma aliquots were frozen at a temperature of −80°C, and all samples were analyzed together after completion of the study.
Cardiopulmonary Exercise Testing
An exercise test to maximal voluntary exertion using an electromagnetically braked cycle ergometer (Ergoselect 200; Ergoline, Bitz, Germany) was performed according to one of the following five ramp protocols: (i) a 3-min warm-up either unloaded, a load of 10 or 20 W for protocols 1–3, or a load of 50 W for protocols 4 and 5 followed by (ii) a ramp protocol with a linear workload increases of 7, 10, 15, 20, or 30 W/min for protocols 1–5, respectively, followed by (iii) a 3-min recovery phase at the same workload as the warm-up. The protocol was chosen to achieve a duration of approximately 10 min.
Gas exchange and ventilatory variables were analyzed breath-by-breath continuously using a computer-based system (MetaMax 3B; Cortex Biophysik GmbH, Leipzig, Germany). Each test was preceded by a resting period of 3 min to reach steady-state conditions. In the absence of clinical symptoms or electrocardiographic abnormalities, all tests were continued until maximal exertion. Before and during the test, the participants were verbally encouraged to reach maximal exhaustion. Before each test, the equipment was calibrated in standard fashion with reference gas and known volume. V̇O2peak was defined as the highest 30 s average value during the CPET. The slope of ventilation vs. carbon dioxide consumption (V̇E/V̇CO2 slope) was calculated from 1 min after beginning of the ramp test up to the respiratory compensation point. As recommended earlier (Gargiulo et al., 2014; Salvioni et al., 2020), we also calculated V̇O2peak and V̇E/V̇CO2 slope expressed as percentage of the predicted values. For this purpose, we used our recently published data (Wagner et al., 2021), which are mainly based on the healthy cohort of the present study.
V̇O2-Kinetic Assessment
Figure 1 displays the different methods used to determine V̇O2-kinetics. Initially, V̇O2 was filtered by removing all outliers that differed more than three standard deviations from the local mean (moving average of six breaths). The filtered V̇O2 values were then linearly interpolated to provide second-by-second values, as previously recommended (Benson et al., 2017). V̇O2 on-kinetics was assessed from the rest to exercise transition of the 3-min constant load warm-up period. In accordance with earlier studies, we calculated the time constant of V̇O2 on-kinetics by two different approaches:
(1) τ V̇O2 on-kinetics. A mono-exponential function was fit (see Appendix for the exact equation) from the beginning to the end of the warm-up period using non-linear least-squares method regression analyses (Hummel et al., 2016) (see Eq. 1 in Appendix).
(2) τ V̇O2 on-kinetics by V̇O2-deficit. This was determined by the oxygen deficit and the steady-state increase of V̇O2 above the resting value (Sietsema et al., 1994; Schalcher et al., 2003) (see Eq. 2 in Appendix).
V̇O2 off-kinetics was assessed from the active recovery period that directly followed the incremental phase of the CPET. This was done using three different approaches:
(1) τ V̇O2 off-kinetics. Determined by the time constant of a mono-exponential function that was fitted from the beginning to the end of the recovery period using non-linear least-squares method regression analyses (de Groote et al., 1996; Pavia et al., 1999; Hummel et al., 2016) (see Eq. 3 in Appendix).
(2) Slope linear V̇O2 off-kinetics. Determined by the slope of a linear function that was fitted into the V̇O2–time relationship of the first minute of recovery using linear least-squares method regression analyses (Nanas et al., 2001) (see Eq. 4 in Appendix).
(3) % rel V̇O2 reduction 60 s and 120 s post-test. Determined by the decrease in V̇O2 from the end of the incremental phase up to the first (% rel V̇O2 reduction 60 s post-test) and second minute (% rel V̇O2 reduction 120 s post-test) expressed as percentages of V̇O2peak (Fortin et al., 2015).
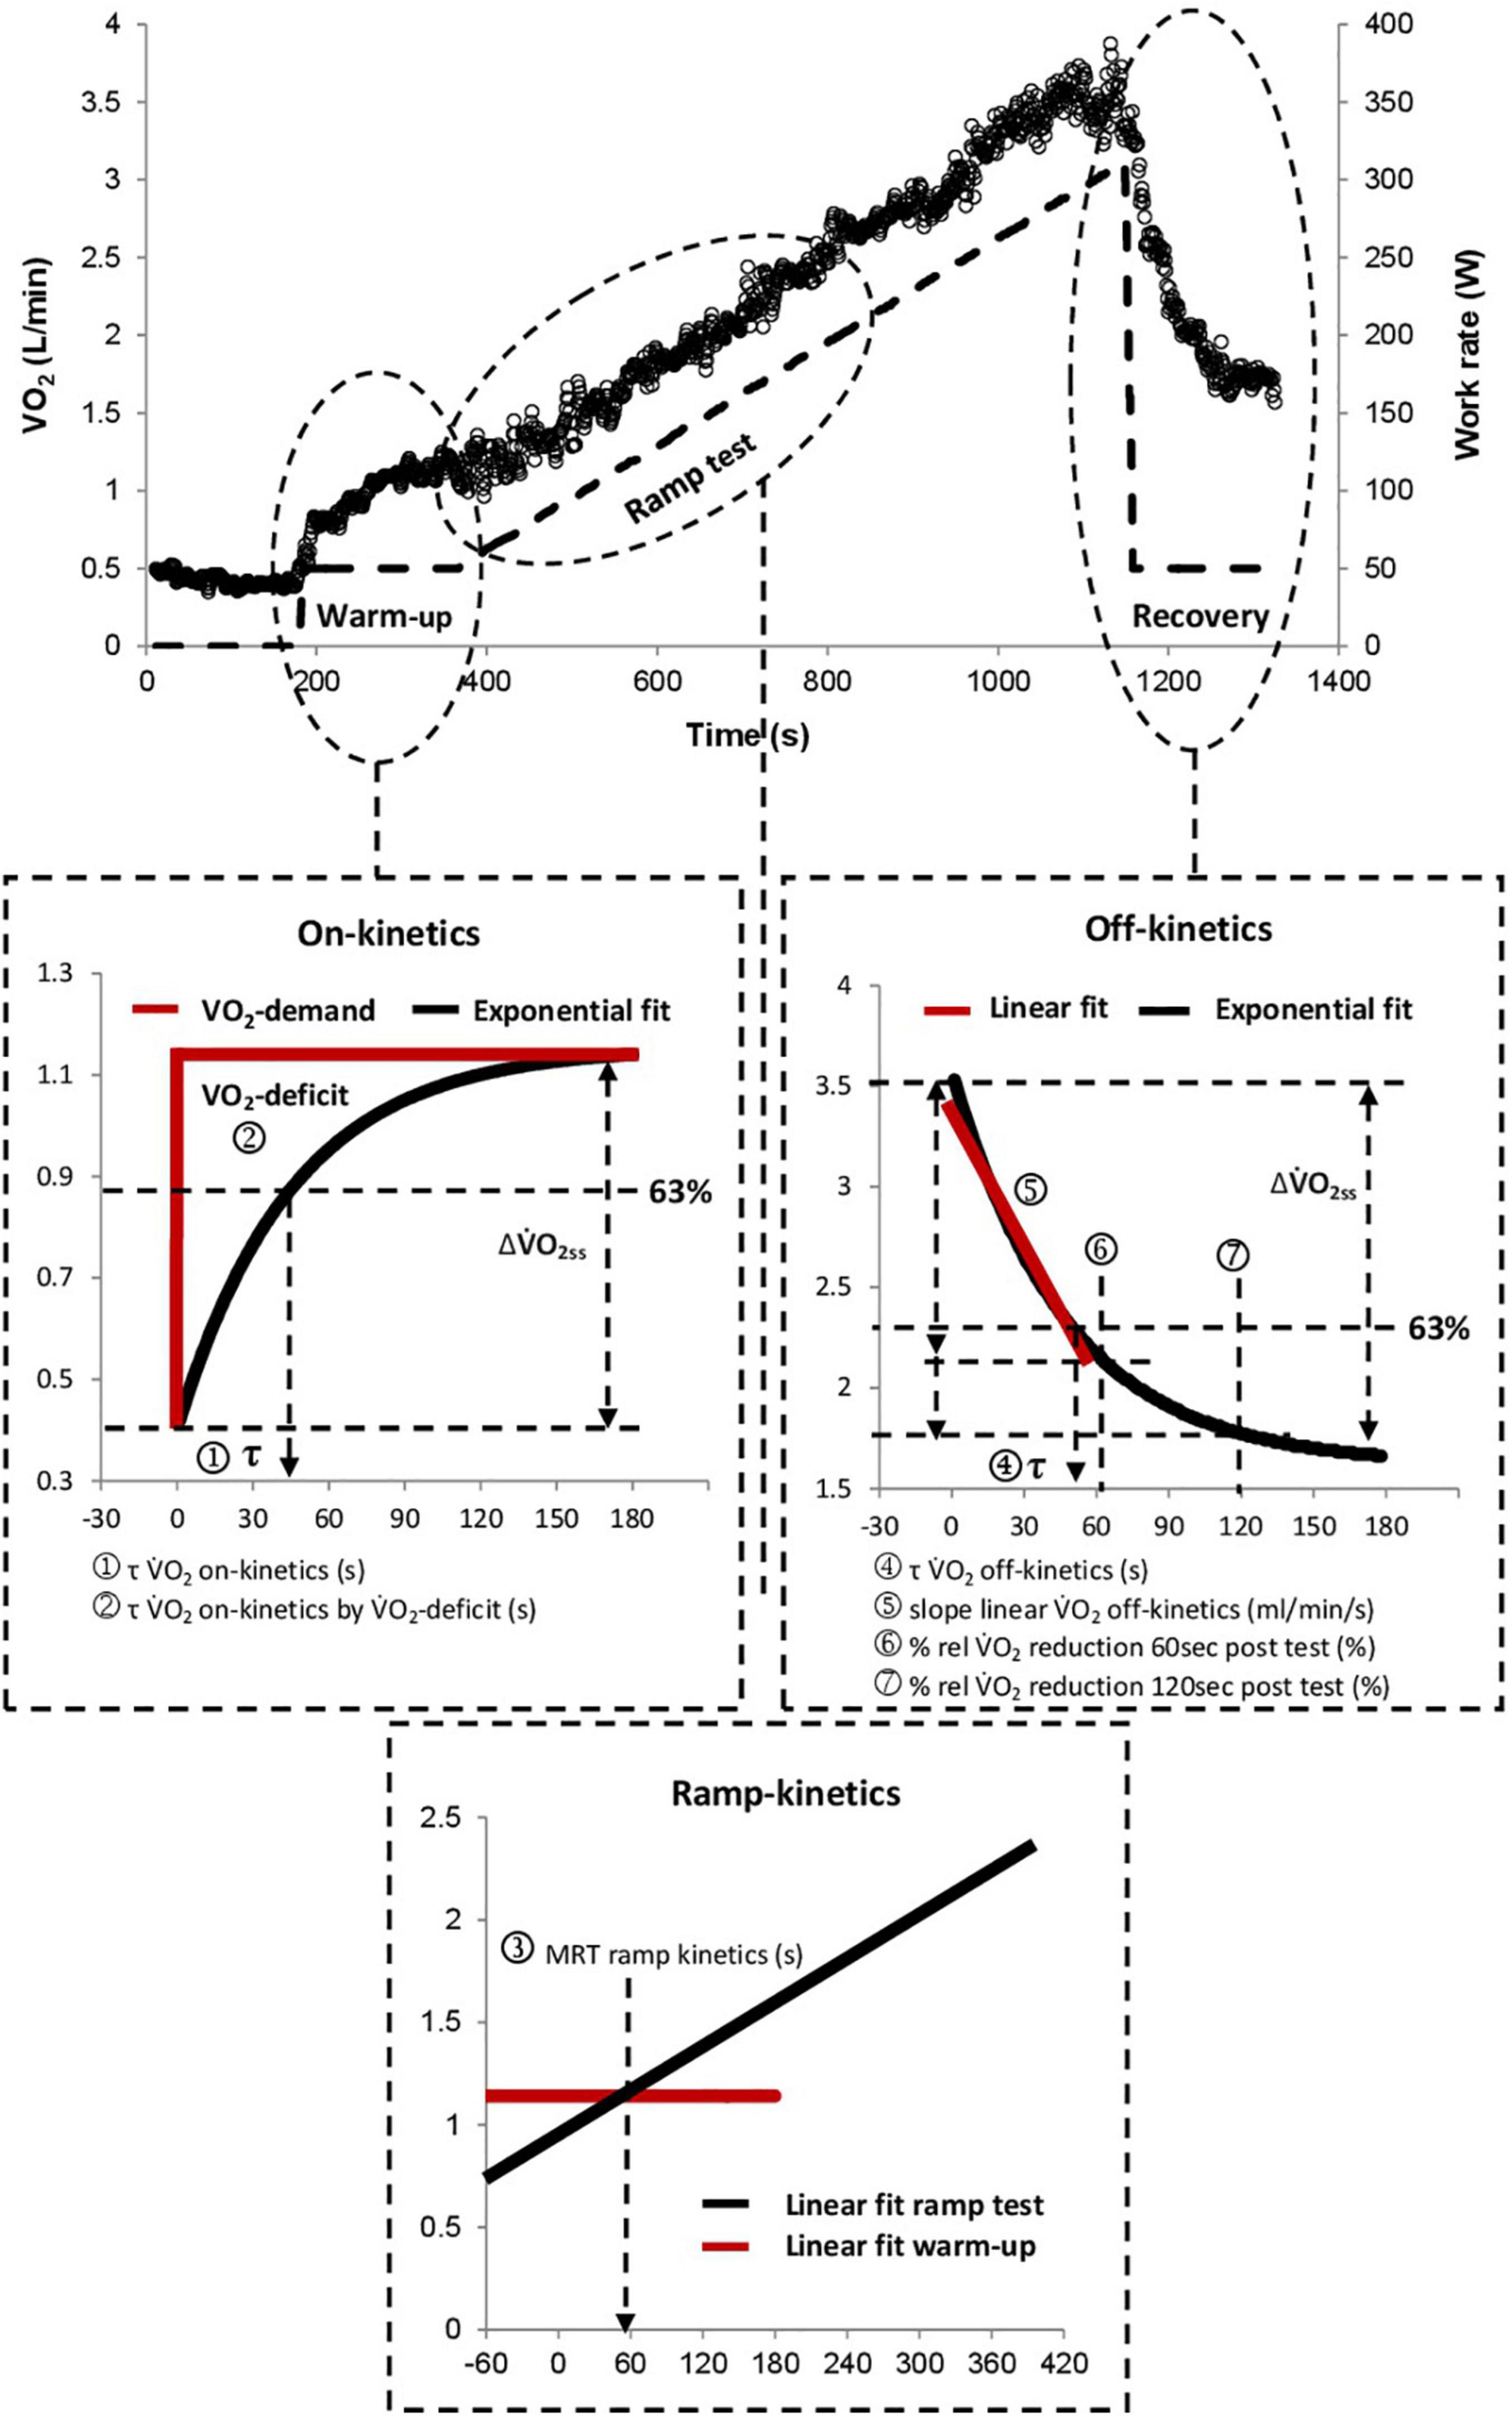
Figure 1. Graphical illustration of all analyzed kinetic parameters. τ V̇O2 on-kinetics by V̇O2-deficit was calculated by dividing the V̇O2-deficit by the amplitude (ΔV̇O2ss) of the V̇O2 response. V̇O2, oxygen uptake; τ, tau; MRT, mean response time; rel, relative.
Ramp test kinetics were assessed from the initial delay of V̇O2 at the beginning of the incremental exercise phase (mean response time; MRT), as previously described (Meyer et al., 1998; Niemeyer et al., 2020). For this purpose, the intersection between a horizontal line crossing the V̇O2 of the final 30 s of the warm-up phase (V̇O2 warm-up) and a straight line, which was fitted into the linear V̇O2-work rate response of the incremental phase was calculated (see Eq. 5 in Appendix).
Statistical Analysis
We investigated potential differences in V̇O2-kinetics variables between healthy participants and patients with HF using linear regression models, which were adjusted for age and sex. In detail, residual diagnostics were used to see whether the model assumptions were satisfied, and some kinetic parameters were subsequently log-transformed.
To investigate the associations between V̇O2-kinetic parameters and V̇O2peak, linear regression analyses with V̇O2peak as the dependent variable and age, sex, and the kinetic variables as independent variables were calculated. Separate models for each kinetic parameter were built. Therefore, we modeled age using restricted cubic splines (natural splines) with four knots included along with an interaction by sex to control for potential non-linear age progression (Harrell, 2015). For some models, the residuals exhibited heteroscedasticity, and we present robust p-values and confidence intervals for those models (HC3) (Long and Ervin, 2000).
Descriptive statistics were used to compare the V̇O2-kinetic variables between NYHA classes I, II, and III and the healthy participants. To achieve comparability, we first created a matched dataset where we matched two healthy participants to every patient with HF according to age and sex (2:1 matching). We used the R package “MatchIt” for these calculations (version 3.0.2) (Ho et al., 2011).
The age- and sex-specific quantile curves were calculated using healthy participants only and applying generalized additive models for location, scale, and shape (GAMLSS, R package version 5.1-6) (Stasinopoulos et al., 2017). The age trajectories were modeled using penalized B-splines (P-splines). We adopted the Bayesian information criterion to select the conditional distribution that offered the best compromise between model complexity and goodness-of-fit. The models were inspected using diagnostic residual plots such as worm plots (van Buuren and Fredriks, 2001) and Q–Q plots. The z-scores of the patients with HF were calculated based on the established reference curves using the healthy participants.
Proportional odds ordinal logistic regressions were used to analyze whether the kinetic parameters with the largest mean difference in the z-scores added additional predictive information for disease severity (NYHA class). We used the unitless adequacy index to quantify the predictive information contained in V̇O2peak, age, and sex compared to the full set of predictors including the kinetic parameters (Harrell, 2015). An adequacy index near one indicates that V̇O2peak, age, and sex contain nearly all predictive information already, and that the kinetic parameters add little predictive information. We used likelihood ratio tests to assess whether the kinetic parameters improved the model fit. R version 3.6.1 or later (R Foundation for Statistical Computing, Vienna, Austria) was used for all analyses, and p-values ≤ 0.05 were considered statistically significant. All tests were two sided.
Results
Participant Characteristics
A total of 526 healthy participants and 79 patients with HF (NYHA functional classes I–III) were included in the study. All patients with HF were in stable condition; their etiologies were cardiomyopathy (n = 8), coronary artery disease (n = 60), pulmonary hypertension (n = 1), valvular regurgitation (n = 8), and valvular stenosis (n = 2). Thirty-five patients with HF had a preserved ejection fraction (≥50%), 15 patients with HF had mid-range ejection fraction (40–49%), and 23 patients with HF had a reduced ejection fraction (<40%) while the data of six patients with HF were missing. Participant characteristics are presented in Table 1.
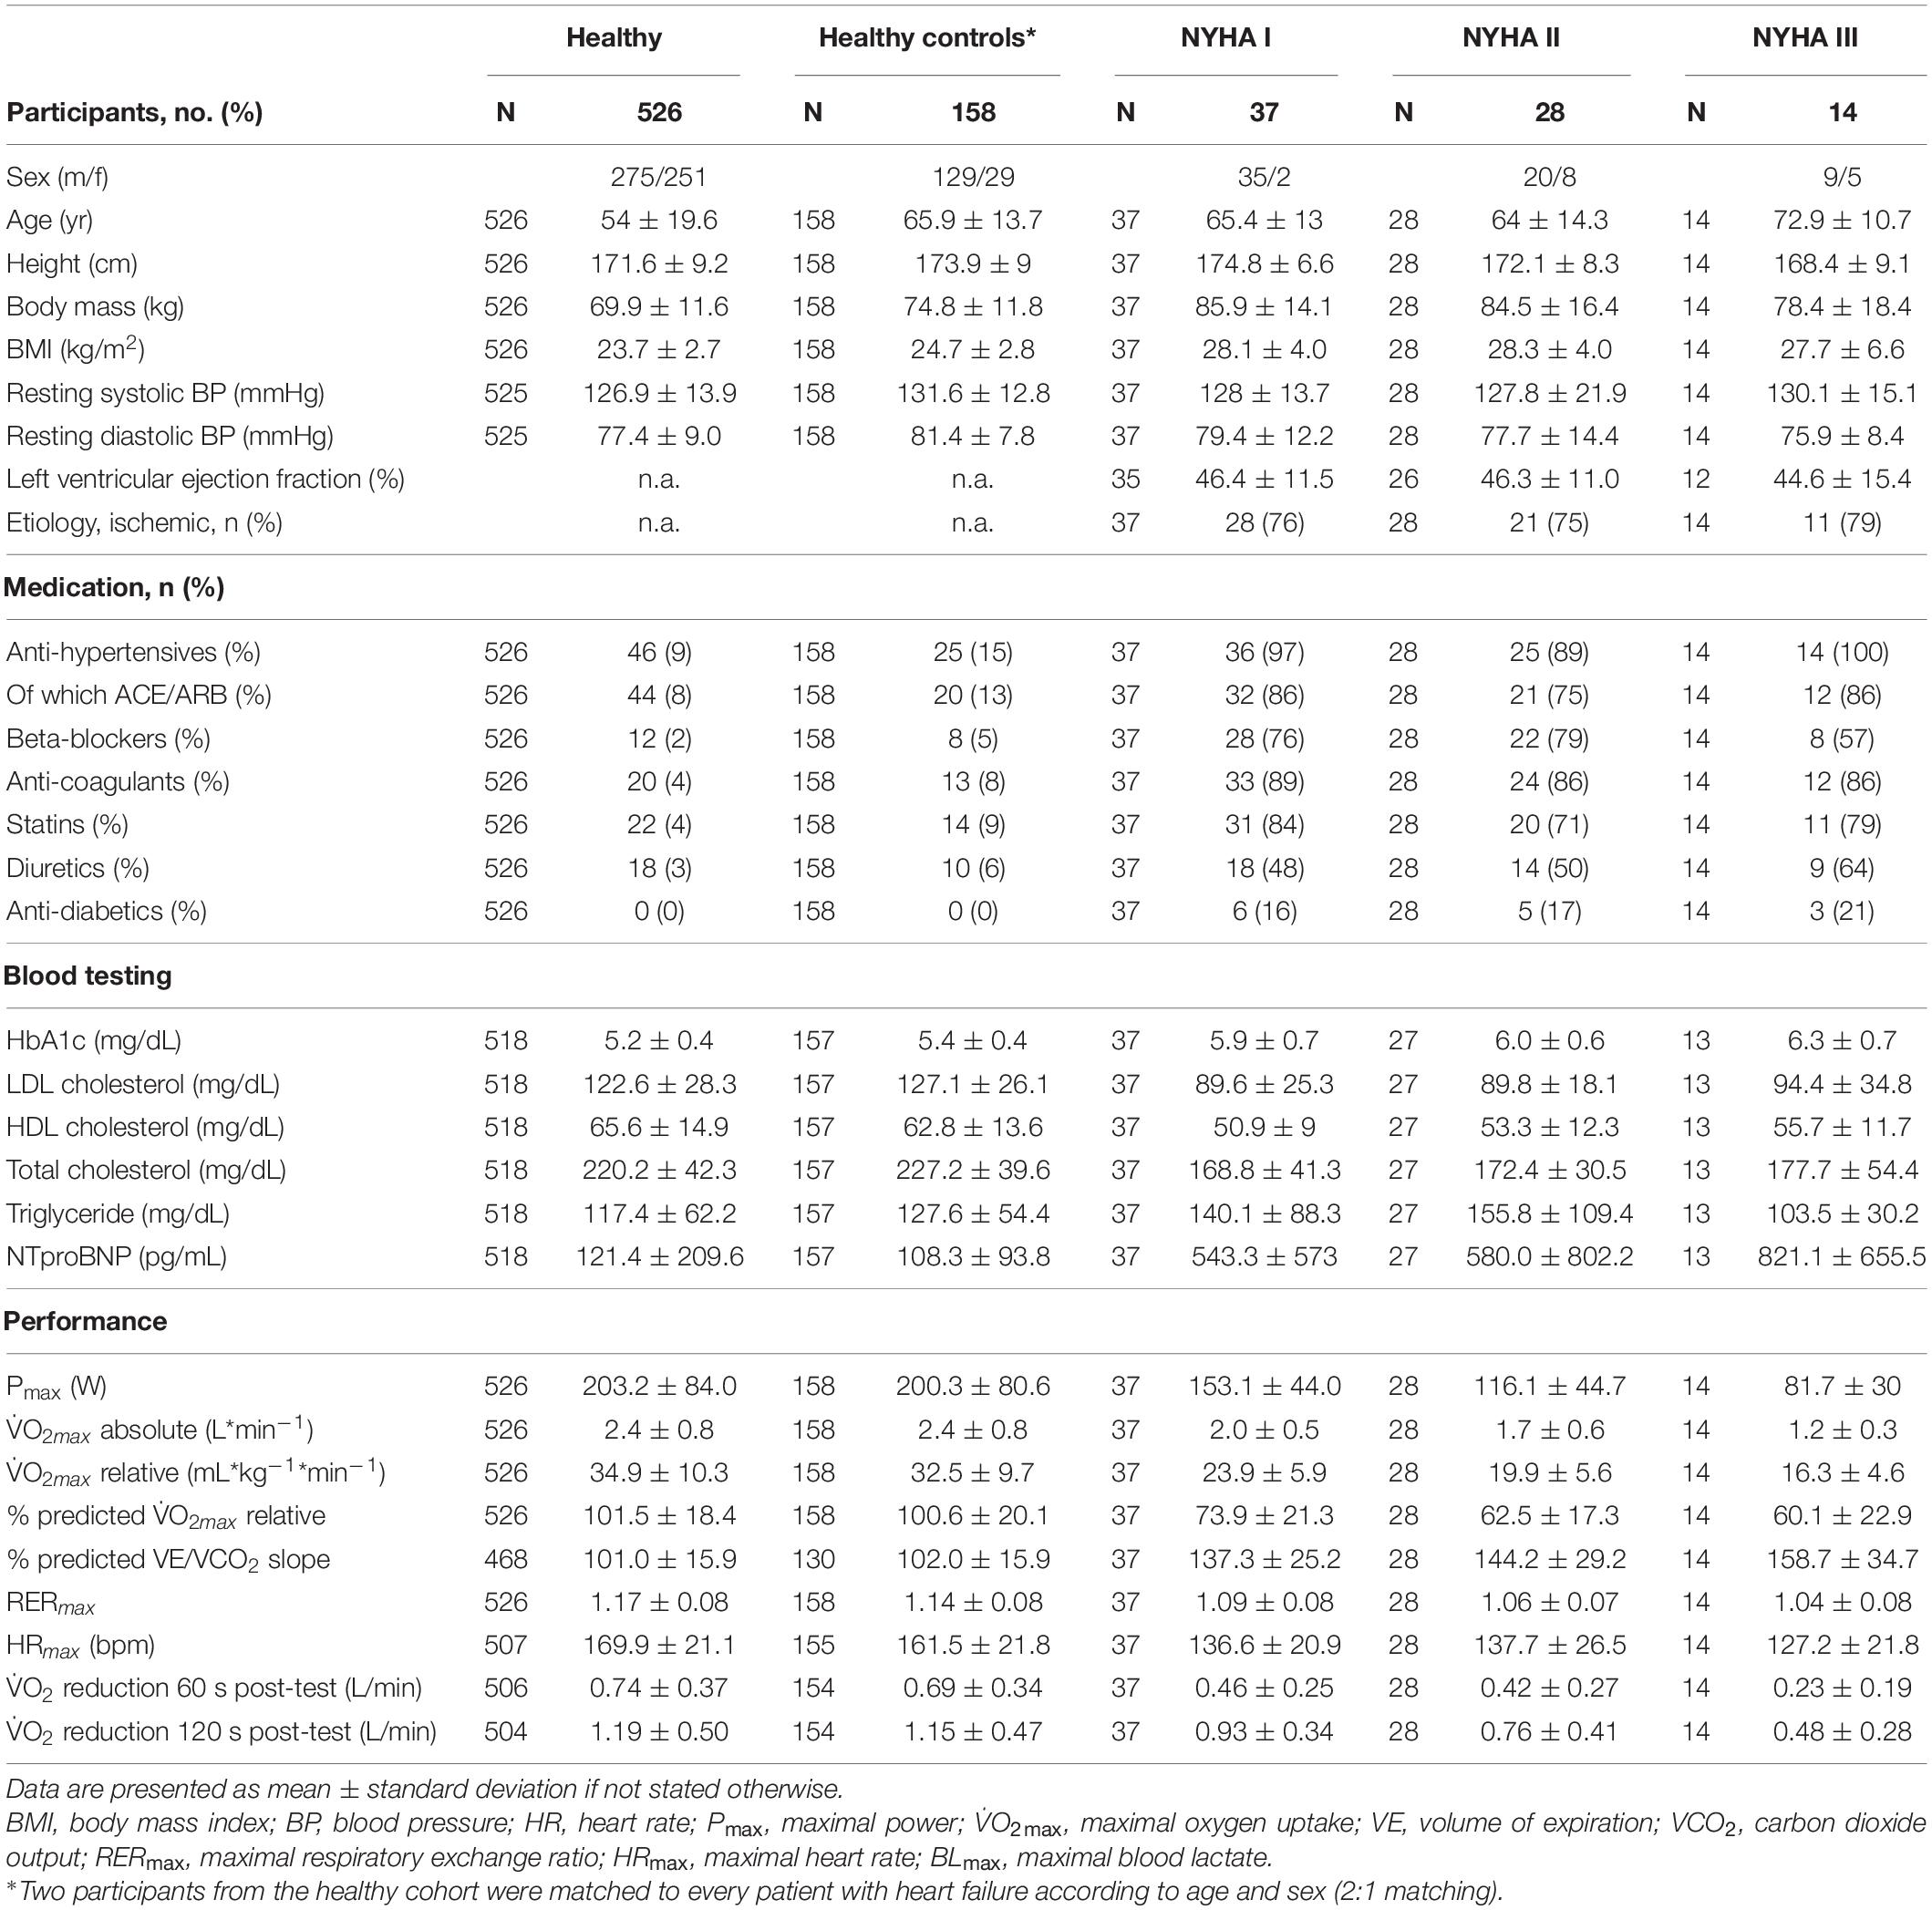
Table 1. Descriptive characteristics of the study population separated into healthy participants and patients with heart failure by NYHA functional classes.
V̇O2-Kinetics in Health and Heart Failure
Group differences between healthy participants and patients with HF irrespective of their NYHA class are reported in Table 2. Six out of eight V̇O2-kinetic parameters showed evidence for a difference between the groups (p ≤ 0.007). The number of participants involved in the analysis of the respective kinetic parameter indicates the susceptibility to minor measurement difficulties during the CPET and the number of outliers due to the determination method which were excluded.
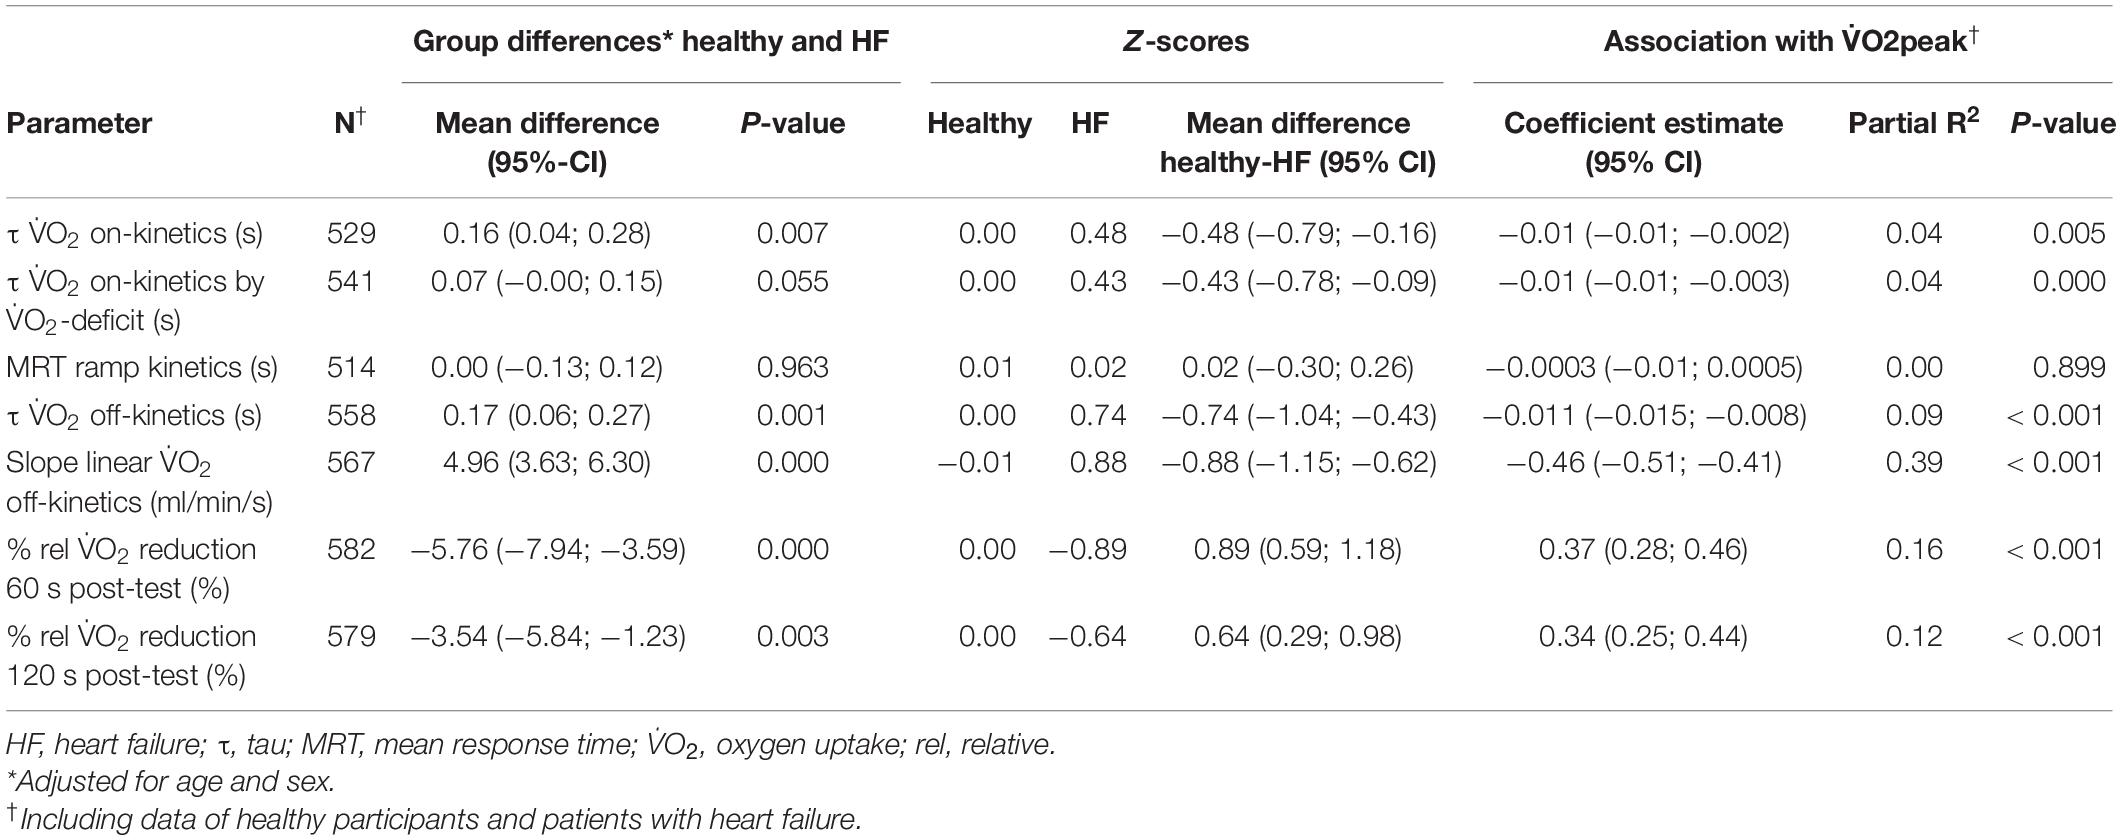
Table 2. Group differences between healthy participants and patients with heart failure, Z-scores and the association with V̇O2peak for all kinetic parameters.
Figure 2 presents violin plots of all analyzed kinetic parameters for NYHA class I, II, and III and the age- and sex-matched healthy reference group. In addition to the kinetic parameters, violin plots were presented for CPET markers known to have high predictive value (Wagner et al., 2018) including V̇O2peak, OUES, and V̇E/V̇CO2 slope for comparison.
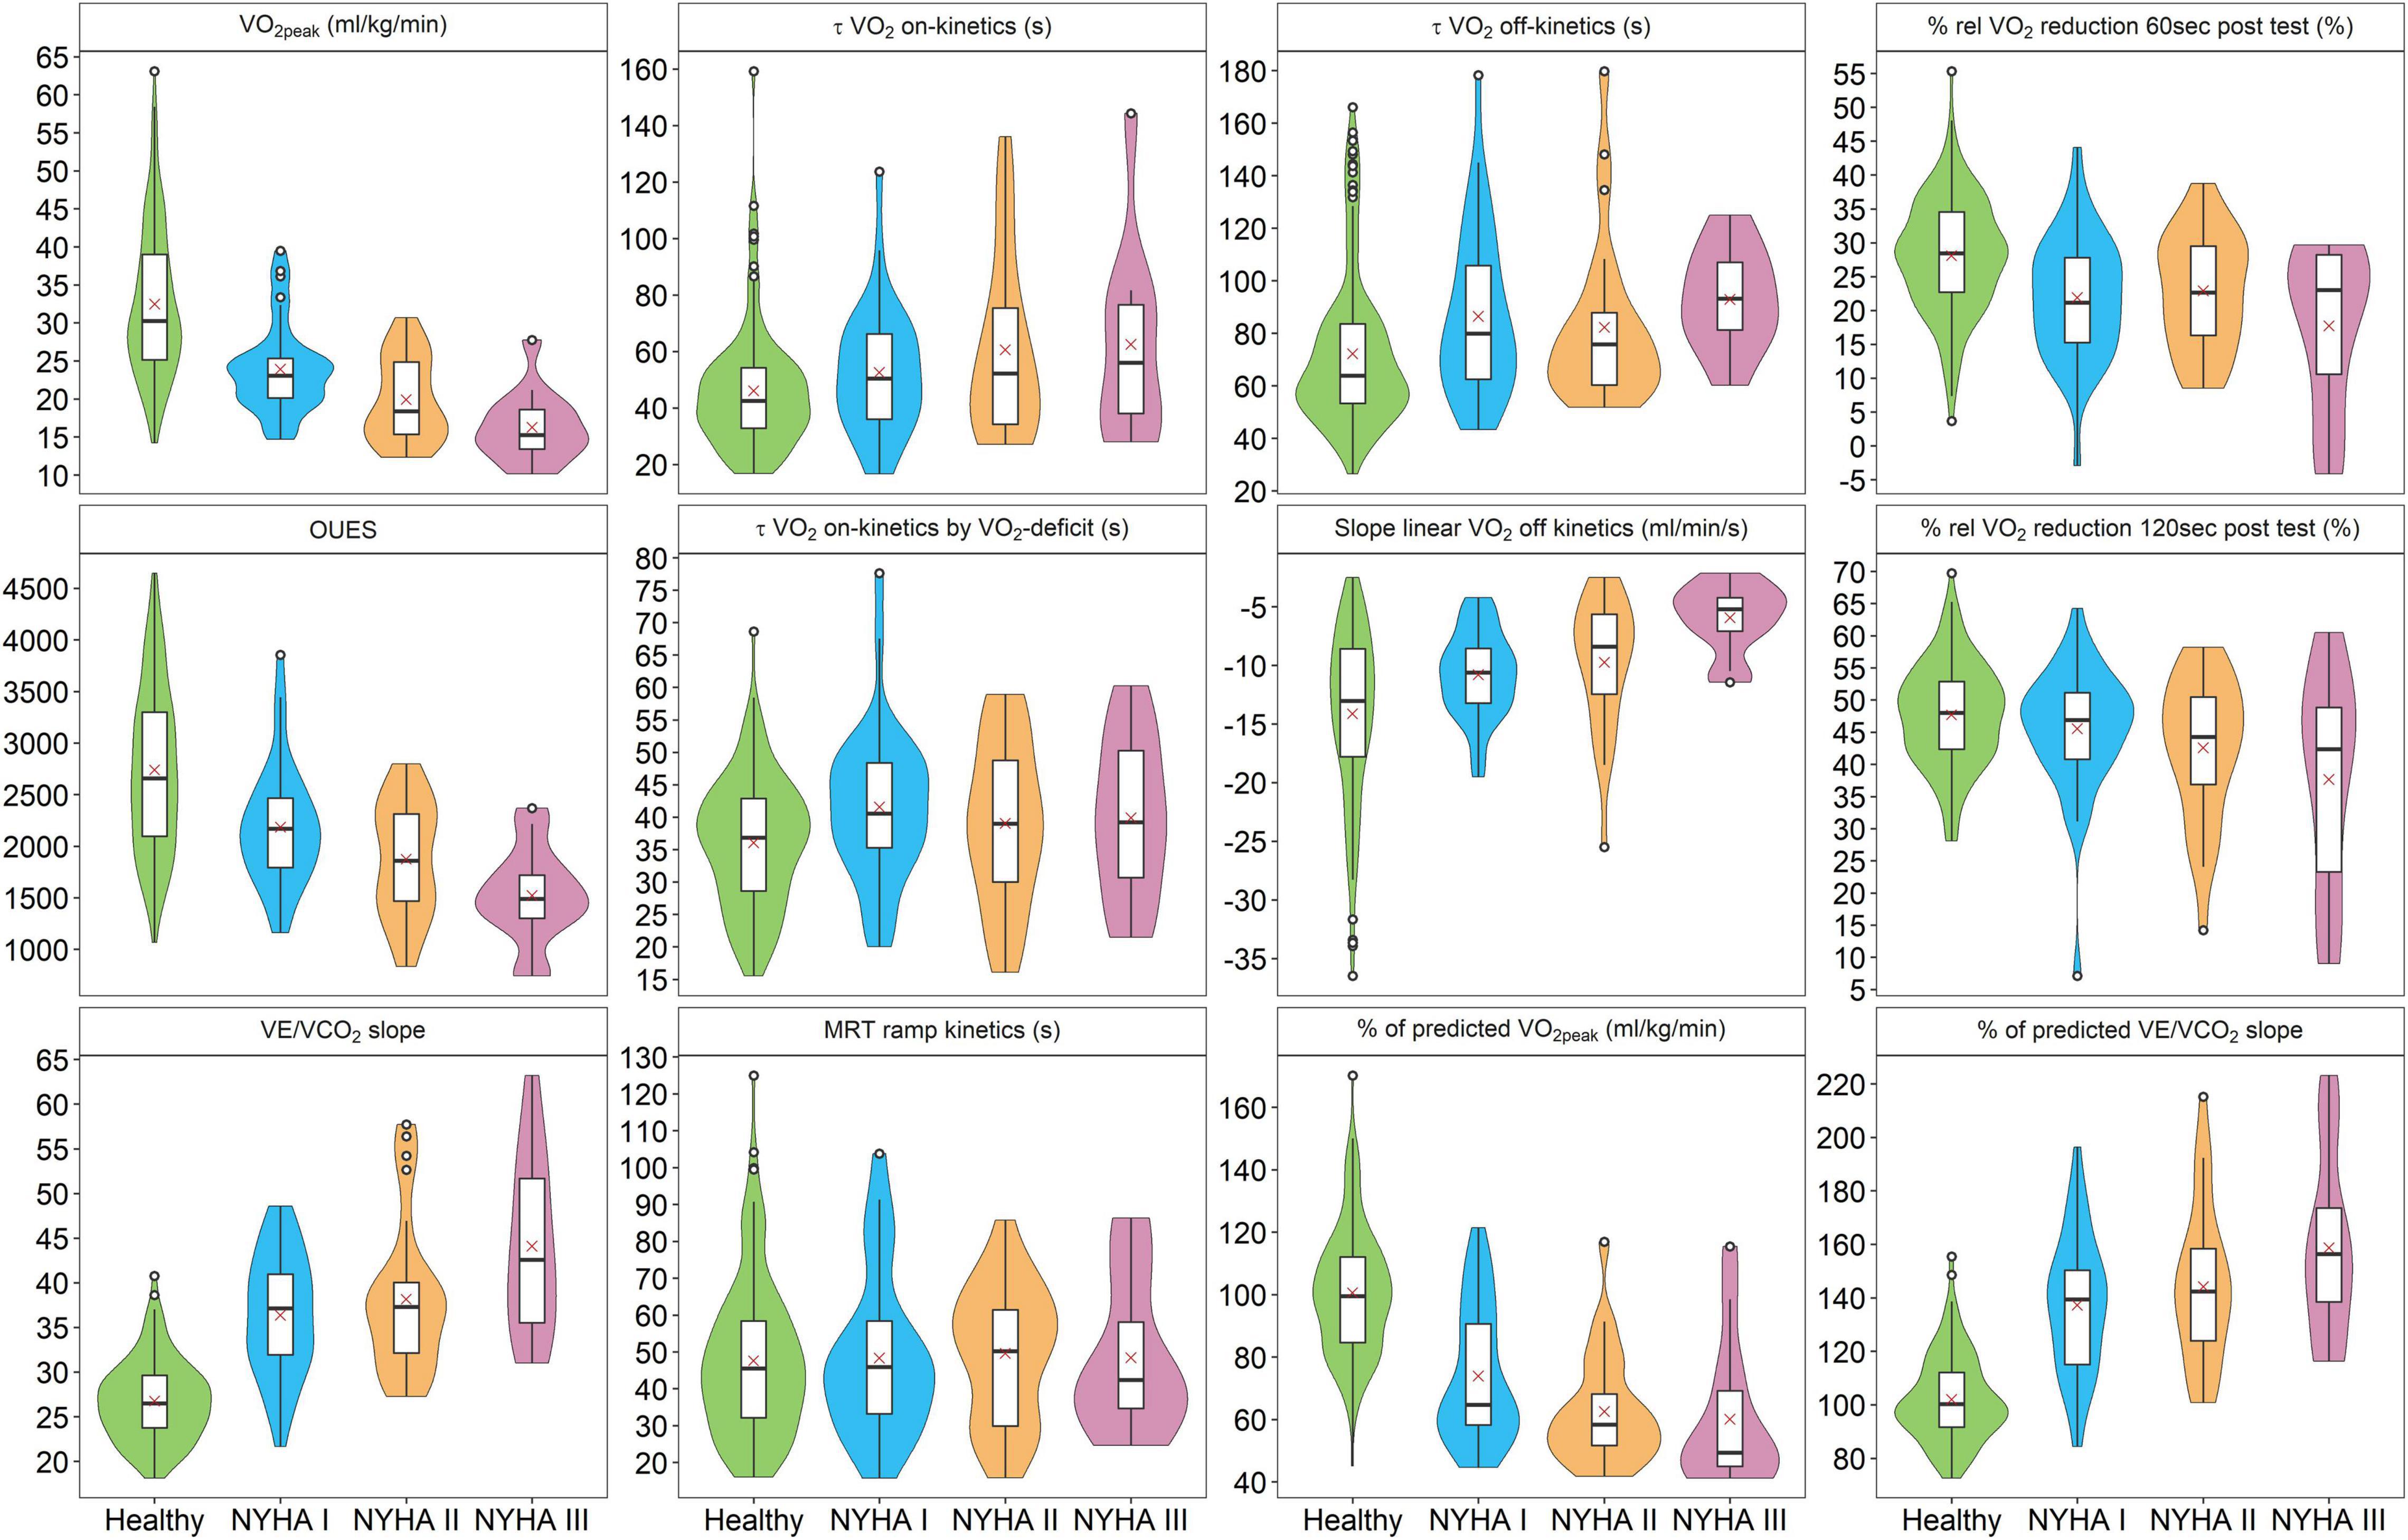
Figure 2. Comparison of VO2 on-kinetic und VO2 off-kinetic parameters between a healthy control group and patients with heart failure with NYHA functional classes I, II, and III. V̇O2peak, peak oxygen uptake; OUES, oxygen uptake efficiency slope; VE, volume of expiration; VCO2, carbon dioxide output; τ, tau; MRT, mean response time; rel, relative.
The z-scores (Table 2) show that τ V̇O2 on-kinetics was the best V̇O2 on-kinetic parameter to discriminate between healthy participants and patients with HF. Slope linear V̇O2 off-kinetics (ml/min/s) and % rel V̇O2 reduction 60 s post-test performed best among the V̇O2 off-kinetic parameters. These three parameters were therefore considered superior to the others, and further analyses were limited to these parameters.
Quantile curves for τ V̇O2 on-kinetics, slope linear V̇O2 off-kinetics (ml/min/s), and % rel V̇O2 reduction 60 s post-test are presented in Figure 3. The quantile curves based on the healthy participants tend toward pathological numbers with increasing age. For the parameter τ V̇O2 on-kinetics, 60% of the patients with HF were located above the 50th percentile. For the slope linear V̇O2 off-kinetics (ml/min/s), 85% of the patients with HF were located below the 50th percentile, and for rel V̇O2 reduction 60 s post-test, 78% were located above the 50th percentile.
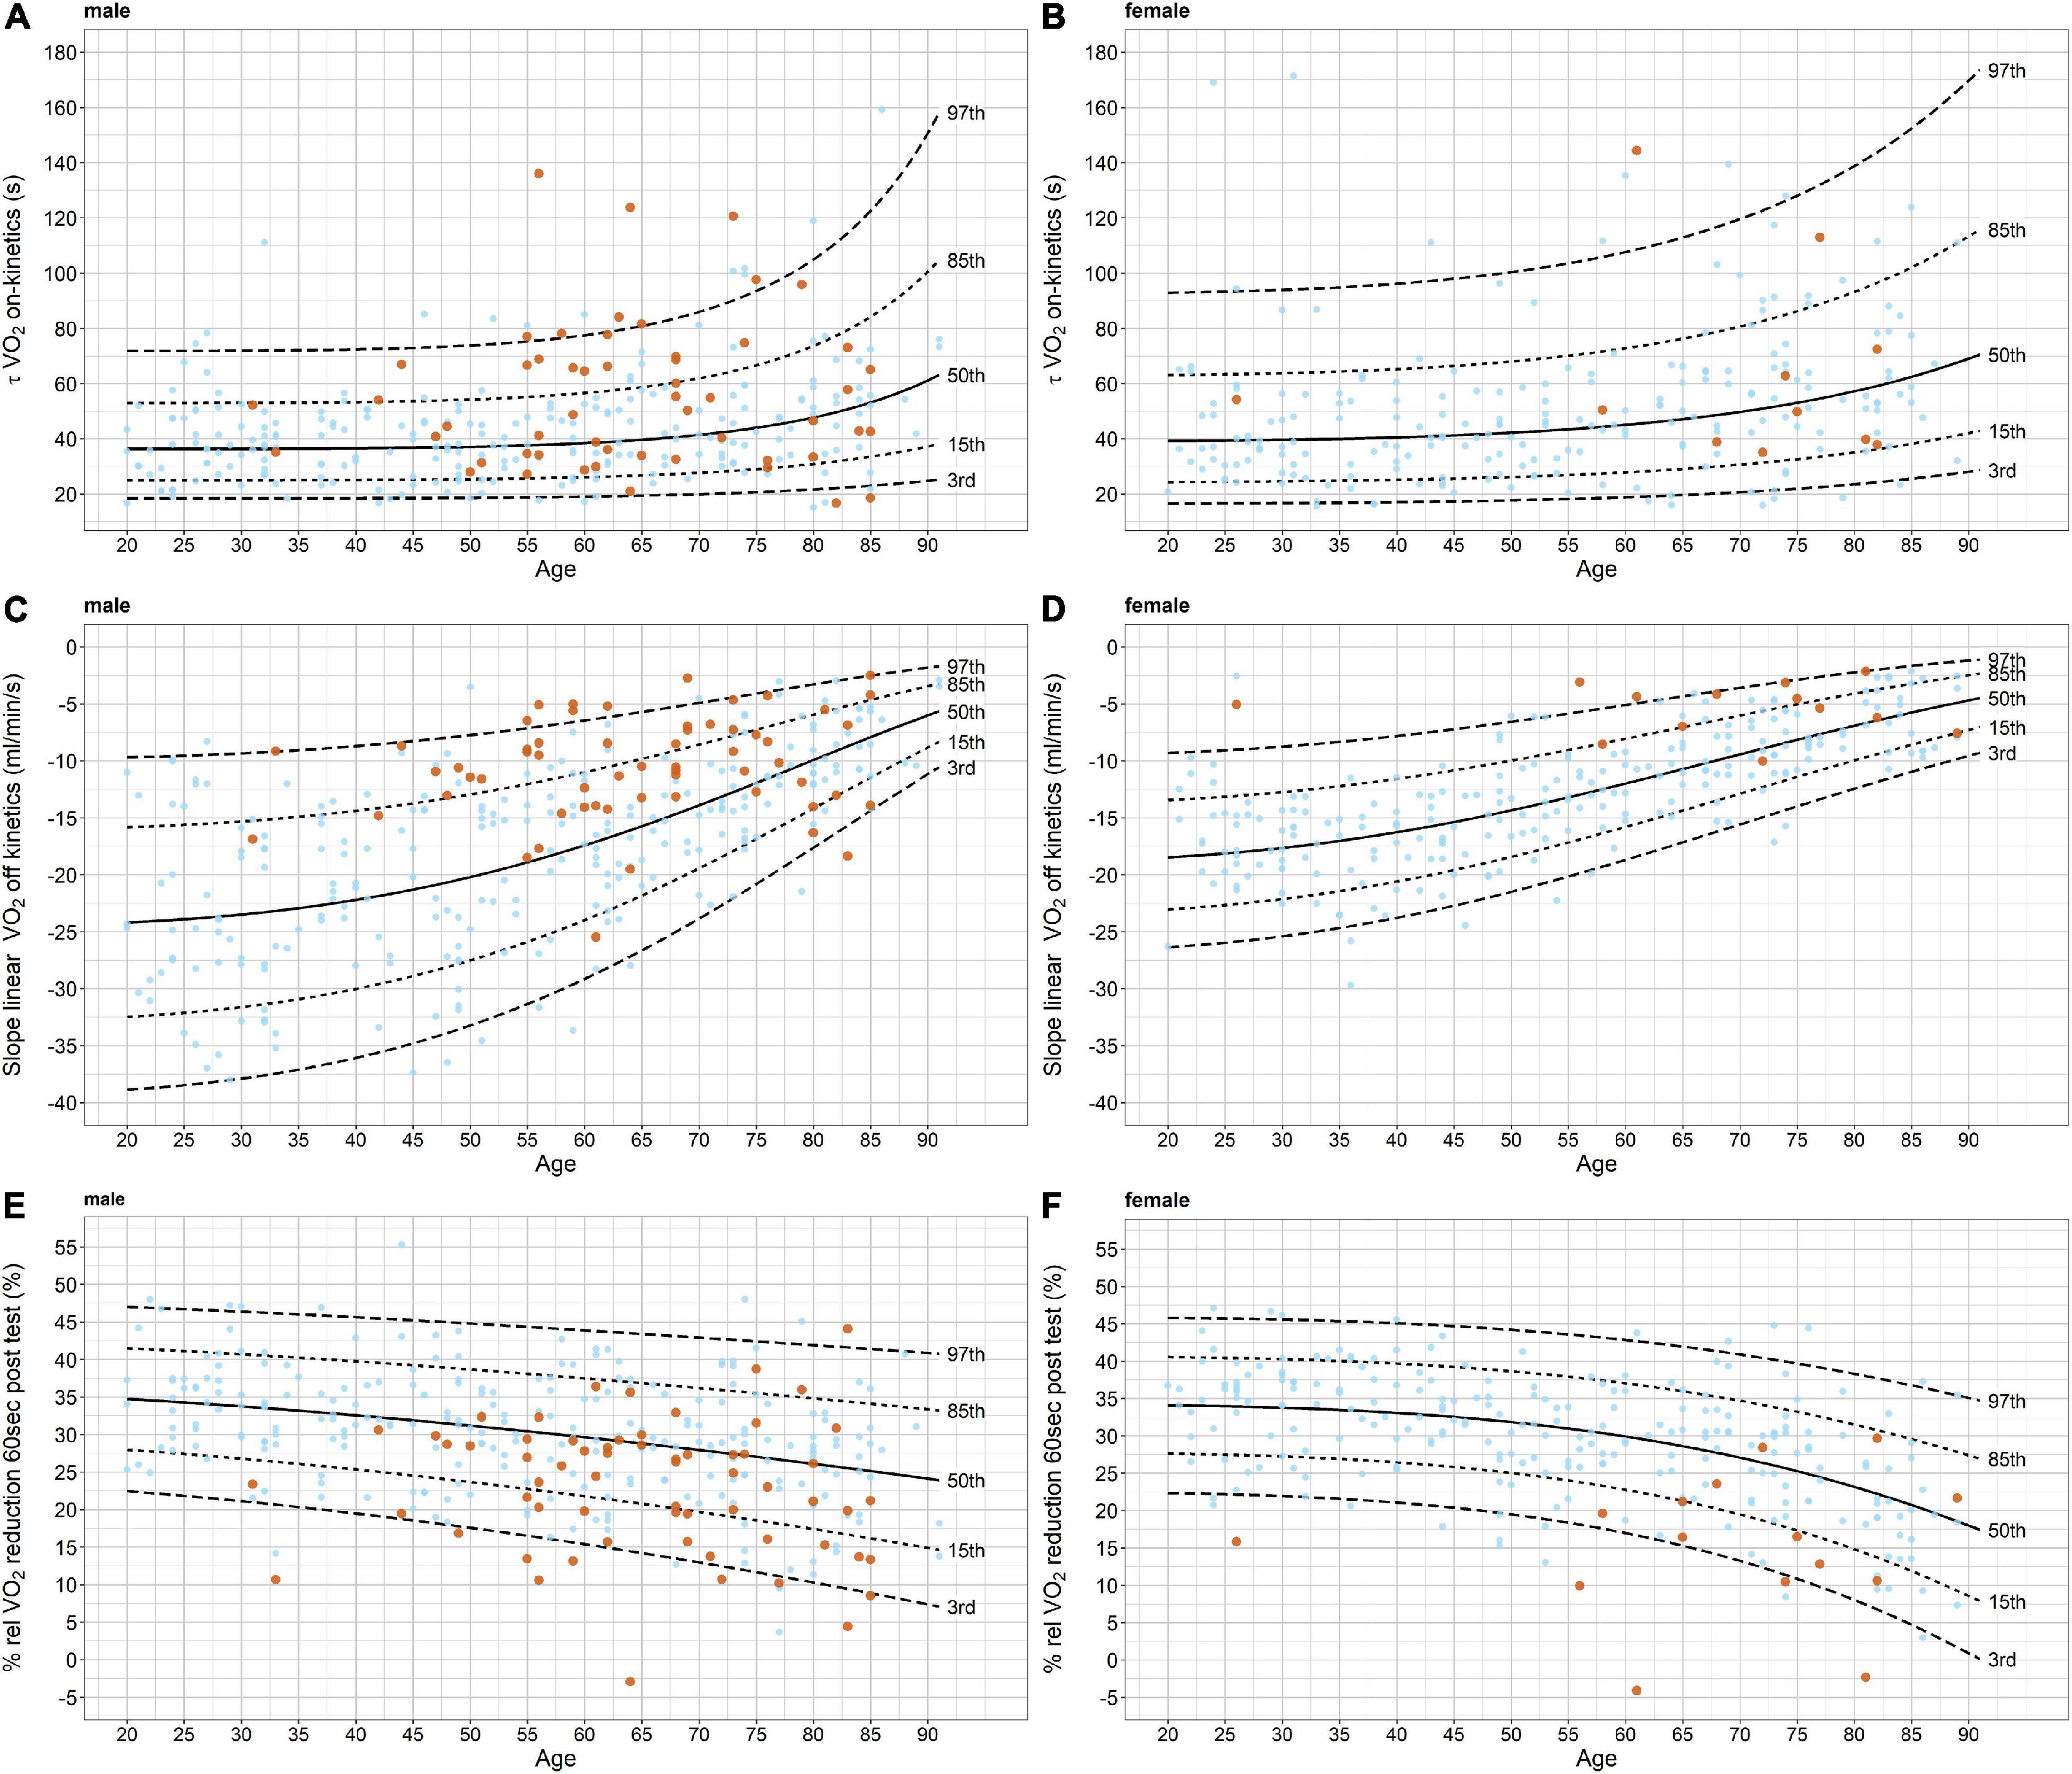
Figure 3. Quantile curves for τ VO2 on-kinetics, slope linear VO2 off-kinetics (ml/min/s), and % rel VO2 reduction 60 s post-test for males and females, separately. The quantile curves are based on the healthy participants only (light blue data points). Values of the patients with heart failure are presented in orange. V̇O2, oxygen uptake.
Association of V̇O2-Kinetics and V̇O2peak
There was strong evidence for associations between V̇O2peak (ml/kg/min) and all V̇O2 on- and off-kinetics parameter except for MRT ramp kinetics in which there was no evidence for such an association observed (Table 2, last three columns). The direction of the association can be described as follows: the faster the V̇O2-kinetic response (depending on the parameter, a positive or negative association) the higher the V̇O2peak values are observed. By far, the largest adjusted R2 was observed for the slope linear V̇O2 off-kinetics (ml/min/s).
Predicting Disease Severity (New York Heart Association-Classification) Using Kinetic Parameters
Table 3 shows the results of several models for NYHA class prediction by kinetic parameters. All kinetic parameters improved the model when the base model contained sex and age. As indicated by the Chi2, slope linear V̇O2 off-kinetics (ml/min/s) improved the model from the three kinetic parameters most but not to the extent that V̇O2peak did.
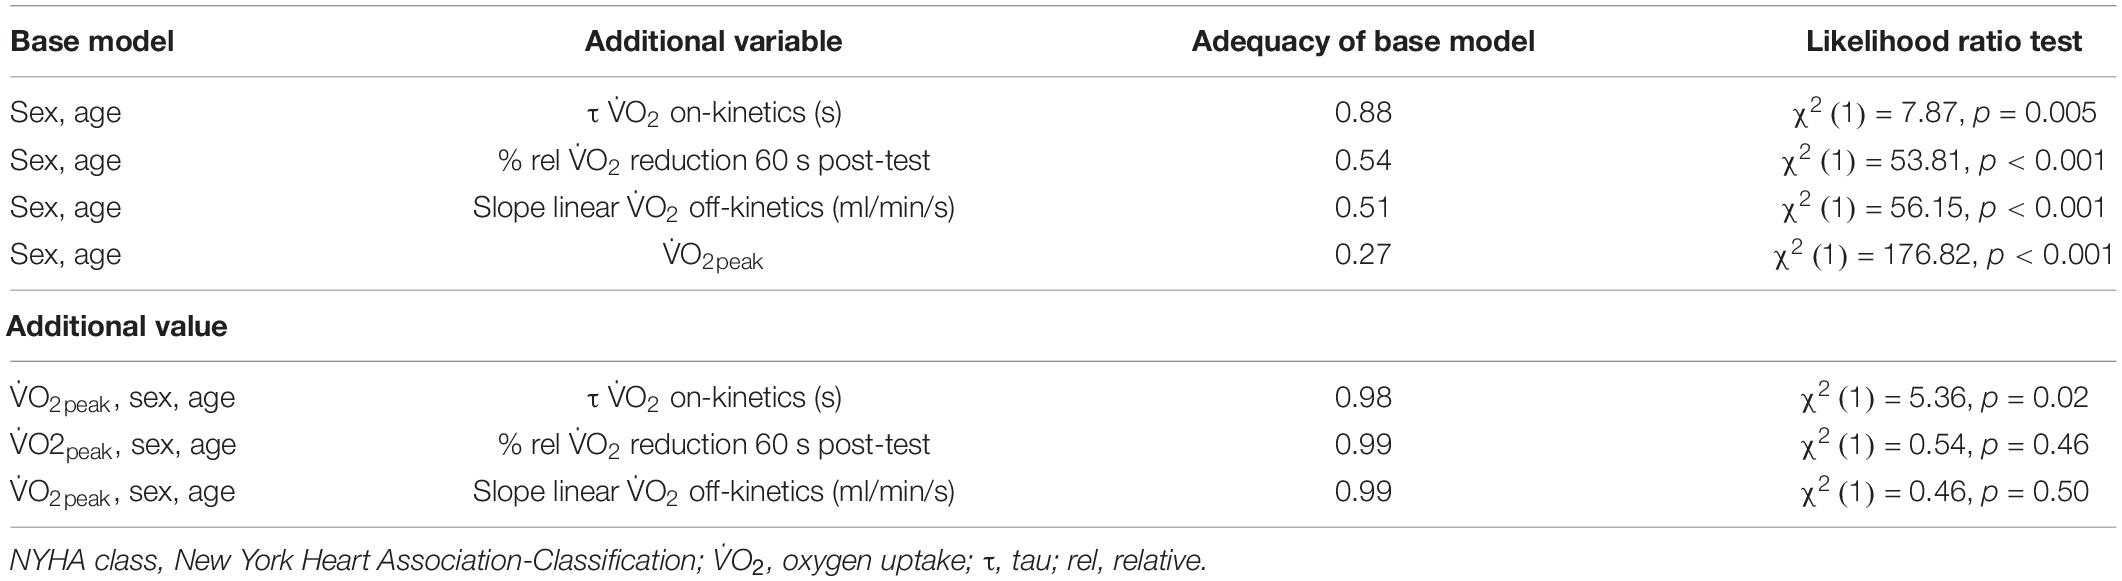
Table 3. Predicting disease severity (NYHA functional class) using V̇O2 kinetic parameters.
Additional Value of Kinetics to Predict Disease Severity
There was little evidence that any of the three kinetic parameters improved the models already containing sex, age, and V̇O2peak. The adequacy index comparing the base models containing age, sex, and V̇O2peak to a model additionally containing the kinetic parameters was between 0.98 and 0.99. This means that the base models without the V̇O2 kinetic parameters contain nearly all the predictive information already.
Discussion
To our knowledge, the current study is the first to provide detailed V̇O2 kinetic results in large cohorts of healthy participants and patients with HF. All previously suggested methods to calculate V̇O2 on- and off-kinetics for risk stratification using a standard ramp protocol were analyzed and compared. Our results show that the V̇O2 off-kinetics according to rel V̇O2 reduction 60 s post-test (%) or slope linear V̇O2 off-kinetics (ml/min/s) present an alternative to evaluate aerobic function and disease severity if V̇O2peak cannot be determined. Additional value beyond that of V̇O2peak for risk stratification of patients with HF was not provided by V̇O2 on- or off-kinetics.
Differences Between Healthy Participants and Patients With Heart Failure
This study provides evidence that V̇O2-kinetic parameters differ between healthy participants and a group of mild to moderate functionally impaired patients with HF for all kinetic calculation methods with the exception of τ V̇O2 on-kinetics by V̇O2-deficit and MRT of the ramp kinetics. The observed differences are in line with previous findings showing that patients with HF had significantly slower V̇O2-kinetics compared to healthy volunteers (Sietsema et al., 1994; Meyer et al., 1998; Pavia et al., 1999; Hummel et al., 2016). The slowing of V̇O2-kinetics in HF is closely related to impaired ventricular-pulmonary vascular function (Kemps et al., 2009; Chatterjee et al., 2013) and/or impaired peripheral oxygen utilization (Weiss et al., 2017).
Mean differences in z-scores (Table 2) clearly indicate that V̇O2 off-kinetics, irrespective of the calculation method, discriminate better between healthy participants and patients with HF compared to V̇O2 on-kinetics.
These results are in line with previous research showing that off-kinetics can be determined with greater fidelity (Kemps et al., 2009) and higher reproducibility (Kemps et al., 2007) than on-kinetics in patients with HF. Further, irrespective of the methodological difficulties with on-kinetics, off-kinetics may discriminate patients with HF better from their healthy counterparts as has been observed in a previous study (Sietsema et al., 1994).
The comparison between the off-kinetics parameters (different calculation approaches) revealed a higher potential to distinguish healthy participants and patients with HF for % rel V̇O2 reduction 60 s post-test and slope linear V̇O2 off-kinetics compared to % rel V̇O2 reduction 120 s post-test and τ V̇O2 off-kinetics. Interestingly, both superior off-kinetics parameters were determined from the first minute of the recovery period only, while the other parameters were calculated from the first 2 min (% rel V̇O2 reduction 120 s post-test) or the entire recovery duration (τ V̇O2 off-kinetics). This indicates that the very early phase of the off transition better distinguished between healthy participants and patients with HF.
Association With V̇O2 peak
Strong significant associations between V̇O2peak and off-kinetics were observed. Slope linear V̇O2 off-kinetics explained 39% of the variation in V̇O2peak among healthy participants and patients with HF. In contrast, V̇O2 on-kinetics showed significant but only weak associations with V̇O2peak; the on-kinetics parameter τ V̇O2 (s) explained only 4% of the variation in V̇O2peak. The stronger association of the off-kinetics compared to the on-kinetics can likely be explained by the methodological considerations of the on-kinetics described above.
A recent study showed that the level of exhaustion had no impact on V̇O2 off-kinetics (Ichikawa et al., 2020). That the determination of V̇O2-kinetics, unlike V̇O2peak, does not require the subject to perform the test to maximal voluntary exertion is a large advantage. Many patients lack the motivation to perform a maximal exercise test, are not familiarized with severe exercise, or may have a contraindication to maximal exertion (Green and Askew, 2018). In contrast, the successful determination of V̇O2peak requires either a V̇O2-plateau or a confirmation of a secondary exhaustion criteria (Wagner et al., 2020). Considering the large existing evidence base for the valuable information V̇O2-kinetics provides coupled with the present results, V̇O2 off-kinetics can be suggested as potential substitute for V̇O2peak.
Predicting Disease Severity
The ability of a model to predict health status and disease severity of the patients with HF improved significantly when the V̇O2 on-kinetic parameter (τ V̇O2 on-kinetics) and the V̇O2 off-kinetic parameter (% rel V̇O2 reduction 60 s post-test) were added. However, only V̇O2 off-kinetics added substantial information to the model. Thus, V̇O2 off-kinetics could be a tool to discriminate not only between healthy participants and those with mild functional impairment (NYHA class I) but also between NYHA classes as visualized by Figure 2. Our results are in line with previous studies showing the potential of V̇O2-kinetics for risk stratification (Schalcher et al., 2003; Fortin et al., 2015) but are in contrast to others who did not demonstrate better predictive value by the addition of V̇O2 off-kinetics (de Groote et al., 1996; Pavia et al., 1999; Hummel et al., 2016).
Since we could already show the association with V̇O2peak—considered the gold standard criteria for risk stratification—another established parameter, NYHA functional class, was used to stratify risk in patients with HF. Based on the different underlining physiological aspects represented by V̇O2peak and V̇O2-kinetics (Sietsema et al., 1994; Chatterjee et al., 2013), some additional predictive value of V̇O2-kinetics could be expected. However, our results showed minimal evidence of additional value of V̇O2 on- or off-kinetics. Two reasons likely explain these results: (i) V̇O2peak is already a very strong risk predictor in patients with HF and the association of V̇O2peak and NYHA class is already known to be high and (ii) V̇O2-kinetics are likely to provide the same predictive information as V̇O2peak, which is underscored by the association between V̇O2 off-kinetics and V̇O2peak in this study. Therefore, even though we observed that V̇O2-kinetics has predictive value, it does not appear to have value beyond V̇O2peak.
Practical Applications
Our results indicate that the method of quantifying V̇O2-kinetics is critical to its clinical application. They suggest that the determination of V̇O2 on-kinetics from rest to a light constant load phase is not optimal; rather, the results favor the analysis of off-kinetics when using a ramp protocol. The calculation of rel V̇O2 reduction 60 s post-test (%) or slope linear V̇O2 off-kinetics (ml/min/s) is recommended to distinguish between healthy individuals and patients with HF. Since V̇O2 off-kinetics is not affected by the level of exhaustion (Ichikawa et al., 2020), these parameters might be used as a substitute for V̇O2peak when maximal exhaustion is not reached or when V̇O2peak cannot be interpreted.
Using some basic spreadsheet calculation tools, the calculation of rel V̇O2 reduction 60 s post-test (%) and slope linear V̇O2 off-kinetics (ml/min/s) are quite simple (see Appendix). To facilitate the routine application of V̇O2 off-kinetics in the clinical setting, we recommend that the incorporation of these parameters in CPET application software.
Limitations
Our study has limitations. The study was cross-sectional, and therefore no hard endpoints such as mortality or hospitalization were available. Furthermore, our HF cohort is predominantly represented by male ischemic patients with mildly reduced left ventricular ejection fraction and comparatively preserved exercise capacity as suggested by their mean values of V̇O2 peak. This may not fully reflect the real-world HF population, which partly limits the transferability of our findings. To further improve the reliability and validity of the V̇O2 on- and off-kinetics determination, a warm-up and a cool-down phase of 5 min instead of 3 min could be applied.
Conclusion
Differences in V̇O2-kinetics between healthy participants and patients with HF are observed and are highly dependent on how they are calculated. V̇O2 off-kinetics appears to be superior for distinguishing patients with HF and healthy participants compared with V̇O2 on-kinetics and ramp-kinetics. If V̇O2peak cannot be determined, V̇O2 off-kinetics provides an acceptable substitute. However, additional value beyond that of V̇O2peak cannot be provided by V̇O2-kinetics.
Data Availability Statement
The raw data supporting the conclusions of this article will be made available by the authors, without undue reservation.
Ethics Statement
The studies involving human participants were reviewed and approved by the Ethics Committee of Northwestern and Central Switzerland (EKNZ 2017-01451). The patients/participants provided their written informed consent to participate in this study.
Author Contributions
JW, MN, JM, RK, DI, and AS-T: conception and design of the research and analysis and interpretation of the data. JW and RK: acquisition of data. DI: statistical analysis. AS-T and RK: obtaining funding and supervising the work. JW and MN: drafting the manuscript. DI, JM, OP, AS-T, and RK: critical revision of the manuscript for important intellectual content. All authors contributed to the article and approved the submitted version.
Funding
This study was supported by the National Fund of Switzerland (Grant number: 182815) and the Department of Sport, Exercise and Health of the University of Basel, Division of Sports and Exercise Medicine, Switzerland.
Conflict of Interest
The authors declare that the research was conducted in the absence of any commercial or financial relationships that could be construed as a potential conflict of interest.
Publisher’s Note
All claims expressed in this article are solely those of the authors and do not necessarily represent those of their affiliated organizations, or those of the publisher, the editors and the reviewers. Any product that may be evaluated in this article, or claim that may be made by its manufacturer, is not guaranteed or endorsed by the publisher.
Acknowledgments
The authors thank all healthy participants and patients who made this study possible by their participation. They also gratefully acknowledge the assistance from Karsten Königstein, Christopher Klenk, and Justin Carrard by performing the medical examinations.
References
Benson, A. P., Bowen, T. S., Ferguson, C., Murgatroyd, S. R., and Rossiter, H. B. (2017). Data collection, handling, and fitting strategies to optimize accuracy and precision of oxygen uptake kinetics estimation from breath-by-breath measurements. J. Appl. Physiol. 123, 227–242. doi: 10.1152/japplphysiol.00988.2016
Chatterjee, N. A., Murphy, R. M., Malhotra, R., Dhakal, B. P., Baggish, A. L., Pappagianopoulos, P. P., et al. (2013). Prolonged mean VO2 response time in systolic heart failure: an indicator of impaired right ventricular-pulmonary vascular function. Circ. Heart Fail. 6, 499–507. doi: 10.1161/CIRCHEARTFAILURE.112.000157
de Groote, P. Millaire, A. Decoulx, E. Nugue, O. Guimier, P. Ducloux (1996). Kinetics of oxygen consumption during and after exercise in patients with dilated cardiomyopathy. New markers of exercise intolerance with clinical implications. J. Am. Coll. Cardiol. 28, 168–175. doi: 10.1016/0735-1097(96)00126-x
Fortin, M., Turgeon, P. Y., Nadreau, E., Grégoire, P., Maltais, L. G., Sénéchal, M., et al. (2015). Prognostic value of oxygen kinetics during recovery from cardiopulmonary exercise testing in patients with chronic heart failure. Can. J. Cardiol. 31, 1259–1265. doi: 10.1016/j.cjca.2015.02.015
Gargiulo, P., Olla, S., Boiti, C., Contini, M., Perrone-Filardi, P., and Agostoni, P. (2014). Predicted values of exercise capacity in heart failure: where we are, where to go. Heart Fail. Rev. 19, 645–653. doi: 10.1007/s10741-013-9403-x
Green, S., and Askew, C. (2018). Vo2peak is an acceptable estimate of cardiorespiratory fitness but not Vo2max. J. Appl. Physiol. 125, 229–232. doi: 10.1152/japplphysiol.00850.2017
Harrell, F. E. (2015). Regression Modeling Strategies: With Applications to Linear Models, Logistic and Ordinal Regression, and Survival Analysis, 2nd Edn, Berlin: Springer.
Ho, D. E., Imai, K., King, G., and Stuart, E. A. (2011). MatchIt: nonparametric preprocessing for parametric causal inference. J. Stat. Softw. 42, 1–28.
Hummel, S. L., Herald, J., Alpert, C., Gretebeck, K. A., Champoux, W. S., Dengel, D. R., et al. (2016). Submaximal oxygen uptake kinetics, functional mobility, and physical activity in older adults with heart failure and reduced ejection fraction. J. Geriatr. Cardiol. 13, 450–457. doi: 10.11909/j.issn.1671-5411.2016.05.004
Ichikawa, Y., Maeda, T., Takahashi, T., Ashikaga, K., Tanaka, S., Sumi, Y., et al. (2020). Changes in oxygen uptake kinetics after exercise caused by differences in loading pattern and exercise intensity. ESC Heart Fail. 7, 1109–1117. doi: 10.1002/ehf2.12641
Kemps, H. M., De Vries, W. R., Hoogeveen, A. R., Zonderland, M. L., Thijssen, E. J., and Schep, G. (2007). Reproducibility of onset and recovery oxygen uptake kinetics in moderately impaired patients with chronic heart failure. Eur. J. Appl. Physiol. 100, 45–52. doi: 10.1007/s00421-007-0398-7
Kemps, H. M., Prompers, J. J., Wessels, B., De Vries, W. R., Zonderland, M. L., Thijssen, E. J., et al. (2009). Skeletal muscle metabolic recovery following submaximal exercise in chronic heart failure is limited more by O(2) delivery than O(2) utilization. Clin. Sci. 118, 203–210. doi: 10.1042/cs20090220
Long, J. S., and Ervin, L. H. (2000). Using heteroscedasticity consistent standard errors in the linear regression model. Am. Statist. 54, 217–224. doi: 10.2307/2685594
Meyer, K., Schwaibold, M., Hajric, R., Westbrook, S., Ebfeld, D., Leyk, D., et al. (1998). Delayed VO2 kinetics during ramp exercise: a criterion for cardiopulmonary exercise capacity in chronic heart failure. Med. Sci. Sports Exerc. 30, 643–648. doi: 10.1097/00005768-199805000-00001
Nanas, S., Nanas, J., Kassiotis, C., Nikolaou, C., Tsagalou, E., Sakellariou, D., et al. (2001). Early recovery of oxygen kinetics after submaximal exercise test predicts functional capacity in patients with chronic heart failure. Eur. J. Heart Fail. 3, 685–692. doi: 10.1016/s1388-9842(01)00187-8
Niemeyer, M., Leithauser, R., and Beneke, R. (2020). Effect of intensive prior exercise on muscle fiber activation, oxygen uptake kinetics, and oxygen uptake plateau occurrence. Eur. J. Appl. Physiol. 120, 2019–2028. doi: 10.1007/s00421-020-04426-1
Pavia, L., Myers, J., and Cesare, R. (1999). Recovery kinetics of oxygen uptake and heart rate in patients with coronary artery disease and heart failure. Chest 116, 808–813. doi: 10.1378/chest.116.3.808
Ponikowski, P., Voors, A. A., Anker, S. D., Bueno, H., Cleland, J. G. F., Coats, A. J. S., et al. (2016). 2016 ESC Guidelines for the diagnosis and treatment of acute and chronic heart failure: the task force for the diagnosis and treatment of acute and chronic heart failure of the European Society of Cardiology (ESC) developed with the special contribution of the Heart Failure Association (HFA) of the ESC. Eur. Heart J. 37, 2129–2200.
Poole, D. C., and Jones, A. M. (2012). Oxygen uptake kinetics. Compr. Physiol. 2, 933–996. doi: 10.1002/cphy.c100072
Ross, R., Blair, S. N., Arena, R., Church, T. S., Després, J. P., Franklin, B. A., et al. (2016). Importance of assessing Cardiorespiratory fitness in clinical practice: a case for fitness as a clinical vital sign: a scientific statement from the American Heart Association. Circulation 134, e653–e699. doi: 10.1161/CIR.0000000000000461
Salvioni, E., Corra, U., Piepoli, M., Rovai, S., Correale, M., Paolillo, S., et al. (2020). Gender and age normalization and ventilation efficiency during exercise in heart failure with reduced ejection fraction. ESC Heart Fail. 7, 371–380. doi: 10.1002/ehf2.12582
Schalcher, C., Rickli, H., Brehm, M., Weilenmann, D., Oechslin, E., Kiowski, W., et al. (2003). Prolonged oxygen uptake kinetics during low-intensity exercise are related to poor prognosis in patients with mild-to-moderate congestive heart failure. Chest 124, 580–586. doi: 10.1378/chest.124.2.580
Sietsema, K. E., Ben-Dov, I., Zhang, Y. Y., Sullivan, C., and Wasserman, K. (1994). Dynamics of oxygen uptake for submaximal exercise and recovery in patients with chronic heart failure. Chest 105, 1693–1700. doi: 10.1378/chest.105.6.1693
Stasinopoulos, M. D., Rigby, R. A., Heller, G. Z., Voudouris, V., and De Bastiani, F. (2017). Flexible Regression and Smoothing: Using GAMLSS in R. Boca Raton, FL: CRC Press.
van Buuren, S., and Fredriks, M. (2001). Worm plot: a simple diagnostic device for modelling growth reference curves. Stat. Med. 20, 1259–1277. doi: 10.1002/sim.746
Virani, S. S., Alonso, A., Benjamin, E. J., Bittencourt, M. S., Callaway, C. W., Carson, A. P., et al. (2020). Heart disease and stroke statistics-2020 update: a report from the American Heart Association. Circulation 141, e139–e596. doi: 10.1161/CIR.0000000000000757
Wagner, J., Agostoni, P., Arena, R., Belardinelli, R., Dumitrescu, D., Hager, A., et al. (2018). The role of gas exchange variables in cardiopulmonary exercise testing for risk stratification and management of heart failure with reduced ejection fraction. Am. Heart J. 202, 116–126. doi: 10.1016/j.ahj.2018.05.009
Wagner, J., Knaier, R., Infanger, D., Arbeev, K., Briel, M., Dieterle, T., et al. (2019). Functional aging in health and heart failure: the COmPLETE study. BMC Cardiovasc. Disord. 19:180. doi: 10.1186/s12872-019-1164-6
Wagner, J., Knaier, R., Infanger, D., Königstein, K., Klenk, C., Carrard, J., et al. (2021). Novel CPET reference values in healthy adults: associations with physical activity. Med. Sci. Sports Exerc. 53, 26–37. doi: 10.1249/mss.0000000000002454
Wagner, J., Niemeyer, M., Infanger, D., Hinrichs, T., Streese, L., Hanssen, H., et al. (2020). New data-based cutoffs for maximal exercise criteria across the lifespan. Med. Sci. Sports Exerc. 52, 1915–1923. doi: 10.1249/MSS.0000000000002344
Weiss, K., Schar, M., Panjrath, G. S., Zhang, Y., Sharma, K., Bottomley, P. A., et al. (2017). Fatigability, exercise intolerance, and abnormal skeletal muscle energetics in heart failure. Circ. Heart Fail. 10:e004129. doi: 10.1161/CIRCHEARTFAILURE.117.004129
Appendix
V̇O2-Kinetic Calculation
V̇O2 on-kinetics:
(1) τ V̇O2 on-kinetics.
where V̇O2rest was defined as the mean of the final 60 s of the resting period preceding the warm-up. ΔV̇O2SS was the steady-state increase of V̇O2 above V̇O2rest and τ the time constant of the overall response. τ thereby includes the cardio-dynamic and the primary component of V̇O2 on-transient kinetics and is equivalent to that what previously has been also called mean response time (MRT) of square wave exercise.
(2) τ V̇O2 on-kinetics by V̇O2-deficit.
where ΔV̇O2SS was previously calculated from the mean V̇O2 of the final 30 s of the warm-up period. The V̇O2-deficit was calculated from the difference between the consumed V̇O2 and the V̇O2-demand, which was calculated by multiplying ΔV̇O2SS with the duration of the warm-up period (for further details see: Schalcher et al., 2003).
V̇O2 off-kinetics:
(1) τ V̇O2 off-kinetics.
where V̇O2rec was defined as the asymptotic value of the recovery response. ΔV̇O2SS was the steady-state decrease of V̇O2 above V̇O2rec and τ the time constant of the overall response.
(2) Slope linear V̇O2 off-kinetics.
where a represents the slope and b the intercept of the linear V̇O2–time relationship.
Mean Response Time Ramp Test
where V̇O2 warm–up and Pwarm–up are defined as the V̇O2 and the work rate of the warm-up phase preceding the incremental phase. a and b represent the slope and the intercept of the V̇O2–work rate relationship of the incremental phase. S is defined as the ramp slope. The V̇O2 work rate slope was previously calculated using linear least-squares method regression analyses. To avoid any effects of a non-linear V̇O2 response due to the initial lag of V̇O2 or a potential plateau, the first minute and the last 2 min were excluded for the calculation.
Keywords: V̇O2max, V̇O2-kinetics, CRF, risk stratification, heart failure
Citation: Wagner J, Niemeyer M, Infanger D, Pfister O, Myers J, Schmidt-Trucksäss A and Knaier R (2021) Comparison of V̇O2-Kinetic Parameters for the Management of Heart Failure. Front. Physiol. 12:775601. doi: 10.3389/fphys.2021.775601
Received: 14 September 2021; Accepted: 20 October 2021;
Published: 25 November 2021.
Edited by:
Carlo Vignati, Monzino Cardiology Center, Scientific Institute for Research, Hospitalization and Healthcare (IRCCS), ItalyReviewed by:
Giovanna Gallo, Sapienza University, ItalyIlya Giverts, City Clinical Hospital No1 named after N.I. Pirogov, Russia
Copyright © 2021 Wagner, Niemeyer, Infanger, Pfister, Myers, Schmidt-Trucksäss and Knaier. This is an open-access article distributed under the terms of the Creative Commons Attribution License (CC BY). The use, distribution or reproduction in other forums is permitted, provided the original author(s) and the copyright owner(s) are credited and that the original publication in this journal is cited, in accordance with accepted academic practice. No use, distribution or reproduction is permitted which does not comply with these terms.
*Correspondence: Arno Schmidt-Trucksäss, arno.schmidt-trucksaess@unibas.ch
†These authors have contributed equally to this work