 Shu Zheng1,2†
 Zihao Xu
 Guangjian Ni
- 1Academy of Medical Engineering and Translational Medicine, Tianjin University, Tianjin, China
- 2Tianjin Key Laboratory of Brain Science and Neuroengineering, Tianjin, China
- 3Department of Biomedical Engineering, College of Precision Instruments and Optoelectronics Engineering, Tianjin University, Tianjin, China
Optical coherence tomography (OCT) has become a novel approach to noninvasive imaging in the past three decades, bringing a significant potential to biological research and medical biopsy in situ, particularly in three-dimensional (3D) in vivo conditions. Specifically, OCT systems using broad bandwidth sources, mainly centered at near-infrared-II, allow significantly higher imaging depth, as well as maintain a high-resolution and better signal-to-noise ratio than the traditional microscope, which avoids the scattering blur and thus obtains more details from delicate biological structures not just limited to the surface. Furthermore, OCT systems combined the spectrometer with novel light sources, such as multiplexed superluminescent diodes or ultra-broadband supercontinuum laser sources, to obtain sub-micron resolution imaging with high-speed achieve widespread clinical applications. Besides improving OCT performance, the functional extensions of OCT with other designs and instrumentations, taking polarization state or birefringence into account, have further improved OCT properties and functions. We summarized the conventional principle of OCT systems, including time-domain OCT, Fourier-domain OCT, and several typical OCT extensions, compared their different components and properties, and analyzed factors that affect OCT performance. We also reviewed current applications of OCT in the biomedical field, especially in hearing science, discussed existing limitations and challenges, and looked forward to future development, which may provide a guideline for those with 3D in vivo imaging desires.
Introduction
Optical coherence tomography (OCT), first proposed by David in 1991, is a novel three-dimensional (3D) imaging technology with noninvasive, high-resolution, and low-cost characteristics, which can perform high-definition cross-sectional imaging of the biological tissue in situ by measuring the reflected light signal, especially for transparent or translucent samples [1]. During 30 years of development, ultrahigh-resolution OCT using the broad-bandwidth femtosecond laser technology obtained an axial resolution of 1
New imaging technologies have promoted imaging and diagnosis of pathologic conditions [10–13]. Improving imaging performance allows more details in lesions to be discovered, thus making early diagnosis and treatment. OCT has many advantages over the commonly used medical imaging equipment such as magnetic resonance imaging (MRI), computed tomography (CT), and others, as summarized in Table 1.
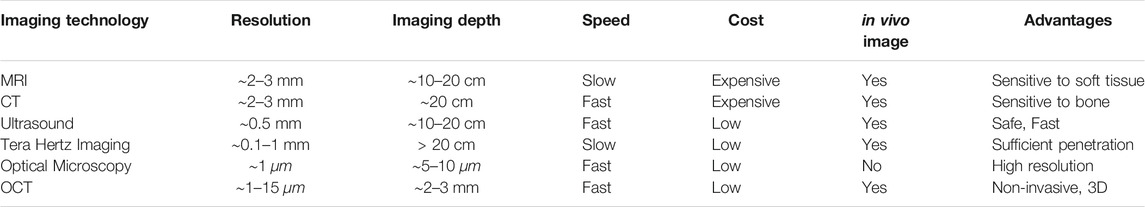
TABLE 1. The performance comparison of different medical imaging methods.
The signal of the OCT system depends on the reflected characteristics of the sample structure. According to the detection method, OCT can be divided into time-domain OCT (TD-OCT) and Fourier-domain OCT (FD-OCT).
TD-OCT is the earliest OCT system based on the Michelson interferometer [1, 14]. Figure 1A shows that the light from the low-coherence light source is split into a sample arm and a reference arm via a beam splitter. By coupling the sample arm reflected from the sample with the reference arm, which has a fixed optical path, one can obtain the interference pattern of the two beams [10]. TD-OCT relies on the movement of the reference mirror to obtain information of different depths of the sample. Therefore, acquiring depth information needs to move the reference mirror [10, 15], which dramatically limits the imaging speed of the system, thereby hindering the development and broad applications of the TD-OCT system.
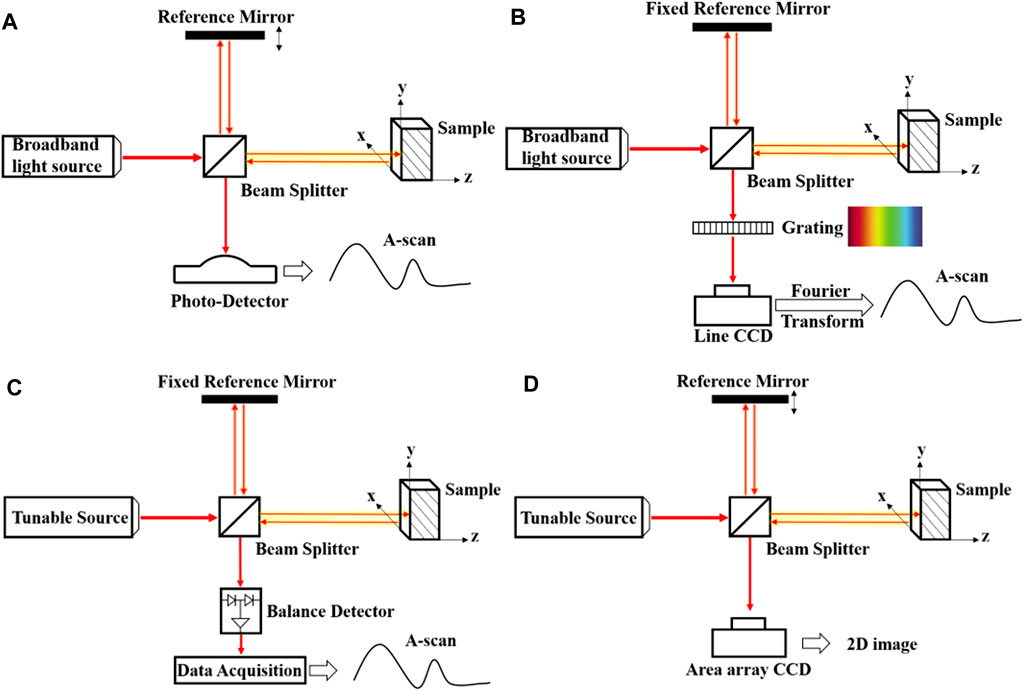
FIGURE 1. The Schematic diagrams of TD-OCT, SD-OCT, SS-OCT, and FF-OCT.
While FD-OCT obtains the image through Fourier transformation, which acquires the internal structure information in the sample's depth direction synchronously, thus improving the imaging speed significantly [15, 16]. FD-OCT can be divided into spectral-domain OCT (SD-OCT) and swept-source OCT according to types of the light source as shown in Figures 1B,C. The light source used in the SD-OCT system is the same as that in the TD-OCT. Nevertheless, as all the components in this system are unmovable, it has higher mechanical stability and a lower noise ratio. Compared with the SD-OCT, the swept-source OCT uses a swept laser light source and photodetector, quickly generating the interferogram. In general, FD-OCT has high imaging speed and high sensitivity, making it more suitable for commercial applications.
Besides, the full-field OCT (FF-OCT) shown in Figure 1D is composed of incoherence light source and area array camera, which can not only obtain submicrometer spatial resolution and millisecond temporal resolution but also realize imaging of the tiny structure in a large field of view [17], which has potential in noninvasive medical diagnosis and imaging of dynamic biological tissues in vivo, such as cancer cell [18], human skin [19] and eye diseases. It can also achieve non-destructive testing and high-precision measurement, such as analyzing the internal structure of pearls [20]. The Fourier-domain FF-OCT is based on a tunable laser source, and the fast camera is a fast volumetric imaging technology (17) that effectively avoids motion artifacts during imaging. In 2010, full-field optical coherence microscopy with 0.8
In addition, OCT has various extensions aiming to assess functional aspects of the tissue besides general imaging. For example, Doppler OCT can visualize blood vessels and estimate the velocity of blood fleeting [22, 23], which is achieved through distinguishing the different OCT signals induced by flowing cells and stationary tissue without staining [24, 25]. Other extensions, such as polarization-sensitive OCT and phase-sensitive OCT, have also been used in higher spatial resolution structural imaging. Polarization-sensitive OCT takes polarization state and birefringence into account, supplying the extra imaging contrast [26–28]. Thus, polarization-sensitive OCT has the potential of high spatial resolution, which can display detailed structural information. In contrast, the phase-sensitive OCT is based on the high sensitivity to the phase difference between the sample arm and the reference arm [29], avoiding common-mode noise [30]. It is a powerful and potential technology with high sensitivity (26, 27), which can be used to measure the sample's motion.
Current commercial OCT systems with micron-level resolution and millimeter-level imaging depth play an essential role in biomedical fields such as ophthalmology, endoscopy, cardiovascular disease, and otology research [14, 31, 32]. Especially in fundus examination, OCT is the fastest 3D imaging technology [16, 33]. Furthermore, as a three-dimensional imaging instrument that can realize "optical biopsy", OCT has become a promising biomedical imaging technology [34].
Key Properties
The performance of OCT systems mainly depends on its resolution, imaging depth, and other parameters such as sensitivity and imaging speed. In addition, many factors need to be considered in clinical applications and biological tissue visualization, such as imaging contrast, biochemical information, system compactness, and user-friendliness [10].
Resolution
Compared with MRI and optical microscopy, OCT realizes high resolution while the axial resolution and transverse resolution of OCT depend on the different factors, as shown in Figure 2.
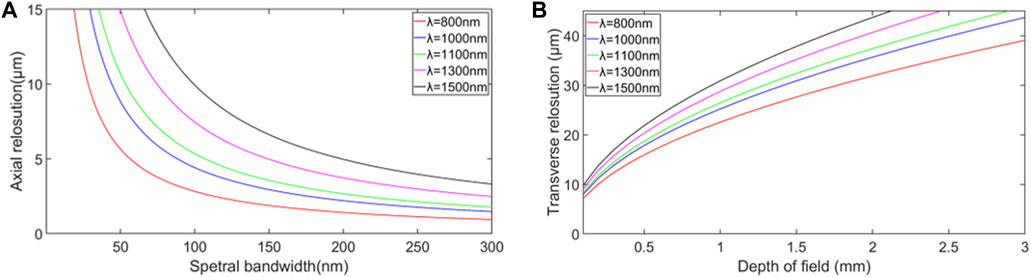
FIGURE 2. (A) Relationship between axial resolution and spectral bandwidth based on the Eq. 1. (B) Relationship between transverse resolution and depth of field for different central wavelengths of the optical source based on the Eq. 3.
Axial Resolution
The axial resolution,
where
The light source bandwidth is proportional to axial resolution according to Eq. 1, while the center wavelength is inversely proportional to axial resolution. In order to improve the axial resolution of OCT, one should increase the spectral bandwidth or decrease the center wavelength [35]. Therefore, ultrabroad bandwidth light source technology enables ultrahigh-resolution OCT in the near-infrared (NIR) wavelength region [32, 36]. Novel light sources such as ultrabroad bandwidth solid-state lasers and superluminescent diode have the advantage of providing broad bandwidth with sufficient output power, which is desired for high-resolution. Figure 3 shows that different retina layers can be clearly seen, demonstrating that OCT with higher axial resolution can obtain higher quality imaging results.
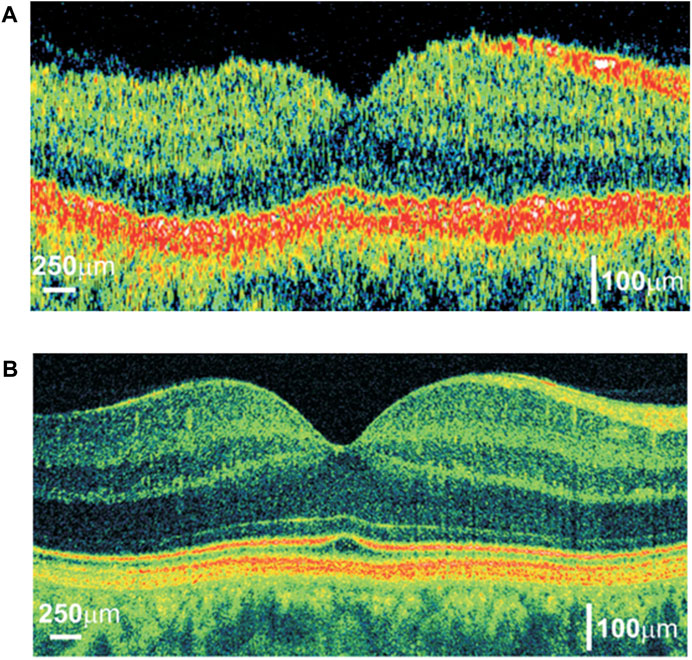
FIGURE 3. Comparison of OCT cross-sectional imaging of the human eye in vivo:(A) TD-OCT with an axial resolution of approximatcly 10 µm and speed allowing for acquiring 400 optical A-scans per second; (B) FD-OCT with an axial resolution equal to 2 µm and speed allowing for a measurement of 30,000 optical A-scans/s. Reprinted with permission from [31] © The Optical Society.
Transverse Resolution
The transverse resolution,
where
The numerical aperture (NA), an important optical parameter, is often used to measure the angle of light that the system can receive. As a high numerical aperture allows more light to enter the system, it is evident that high NA can give a high transverse resolution, implying a smaller focal spot size.
However, high NA will result in a shorter depth of field, limiting the scope of the precise imaging. The relationship between depth of field, b, and transverse resolution,
It can be seen from Eq. 3 that the depth of field is inversely proportional to the transverse resolution so that the transverse resolution and depth of field restrict each other. Using a dynamic focus tracking system may solve this problem [35]. Especially in real applications, we should consider the limitations under specific circumstances. Sometimes the objective lens with a smaller numerical aperture will be used to obtain a more significant depth of field.
Imaging Depth
Imaging depth plays a crucial role in many OCT applications, particularly in the biomedical field. In the TD-OCT system, the reference mirror position determines the imaging position, making the TD-OCT system able to image at any depth in the ideal case. However, the absorption and scattering of the sample limit the distance of the light path, so the imaging depth is also limited. Without considering the properties of an examined sample, the imaging depth of SD-OCT is determined by the center wavelength of the light source and the spectrometer’s resolution. As shown in Figure 4, the axial resolution of the OCT at 1.06 μm wavelength is better than that at 1.3 μm wavelength. The resolutions of the two OCTs are 11 and 16 μm, respectively. However, at the same imaging depth, OCT at 1.3 μm wavelength has better contrast, and the imaging edge is more obvious because OCT at 1.3 μm wavelength operates at a longer wavelength having higher penetration depth. It also needs to be noted that more noise and interference will be introduced as the depth increases. In theory, the maximum imaging depth,
where
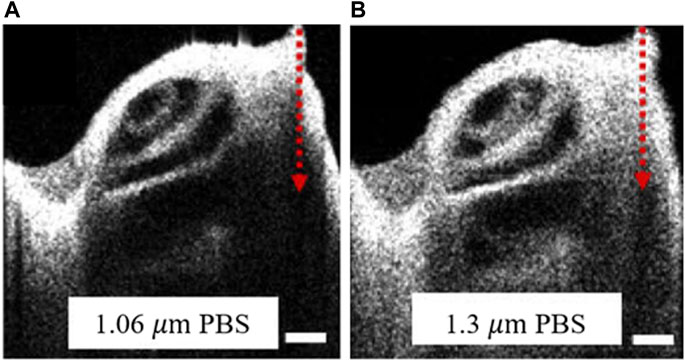
FIGURE 4. The cross-sectional images of the mouse cochlea from OCT with the different center wavelength. OCT centered at (A) 1.06 µm and (B) 1.3 µm. PBS indicated that the mouse cochlea samples were preserved in a phosphate-buffered saline solution. The red arrow represents the depth direction of the imaging. Scale bars: 250 µm. Modified with permission from [37] © The Optical Society.
While considering the properties of a sample, the absorption and scattering make it impossible to reach the theoretical value. Besides, the disordered scattered light will reduce the imaging contrast, system resolution, and imaging depth which causes a decline in image quality. In conclusion, the maximum imaging depth depends on the parameters of the OCT system and the absorption and scattering of the sample.
Detection Sensitivity
The sensitivity of the imaging system is also a crucial parameter in biomedical imaging [37]. Since the interferometry that OCT applies measures the distribution of the interference field rather than the intensity of light, the OCT system possesses high sensitivity compared with other optical imaging systems.
Sensitivity, S, is defined as the inverse minimal sample reflectivity in OCT [16], which can be expressed as
However, as imaging depth increases, the sensitivity of OCT also rolls off. It can be seen from Figure 4 that as the imaging depth increases, the contrast and sharpness of the images gradually deteriorate. Since the sensitivity of the two OCTs shown in Figure 4 is similar, the difference in imaging performance is mainly due to different wavelengths.
In addition, in SD-OCT, roll-off in the sensitivity is mainly due to the limitation of the number and size of CCD and other components that make up the spectrometer. These limitations cause signal distortion and limit imaging depth. Many attempts have been made to reduce the sensitivity roll-off. For instance, in 2020, a telecentric f-theta imaging lens was designed to decrease the roll-off, and the imaging depth was increased by 13% [38]. After that, David et al. used two reference arms to increase the sensitivity by 14 dB [39].
Imaging Speed
High imaging speed is a necessary condition for realizing 3D volumetric imaging. Initially, the imaging speed of the first TD-OCT is seconds/a B-scan [1], which is mainly limited by the motion of the reference mirror. Much work has been devoted to improve the delay light path and increase the speed of mechanical motion. Until the emergence of FD-OCT, the imaging speed of OCT became a qualitative leap since spectral information replaced mechanical movement. For FD-OCT with a single beam, the speed of SD-OCT is mainly determined by the imaging time of CCD or CMOS, while the speed of SS-OCT depends on the wavelength-tuning speed of swept sources [16]. In ophthalmology imaging, faster imaging speed can reduce motion artifacts caused by eye movements and thus obtain more explicit images. In Figure 3, the imaging speed of SD-OCT is 175 times that of TD-OCT. The improvement of SD-OCT imaging quality is due to the increase in axial resolution and imaging speed enhancement. The higher A-scan speed makes the edges of different retina layers smoother, and at the same time, reduces movement artifacts caused by eye movement during imaging. The improvement of laser tuning speed, the design of multi-beam path, and the parallel imaging methods have continuously improved the imaging speed of OCT, and the OCT system possessed A-Scan rate as “MHz-OCT” or “multi-MHz-OCT” has been produced [40].
Applications of Optical Coherence Tomography in the Biomedical Field
Optical Coherence Tomography in Ophthalmology
Glaucoma and age-related macular degeneration are the primary diseases that cause blindness [41]. It is crucial to study the vitreoretinal interface comprehensively and further improve our understanding of the pathogenesis and development of retinal diseases. The retinal nerve sensory layer from the outside to the inside is the rods, the cones, the outer limiting membrane layer, the outer nuclear layer, the outer plexiform layer, the inner nuclear layer, the inner plexiform layer, the ganglion cell layer, and the inner limiting membrane [42].
Different eye diseases affect the cells and functional layers in the retina [43]. Hence many diseases can be found from fundus examination. Fundus examinations usually use ophthalmoscopes with limited magnifications, which is insufficient for early observation of small lesions. However, OCT can obtain three-dimensional imaging of the sub-surface of the eyeball structure with the micron spatial resolution and with millisecond time resolution [41, 44], which can observe the pathological alterations of the ocular fundus and provide supplemental information to monitor the progress of the disease accurately and further understanding of the blindness. There is no doubt that ophthalmology is the most widely used application of OCT. OCT has been a standard detection tool in ophthalmology clinics and significantly improves the potential of early diagnosis, monitoring, and precise treatment [33, 45]. The representative OCT image of the mouse retina is shown in Figure 5A, which indicates that OCT can image the layers of the retina clearly, thereby providing corresponding structural information for retinal diseases.
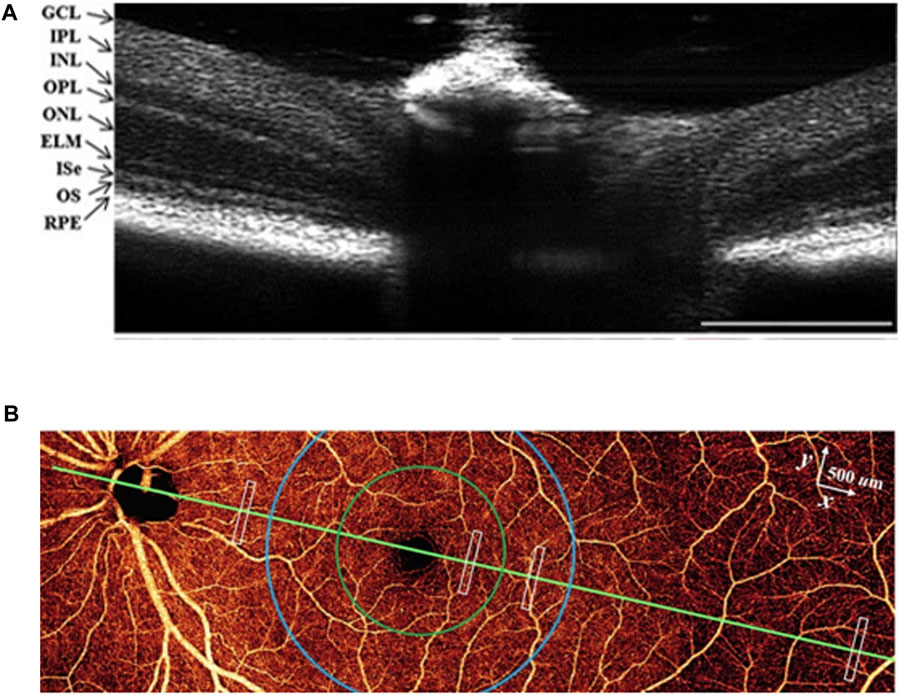
FIGURE 5. (A) OCT image of the mouse retina. Reprinted with permission from Ref [47] © Wiley. GCL, ganglion cell layer; IPL, inner plexiform layer; INL, inner nuclear layer: OPL, outer plexiform layer; ONL, outer nuclear layer: ELM, external limiting membrance; Ise, inner segment ellipsoid: OS, outer segment; RPE, retinal pigment epithelium. (B) en face OCTA of the inner retina. Modified with permission from Ref [48] © Springer Nature.
In addition, the extensions of optical coherence tomography angiography (OCTA) also play an important role in visualizing blood flow, as shown in Figure 5B. It is possible to observe the capillaries of the retina and choroid non-invasively, thus acquiring the location, shape, and structure of the diseased blood vessel and evaluating the velocity of blood flow to understand the progress of the disease in depth [46, 47]. The commonly used clinical imaging method of ocular blood circulation is fundus fluorescence angiography. However, this method requires the injection of a fluorescent agent and can only obtain two-dimensional images, which is inferior to OCTA in image resolution, safety, and imaging depth [48, 49]. The angiography results obtained from OCTA have a higher pixel density and fewer motion artifacts and can also measure blood oxygen or provide information about neurological diseases [50, 51]. Besides, OCT can provide more comprehensive imaging and then get the oxygen metabolism of biological tissues combined with multi-spectral polarizing film dispersion while obtaining molecular level biochemical information with Raman spectroscopy [52, 53].
With the development of ultra-broadband laser sources and high-speed detection technology, the ophthalmic OCT system performance has been improved significantly, bringing the potential to 3D noninvasive optical biopsy of the retina in vivo. The morphology in situ obtained by the OCT system is close to the resolution of histopathology [54]. The significant improvement of axial resolution and imaging speed enables three-dimensional high-resolution imaging of the retina and makes it possible to quantify the volume of pathological changes in the retina [31]. Fourier-domain FF-OCT has recently replaced traditional OCT and becomes a powerful tool for ophthalmic imaging due to the highest imaging speed and its capability to avoid motion artifacts and risks in vivo [55]. Moreover, a combination of OCT and hyperspectral imaging allows obtaining the spectral information of oxygen saturation and hemoglobin while acquiring the tissue morphological characteristics [56]. The ability to obtain vascular morphology and functional characteristics is of great significance to clinical applications. Furthermore, the emergence of machine learning makes the automatic processing of images become a reality that can quickly obtain adequate information and make a diagnosis [57, 58].
Optical Coherence Tomography in Otology
It is complex progress to convert sound into hearing perception. The sound energy propagates in the cochlea as a traveling wave [59], and the cochlea amplifies low-level sound in a nonlinear active way. The measurement of the progress of sound conduction makes it possible for researchers to have a deep understanding of hearing. However, the vibration inside the inner ear (the cochlea) is still not fully understood. Thus, the following contents mainly introduce the applications of OCT in the inner ear, especially in the cochlea. Moreover, the challenge is to measure nanometer-scale motion in a wide frequency range through the complicated cochlear fine structure [60].
Before the widespread use of OCT, the primary technologies for detecting the cochlea are microscopy, MRI, and CT, but each technique has its drawback. Microscopy, which was initially used to observe the movement in the cochlea, can provide high spatial and temporal resolution. However, the most significant limitation of the microscope is that the imaging depth is insufficient, so it is mainly used to observe the surface and cannot image the cochlea in vivo. Although MRI and CT have great imaging depth and have become standard diagnostic equipment, proving an excellent diagnostic tool for brain, liver, kidney, other solid organs, heart, and large blood vessels, the lack of spatial resolution hinders its application in measuring the cochlear micromechanics. Thus, to study the cochlea deeply, the imaging method requires high-resolution and enough imaging depth. OCT has a micron-level resolution, millimeter-level imaging depth, low cost, and safety, making it an effective method for studying cochlear micromechanics.
Currently, the application of OCT on the cochlea mainly includes three aspects: structural imaging, angiography, and vibration measurement. The first application of OCT on the cochlea was performed in 2007, which acquired images and vibration measurements of the organ of Corti (OoC) of the guinea pig in vivo [61]. Following researches also obtained the cochlear images in mice through this approach [62]. The utility of OCT breaks through the limitation that the laser interferometer can only measure the basal region of the cochlea, which can easily obtain two-dimensional images of each turn of the cochlea and reconstruct the three-dimensional structure images [63, 64]. However, due to the resolution limitation, the internal structure of the organ of Corti cannot be imaged clearly. In recent research, a micro-optical coherence tomography (μOCT) with a high axial resolution of 1 μm obtained from an ultra-broadband supercontinuum laser source was shown to provide subcellular details of the guinea pig cochlea, such as scala tympani, basilar membrane, and other structures or OoC. It proves that the μOCT can distinguish the microstructure of the mammalian cochlea [65], as shown in Figure 6A. Considering the bone of the cochlear capsule, the external auditory canal, and other structures have to be removed during the imaging process, which inevitably causes a certain degree of damage. Therefore, this imaging method is only used to observe the isolated human cochlea [66] and has not yet been applied in living humans. At the same time, it may be used to avoid residual hearing loss during cochlea implant (CI) insertion [67] and may provide real-time 3D images in the future.
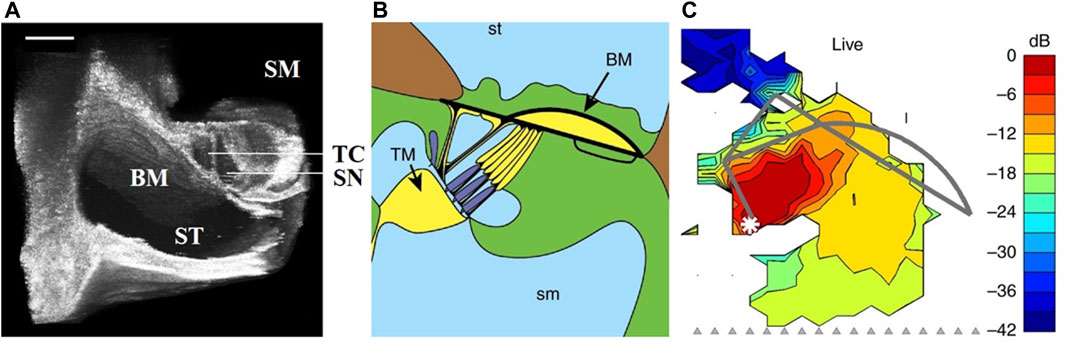
FIGURE 6. (A) 3D volumetrically reconstructed µOCT image of the organ of Corti of the guinea pig in situ. Modified with permission from [66] © Springer Nature. BM, basilar membrance; ST, scala tympani; SM, scala media; TC, tunnel of Corti; SN, space of Nuel. Scales = 100 µm. (B,C) The anatomical structures of Corti and the maps of vibration magnitudes under 65 dB SPL stimulus. Modified with permission from [75] © Springer Nature.
OCT angiography (OCTA), a functional extension of general OCT, enable the three-dimensional visualization of the cochlear blood flow by distinguishing the OCT signals of moving red blood cells and static organization without dye, which is significant to the prevention and treatment of many diseases in otology, such as insufficient or abnormal blood supply in the cochlea [68, 69]. Laser Doppler flowmetry (LDF), based on the Doppler principle, is already diagnostic equipment commonly used in modern medicine, while the spatial resolution is limited [70]. Compared with LDF, OCTA possessed a high-resolution is capable of imaging the capillaries of the cochlea.
In addition to the above two applications, OCT can obtain the vibration characteristics at all the cochlea turns and accurately measure the vibration of different structures, such as OHCs, Deiters’ cell regions, tectorial membrane, and the reticular lamina. Compared with a laser doppler vibrometer, OCT can observe the cochlea through the round window membrane, avoiding the placement of the reflective beads. The measurement results of cochlear vibration are shown in Figures 6B,C where (B) is a schematic diagram of Corti, and (C) is the vibration map obtained under 65 dB SPL multi-tone stimulus. We can draw the following conclusions from Figure 6. Firstly, OCT can measure the map of vibration magnitudes; secondly, it was evident that different structures have different amplitudes for the same sound intensity, which implies the sound-evoked motion. The results of other research are as follows. The frequency tuning at the base is sharper than that at the apex [64, 71, 72], and different structures of the OoC have different amplitudes, and phases [73–75], which indicates that the mechanical response of OoC has a transition along the length of the cochlea and the cochlear mechanical response varies with frequency and sound pressure. When measuring the insensitive cochlea, the amplitude increases almost linearly with the intensity of the stimulus, and the different structures of the OoC almost have the same amplitude [76, 77]. However, OCT cannot be highly reliable for the measurement results under very low sound pressure, such as below 20 dB SPL, due to the instrument noise, in which case the signal and the noise threshold are almost at the same order magnitude.
Although OCT is a powerful tool for studying the hearing mechanism, current research is mainly for animals since the cochlea in vivo imaging or vibration measurement will inevitably cause damage. Therefore, further developments will be needed for research or diagnosis of the living human cochlea. In addition, the high resolution and sufficient imaging depth, both limited by the central wavelength, are difficult to meet simultaneously. A recent study that used OCT with center wavelengths at 1,060 nm and 1,300 nm was carried out to explore better wavelengths for cochlear imaging based on contrast and attenuation. It was concluded that 1,060 nm is better for high contrast and enough imaging depth [78]. However, when observing the living cochlea, anatomical conditions and the influence of lymph fluid need to be considered. At this time, a light source with a center wavelength of 1,060 nm may not provide sufficient imaging depth. Moreover, anesthesia also affects the cochlear response, which is confirmed by many current studies. Thus, there is still a long way to go for a thorough understanding of the cochlear response.
Endoscopy Optical Coherence Tomography
Endoscope combined with OCT, another widespread application of OCT, has become an essential tool for in vivo imaging of internal organs. Endoscopic imaging creates the possibility to obtain information from places where are hard to study using traditional methods. In contrast, endoscopic optical coherence tomography (EOCT) can penetrate deeper into the tissue for high-resolution images of the microstructure, such as colon polyps, lung cancer [79]. Another prominent application area of EOCT is biopsy guidance with probe [80]. Thus, EOCT plays a crucial role in detecting, diagnosing, and monitoring organ diseases and provides a guideline for doctors during diagnosis and surgery (77, 78), which can accurately locate the pathological tissue that needs to be detected and distinguish the normal and abnormal physiological structure.
The central wavelength of EOCT used clinically is generally 1,300 nm with an imaging depth between 1 and 2.5 mm, suitable for evaluating the superficial tissue. However, to break the resolution limitation on EOCT and achieve ultrahigh-resolution OCT, the light source centered at 800 nm is better [81, 82]. Furthermore, incorporating the ultrahigh-resolution OCT with a gradient-index (GRIN)-lens micro-endoscope enables visualization at the cellular scale deep in living tissue [83], which is expected to study the development process of specific diseases in vivo and increase clinical applications.
Optical Coherence Tomography in Dermatology
OCT was first introduced into dermatology in 1997 by Welzel et al., who used this technique to image human skin. Skin biopsy and histopathological examination are the gold standards for detecting skin cancer [84, 85]. However, invasive biopsy and a high rate of “false positive” impede the early diagnosis of cancer [86, 87]. Compared with traditional detection methods, OCT with high-resolution can visually the epidermis, dermis-dermal junction (DEJ), dermis, hair follicles, sweat glands, and blood vessels, and other structures and show the morphological characteristics of the pathological structure in the skin [88], which is suitable for imaging the superficial layers of the skin.
Since skin is opaque, the beam will be scattered and absorbed in the propagation process, while the absorption is much smaller than the scattering at the near-infrared spectrum. Thus, commercial OCT used in dermatology always operates in the NIR region [89]. The new OCT system can better visualize the skin structure [90, 91]. It can diagnose different subtypes of skin cancer and accurately determine the tumor boundaries, which helps diagnose disease and clinical treatment detection.
Discussion
Over decades, OCT, as a novel 3D imaging method that is noninvasive and convenient, has been applied in many fields and has become a golden standard in retinal examination. However, the axial resolution, imaging depth, and imaging speed are the critical factors of OCT that limit its performance, as summarized above. In the development process, the performance of OCT has made a qualitative leap through updating the light source and spectral technology. However, there are still many problems in practical applications.
The axial resolution of OCT can reach micron level, and the full-field OCT reached 0.8 µm axial resolution almost 10 years ago [21], which is much better than ultrasound and nuclear magnetic resonance imaging. However, the current commercial OCT system still cannot fully meet imaging requirements, thus limits its application in more fields. For example, OCT can provide the structural image of the retina and observe fundus lesions that other methods cannot observe, but OCT cannot distinguish the tissues with similar reflectivities, such as vascular and fiber composition [33, 47]. Thus, OCT can only provide supplementary information for fundus examination but not replace microscopic imaging and fluorescence imaging [41]. In addition, while in otology, it is not easy to obtain the cellular-resolution image of the organ of Corti using OCT, which is crucial to understand the cochlear mechanism thoroughly. The restriction between axial resolution and imaging depth is the biggest problem that limits the application of OCT.
The axial resolution is determined by the center wavelength and the light source bandwidth from the theory. The high-resolution can be achieved by a short-wavelength or ultra-broad bandwidth light source. However, the short wavelength light sources will decrease the imaging depth, and the use of broad bandwidth light sources is relatively limited due to the technology, the cost, or other reasons. Besides, the absorption and scattering of the tissue also need to be taken into account. The absorption of tissue will change with the wavelength of the light source. The absorption increases gradually as the wavelength becomes longer in the visible light range, which means the water absorbs less light at short wavelengths, while in the near-infrared region, the situation is different [14], and there are several absorption peaks irregularly in NIR-II. With higher resolution and more specific spectral information than NIR, visible light OCT may be a promising imaging method in the future, and it can provide accurate information in observation. However, to compromise resolution and other limitations, the center wavelength of commercial OCT is mainly concentrated in NIR-II [49]. The innovation of OCT is closely related to the development of new light sources. The emergence of the femtosecond laser, supercontinuum light source, superluminescent diodes, and swept-source creates new opportunities for resolution improvement. The micro-OCT with supercontinuum light source can provide 1–2 μm spatial resolution both in the axial and lateral directions [92], which meet the requirements for imaging the fine structures but have not yet been commercialized. In 2020, a high resolution was achieved by converting monochromatic light into an extended light source without using dispersion compensation [93], which may improve the performance of FF-OCT. Furthermore, a recent study used a supercontinuum light source in the spectral range from 3,140 to 4,190
The imaging speed has been improved by the FD-OCT, which avoids mirror movements in the reference arm. Nevertheless, while using the OCT to obtain the retina examination, the movement of the eyeball will lead to motion artifacts which influence the imaging contrast [95-97], and the shorter time also can keep the sample to be tested in good condition in situ. At the same time, the faster OCT will have better performance in practical applications. The enhancement of the optical components can be realized by ameliorating the light source or the light path. A necessary condition for fast scanning is to use a powerful radiation source with a high signal-to-noise ratio. However, the safety of the light source also needs to be considered as high power can easily burn the retina and cause irreversible damage. Therefore, in addition to improving the performance of the components, the use of multi-beam optical paths can simultaneously increase the imaging speed and realize the rational use of optical power. Several designs based on the multi-beam scanning technique have improved imaging speed and achieved high power output more safely [80, 98]. Research in 2017 based on SS-OCT divided the light source into four beams according to the wavelength and focused the different beams at different depths using the beam with long-wavelength to image the deep tissues. It improved the resolution and speed and realized SNR improvement as great as 10 dB [97]. Besides, recent research demonstrated an eight-beam light OCT to scan the different cross-sections and obtained high speed and low loss closed to a single beam system [99].
In addition, the ability of image processing technology to improve OCT image quality should not be underestimated, which has been a central focus of the current research. On the one hand, the OCT system will inevitably introduce much noise during the imaging process, reducing the image contrast and failing to obtain the resolution in theory [37, 100]. With the development and improvement of digital image processing technology, algorithms such as Gaussian filtering, morphological expansion, and corrosion can preserve image features while simultaneously removing shot noise as much as possible to make the image more explicit. An algorithm that uses multilevel filtering and digital morphological processing can effectively remove shot noise and is suitable for OCT and ultrasound [101]. For OCTA, several algorithms can improve the signal contrast, such as phase variance, improved speckle contrast, and optical microangiography, and a recent study showed that the latter two methods have better robustness [102].
On the other hand, we also need to pay attention to computer-aided diagnosis, which is exceptionally significant for rapid and automated clinical diagnosis. Due to the high resolution of OCT, the images it gets usually have a larger volume, and it is difficult for doctors to judge the condition of the lesion accurately in a short time. However, computer-aided diagnosis has a much higher resolution than the human eye and can accurately analyze and judge the hidden information in the OCT image. Some segmentation algorithms such as Iowa Reference Algorithm could avoid the error caused by manual segmentation [103], thus achieving a more accurate diagnosis. With the continuous development of machine learning [54, 57], computer-aided diagnosis is expected to realize automatic image reading and change the diagnostic model of traditional medicine in the future, which can not only reduce the workload of doctors but also may alleviate the shortage of medical resources to a certain extent.
In clinical applications, the compactness, user-friendliness, and stability of the OCT system also need to be considered. The fiber-based OCT solves long-distance transmission while avoiding large incisions during surgery [104, 105]. However, other interferences can also be caused due to the absorption and scattering characteristics of the optical fiber, which may be reduced by several optical components such as the achromatic lens and sophisticated optical design. The OCT, as a noninvasive 3D imaging approach, is expected to provide real-time imaging in surgery and obtain high-definition imaging of specific organs or tissue.
Conclusion
As a high-resolution three-dimensional imaging technology, OCT has qualitatively changed the imaging performance in the biomedical field since its appearance, which has improved early diagnosis and monitoring of diseases and has broken through the previous limitations in many types of research. With the continuous improvement of optical system performance, OCT is expected to provide real-time 3D observation of biological tissues in situ with high-resolution, high imaging speed, low cost in more imaging fields.
Author Contributions
GN, SZ, PL, ZX YB contributed to the outline and substantial content, drafted and revised the manuscripts of important content. GN and SZ critically edited the manuscript. All authors approved the final version and agree to be responsible for all aspects of the work.
Funding
This work was supported by grants from the National Natural Science Foundation of China (81971698) and Beijing-Tianjin-Hebei Basic Research Cooperation Project (18JCZDJC45300).
Conflict of Interest
The authors declare that the research was conducted in the absence of any commercial or financial relationships that could be construed as a potential conflict of interest.
Publisher’s Note
All claims expressed in this article are solely those of the authors and do not necessarily represent those of their affiliated organizations, or those of the publisher, the editors and the reviewers. Any product that may be evaluated in this article, or claim that may be made by its manufacturer, is not guaranteed or endorsed by the publisher.
References
1. Huang D, Swanson E, Lin C, Schuman J, Stinson W, Chang W, et al. Optical Coherence Tomography. Science (1991) 254(5035):1178–81. doi:10.1126/science.1957169
2. Drexler W, Morgner U, Kärtner FX, Pitris C, Boppart SA, Li XD, et al. In Vivo ultrahigh-Resolution Optical Coherence Tomography. Opt Lett (1999) 24(17):1221–3. doi:10.1364/OL.24.001221
3. Zhang N, Wang C, Sun Z, Li Z, Xie L, Yan Y, et al. Detection of Latent Fingerprint Hidden beneath Adhesive Tape by Optical Coherence Tomography. Forensic Sci Int (2018) 287:81–7. doi:10.1016/j.forsciint.2018.03.030
4. de Freitas AZ, Ribeiro LAD, Neto ON, Sarkis JES, Siqueira AN. Optical-coherence-tomography-based Algorithm for Handwriting Forensic Analysis. In: B Jalali, and KI Kitayama, editors. Ai and Optical Data Sciences. Proceedings of SPIE. 11299; San Francisco, CA. Bellingham: Spie-Int Soc Optical Engineering (2020). doi:10.1117/12.2543356
5. Wang C, Zhang N, Sun Z, Li Z, Li Z, Xu X. Recovering Hidden Sub-Layers of Repainted Automotive Paint by 3D Optical Coherence Tomography. Aust J Forensic Sci (2019) 51(3):331–9. doi:10.1080/00450618.2017.1367418
6. Anna T, Shakher C, Singh Mehta D. Simultaneous Tomography and Topography of Silicon Integrated Circuits Using Full-Field Swept-Source Optical Coherence Tomography. J Opt A: Pure Appl Opt (2009) 11(4):045501. doi:10.1088/1464-4258/11/4/045501
7. Song G, Harding K. OCT for Industrial Applications. In: KG Harding, PS Huang, and T Yoshizawa, editors. Optical Metrology and Inspection for Industrial Applications Ii. Proceedings of SPIE; Beijing, China (2012). p. 8563. doi:10.1117/12.2000462
8. Zorin I, Gattinger P, Brandstetter M, Heise B. Dual-Band Infrared Optical Coherence Tomography Using a Single Supercontinuum Source. Opt Express (2020) 28(6):7858–74. doi:10.1364/oe.386398
9. Zorin I, Su R, Prylepa A, Kilgus J, Brandstetter M, Heise B. Mid-infrared Fourier-Domain Optical Coherence Tomography with a Pyroelectric Linear Array. Opt Express (2018) 26(25):33428–39. doi:10.1364/oe.26.033428
10. Drexler W. Ultrahigh-Resolution Optical Coherence Tomography. J Biomed Opt (2004) 9(1):47–74. doi:10.1117/1.1629679
11. Runge VM, Richter JK, Heverhagen JT. Speed in Clinical Magnetic Resonance. Invest Radiol (2017) 52(1):1–17. doi:10.1097/rli.0000000000000330
12. Holdsworth S, Bammer R. Magnetic Resonance Imaging Techniques: fMRI, DWI, and PWI. Semin Neurol (2008) 28(4):395–406. doi:10.1055/s-0028-1083697
13. Muller NL. Computed Tomography and Magnetic Resonance Imaging: Past, Present and Future. Eur Respir J Suppl (2002) 35:3s–12s. doi:10.1183/09031936.02.00248202
14. Fercher AF, Drexler W, Hitzenberger CK, Lasser T. Optical Coherence Tomography - Principles and Applications. Rep Prog Phys (2003) 66(2):239–303. doi:10.1088/0034-4885/66/2/204
15. Wang C, Kim J, Jin CT, Leong PHW, McEwan A. Near Infrared Spectroscopy in Optical Coherence Tomography. J near Infrared Spectrosc (2012) 20(1):237–47. doi:10.1255/jnirs.975
16. Drexler W, Liu M, Kumar A, Kamali T, Unterhuber A, Leitgeb RA. Optical Coherence Tomography Today: Speed, Contrast, and Multimodality. J Biomed Opt (2014) 19(7):071412. doi:10.1117/1.Jbo.19.7.071412
17. Scholler J, Groux K, Goureau O, Sahel J-A, Fink M, Reichman S, et al. Dynamic Full-Field Optical Coherence Tomography: 3D Live-Imaging of Retinal Organoids. Light Sci Appl (2020) 9(1):140. doi:10.1038/s41377-020-00375-8
18. Stremplewski P, Auksorius E, Wnuk P, Kozoń Ł, Garstecki P, Wojtkowski M. In Vivo Volumetric Imaging by Crosstalk-Free Full-Field OCT. Optica (2019) 6(5):608–17. doi:10.1364/optica.6.000608
19. Ogien J, Dubois A. A Compact High-Speed Full-Field Optical Coherence Microscope for High-Resolution In Vivo Skin Imaging. J Biophotonics (2019) 12(2):e201800208. doi:10.1002/jbio.201800208
20. Ju MJ, Lee SJ, Min EJ, Kim Y, Kim HY, Lee BH. Evaluating and Identifying Pearls and Their Nuclei by Using Optical Coherence Tomography. Opt Express (2010) 18(13):13468–77. doi:10.1364/OE.18.013468
21. Choi WJ, Jeon DI, Ahn S-G, Yoon J-H, Kim S, Lee BH. Full-Field Optical Coherence Microscopy for Identifying Live Cancer Cells by Quantitative Measurement of Refractive Index Distribution. Opt Express (2010) 18(22):23285–95. doi:10.1364/oe.18.023285
22. Leitgeb RA, Werkmeister RM, Blatter C, Schmetterer L. Doppler Optical Coherence Tomography. Prog Retin Eye Res (2014) 41:26–43. doi:10.1016/j.preteyeres.2014.03.004
23. Elahi S, Gu S, Thrane L, Rollins AM, Jenkins MW. Complex Regression Doppler Optical Coherence Tomography. J Biomed Opt (2018) 23(4):1. doi:10.1117/1.Jbo.23.4.046009
24. Bykov AV, Priezzhev AV, Lauri J, Myllylä R. Doppler OCT Imaging of Cytoplasm Shuttle Flow inPhysarum Polycephalum. J Biophoton (2009) 2(8-9):540–7. doi:10.1002/jbio.200910057
25. White BR, Pierce MC, Nassif N, Cense B, Park BH, Tearney GJ, et al. In Vivo Dynamic Human Retinal Blood Flow Imaging Using Ultra-High-Speed Spectral Domain Optical Doppler Tomography. Opt Express (2003) 11(25):3490–7. doi:10.1364/oe.11.003490
26. Beer F, Wartak A, Haindl R, Gröschl M, Baumann B, Pircher M, et al. Conical Scan Pattern for Enhanced Visualization of the Human Cornea Using Polarization-Sensitive OCT. Biomed Opt Express (2017) 8(6):2906–23. doi:10.1364/boe.8.002906
27. de Boer JF, Milner TE. Review of Polarization Sensitive Optical Coherence Tomography and Stokes Vector Determination. J Biomed Opt (2002) 7(3):359–71. doi:10.1117/1.1483879
28. de Boer JF, Milner TE, van Gemert MJC, Nelson JS. Two-Dimensional Birefringence Imaging in Biological Tissue by Polarization-Sensitive Optical Coherence Tomography. Opt Lett (1997) 22(12):934–6. doi:10.1364/ol.22.000934
29. Zhang Y, Dong B, Bai Y, Ye S, Lei Z, Zhou Y. Measurement of Depth-Resolved Thermal Deformation Distribution Using Phase-Contrast Spectral Optical Coherence Tomography. Opt Express (2015) 23(21):28067–75. doi:10.1364/oe.23.028067
30. Yan Y, Ding Z, Wang L, Wang C, Shen Y. High-Sensitive Quantitative Phase Imaging with Averaged Spectral Domain Phase Microscopy. Opt Commun (2013) 303:21–4. doi:10.1016/j.optcom.2013.04.015
31. Wojtkowski M. High-Speed Optical Coherence Tomography: Basics and Applications. Appl Opt (2010) 49(16):D30–D61. doi:10.1364/ao.49.000d30
32. Ramamoorthy S, Zhang Y, Petrie T, Fridberger A, Ren T, Wang R, et al. Minimally Invasive Surgical Method to Detect Sound Processing in the Cochlear apex by Optical Coherence Tomography. J Biomed Opt (2016) 21(2):025003. doi:10.1117/1.Jbo.21.2.025003
33. Auksorius E, Borycki D, Stremplewski P, Liżewski K, Tomczewski S, Niedźwiedziuk P, et al. In Vivo imaging of the Human Cornea with High-Speed and High-Resolution Fourier-Domain Full-Field Optical Coherence Tomography. Biomed Opt Express (2020) 11(5):2849–65. doi:10.1364/boe.393801
34. Maciel MJ, Rosa CC, Wolffenbuttel RF, Correia JH. Optical Coherence Tomography within a Single Microsystem. J Phys D: Appl Phys (2018) 51(36):365401. doi:10.1088/1361-6463/aad4b4
35. Drexler W. Optical Coherence Tomography: Technology and Applications. In: 2013 Conference on Lasers & Electro-Optics Europe & International Quantum Electronics Conference CLEO EUROPE/IQEC; Munich, Germany. IEEE (2013).
36. Unterhuber A, Pova ay B, Bizheva K, Hermann B, Sattmann H, Stingl A, et al. Advances in Broad Bandwidth Light Sources for Ultrahigh Resolution Optical Coherence Tomography. Phys Med Biol (2004) 49(7):1235–46. doi:10.1088/0031-9155/49/7/011
37. Tsai T-Y, Chen T-H, Chen H-C, Chueh C-B, Huang Y-P, Hung Y-P, et al. Quantitative Spectroscopic Comparison of the Optical Properties of Mouse Cochlea Microstructures Using Optical Coherence Tomography at 106 Μm and 13 Μm Wavelengths. Biomed Opt Express (2021) 12(4):2339–52. doi:10.1364/boe.419378
38. Choma M, Sarunic M, Yang C, Izatt J. Sensitivity Advantage of Swept Source and Fourier Domain Optical Coherence Tomography. Opt Express (2003) 11(18):2183–9. doi:10.1364/oe.11.002183
39. Lee SS, Song W, Choi ES. Spectral Domain Optical Coherence Tomography Imaging Performance Improvement Based on Field Curvature Aberration-Corrected Spectrometer. Appl Sci (2020) 10(10):3657. doi:10.3390/app10103657
40. Otuya DO, Verma Y, Luu R, Farrrokhi H, Tearney GJ. Improved Sensitivity Roll-Off in Dual Reference, Buffered Spectral-Domain Optical Coherence Tomography. J Biomed Opt (2021) 26(2):12. doi:10.1117/1.Jbo.26.2.025001
41. Klein T, Huber R. High-Speed OCT Light Sources and Systems [Invited]. Biomed Opt Express (2017) 8(2):828–59. doi:10.1364/boe.8.000828
42. Burgos Blasco B, Güemes Villahoz N, Rego Lorca D, Fernández-Vigo JI. Angiografía por tomografía de coherencia óptica en el diagnóstico del síndrome de Susac. Archivos de la Sociedad Española de Oftalmología (2020) 95(8):e62–e63. doi:10.1016/j.oftal.2020.03.007
43. Kolb H, Fernandez E, Nelson R. The Organization of the Retina and Visual System. In: H Kolb, E Fernandez, and R Nelson, editors. Webvision: The Organization of the Retina and Visual System. Salt Lake City (UT): University of Utah Health Sciences Center Copyright: © 2021 Webvision (1995).
44. Yao X, Son T, Kim TH, Lu Y. Functional Optical Coherence Tomography of Retinal Photoreceptors. Exp Biol Med (Maywood) (2018) 243(17-18):1256–64. doi:10.1177/1535370218816517
45. Yip H, Chan E. Optical Coherence Tomography Imaging in Keratoconus. Clin Exp Optom (2019) 102(3):218–23. doi:10.1111/cxo.12874
46. Wojtkowski M, Leitgeb R, Kowalczyk A, Bajraszewski T, Fercher AF. In Vivo human Retinal Imaging by Fourier Domain Optical Coherence Tomography. J Biomed Opt (2002) 7(3):457–63. doi:10.1117/1.1482379
47. Son T, Alam M, Toslak D, Wang B, Lu Y, Yao X. Functional Optical Coherence Tomography of Neurovascular Coupling Interactions in the Retina. J Biophotonics (2018) 11(12):e201800089. doi:10.1002/jbio.201800089
48. Campbell JP, Zhang M, Hwang TS, Bailey ST, Wilson DJ, Jia Y, et al. Detailed Vascular Anatomy of the Human Retina by Projection-Resolved Optical Coherence Tomography Angiography. Sci Rep (2017) 7:42201. doi:10.1038/srep42201
49. Mahdjoubi A, Bousnina Y, Barrande G, Bensmaine F, Chahed S, Ghezzaz A. Features of Cotton Wool Spots in Diabetic Retinopathy: A Spectral-Domain Optical Coherence Tomography Angiography Study. Int Ophthalmol (2020) 40(7):1625–40. doi:10.1007/s10792-020-01330-7
50. Lee H-J, Samiudin NM, Lee TG, Doh I, Lee S-W. Retina Phantom for the Evaluation of Optical Coherence Tomography Angiography Based on Microfluidic Channels. Biomed Opt Express (2019) 10(11):5535–48. doi:10.1364/boe.10.005535
51. Liu W, Li H, Shah RS, Shu X, Linsenmeier RA, Fawzi AA, et al. Simultaneous Optical Coherence Tomography Angiography and Fluorescein Angiography in Rodents with normal Retina and Laser-Induced Choroidal Neovascularization. Opt Lett (2015) 40(24):5782–5. doi:10.1364/ol.40.005782
52. Shu X, Liu W, Duan L, Zhang HF. Spectroscopic Doppler Analysis for Visible-Light Optical Coherence Tomography. J Biomed Opt (2017) 22(12):1. doi:10.1117/1.Jbo.22.12.121702
53. Liu X, Liu T, Wen R, Li Y, Puliafito CA, Zhang HF, et al. Optical Coherence Photoacoustic Microscopy for In Vivo Multimodal Retinal Imaging. Opt Lett (2015) 40(7):1370–3. doi:10.1364/ol.40.001370
54. Evans JW, Zawadzki RJ, Liu R, Chan JW, Lane SM, Werner JS. Optical Coherence Tomography and Raman Spectroscopy of the Ex-Vivo Retina. J Biophoton (2009) 2(6-7):398–406. doi:10.1002/jbio.200910022
55. Lu D, Heisler M, Lee S, Ding GW, Navajas E, Sarunic MV, et al. Deep-Learning Based Multiclass Retinal Fluid Segmentation and Detection in Optical Coherence Tomography Images Using a Fully Convolutional Neural Network. Med Image Anal (2019) 54:100–10. doi:10.1016/j.media.2019.02.011
56. Auksorius E, Borycki D, Wojtkowski M. Multimode Fiber Enables Control of Spatial Coherence in Fourier-Domain Full-Field Optical Coherence Tomography for In Vivo Corneal Imaging. Opt Lett (2021) 46(6):1413–6. doi:10.1364/OL.417178
57. Kim T-H, Le D, Son T, Yao X. Vascular Morphology and Blood Flow Signatures for Differential Artery-Vein Analysis in Optical Coherence Tomography of the Retina. Biomed Opt Express (2021) 12(1):367–79. doi:10.1364/BOE.413149
58. Asaoka R, Murata H, Hirasawa K, Fujino Y, Matsuura M, Miki A, et al. Using Deep Learning and Transfer Learning to Accurately Diagnose Early-Onset Glaucoma from Macular Optical Coherence Tomography Images. Am J Ophthalmol (2019) 198:136–45. doi:10.1016/j.ajo.2018.10.007
59. Ang M, Tan ACS, Cheung CMG, Keane PA, Dolz-Marco R, Sng CCA, et al. Optical Coherence Tomography Angiography: a Review of Current and Future Clinical Applications. Graefes Arch Clin Exp Ophthalmol (2018) 256(2):237–45. doi:10.1007/s00417-017-3896-2
60. von Békésy G. Some Biophysical Experiments from Fifty Years Ago. Annu Rev Physiol (1974) 36:1–18. doi:10.1146/annurev.ph.36.030174.000245
61. Olson ES, Strimbu CE. Cochlear Mechanics: New Insights from Vibrometry and Optical Coherence Tomography. Curr Opin Physiol (2020) 18:56–62. doi:10.1016/j.cophys.2020.08.022
62. Chen F, Choudhury N, Zheng J, Matthews S, Nutall AL, Jacques SL. In Vivo imaging and Low-Coherence Interferometry of Organ of Corti Vibration. J Biomed Opt (2007) 12(2):021006. doi:10.1117/1.2717134
63. Gao SS, Wang R, Raphael PD, Moayedi Y, Groves AK, Zuo J, et al. Vibration of the Organ of Corti within the Cochlear apex in Mice. J Neurophysiol (2014) 112(5):1192–204. doi:10.1152/jn.00306.2014
64. Lee HY, Raphael PD, Park J, Ellerbee AK, Applegate BE, Oghalai JS. Noninvasive In Vivo Imaging Reveals Differences between Tectorial Membrane and Basilar Membrane Traveling Waves in the Mouse Cochlea. Proc Natl Acad Sci USA (2015) 112(10):3128–33. doi:10.1073/pnas.1500038112
65. Dong W, Xia A, Raphael PD, Puria S, Applegate B, Oghalai JS. Organ of Corti Vibration within the Intact Gerbil Cochlea Measured by Volumetric Optical Coherence Tomography and Vibrometry. J Neurophysiol (2018) 120(6):2847–57. doi:10.1152/jn.00702.2017
66. Iyer JS, Batts SA, Chu KK, Sahin MI, Leung HM, Tearney GJ, et al. Micro-Optical Coherence Tomography of the Mammalian Cochlea. Sci Rep (2016) 6:33288. doi:10.1038/srep33288
67. Starovoyt A, Putzeys T, Wouters J, Verhaert N. High-Resolution Imaging of the Human Cochlea through the Round Window by Means of Optical Coherence Tomography. Sci Rep (2019) 9:14271. doi:10.1038/s41598-019-50727-7
68. Burwood GWS, Fridberger A, Wang RK, Nuttall AL. Revealing the Morphology and Function of the Cochlea and Middle Ear with Optical Coherence Tomography. Quant Imaging Med Surg (2019) 9(5):858–81. doi:10.21037/qims.2019.05.10
69. Dziennis S, Reif R, Zhi Z, Nuttall AL, Wang RK. Effects of Hypoxia on Cochlear Blood Flow in Mice Evaluated Using Doppler Optical Microangiography. J Biomed Opt (2012) 17(10):1060031. doi:10.1117/1.Jbo.17.10.106003
70. Reif R, Qin J, Shi L, Dziennis S, Zhi Z, Nuttall AL, et al. Monitoring Hypoxia Induced Changes in Cochlear Blood Flow and Hemoglobin Concentration Using a Combined Dual-Wavelength Laser Speckle Contrast Imaging and Doppler Optical Microangiography System. Plos One (2012) 7(12):e52041. doi:10.1371/journal.pone.0052041
71. Reif R, Zhi Z, Dziennis S, Nuttall AL, Wang RK. Changes in Cochlear Blood Flow in Mice Due to Loud Sound Exposure Measured with Doppler Optical Microangiography and Laser Doppler Flowmetry. Quant Imaging Med Surg (2013) 3(5):235–42. doi:10.3978/j.issn.2223-4292.2013.10.02
72. Recio-Spinoso A, Oghalai JS. Mechanical Tuning and Amplification within the apex of the guinea Pig Cochlea. J Physiol (2017) 595(13):4549–61. doi:10.1113/jp273881
73. Gao SS, Raphael PD, Wang R, Park J, Xia A, Applegate BE, et al. In Vivo vibrometry Inside the Apex of the Mouse Cochlea Using Spectral Domain Optical Coherence Tomography. Biomed Opt Express (2013) 4(2):230–40. doi:10.1364/boe.4.000230
74. Lee HY, Raphael PD, Xia A, Kim J, Grillet N, Applegate BE, et al. Two-Dimensional Cochlear Micromechanics Measured In Vivo Demonstrate Radial Tuning within the Mouse Organ of Corti. J Neurosci (2016) 36(31):8160–73. doi:10.1523/jneurosci.1157-16.2016
75. Cooper NP, Vavakou A, van der Heijden M. Vibration Hotspots Reveal Longitudinal Funneling of Sound-Evoked Motion in the Mammalian Cochlea. Nat Commun (2018) 9:3054. doi:10.1038/s41467-018-05483-z
76. Dewey JB, Applegate BE, Oghalai JS. Amplification and Suppression of Traveling Waves along the Mouse Organ of Corti: Evidence for Spatial Variation in the Longitudinal Coupling of Outer Hair Cell-Generated Forces. J Neurosci (2019) 39(10):1805–16. doi:10.1523/jneurosci.2608-18.2019
77. He W, Kemp D, Ren T. Timing of the Reticular Lamina and Basilar Membrane Vibration in Living Gerbil Cochleae. Elife (2018) 7:e37625. doi:10.7554/eLife.37625
78. Ren T, He W, Kemp D. Reticular Lamina and Basilar Membrane Vibrations in Living Mouse Cochleae. Proc Natl Acad Sci USA (2016) 113(35):9910–5. doi:10.1073/pnas.1607428113
79. Wurster LM, Ginner L, Kumar A, Salas M, Wartak A, Leitgeb RA. Endoscopic Optical Coherence Tomography with a Flexible Fiber Bundle. J Biomed Opt (2018) 23(6):1. doi:10.1117/1.Jbo.23.6.066001
80. Latrive A, Boccara AC. In Vivo and In Situ Cellular Imaging Full-Field Optical Coherence Tomography with a Rigid Endoscopic Probe. Biomed Opt Express (2011) 2(10):2897–904. doi:10.1364/boe.2.002897
81. Pahlevaninezhad H, Khorasaninejad M, Huang Y-W, Shi Z, Hariri LP, Adams DC, et al. Nano-Optic Endoscope for High-Resolution Optical Coherence Tomography In Vivo. Nat Photon (2018) 12(9):540–7. doi:10.1038/s41566-018-0224-2
82. Gora MJ, Suter MJ, Tearney GJ, Li X. Endoscopic Optical Coherence Tomography: Technologies and Clinical Applications [Invited]. Biomed Opt Express (2017) 8(5):2405–44. doi:10.1364/boe.8.002405
83. Fang Q, Curatolo A, Wijesinghe P, Yeow YL, Hamzah J, Noble PB, et al. Ultrahigh-Resolution Optical Coherence Elastography through a Micro-Endoscope: Towards In Vivo Imaging of Cellular-Scale Mechanics. Biomed Opt Express (2017) 8(11):5127–38. doi:10.1364/boe.8.005127
84. Reddy N, Nguyen BT. The Utility of Optical Coherence Tomography for Diagnosis of Basal Cell Carcinoma: A Quantitative Review. Br J Dermatol (2019) 180(3):475–83. doi:10.1111/bjd.17201
85. Zhou W, Chen Z, Yang S, Xing D. Optical Biopsy Approach to Basal Cell Carcinoma and Melanoma Based on All-Optically Integrated Photoacoustic and Optical Coherence Tomography. Opt Lett (2017) 42(11):2145–8. doi:10.1364/ol.42.002145
86. Holmes J, von Braunmühl T, Berking C, Sattler E, Ulrich M, Reinhold U, et al. Optical Coherence Tomography of Basal Cell Carcinoma: Influence of Location, Subtype, Observer Variability and Image Quality on Diagnostic Performance. Br J Dermatol (2018) 178(5):1102–10. doi:10.1111/bjd.16154
87.A Dubois, eds. High-Resolution Optical Coherence Tomography Application in Dermatology. Imaging and Applied Optics 2019 (COSI, IS, MATH, pcAOP). Munich: Optical Society of America (2019).
88. Liu M, Drexler W. Optical Coherence Tomography Angiography and Photoacoustic Imaging in Dermatology. Photochem Photobiol Sci (2019) 18(5):945–62. doi:10.1039/c8pp00471d
89. Boone M, Suppa M, Miyamoto M, Marneffe A, Jemec G, Del Marmol V. In Vivo assessment of Optical Properties of Basal Cell Carcinoma and Differentiation of BCC Subtypes by High-Definition Optical Coherence Tomography. Biomed Opt Express (2016) 7(6):2269–84. doi:10.1364/boe.7.002269
90. He Q, Liu T, Wang RK. Handheld Swept-Source Optical Coherence Tomography Guided by Smartphone-Enabled Wide-Field Autofluorescence Photography for Imaging Facial Sebaceous Glands. Opt Lett (2020) 45(20):5704–7. doi:10.1364/ol.405765
91. Zhao Y, Eldridge WJ, Maher JR, Kim S, Crose M, Ibrahim M, et al. Dual-Axis Optical Coherence Tomography for Deep Tissue Imaging. Opt Lett (2017) 42(12):2302–5. doi:10.1364/ol.42.002302
92. Ge X, Chen S, Chen S, Liu L. High Resolution Optical Coherence Tomography. J Lightwave Technol (2021) 39(12):3824–35. doi:10.1109/jlt.2021.3061606
93. Rubinoff I, Soetikno B, Miller DA, Rischall I, Fawzi A, Kuranov R, et al. Spectrally Dependent Roll-Off in Visible-Light Optical Coherence Tomography. Opt Lett (2020) 45(9):2680–3. doi:10.1364/OL.389240
94. Zorin I, Gattinger P, Prylepa A, Heise B. Time-Encoded Mid-infrared Fourier-Domain Optical Coherence Tomography. Opt Lett (2021) 46(17):4108–11. doi:10.1364/OL.434855
95. Shirazi MF, Brunner E, Laslandes M, Pollreisz A, Hitzenberger CK, Pircher M. Visualizing Human Photoreceptor and Retinal Pigment Epithelium Cell Mosaics in a Single Volume Scan Over an Extended Field of View with Adaptive Optics Optical Coherence Tomography. Biomed Opt Express (2020) 11(8):4520–35. doi:10.1364/boe.393906
96. Kang J, Feng P, Wei X, Lam EY, Tsia KK, Wong KKY. Ultrafast and Broadband Inertia-Free Swept Source for Optical Coherence Tomography. In: Asia Communications and Photonics Conference; Guangzhou, China. Guangzhou, Guangdong: Optical Society of America (2017).
97. Schulz-Hildebrandt H, Pfeiffer T, Eixmann T, Lohmann S, Ahrens M, Rehra J, et al. High-Speed Fiber Scanning Endoscope for Volumetric Multi-Megahertz Optical Coherence Tomography. Opt Lett (2018) 43(18):4386–9. doi:10.1364/ol.43.004386
98. Chen C, Cheng KHY, Jakubovic R, Jivraj J, Ramjist J, Deorajh R, et al. High Speed, Wide Velocity Dynamic Range Doppler Optical Coherence Tomography (Part V): Optimal Utilization of Multi-Beam Scanning for Doppler and Speckle Variance Microvascular Imaging. Opt Express (2017) 25(7):7761–77. doi:10.1364/oe.25.007761
99. Kim Y, Lippok N, Vakoc BJ. Multi-Beam OCT Imaging Based on an Integrated, Free-Space Interferometer. Biomed Opt Express (2021) 12(1):100–9. doi:10.1364/boe.408703
100. Koch E, Walther J, Cuevas M. Limits of Fourier Domain Doppler-OCT at High Velocities. Sensors Actuators A: Phys (2009) 156(1):8–13. doi:10.1016/j.sna.2009.01.022
101. Potlov AY, Frolov SV, Proskurin SG. An Algorithm for Speckle Noise Reduction in Endoscopic Optical Coherence Tomography Structural Imaging. In: EA Genina, and VV Tuchin, editors. Saratov Fall Meeting 2018: Optical and Nano-Technologies for Biology and Medicine. Proceedings of SPIE. 11065; Saratov, Russia. Bellingham: Spie-Int Soc Optical Engineering (2019). doi:10.1117/12.2523236
102. Dadkhah A, Paudel D, Jiao S. Comparative Study of Optical Coherence Tomography Angiography Algorithms for Rodent Retinal Imaging. Exp Biol Med (Maywood) (2021) 7:153537022110245. doi:10.1177/15353702211024572
103. Sun JQ, McGeehan B, Firn K, Irwin D, Grossman M, Ying GS, et al. Comparison of the Iowa Reference Algorithm to the Heidelberg Spectralis Optical Coherence Tomography Segmentation Algorithm. J Biophotonics (2020) 13(5):11. doi:10.1002/jbio.201960187
104. Walther J, Schnabel C, Ebert N, Baumann M, Koch E. 3D Handheld Endoscope for Optical Coherence Tomography of the Human Oral Mucosa In Vivo. In: M Wojtkowski, SA Boppart, and WY Oh, editors. Optical Coherence Imaging Techniques and Imaging in Scattering Media Ii. Proceedings of SPIE; Munich, Germany (2017). p. 10416.
Keywords: optical coherence tomography, noninvasive imaging, high-resolution, clinic application, hearing science
Citation: Zheng S, Bai Y, Xu Z, Liu P and Ni G (2021) Optical Coherence Tomography for Three-Dimensional Imaging in the Biomedical Field: A Review. Front. Phys. 9:744346. doi: 10.3389/fphy.2021.744346
Received: 22 July 2021; Accepted: 08 September 2021;
Published: 28 September 2021.
Edited by:
Petra Granitzer, University of Graz, AustriaReviewed by:
Bettina Heise, Johannes Kepler University of Linz, AustriaByeong Ha Lee, Gwangju Institute of Science and Technology, South Korea
Copyright © 2021 Zheng, Bai, Xu, Liu and Ni. This is an open-access article distributed under the terms of the Creative Commons Attribution License (CC BY). The use, distribution or reproduction in other forums is permitted, provided the original author(s) and the copyright owner(s) are credited and that the original publication in this journal is cited, in accordance with accepted academic practice. No use, distribution or reproduction is permitted which does not comply with these terms.
*Correspondence: Guangjian Ni, niguangjian@tju.edu.cn
†These authors have contributed equally to this work