Aberrations in Structured Illumination Microscopy: A Theoretical Analysis
 Xin Liu1
  Shijie Tu1
  Yan Xu1 Hongya Song1 Wenjie Liu1 Qiulan Liu1 Cuifang Kuang1,2,3 Xu Liu1,2,3
  Xiang Hao1*
- 1State Key Laboratory of Modern Optical Instrumentation, College of Optical Science and Engineering, Zhejiang University, Hangzhou, China
- 2Ningbo Research Institute, Zhejiang University, Ningbo, China
- 3Collaborative Innovation Center of Extreme Optics, Shanxi University, Taiyuan, China
In super-resolution optical microscopes, aberrations often compromise the image performances by reducing its resolution and contrast. In previous works, the aberrations in stimulated emission depletion (STED) microscopy and single-molecule localization microscopy (SMLM) have been well-investigated, while the research on the aberrations in structured illumination microscopy (SIM) is not sufficient, the researchers always poured attention into aberrations only in the detection path. In this paper, we investigate the aberrations in SIM in a comprehensive manner, and their causes and effects on both the illumination and the detection paths are discussed. The aberrations in the illumination path may distort illumination patterns, and deteriorate the final images, together with the aberrations in the detection path. In addition, several non-aberration-related factors, especially the misalignment of the incident beams with respect to the objective pupil, can also dramatically influence the performances of SIM. The analysis provides the theoretical basis and for optimizing a SIM system.
Introduction
Fluorescence microscopy is widely used for the visualization of microstructures and dynamic processes in cells. However, owing to the diffraction limit, the best resolution is only about a half wavelength of the fluorescence [1] when the conventional fluorescence microscope is applied. Nevertheless, the state-of-the-art super-resolution microscopy can break the diffraction limit. These methods include, but are not limited to the single-molecule localization microscopy (SMLM) that stochastically activates single molecules in the full-field [2–5], the stimulated emission depletion (STED) microscopy using a depletion doughnut focal spot to reduce the size of the effective point spread function (PSF) [6–8], and the structured illumination microscopy (SIM) illuminating the sample with a periodic pattern [9–11]. Among them, SIM is exceedingly significant for live-cell imaging, providing double spatial resolution than that of the conventional wide-field microscopy. In this method, a one-dimensional sinusoidal illumination pattern is produced in the focal plane of the objective lens. A series of images, when the sample is illuminated by the patterns with different phases and orientations, are acquired by a camera. Using the specific SIM reconstruction algorithms [12–15], the super-resolution image of the sample can be obtained.
In super-resolution optical microscopes, aberrations compromise the image performances by worsening its resolution and reducing its contrast. The aberrations in SMLM and STED microscopy have been investigated sufficiently in previous works [16–18]. However, for SIM, researchers always poured attention only into the aberrations in the detection path, or assume that the aberrations are identical in the two paths [19, 20]. The discussion regarding the illumination path is insufficient. Yet, the quality of the illumination pattern is also crucial for the imaging performance of SIM. To fully optimize the final images of SIM, it is essential to create a model to describe the aberrations in SIM more comprehensively and figure out how they affect both the illumination pattern and the detection PSF.
In this paper, a strategy is developed for quantifying aberration effects in SIM. We build a mathematical model to analyze how the aberrations affect the illumination pattern and the detection PSF. As the systematic aberrations can be minimized during the design, only the sample-induced aberrations are considered. In addition, several non-aberration-related factors, especially the misalignment of the incident beams with respect to the objective pupil, are also discussed.
Theory
In SIM, a sinusoid pattern is used to excite the sample. The image obtained by a camera can be expressed as:
where e(r) = 1+cos(ke·r+φ) is the intensity distribution of the illumination pattern, o(r) is the spatial distribution of the sample labeled with fluorophores, and h(r) is the point spread function (PSF) of the detection path.
In the Fourier domain, Equation (1) can be expressed as:
where ĩ(k), ẽ(k), õ(k), and are the Fourier transform of i(r), e(r), o(r), and h(r), respectively. k represents the spatial frequency. Inducing structured illumination pattern, SIM can move the high spatial frequency information originally blocked by the optical system into the passband, which expands the size of the optical transfer function (OTF) of the system.
Equations (1) and (2) demonstrate that the image obtained by SIM is in close connection with the illumination pattern, the spatial distribution of the sample, and the PSF of the detection path. Therefore, we took both the illumination path and the detection path into consideration to analyze the aberrations in SIM. To simplify the discussion, only the sample-induced aberrations were considered, since the systematic aberrations are always minimized during the design. For the illumination path, the excitation pattern is generated by the interference of two beams, which can be expressed as:
where A1 and A2 are the amplitudes of the two coherent incident beams, respectively. k1 and k2 are the wave vectors, respectively, and φ is the phase difference between the two beams. To simplify the discussion, the two beams can be assumed to be s-polarized and φ = 0 [21], plus |A1| = |A2|. For the detection path, the PSF can be calculated using the vectorial diffraction theory [22, 23]. Moreover, in our simulation, the illumination beam and the detection beam are both linear polarized.
A mathematical model is built to analyze the effects of the aberrations. As depicted in Figure 1, the illumination beam exits the objective, propagates into the immersion medium layer, and then passes through the coverslip into the sample medium. On the other hand, in the detection path, following the reversibility principle of the beam path, the fluorescence emitted from the sample medium can be treated as the light focused by the same objective. The refractive indices (RI) of the three layers of media (immersion liquid, cover glass, and the sample) are represented as n1, n2, and n3, respectively, while the thickness of the coverslip is h. The incident angles of the illumination beam on each media interface are θ1, θ2, andθ3, respectively, while the angles are α1andα2 for the detection path. In our simulation, the objective is plan-apochromatic by default [24].
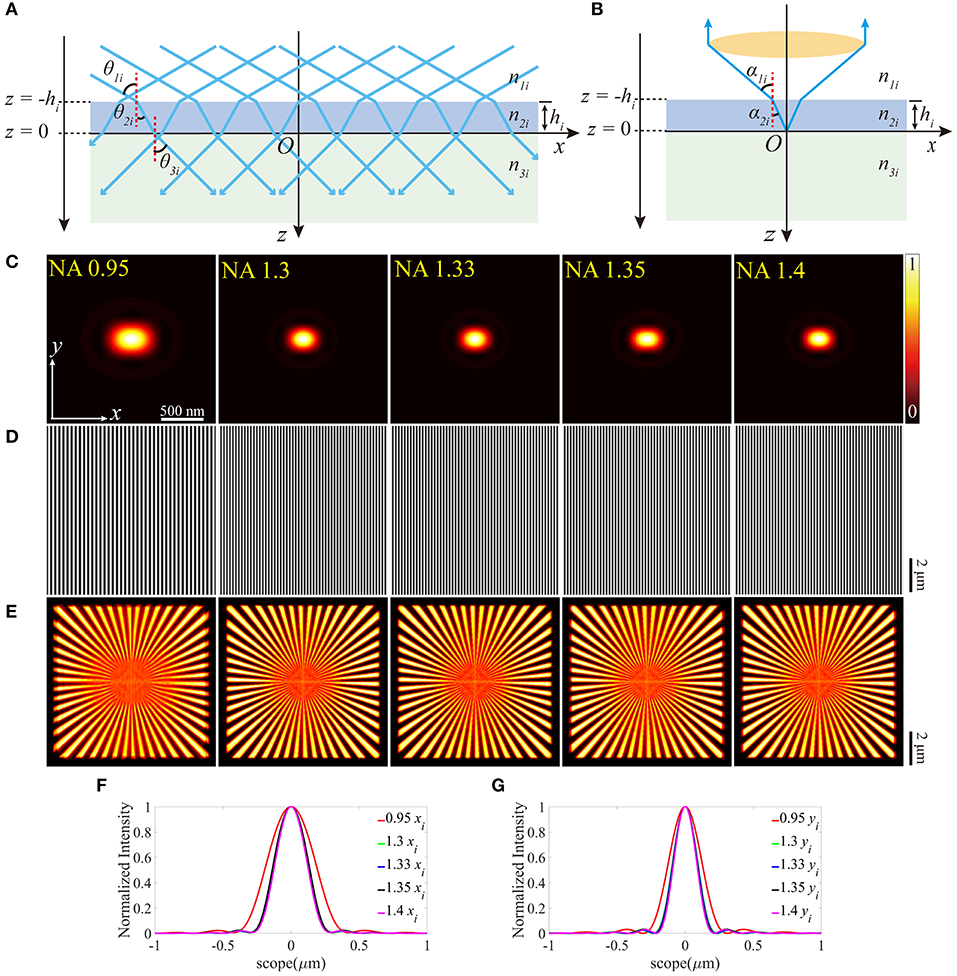
Figure 1. SIM with no aberrations for objectives with different NAs. (A) The illumination beam path. (B) The fluorescence is inversely collected by the same objective using the classic epifluorescence architecture. (C) The PSFs on the plane z = 0 (ideal focal plane). (D) The excitation patterns calculated from different objectives using the same parameters in (C). (E) The reconstructed images of SIM from the objectives with different NAs. From left to right, the resolutions are 164, 128, 125, 125, and 120 nm. (F,G) are profiles of the ideal PSFs in (C) on the x and y-direction, respectively.
A Cartesian coordinate system (x, y, z) is built for the description of the position information (Figure 1A). The orientations of the unit vectors x and z are defined by the layer interface and the optical axis, respectively. The origin of the coordinate system is consistent with the position of the Gaussian focus in the absence of stratified media (no sample medium, Figure 1B), and the subscript i denotes the ideal values [24]. Following the above definitions, the lower surface of the coverslip is located at z = 0, while the upper one at z = –h. To quantitatively test the aberration effects, we set the excitation and fluorescence wavelengths as 488 and 532 nm, respectively.
Aberrations are usually measured by the deviation of the practical wavefront from its ideal shape and can be expressed as:
where zl and zu are the z-coordinates of the lower and upper surface of the coverslip for simulation, respectively. Notably, δi = hi·(n2i cosθ2i − n1i cosθ1i) is used to compensate for the aberrations induced by the RI difference between the immersion medium and the coverslip during the objective's design [24].
Results and Discussion
The results with no aberrations are shown in Figure 1. Different numerical apertures (NA) were applied during the simulations, and the specific parameters in each simulation are presented in Table 1. Combining the excitation patterns and the PSFs of the detection path, the images of SIM were reconstructed using the inverse matrix-based phase estimation algorithm (Figure 1E) [15], and the resolution was estimated using the parameter-free image resolution estimation method [25]. As what we expect, the comparisons between Figures 1C–G illustrate that using the objective with a larger NA generates a smaller PSF and a denser sinusoid pattern, thereby achieving a better resolution. In our simulation, the ideal interference angle of the two beams is determined by .
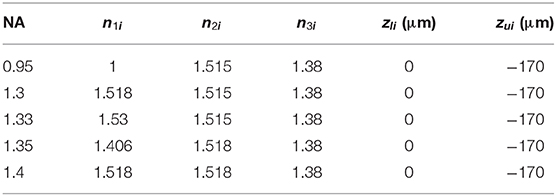
Table 1. Parameters in the ideal case.
We further investigated the effects of the aberrations when the value of the RI of the coverslip deviates from the desired one, which is depicted in Figure 2. In Figures 2A,B, the incident angles θandα change in response to the varied RI of the coverslip. Similar to the above simulations, a series of different RIs were considered to discuss the effects in a more comprehensive manner, and Figures 2C–I are simulated in n2 = 1.521 for detail.
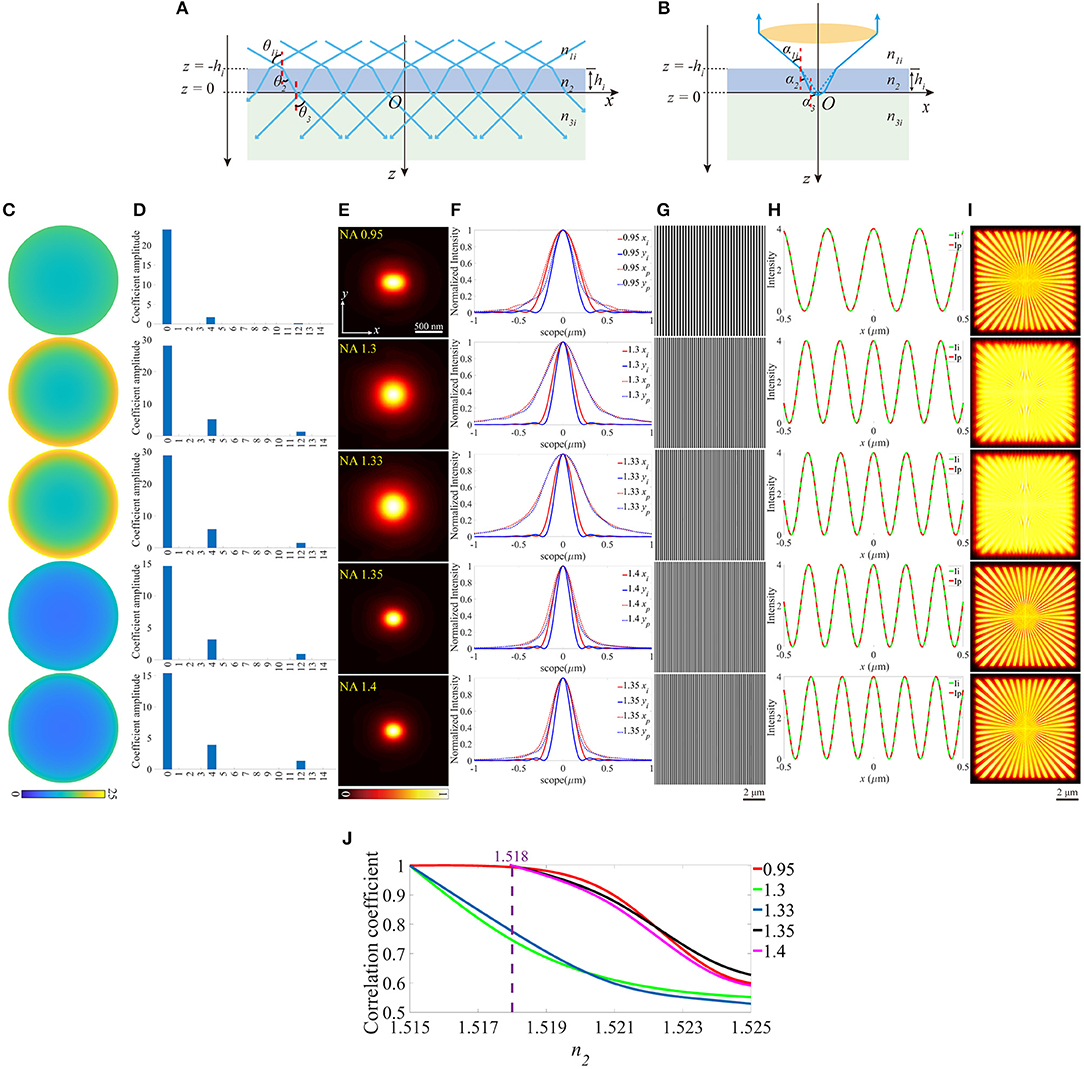
Figure 2. The aberrations induced by the deviation of the RI of the coverslip. (A,B) The RIs between the immersion medium and the coverslip mismatch for the illumination path and the detection path, respectively. (C) The pupil functions calculated from the case depicted in (B). (D) Zernike decomposition of the pupil functions shown in (C). (E) The PSFs on the plane z = 0, calculated from the corresponding pupil functions. (F) The profiles of the ideal (solid line) and biased (dashed line) PSFs in (E). (G) The excitation patterns affected by these biased RIs. (H) The local profiles of the corresponding excitation patterns shown in (G). The red dashed line Ip presents the biased case and the green solid line Ii presents the ideal case, respectively. The scope is −0.5 ~ 0.5 μm. (I) The corresponding reconstructed images of SIM. (J) The correlation coefficients of SIM images with different n2and NAs. The purple dashed line corresponds to n2 = 1.518.
As depicted in Figure 2C, the pupil functions of the detection path were calculated using the ray tracing. Moreover, to quantify the aberrations, we decomposed these pupil functions into Zernike polynomials [26, 27] from 0th to 14th modes, which are shown in Figure 2D. The piston (0th) mode holds the most part, which has no visible effect on the PSF, while the remainders are the defocus mode (4th) that simply makes the PSF out of focus and the primary spherical mode (12th) which increases the size of the PSF (Figures 2E,F). The profiles (Figure 2H) indicate that the aberrations induced in Figure 2A have little effects on the excitation patterns (Figure 2G) owing to the constant NA.
The reconstructed images are shown in Figure 2I, which are blurred by the larger PSFs (Figure 2E), compared with the images in Figure 1E. In order to further detail the effects of the aberrations, the correlation coefficients of the reconstructed images are presented in Figure 2J. The simulated values of n2 are set to be larger than the desired ones, otherwise, the light emitted from the sample cannot be collected by the objective effectively.
On the other hand, we investigated how the aberrations affect SIM images when the objective focuses deeper into the sample. As shown in Figures 3A,B, this case can be treated as the location shift of the coverslip along the optical axis. The z-coordinates of the lower and the upper surfaces (zl and zu) of the coverslip change a value a, while the other parameters remain constant. A series of different zl are considered, and an example is given in Figures 3C–I (zl = −0.2 μm). The pupil functions are shown in Figure 3C, specifically, when NA = 1.4, the value on the edge of the pupil function is complex due to the total internal reflection (TIR), which reduces the effective size of pupil (Figure 3J) and the effective NA. The decomposition of the pupil function (Figure 3D) shows that the main aberration modes are the piston (0th), defocus (4th), and primary spherical (12th). The aberrated PSFs and the corresponding profiles are shown in Figures 3E,F, which are larger than that in the ideal case. The excitation patterns and the local profiles are illustrated in Figures 3G,H, and as a result of TIR, the intensity of the excitation pattern for NA = 1.4 is lower than that in the ideal case. However, the image is well-reconstructed with satisfactory contrast, for the reason that the contrast of the excitation pattern is the same as the ideal ones. Similarly, the images of SIM and the corresponding correlation coefficients are shown in Figures 3I,K.
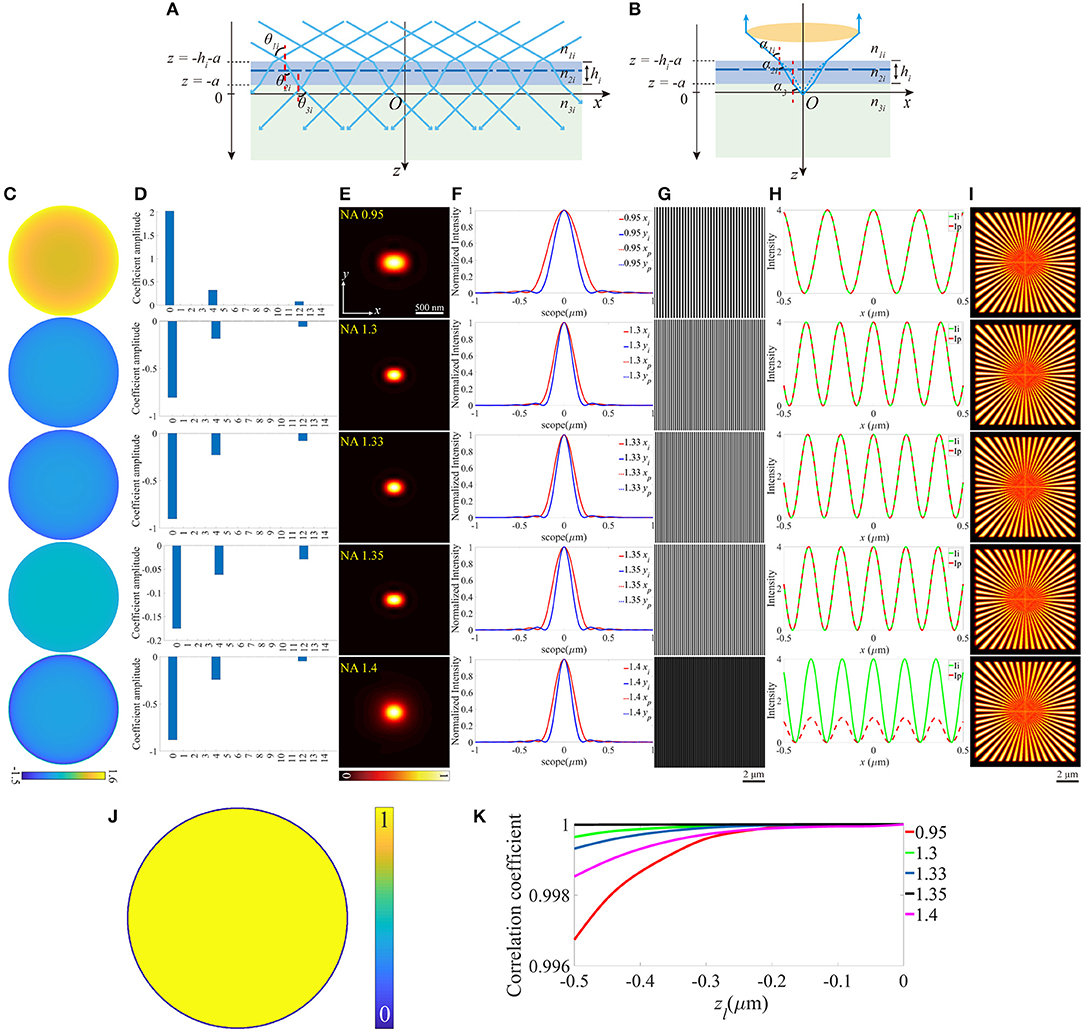
Figure 3. The aberrations induced by the increase of the focal depth. (A,B) The case that objective focuses deeper into the sample medium. (C) The pupil functions calculated from the case depicted in (B). (D) Zernike decomposition of the pupil functions shown in (C). (E) The PSFs on the plane z = 0, calculated from the corresponding pupil functions. (F) The profiles of the ideal and biased PSFs in (E). (G) The excitation patterns affected by biased zl. (H) The local profiles of the corresponding excitation patterns shown in (G), the scope is −0.5 ~ 0.5 μm. (I) The corresponding reconstructed images of SIM. (J) The effective pupil for NA = 1.4. (K) The correlation coefficients of SIM images with different zl.
Similarly, the thickness change of the coverslip, which may also induce aberrations can be treated as the offset of z-coordinate of the upper surface, while the lower surface still locates at z = 0 (Figures 4A,B). For objective that n1 is smaller than n2, the thickness should not be thinner than the ideal value, otherwise, the light emitted from the sample cannot be collected by the objective effectively. In contrast, the thicker coverslip is not valid if n1 is larger than n2. To make the discussion complete, different thicknesses of the coverslip are considered, and Figures 4C–I is an example for h = 170.8 μm (above the black dashed line) and h = 169.25 μm (below the black dashed line), respectively. Figures 4J,K indicate that the offset of the thickness affects the objective for NA = 0.95 more critically, and the increase of thickness is more serious than the reduction of that. No visible effects are induced in objective for NA = 1.4 because the aberrations have little effect on the pupil function and the excitation pattern.
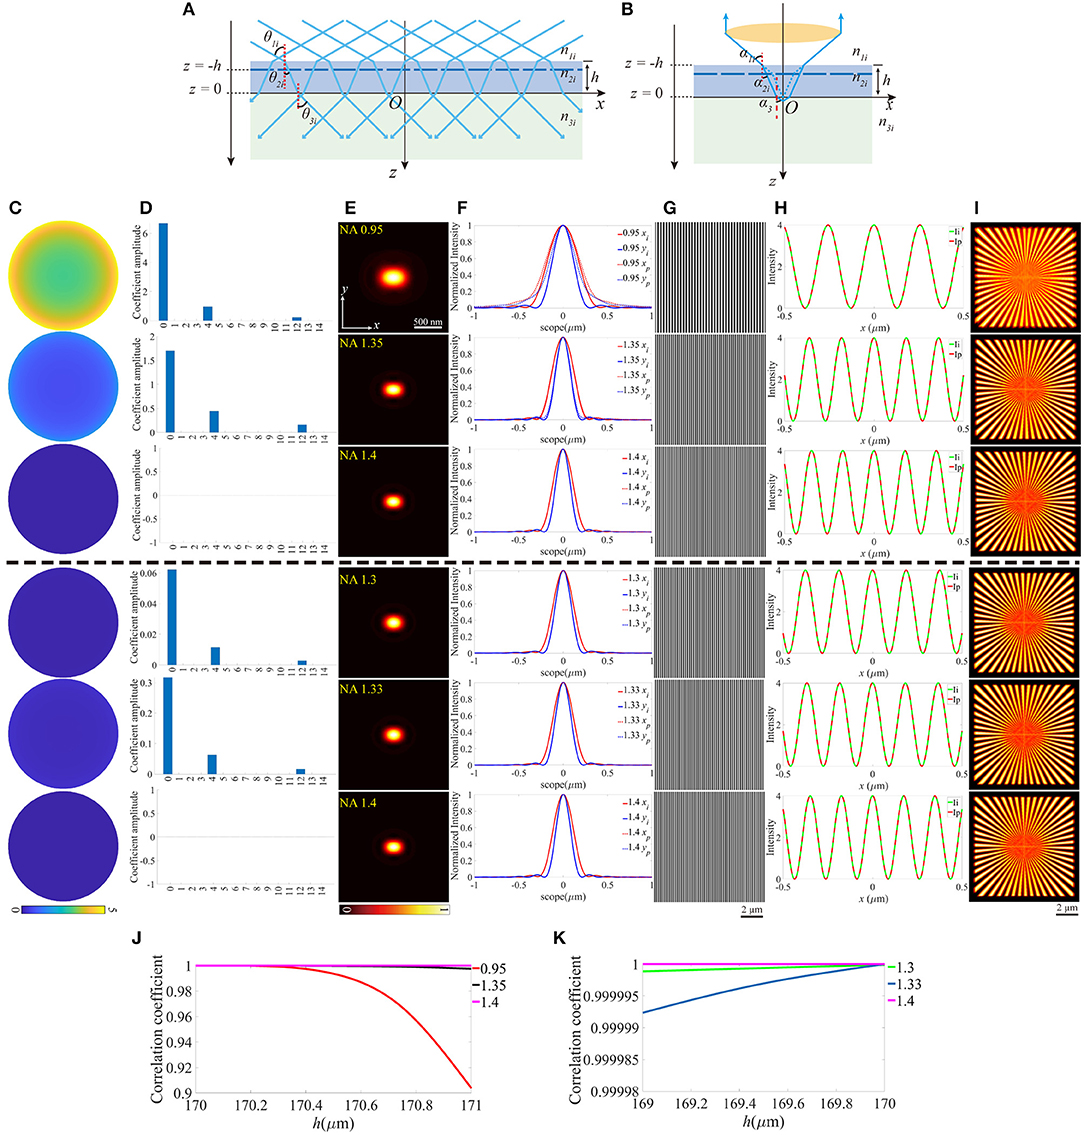
Figure 4. The aberrations induced by the deviation of the thickness of the coverslip. (A,B) The thickness of the coverslip has a biased value for the illumination path and the detection path. (C) The pupil functions calculated from the case depicted in (B). (D) Zernike decomposition of the pupil functions shown in (C). (E) The PSFs on the plane z = 0, calculated from the corresponding pupil functions. (F) The profiles of the ideal and biased PSFs in (E). (G) The excitation patterns affected by the biased h. (H) The local profiles of the corresponding excitation patterns shown in (G), the scope is −0.5 ~ 0.5 μm. (I) The corresponding reconstructed images of SIM. (J,K) The correlation coefficients of SIM images with different h for n1 ≤ n2 and n1 ≥ n2, respectively.
All three cases discussed above can induce aberrations to some extent. However, these aberrations are symmetrical about the optical axis. Therefore, only the symmetric Zernike polynomials, e.g., defocus and spherical aberrations appear. The condition becomes more complicated when the symmetry is broken. As an example, we can give a small slope angle β to the coverslip (Figures 5A,B). The direct consequence of the tilted coverslip is the re-organization of the incident angles θandα, which eventually results in the accumulation of the aberrations. It's paramount to be clear that the aberrations vary with the field of view along the x-axis, as a result of the various optical length difference. Therefore, the PSF is location dependent, and the final image is blurred by these variable PSFs. During the simulation, the slop angle β varied within a range of 0~0.3°, and Figures 5C–I is an example when β = 0.3°. The pupil functions were then calculated and decomposed into the first 15 Zernike modes, and the major modes now are tip (2nd) and coma (8th) aberration. Notably, in our simulation, the tilted coverslip has effects on the size of pupil function when NA = 1.4 (Figure 5J), as a result of the TIR induced by the tilt. Moreover, the intensity of the excitation pattern decreases with x increasing, and the periods of these patterns change. The scope is different from that in the above cases because the sample only exists in the side x > 0 on the plane z = 0. Subsequently, the reconstructed images were obtained with deviation from the center of the scope, and the contrast reduced.
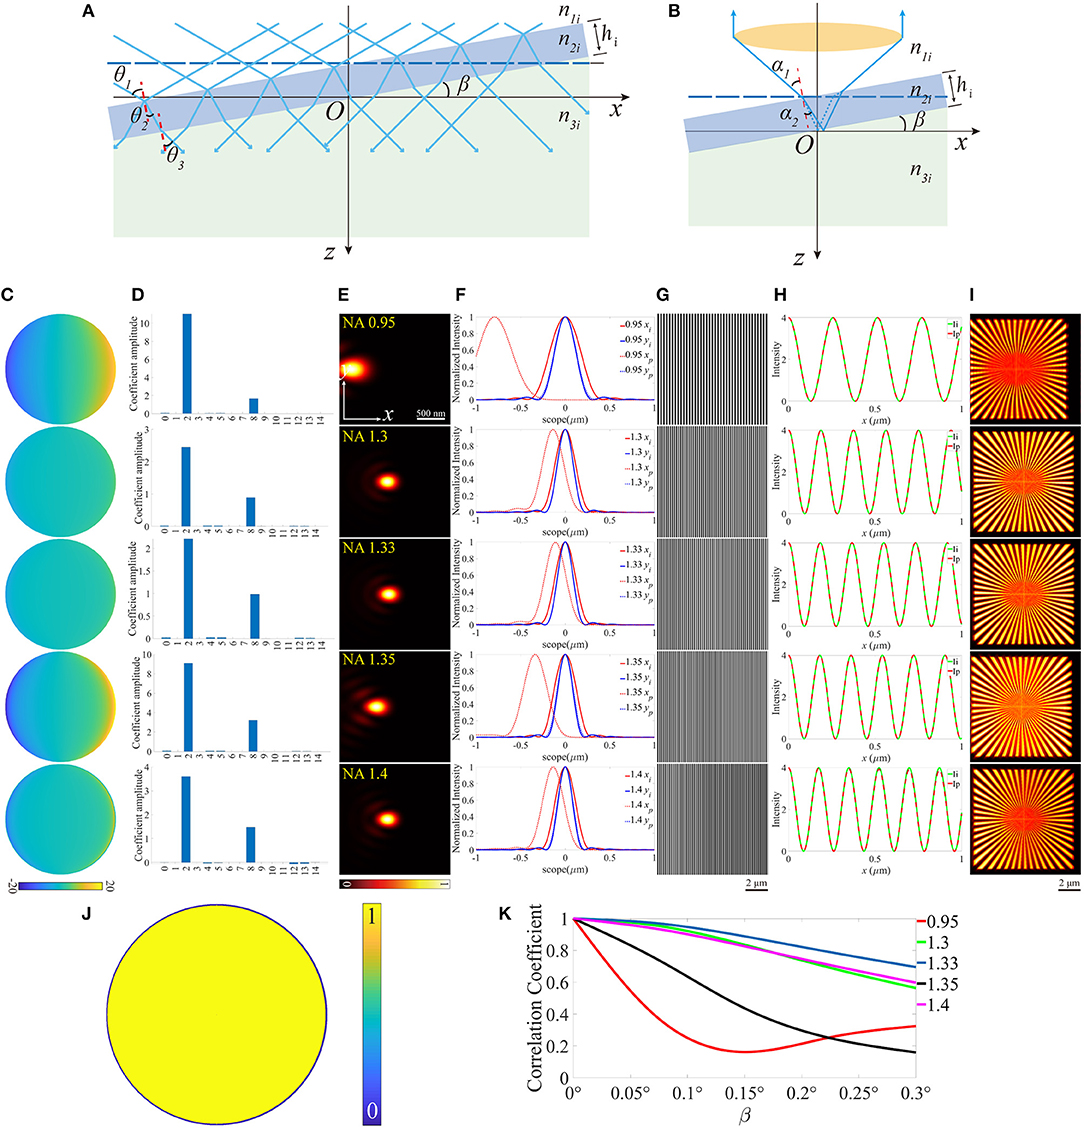
Figure 5. The diagrams of the illumination path and the detection path for a tilted coverslip, and the corresponding results for β = 0.3°. (A,B) The tilted coverslip mode in the illumination path and the detection path. (C) The pupil functions calculated from the case depicted in (B). (D) Zernike decomposition of the pupil functions shown in (C), the first 15 orders of modes are used. (E) The PSFs on the plane z = 0, calculated with the pupil functions shown in (C). (F) The profiles of the ideal and biased PSFs in (E). (G) The excitation patterns affected by the aberrations. (H) The profiles of the excitation pattern shown in (G), the scope is 0 ~ 1 μm. (I) The reconstruction images of SIM. (J) The effective pupil for NA = 1.4. (K) The correlation coefficients of the reconstructed images and the corresponding slope angle β.
The correlation coefficients between the distorted images and that with no aberrations are shown in Figure 5K. Generally speaking, it descends with the slope angle β increasing. However, for NA = 0.95, the correlation coefficient decreases first and then increases.
Based on the above results, the aberrations induced by the mismatched RIs, the increase of the focal depth, and the biased thickness of the coverslip have little effects on the excitation patterns. However, the PSFs are more affected, which is shown in the larger size caused by the defocus and the primary spherical aberrations. The immediate effect of these aberrations is the more blurred reconstructed images of SIM. Moreover, the aberrations induced by the tilted coverslip change the period of the excitation pattern, and result in the non-uniform contrast, on the other hand, the PSF of the detection path is stretched and biased in the x-y plane. Correspondingly, the reconstructed images of SIM are biased, and the contrasts are non-uniform, as shown in Figure 5I. In particular, as for the objective with a larger NA (e.g., NA = 1.4), the reduction of the coverslip thickness and the tilted case not only induce aberrations but also reduce the effective size of the pupil in the detection path.
In previous research, the aberrations on the pupil plane of the illumination path are investigated [28], however, the offset of the excitation beam with respect to the BFP of the objective, can also intensely affect the reconstructed images of SIM. In the optical system of the illumination path, the excitation pattern can be treated as the Fourier transform of two edge points on the pupil plane. As depicted in Figure 6A, one of the two edge points shifts toward the center point of the size-normalized pupil plane, m represents the distance between the edge point and the center. Furthermore, the amplitude on the corresponding pupil function of the detection path is shown in Figure 6B. Figures 6C–G is an example for m = 0, therefore, the PSFs (Figure 6C) distorted to more elliptical shapes. The excitation patterns and profiles are depicted in Figures 6E,F, in which the periods of the patterns show an intense difference from the ideal counterparts. The reconstructed images show that the images include a lot of ghost parts in higher NA objectives (Figure 6G). The correlation coefficients are calculated and plotted in Figure 6H. The quality of the images declines with the distance between the edge point and the center of the pupil plane increasing for all objectives.
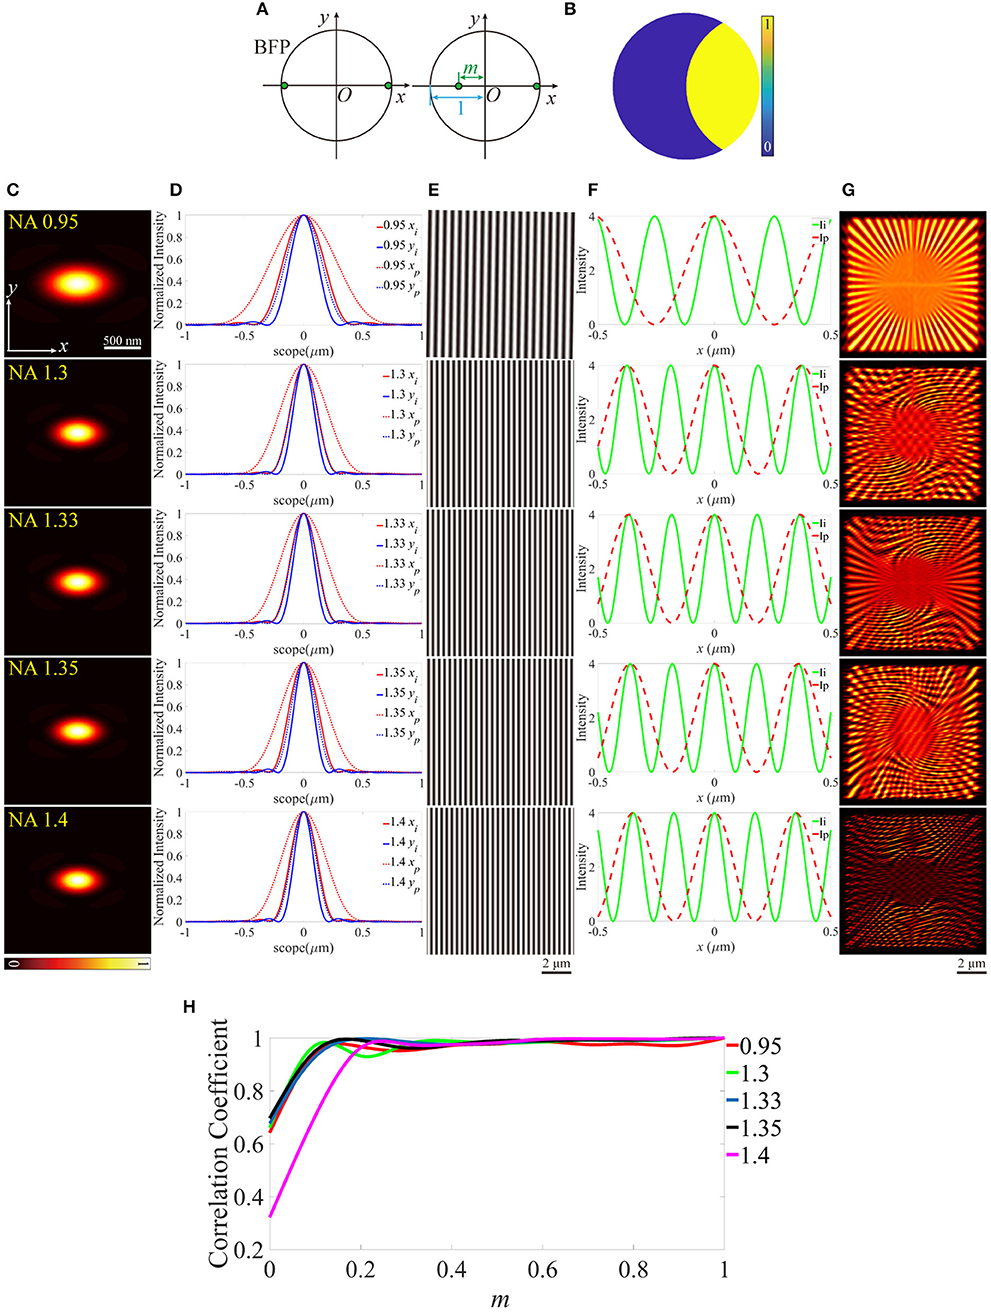
Figure 6. Effects of the off-centered excitation beam. (A) The back focal plane (BFP) of the objectives. (B) The pupil function of the detection path. (C) PSFs on the plane z = 0, calculated from the pupil function in (B). (D) The profiles of the ideal and biased PSFs in (C). (E) The excitation patterns. (F) The local profiles of the corresponding excitation patterns shown in (E), the scope is −0.5 ~ 0.5 μm. (G) The reconstructed images of SIM. m = 0 for all objectives. (H) The correlation coefficients of the biased reconstructed images and the corresponding m.
The aberration modes we built include the biased working condition of the objective (as discussed above, the illumination path has a stable performance, however, the PSFs are expanded in the detection path, and the resolution of the reconstructed images is reduced) and the tilted coverslip, which induce the non-uniform contrast and the offset from the center of the reconstructed images. These modes are very beneficial to the analysis for the aberrations induced by the immersion medium and the coverslip, and have potential application in the adaptive optics for SIM. Additionally, the distance between the two edge points on the BFP of the objective is taken into account, which leads to a tremendous change of the excitation patterns from the ideal counterparts, and PSFs are just like being squished on the vertical direction, therefore, the reconstructed images include a lot of ghost parts. It's necessary to comprehend these effects for further optimizing a SIM system, for example, if the reconstructed images contain ghost parts, the researchers can analyze the source of the damage by reference to the aberration mode of misaligned pupil. However, in practical experiments, the noise and background intensity must be taken into consideration, which aggravates the quality of images more intensely. Moreover, with the increase of the imaging depth, not only do the aberrations increase, but also the influence of scattering and absorption should be paid more attention.
Summary
In conclusion, we have built modes for the mismatched RIs, the increase of the focal depth, and the biased thickness of the coverslip, the tilted coverslip, and the misalignment of incident beams with respect to the BFP of the objective, respectively. In these modes, the excitation patterns are calculated based on the principle of two beams interference. In the first four modes, the pupil functions of the detection path are calculated using the ray tracing and are decomposed into the first 15th Zernike polynomials to obtain a quantified analysis, however, for the misalignment of incident beams, the pupil is not filled in the detection path. Consequently, the PSF of the detection path is distorted as a result of the corresponding pupil function, and combined with the excitation pattern, the reconstructed images are affected at different levels in these cases. The quantified descriptions for these modes can assist in monitoring and compensating the aberrations by adaptive optics, and a more completed reference for the correction of the SIM systems can be obtained.
This model is beneficial for the estimation and the correction of the aberrations in SIM, giving a guideline to further improve the performance of the SIM microscopes. In addition, this model is generally applicable to the systems that use structured illumination, e.g., such as multi-beams interference illumination.
Data Availability Statement
All datasets generated for this study are included in the article/supplementary material.
Author Contributions
XH conceived the idea. XiL, ST, and YX did the simulation. HS, WL, and QL gave the guide for analysis. XH, CK, and XuL supervised the project. All the authors contributed to the discussion on the results for this manuscript.
Funding
This work was financially supported by the grants from National Key R&D Program of China (2018YFA0701400), the Fundamental Research Funds for the Central Universities (2019QNA5006), and ZJU-Sunny Photonics Innovation Center (2019-01).
Conflict of Interest
The authors declare that the research was conducted in the absence of any commercial or financial relationships that could be construed as a potential conflict of interest.
References
1. Abbe E. Beiträge zur Theorie des Mikroskops und der mikroskopischen Wahrnehmung. Archiv Mikrosk Anat. (1873) 9:413–68. doi: 10.1007/BF02956173
2. Betzig E, Patterson GH, Sougrat R, Lindwasser OW, Olenych S, Bonifacino JS, et al. Imaging intracellular fluorescent proteins at nanometer resolution. Science. (2006) 313:1642–5. doi: 10.1126/science.1127344
3. Rust MJ, Bates M, Zhuang X. Sub-diffraction-limit imaging by stochastic optical reconstruction microscopy (STORM). Nat Methods. (2006) 3:793–5. doi: 10.1038/nmeth929
4. Folling J, Bossi M, Bock H, Medda R, Wurm CA, Hein B, et al. Fluorescence nanoscopy by ground-state depletion and single-molecule return. Nat Methods. (2008) 5:943–5. doi: 10.1038/nmeth.1257
5. Thompson MA, Lew MD, Badieirostami M, Moerner WE. Localizing and tracking single nanoscale emitters in three dimensions with high spatiotemporal resolution using a double-helix point spread function. Nano Lett. (2010) 10:211–8. doi: 10.1021/nl903295p
6. Hell SW, Wichmann J. Breaking the diffraction resolution limit by stimulated emission: stimulated-emission-depletion fluorescence microscopy. Opt Lett. (1994) 19:780–2. doi: 10.1364/OL.19.000780
7. Rittweger E, Han KY, Irvine SE, Eggeling C, Hell SW. STED microscopy reveals crystal colour centres with nanometric resolution. Nat Photon. (2009) 3:144–7. doi: 10.1038/nphoton.2009.2
8. Nagerl UV, Willig KI, Hein B, Hell SW, Bonhoeffer T. Live-cell imaging of dendritic spines by STED microscopy. Proc Natl Acad Sci USA. (2008) 105:18982–7. doi: 10.1073/pnas.0810028105
9. Gustafsson MG. Surpassing the lateral resolution limit by a factor of two using structured illumination microscopy. J Microsc. (2000) 198(Pt 2):82–7. doi: 10.1046/j.1365-2818.2000.00710.x
10. Gustafsson MG. Nonlinear structured-illumination microscopy: wide-field fluorescence imaging with theoretically unlimited resolution. Proc Natl Acad Sci USA. (2005) 102:13081–6. doi: 10.1073/pnas.0406877102
11. Heintzmann R, Jovin TM, Cremer C. Saturated patterned excitation microscopy–a concept for optical resolution improvement. J Opt Soc Am A Opt Image Sci Vis. (2002) 19:1599–609. doi: 10.1364/JOSAA.19.001599
12. Wicker K, Mandula O, Best G, Fiolka R, Heintzmann R. Phase optimisation for structured illumination microscopy. Opt Expr. (2013) 21:2032–49. doi: 10.1364/OE.21.002032
13. Wicker K. Non-iterative determination of pattern phase in structured illumination microscopy using auto-correlations in Fourier space. Opt Expr. (2013) 21:24692–701. doi: 10.1364/OE.21.024692
14. Muller M, Monkemoller V, Hennig S, Hubner W, Huser T. Open-source image reconstruction of super-resolution structured illumination microscopy data in ImageJ. Nat Commun. (2016) 7:10980. doi: 10.1038/ncomms10980
15. Cao R, Chen Y, Liu W, Zhu D, Kuang C, Xu Y, et al. Inverse matrix based phase estimation algorithm for structured illumination microscopy. Biomed Opt Expr. (2018) 9:5037–51. doi: 10.1364/BOE.9.005037
16. Coles BC, Webb SE, Schwartz N, Rolfe DJ, Martin-Fernandez M, Lo Schiavo V. Characterisation of the effects of optical aberrations in single molecule techniques. Biomed Opt Expr. (2016) 7:1755–67. doi: 10.1364/BOE.7.001755
17. Deng S, Liu L, Cheng Y, Li R, Xu Z. Effects of primary aberrations on the fluorescence depletion patterns of STED microscopy. Opt Expr. (2010) 18:1657–66. doi: 10.1364/OE.18.001657
18. Deng S, Liu L, Cheng Y, Li R, Xu Z. Investigation of the influence of the aberration induced by a plane interface on STED microscopy. Opt Expr. (2009) 17:1714–25. doi: 10.1364/OE.17.001714
19. Debarre D, Botcherby EJ, Booth MJ, Wilson T. Adaptive optics for structured illumination microscopy. Opt Expr. (2008) 16:9290–305. doi: 10.1364/OE.16.009290
20. Thomas B, Wolstenholme A, Chaudhari SN, Kipreos ET, Kner P. Enhanced resolution through thick tissue with structured illumination and adaptive optics. J Biomed Opt. (2015) 20:26006. doi: 10.1117/1.JBO.20.2.026006
21. O'Holleran K, Shaw M. Polarization effects on contrast in structured illumination microscopy. Opt Lett. (2012) 37:4603–5. doi: 10.1364/OL.37.004603
22. Richards B, Wolf E, Gabor D. Electromagnetic diffraction in optical systems, II. Structure of the image field in an aplanatic system. Proc R Soc Lond Ser A Math Phys Sci. (1959) 253:358–79. doi: 10.1098/rspa.1959.0200
23. Hao X, Kuang C, Wang T, Liu X. Effects of polarization on the de-excitation dark focal spot in STED microscopy. J Opt. (2010) 12:115707. doi: 10.1088/2040-8978/12/11/115707
24. Nasse MJ, Woehl JC. Realistic modeling of the illumination point spread function in confocal scanning optical microscopy. J Opt Soc Am A Opt Image Sci Vis. (2010) 27:295–302. doi: 10.1364/JOSAA.27.000295
25. Descloux A, Grussmayer KS, Radenovic A. Parameter-free image resolution estimation based on decorrelation analysis. Nat Methods. (2019) 16:918–24. doi: 10.1038/s41592-019-0515-7
26. Zernike VF. Beugungstheorie des schneidenver-fahrens und seiner verbesserten form, der phasenkontrastmethode. Physica. (1934) 1:689–704. doi: 10.1016/S0031-8914(34)80259-5
27. Born M, Wolf E, Bhatia AB, Clemmow PC, Gabor D, Stokes AR, et al. Principles of Optics. Cambridge: Cambridge University Press (1999).
Keywords: fluorescence microscopy, structured illumination, aberrations, adaptive optics, Zernike polynomials
Citation: Liu X, Tu S, Xu Y, Song H, Liu W, Liu Q, Kuang C, Liu X and Hao X (2020) Aberrations in Structured Illumination Microscopy: A Theoretical Analysis. Front. Phys. 7:254. doi: 10.3389/fphy.2019.00254
Received: 29 October 2019; Accepted: 30 December 2019;
Published: 22 January 2020.
Edited by:
Chao Tian, University of Science and Technology of China, ChinaReviewed by:
Ming Lei, Xi'an Jiaotong University (XJTU), ChinaMeng Lu, University of Cambridge, United Kingdom
Baoli Yao, Xian Institute of Optics and Precision Mechanics (CAS), China
Copyright © 2020 Liu, Tu, Xu, Song, Liu, Liu, Kuang, Liu and Hao. This is an open-access article distributed under the terms of the Creative Commons Attribution License (CC BY). The use, distribution or reproduction in other forums is permitted, provided the original author(s) and the copyright owner(s) are credited and that the original publication in this journal is cited, in accordance with accepted academic practice. No use, distribution or reproduction is permitted which does not comply with these terms.
*Correspondence: Xiang Hao, haox@zju.edu.cn