Design, fabrication, and preclinical testing of a miniaturized, multispectral, chip-on-tip, imaging probe for intraluminal fluorescence imaging of the gastrointestinal tract
 Bridget Slomka1
  Suzann Duan2 Thomas G. Knapp1 Natzem Lima3 Ricky Sontz2 Juanita L. Merchant2
  Travis W. Sawyer1,3*
- 1Department of Biomedical Engineering, College of Engineering, University of Arizona, Tucson, AZ, United States
- 2Department of Medicine, College of Medicine Tucson, University of Arizona, Tucson, AZ, United States
- 3Wyant College of Optical Sciences, University of Arizona, Tucson, AZ, United States
Gastrointestinal cancers continue to account for a disproportionately large percentage of annual cancer deaths in the United States. Advancements in miniature imaging technology combined with a need for precise and thorough tumor detection in gastrointestinal cancer screenings fuel the demand for new, small-scale, and low-cost methods of localization and margin identification with improved accuracy. Here, we report the development of a miniaturized, chip-on-tip, multispectral, fluorescence imaging probe designed for compatibility with a gastroscope working channel with the aim of detecting cancerous lesions in point-of-care endoscopy of the gastrointestinal lumen. Preclinical testing has confirmed fluorescence sensitivity and supports that this miniature probe can locate structures of interest via detection of fluorescence emission from exogenous contrast agents. This work demonstrates the design and preliminary performance evaluation of a miniaturized, single-use, chip-on-tip fluorescence imaging system, capable of detecting multiplexed fluorophores, and devised for deployment via the accessory channel of a standard gastroscope.
1 Introduction
The clinical use of endoscopic imaging devices remains critical to the discovery of malignancies that arise in internal luminal organs, such as those of the gastrointestinal (GI) tract. As endoscopes continue to improve in resolution, sensitivity, and operability within tight spaces, so, too, have clinicians’ ability to visualize subtle morphological and functional changes indicative of pathogenesis in a variety of tissues, diseases, and procedures. Endoscopic devices are now commonly used in combination with surgical tools to perform complex minimally-invasive operations that can improve clinical outcomes in oncologic surgery (Aisu et al., 2018).
Endoscopy of the GI tract is generally performed with broadband illumination. However, current implementation of white light endoscopy (WLE), which has proven less sensitive than other methods of imaging, such as narrowband and chromoendoscopy, may not be sensitive enough to resolve changes at the molecular scale present in precancerous lesions (Singh et al., 2009; Song et al., 2021). The sensitivity of WLE is limited by the operator’s ability to detect subtle changes in color, texture, and form, all of which may present differently between patients. Additionally, WLE is not specific for demarcating tumor margins, which is critical for facilitating the complete resection of malignant tissues that can seed future recurrence of GI cancer. Therefore, the development of advanced imaging technologies, such as those which implement fluorescence imaging with tumor-targeted contrast agents, could greatly improve clinical practice by providing tumor-specific contrast with high sensitivity. Although most endoscopes do not utilize fluorescence imaging, clinical gastroscopes are designed to support the addition of modular accessories through a working channel to expand the operator’s capabilities during different procedures. Unfortunately, the 2.8-mm diameter channel of diagnostic gastroscopes has traditionally posed challenges for introducing imaging devices, which often exceed this diameter. However, the miniaturization of chip-on-tip imaging systems has simplified the development of endoscopes of a compatible size. The clinical value of these miniature, accessory-port imaging instruments is multifold: reductions in outer diameter have enabled endoscopes to traverse narrow anatomical regions that were previously inaccessible, and when combined with standard reusable gastroscopes, single-use accessory-port endoscopes can supplement high-resolution gastroscope images with other imaging modalities, including fluorescence.
Novel miniaturized endoscopic systems have provided access to millimeter-scale lumens for collecting data using autofluorescence, reflectance, and optical coherence tomography modalities (Kiekens et al., 2020). On the forefront of advanced miniaturized endoscopy, sub-millimeter scanning fiber endoscopes pave the way for detecting and imaging cancer in regions of the human anatomy that were previously inaccessible via endoscope (Miller et al., 2012; McGoran et al., 2019). While fiber endoscopes provide powerful imaging capabilities, optical fibers can be expensive and are prone to damage from crushing and bending, which results in a significant reduction in image quality (Subramanian and Ragunath, 2014; Jang, 2015). The high device cost and need for frequent repairs is a significant barrier of adoption for fiber-based endoscopes, which must survive reuse and sterilization. Conversely, inexpensive, single-use distal chip endoscopes subvert the need for maintenance of expensive optical equipment and do not require hospitals or clinics to invest in large sums of capital equipment. Single-use endoscopy has found to save on operational costs associated with purchasing, sterilizing and maintaining reusable scopes in a multitude of procedure settings (Sohrt et al., 2019; Voigt et al., 2021; Pang et al., 2022). As a result, chip-on-tip endoscopy as a miniature alternative to fiber endoscopy has gained significant traction, with some camera module footprints as small as 0.55 mm × 0.55 mm (OMNIVISION, 2022). Flexibility, higher resolution, and affordability, all delivered in a compact size, fuel advancement in miniature chip-on-tip endoscopes over existing fiber-based systems for white light and fluorescence modalities (Gaab, 2013; Matz et al., 2017). Adoption of chip-on-tip imaging systems comes with a tradeoff between volume and imaging resolution. The number of pixels in a CMOS array is limited by the minimum pixel size and the area of the sensor. Single fiber and fiber bundle endoscopes, which can pipe images to larger, higher resolution back-end sensors, generally produce images with heightened clarity. Although chip-on-tip endoscopes have seen growth, there remains a significant opportunity for advancing imaging techniques to increase the sensitivity and specificity within GI cancer diagnosis.
Fluorescence-guided surgery (FGS), in particular, has shown promise by significantly improving the visual contrast between normal and cancerous tissues to facilitate the complete resection of tumors which can reduce the likelihood of their recurrence (Gutowski et al., 2017; Meijer et al., 2021). As such, FGS demonstrates potential for effective localization, visual inspection, and complete surgical resection of tumors within the GI tract, and has previously shown success in delineating healthy tissues from those that are cancerous (Nagaya et al., 2017; Galema et al., 2022). By tagging specific biomarkers of cancer with exogenous fluorescent moieties, contrast can be induced between highly fluorescent, labeled cancerous tissue and minimally fluorescent normal tissue. Thus, endoscopic fluorescence imaging may serve to improve the sensitivity of screenings and support the complete resection of tumors during FGS. Researchers have demonstrated effective tumor localization using tumor-specific antibodies labeled with fluorescent dyes in human and animal studies of GI cancers (Gutowski et al., 2017; Meijer et al., 2021; clinicaltrials, 2022). In these works, laparoscopic fluorescence imaging was employed for the visualization of molecular probes that bind to carcinoembryonic antigen (CEA), known to be upregulated in a vast array of cancers, including many that arise in the GI tract (Blumenthal et al., 2007; Lee and Lee, 2017; Meijer et al., 2021). These fluorophore-conjugated antibodies are now being evaluated in further clinical trials that aim to demonstrate their efficacy for improving the diagnosis of a multitude of GI cancers (Meijer et al., 2020). Similar research using octreotide conjugates for targeted delivery of fluorescent reporters to label GI cancers which do not express CEA is also underway, highlighting the advancement of fluorescent probes in the detection of a breadth of cancerous lesions (Figueras et al., 2019). Because fluorescent tags may be conjugated with a vast array of target molecules, several labels can be multiplexed by selecting fluorescent species that excite and emit at unique wavelengths. Ultimately, a multispectral endoscope that is capable of imaging a variety of fluorophore-tuned wavelengths may serve as a powerful tool for enabling surgical imaging multiplexed fluorophores, each highlighting unique structures or compounds in clinical procedures.
In this brief research report, we present the design, fabrication, and preliminary pre-clinical testing of a miniature multispectral fluorescence endoscope with biopsy capabilities. The device is designed for compatibility with a commercial diagnostic gastroscope to enable high performance fluorescence imaging of up to four unique fluorophores without the requisite of changing front-end optics between channels. We perform technical characterization of the device and demonstrate its ability to measure labeled tissue fluorescence, and present preliminary results showing sufficient sensitivity to measure tissue autofluorescence. The development of this specialized multispectral microendoscope system, designed to detect multiplexed fluorescence wavelength bands with biopsy capability, advances the visualization of cancer with enhanced contrast and margin recognition.
2 Methods
2.1 Design and fabrication
A miniature, biopsy-enabled, chip-on-tip imaging assembly was created to detect fluorescent emissions in four unique wavelength bands without the requisite of changing front-end optics between varying wavelengths. The probe was designed to detect emissions from several fluorophores common in research and clinical settings, including fluorescein and quinine. The design specifications are listed in Table 1. Mechanical specifications of size constrained the endoscope to fitting within the working channel of a commercial articulating gastroscope.
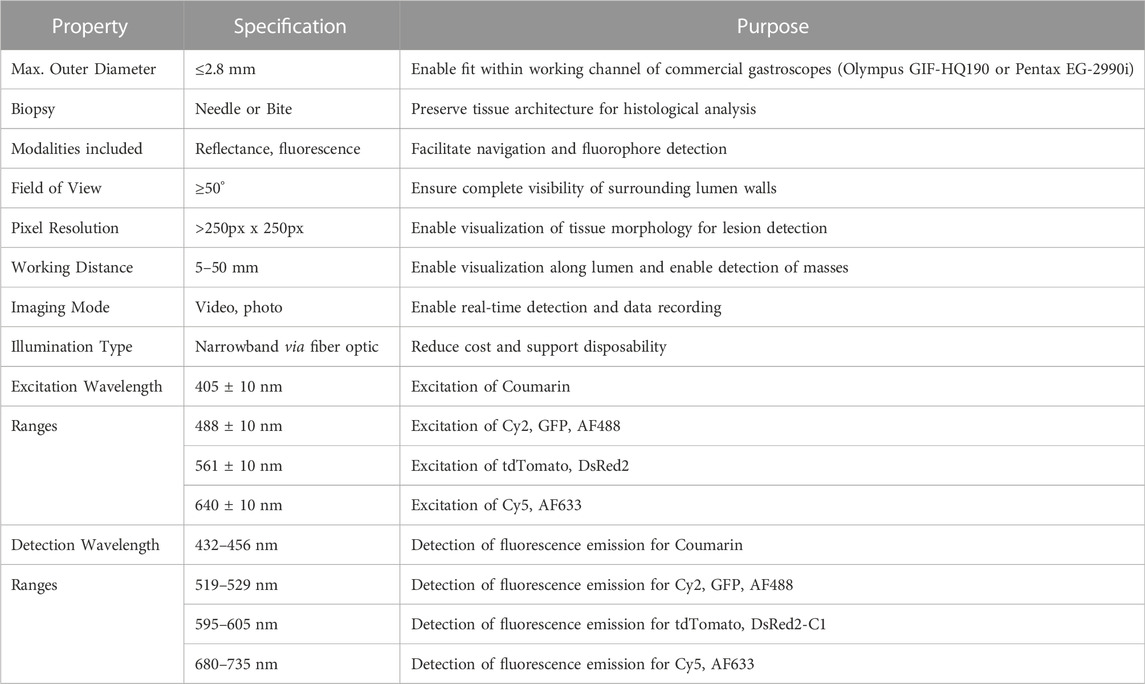
TABLE 1. Specifications of miniature multispectral fluorescence imaging system.
2.2 Illumination assembly
The onboard illumination assembly was designed to operate in four distinct wavelength bands to target the absorption peaks from fluorescent compositions with peak excitation wavelengths of 405, 488, 561, and 640 nm (Figure 1A). To provide illumination at each excitation wavelength, four fiber-coupled LED light sources (M405FP1, M490F3, MINTF4, M625F2; Thorlabs, Newton, NJ) were connected via a 400 μm core 1-to-4 fanout fiber bundle (BF44LS01; Thorlabs) to an aspheric condensing lens (ACL2520U-A; Thorlabs). To prevent light leakage into detection bands, each LED was filtered with a corresponding unique 20 nm bandpass filter (FB405-10, FL488-10, FB560-10, FB640-10; Thorlabs) with full-width half-max wavelengths corresponding to the peak absorption wavelengths of a subset of fluorescent probes.
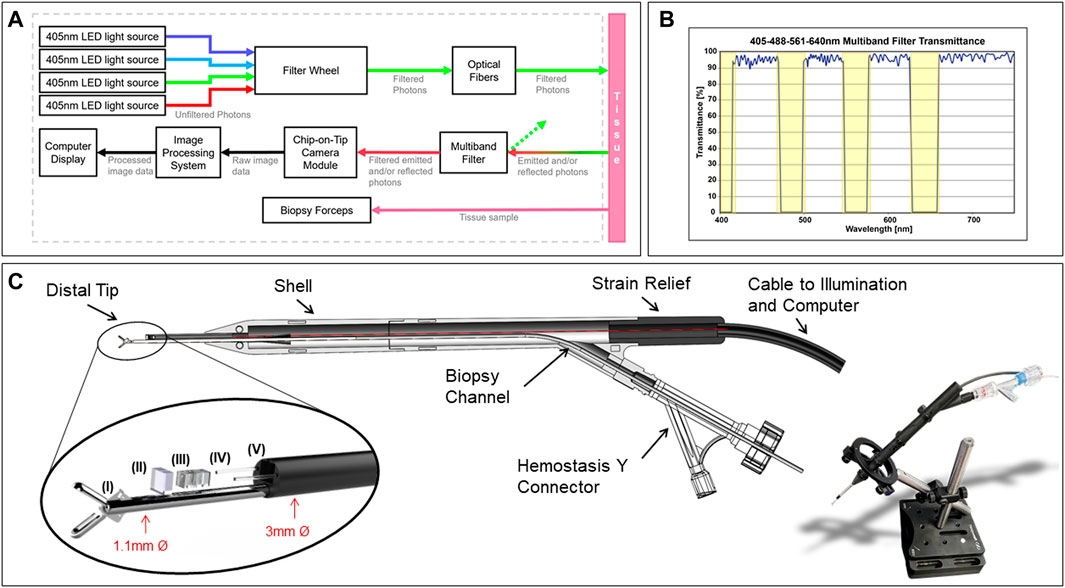
FIGURE 1. (A) Transmittance of broadband light through custom multiband filter. Highlighted regions indicate wavelengths employed for sample excitation. (B) Block diagram of miniature multiband fluorescence imaging system. (C) Component map of handheld probe. In the magnified image, (I) denotes a pair of Piranha® biopsy forceps (II) denotes the multiband filter (III) denotes the miniature chip-on-tip camera module (IV) indicates the air of optical fibers for illumination (V) Indicates the distal housing.
These bandpass filters were mounted in a filter wheel (Thorlabs FW2A) and focused with a second aspheric condensing lens (Thorlabs ACL2520U-A) onto a 1 × 2 multimode fiber optic coupler (Thorlabs TH400R5F1B), which pairs with two multimode fibers (Thorlabs M136L03) which run through the length of the imaging probe shaft and exit at the distal tip of the device.
2.3 Imaging assembly
A miniature, monochromatic camera, Osiris M (OptaSensor GmbH, Nürnberg, Germany), was selected to perform image acquisition. The 1 mm × 1 mm x 2 mm unit captures images sized at 320 px x 320 px with a pixel size of 2.4 μm (OptaSensor GmbH, 2020). The field of view of the camera optic is 90°, with an f number of 4.0. The depth of field ranges from 5–50 mm, with an intended working distance from 5–10 mm. The specifications of optics internal to the camera module are proprietary to OptaSensor GmbH. Image exposure was held at 0.043 s, and videos were captured at 23 fps.
To eliminate signal from illumination sources, a 1.5 mm × 1.5 mm multiband interference filter (Iridian, Ottawa, ON, Canada) was custom designed to meet the specifications in Table 1 and fabricated via thin film deposition, impeding the transmission of excitation illumination wavelengths with an optical density of five while simultaneously permitting transmission of desired fluorescence emission wavelengths (Figure 1B). The filter had a thickness of approximately 1.1 mm and was mounted with a submillimeter air gap distal to the camera module. Due to the dimensions of the filter limiting the entering chief ray angle, the field of view of the overall system was limited to approximately 60° for fluorescence imaging mode. The filter was fabricated with a specification on angle of incidence to +/-30.
2.4 Biopsy assembly
In the histological characterization of tissues in the luminal GI tract, it is necessary to collect bulk tissue biopsies with forceps (as opposed to needle aspiration) to preserve tissue architecture, a critical feature in histopathological sample analysis. To maintain a miniature footprint, three Fr Piranha® biopsy forceps (Boston Scientific M0065051600, Marlborough, MA), shown in Figure 1C, were incorporated through a backloading channel and were both introduced and secured using a Hemostasis Valve Y connector (Qosina 97,380, Ronkonkoma, NY), featuring a Tuohy Borst adapter with rotating male luer lock and an angled female luer injection side port.
2.5 Operator interface and device assembly
To secure components of the imaging system, a cylindrical housing of 2.7 mm in diameter by 10 mm in length with four through-holes was designed in SolidWorks (Dassault Systèmes, Vélizy-Villacoublay, France) and fabricated with stereolithography 3D printing (Elegoo US-SO-3D-110, Shenzhen, Guangdong, China). The terminal ends of the optical fibers were mounted in the lateral through-holes of the cylinder, and Osiris M camera module was positioned in the central through-hole of the printed cylinder such that the multiband filter could then be placed directly in contact with the front of the camera lens, facing outward from the distal tip. The fiber channels were angled inward by 7.5° as measured from the exit of the housing such that the two beams overlapped into a single illumination region at the working distance. Individual fibers were installed on either side of the camera to provide more uniform angular illumination, reducing shadows that may results from non-flat objects. The biopsy forceps were mounted through the chamber located below the camera module. These components were housed in a stainless-steel shell measuring 3 mm × 14 mm (Microgroup, Medway, Massachusetts). The output illumination fibers were installed through lateral through holes on either side of the camera.
This housing was then inserted into a stylus-like SLA 3D-printed shell composed of rigid resin (Elegoo US-EL-3D-052), which terminates with a flexible, SLA 3D-printed strain relief (RESIONE F69-500g, Dongguan, Guangdong, China) to protect the exiting illumination fibers and cables. This rigid outer shell was designed to be both durable and larger in diameter to simplify handling during preclinical rodent testing. Clinical versions of this imaging system are designed such that the length of the endoscope is flexible, with the exception of the final 7 mm of the distal tip. All components were secured with a polyvinyl alcohol (PVA), a biocompatible polymer, adhesive generated from DI water and polyvinyl alcohol powder (Sigma-Aldrich 363,146-25G, St. Louis, MO).
2.6 Device operation
Image capture, video capture, and camera settings are controlled by means of a custom digital interface (OptaSensor, IPS Viewer v01_07) through USB3.0 connection. Onboard illumination is operated using UPLED software (Thorlabs) to adjust source brightness through current manipulation. For preliminary evaluation, manipulation of the device was performed by translation of the device body, ensuring the distal tip is pointing toward the target of interest, confirmed by visually inspecting the output image to ensure that the field of view is centered, and the image is in focus. A custom mount with a stand was designed to secure the device to allow for stationary imaging (Figure 1C). Fluorescence imaging may be toggled by switching between illumination sources. Reflectance imaging can be achieved using broadband illumination or narrow band illumination in wavelengths within the transmission ranges accepted by the distal tip multiband filter.
2.7 Characterization
2.7.1 Slanted-edge modulation transfer function
To assess resolution, the modulation transfer function (MTF) was measured at several distances with and without the front-end multiband filter in place, and while submerged to test waterproof performance. Images were captured with the tip of the camera placed at 2 mm, 5 mm, 10 m, 25 mm, and 50 mm from a slant edge optical target (ThorLabs, R2L2S2P) with a well-defined black-and-white interface illuminated using the onboard illumination of the device at 543 nm. Images were then analyzed using a technique derived from the edge-gradient analysis algorithm that operates with an image input of a sharply contrasting linear interface, aligned such that it does not fall precisely along a row or column of sensors within a camera’s sensor array (Burns, 2000). The ImageJ plugin SE_MTF was used to select a region perpendicular to the slanted edge interface of the black and white region of the optical target to subsequently yield the modulation transfer function of the system in cycles/pixel (Mitja et al., 2011).
Resolution was calculated from the MTF measurements through the relationship between cutoff frequency, c, and resolution, r, demonstrated in Eqs. 1, 2 (Greivenkamp et al., 2009; Saleh and Teich, 2019). Wherein Eq. 1 indicates that cutoff frequency is a function of numerical aperture (NA) and Eq. 2 indicates the relationship between resolution, defined as the first radius of the Airy disk, and f-number (f/#).
With numerical aperture taken as an approximation of a function of the system’s f-number, as indicated in Eq. 3, the relationship between cutoff frequency and resolution is defined. (Greivenkamp et al., 2009)
2.7.2 Fluorescence sensitivity
To measure fluorescence sensitivity, serial dilutions were performed from a stock solution of a known concentration of Fluorescein and the resulting dilutions were transferred to standard 1 cm × 1 cm spectrometry cuvettes. The cuvettes were illuminated with the device using the 488 nm LED and images were collected for each concentration with a constant exposure time of 0.043 s per capture. Images were analyzed by calculating the mean image brightness for each concentration in a stationary region of interest to detect the illumination level at which the sensor is sensitive to the presence of fluorescent emission.
2.7.3 Geometric distortion
Geometric distortion is a measure of how the magnification of an optical system varies across the image. This is a common effect seen in imaging systems with large fields of view such as in endoscopic imaging. Correction measures can be implemented during postprocessing, provided that the degree and type of distortion are well-characterized. Distortion of the system was measured using a dot grid target (ThorLabs, R2L2S3P3) with a dot spacing of 500 μm. To measure distortion, the target grid was placed 5 mm away from the device such that the pattern filled the field of view of the camera. Images were captured and imported into ImageJ where the distance from the image center of diagonal grid points was measured and the deviation from linearity was recorded. Distortion, d, was calculated in accordance with the picture height distortion method or local geometric distortion method, wherein the difference between the height measured in the image, h’, of each point and the predicted distance without distortion effects, h, of the corresponding point, as estimated for a perfectly linear image, is divided by the predicted image height to yield percent distortion across an image (Eq. 4). (European Broadcasting Union, 1995)
2.7.4 Filter transmission dependence on angle of incidence
To measure the filter transmission spectrum as a function of angle of incidence, the filter was mounted in a precision rotation stage and illuminated with collimated light from a xenon light source (Lambda LS, Sutter Instruments, Novato CA). A fiber-coupled spectrometer (HDX-VIS-NIR, Ocean Insight, Orland FL) was used to capture the transmission spectrum of the filter at angles of incidence of 0°, 20° and 30°. The raw spectrum of the light source was also captured and used to normalize the transmission spectrum passing through the filter. All acquisitions were captured with an exposure time of 1.15 s.
2.8 Preclinical studies
2.8.1 Verification of biopsy quality
Tissue samples were collected from the lumens of excised murine duodenums using Piranha® biopsy forceps tracked through the fluorescence probe subchannel. Samples were fixed for 30 min in 4% paraformaldehyde, dehydrated overnight in 30% d-sucrose, and then embedded in O.C.T. (optimal cutting temperature) compound. Tissue was cryosectioned to a 10 μm thickness and stained according to a standard hematoxylin and eosin, or H&E, protocol. Following staining, tissue quality assessment was performed by the identification of crypts and villi, fragile but crucial landmark structures within duodenal tissue, via light microscopy.
2.8.2 Detection of fluorescence, Ex vivo, in gastrin CreERT2; ZsGreen models
For preliminary validation of ex vivo fluorescence performance, a study was performed using the previously characterized Gastrin CreERT2; ZsGreen transgenic mouse line (Ding et al., 2021; CMGH). In a cohort of eight mice, a ZsGreen fluorescent reporter was conditionally expressed in gastrin expressing (G) cells by expressing a tamoxifen-inducible Cre recombinase downstream of the human gastrin gene promoter (Gastrin-CreERT2). Beginning at 6-week of age, mice were administered 0.1 ml of 20 mg/ml of tamoxifen for five consecutive days per month for 3 months to induce fluorescent ZsGreen reporter expression in G cells. Following necropsy, the stomach and proximal duodenum were removed, opened along the greater curvature to expose the lumen, and flushed with ice-cold phosphate buffered saline (PBS) prior to imaging.
The imaging system was configured with the distal tip 2–3 cm above samples of ex vivo murine stomach and duodenal tissue. A wide field of view multispectral fluorescence imaging system (MSFI) - reported in detail elsewhere - was also used for image acquisition to provide a high resolution and high sensitivity reference (Lima et al., 2022). To allow for swift, simultaneous imaging of fresh tissue with both instruments, an external light source (Lambda LS, Sutter Instruments, Novato CA) was used to illuminate sections of mouse GI tissue in a Petri dish, and images were captured with both systems using both broadband unfiltered light and 488 nm (Thorlabs, FB560-10) filtered illumination for excitation of ZsGreen. Images were captured and, following increases to brightness and contrast for visualization, fluorescence detection data were overlaid upon the broadband light images to create a composite highlighting the signal-producing regions of the GI tract.
2.8.3 Examination of tissue autofluorescence capabilities
To assess if the device is sufficiently sensitive to collect autofluorescence, a portion of the GI tract from forestomach to duodenum, brain, lung, and pancreatic tissues was excised from healthy, unlabeled wild type mice via necropsy. These specimens were briefly placed on ice in a Petri dish with PBS and fluorescent images were collected with both the multiband fluorescence imaging probe and the (MSFI) System at four distinct wavelengths: 400 nm, 490 nm, 543 nm, and 560 nm, wherein 543 nm serves as the reflectance imaging wavelength and 400 nm, 490 nm, and 560 nm serve as fluorescence emission imaging wavelengths.
3 Results
3.1 Characterization
3.1.1 Slanted-edge modulation transfer function
Analysis of the slanted-edge MTF method yielded the MTF curves shown in Figures 2A–C. The MTF50 of the camera with the filter at 10 mm was 0.10 cycles/pixel, with a cutoff frequency of 0.65 cycles/pixel, so the resolution of the system can be estimated as approximately 4.5 μm. For the camera without the filter, the MTF50 at 10 mm was measured as 0.17 cycles/pixel, with a cutoff frequency of 0.65 cycles/pixel, indicating a resolution of approximately 5.0 μm. Measurements taken for the submerged camera the multiband filter yielded an MTF50 of 0.16 cycles/pixel, a cutoff frequency of 0.65 cycles/pixel, and an approximate resolution of 4.5 μm. For measurements performed of the submerged camera without the filter, the MTF50 was 0.16 cycles/pixel, the cutoff frequency was 0.58 cycles/pixel, and the approximate resolution was 5.0 μm. Figure 2D shows an MTF plot for the device while submerged, showing minor degradation in performance, and Figure 2E shows a raw image captured while underwater.
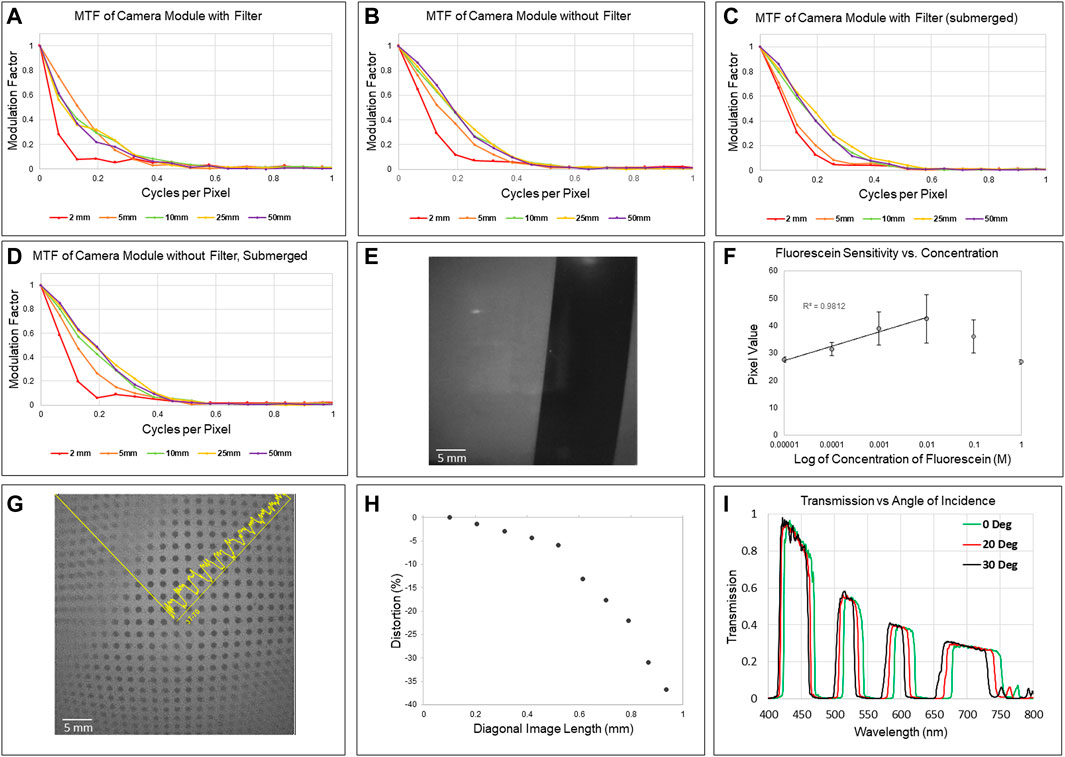
FIGURE 2. (A) MTF plot of miniaturized multiband fluorescence imaging system (camera module with filter) for working distances between 2 mm and 50 mm. (B) MTF plot of miniature camera module without the multiband filter. (C) MTF plot of miniaturized multiband fluorescence imaging system (camera module with filter) submerged in water. (D) MTF plot of miniature camera module without filter submerged in water, and (E) raw image taken of the slant-edge target underwater. (F) Pixel response versus fluorescein concentration for miniaturized multiband fluorescence imaging system. (G) Raw image of distortion target with yellow line used to calculate distortion values superimposed. (H) Distortion plot indication geometric distortion of the miniaturized multiband fluorescence imaging system. (I) Multi-band filter transmission for different angles of incidence, showing a blue-shift in the transmission spectrum.
3.1.2 Fluorescence sensitivity
Detected signal increased with increasing concentration from the lowest concentration, 10–5 M to when signal was maximized at 10–2 M of fluorescein, with this concentration displaying the greatest overall pixel value and highest average. When measured using onboard illumination set to a maximum power output of 1.21 μw at 561+/-10 nm, results from this test support sensitivity to evenly dispersed fluorescein concentrations as low as 10–5 M in a standard 1 cm × 1 cm cuvette, shown in Figure 2F.
3.1.3 Geometric distortion
At the corners of the image, the maximum distortion was measured as -36% deviation from predicted values, the measured curve with local values indicated in Figures 2G, H.
3.1.4 Filter transmission dependence on angle of incidence
Figure 2I shows the filter transmission curves measured at angles of incidence of 0°, 20° and 30°, which constitute the full effective field of view of the system. As expected, there is a blue shift of the transmission spectrum. The shift is approximately 25 nm between the highest blocking band, shifting from 675 nm to 650 nm, and the lowest blocking band from 520 nm to 500 nm. With the selected illumination sources, the filter sufficiently blocks the light, but further optimization of light source and filter characteristics could be done to enable higher throughput.
3.2 Preclinical testing
3.2.1 Biopsy quality verification
The resulting H&E slides were imaged under a light microscope, and analysis of bright-field images confirmed that duodenal biopsies collected with the Piranha biopsy forceps preserved tissue architecture for histological observations. Crypts, villi, and other structural features retained their anatomical features, Figure 3A, allowing for the clear interpretation of tissue orientation which is critical for appropriate pathological analysis.
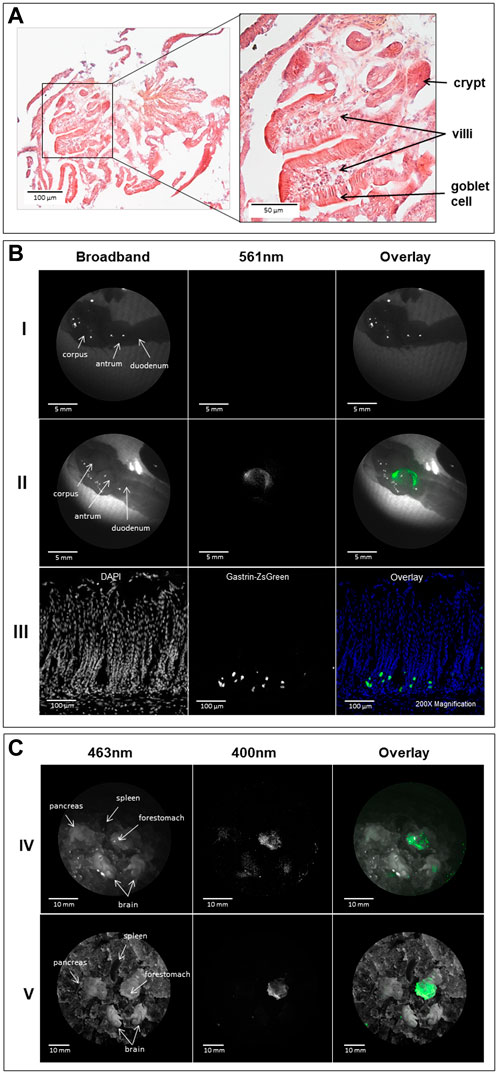
FIGURE 3. (A) H&E-stained slides of biopsy specimens collected by the 3Fr Piranha® forceps, with key duodenal anatomical structures visible. (B) Row (I) depicts an excised wild type murine stomach and duodenum illuminated and imaged using broadband light and 561 nm, with a composite image at the right, as captured by the miniature multispectral system. Row (II) depicts the stomach and duodenum of a transgenic mouse that produces ZsGreen in gastrin-secreting cells. From left to right, the excised sample is illuminated with broadband light and then filtered 561 nm light, and a composite is shown, as captured by the miniature multispectral system. Row (III) depicts a slide cross-section of antral tissue from a ZsGreen-expressing mouse as imaged on a fluorescence microscope. From left to right, the slide is illuminated for DAPI and then ZsGreen, followed by a composite. (C) Row (IV) depicts a sample of tissue excised from a wild type mouse that has been placed in an iced Petri dish and illuminated at 460 nm and then again at 400 nm, as captured by the miniature multispectral system. The rightmost image is a composite of the first two. Row (V) depicts the same sample as the row above as collected by the MSFI system.
3.2.2 Ex vivo fluorescence detection in gastrin CreERT2; ZsGreen models
Images captured of ex vivo murine GI tissue indicate the presence of fluorescence in the antrum of the stomach in transgenic models, where gastrin-secreting G cells are predominantly located. The expression of ZsGreen was additionally confirmed by fluorescence microscopy of cryosectioned antral tissue (Figure 3B), but the signal was not recorded in wild type mice.
3.2.3 Examination of tissue autofluorescence capabilities
Detectable levels of autofluorescence were recorded by the miniature multiband fluorescence imaging system in the forestomaches of unlabeled mice (Figure 3C). This finding was corroborated by high resolution images captured by the external MSFI system. Fluorescent artifacts caused by emitted fluorescent light reflection from the ice bath were noted in images captured with both systems. Tissues were further analyzed using fluorescence microscopy to eliminate the possibility of contamination with exogenous fluorescent moieties, with no evidence of contamination found.
4 Discussion
4.1 Device design and configuration
With the availability of miniature cameras, maximizing their utility is of growing interest. In fluorescence endoscopy, this poses a unique challenge when measuring more than one fluorescent species. In devices with imaging fibers that transmit to a back-end image sensor, filters can be selected to precisely transmit only desirable wavelengths. With distal chip devices, filters must be placed at the front end, just before the camera chip. By incorporating a custom-tuned multiband interference filter, this work demonstrates the utility of distal chip systems to measure wavelengths in multiple bands.
Resulting from the properties by which multiband interference filters block prescribed wavelengths, the angle of incidence. Influences the wavelengths of light that passes through the filter. Illumination parallel to the optical axis (perpendicular to filter substrate) mitigates the effects of this phenomenon, therefore constraining the conditions in which this system can be employed. We discuss strategies for overcoming this in Section 4.2.
At less than 3 mm in diameter, the component that spaces and houses each piece posed a manufacturing challenge. The part called for strict tolerances of less than 50 μm for channels that were 250 μm in diameter and 2 mm in depth to avoid interference between channels and allow for appropriate component fitment. These tolerances and dimensions were found to be too difficult to achieve with machining techniques without resorting to costly and time-consuming methods like wire Electrical Discharge Machine (EDM). One of the simplest alternatives to manufacture designs in swift succession is through 3D printing. Yet, most commercial EDM 3D printers do not possess sufficient resolution to reliably print pieces with through-holes less than one-third of a millimeter in diameter. In contrast, high precision, nano-scale printers created by Nanoscribe are specially designed to print precise 3D structures with a field of view of 140 μm × 140 μm x 140 μm, too small to create this component. Remarkably, it was through a widely available consumer-grade stereolithography (SLA) resin 3D printer (Mars two Pro, Elegoo), with a print resolution of 50 μm, that this housing component was successfully manufactured without interference between channels.
4.2 Characterization
The low system resolution can be attributed to several limitations imposed by both the physical system and test method, which were not representative of diffraction-limited conditions. The miniature camera module, which pushes the limits of present manufacturing capabilities, is generated through the adhesion of a series of optical components that likely result in a degree of aberration. The specific properties of the camera optics are proprietary, and, as such, information regarding performance effects of individual components is unavailable.
The MTF analysis performed indicated that the resolution of the system varied with the distance of the system relative to the object. The MTF was significantly improved within the focal range of the system, and performance was slightly improved in tests conducted without the multiband filter. As a result, measurements taken for all configurations: the camera module with the filter, the camera module without the filter, the submerged camera module with the filter, and the camera module without the filter all indicate lower resolutions at 2 mm. The presence of the multiband filter did not present a marked difference in the MTF and subsequent resolution values of the system.
In instances of geometric distortion, images captured do not reflect the reality of the proportions of objects imaged as a result of a relationship between magnification and height within the optics of the camera module. In this wide-angle camera module, barrel distortion is evident, indicating that objects captured near to the center of the field of view occupy a larger proportion of the overall frame than objects imaged at the periphery. As a result of the difference in magnification with image height, the translation of this device does not appear constant to the user, which may impact the ease of use when operating this system. Standard methods for distortion correction include rectilinear correction, which could be integrated into an automatic post-processing step for improved image quality and ease of use.
This system has demonstrated fluorescence sensitivity, yet the filter and camera were designed independently, sometimes resulting in light leakage through the periphery of the multiband interference filter. Currently, the Osiris M manufacturer is creating a new generation of miniature cameras which boast a smaller pixel size, allowing for larger image capture while retaining a small device footprint. As image quality is of significance for diagnostic or treatment imaging devices, upgrades to increase the image output beyond 320 px x 320 px are desirable. The current generation of these cameras is also limited by spectral response. The cameras are manufactured with an NIRcut filter to prevent erroneous signal from non-visible sources. However, the inclusion of IR wavelengths could enhance the utility of this device beyond its current capacity, as many clinical fluorescent labels emit in the IR range.
At high concentrations, some fluorophores exhibit diminished levels of fluorescence as a result of self-quenching, the process by which intermolecular reactions between identical fluorophores inhibits fluorescent emission (Zhuang et al., 2000). This is likely to account for the significant reduction in fluorescence intensity recorded at concentrations of fluorescein greater than 10–2 M. From fluorescein concentrations of 10–5 to 10–2, the system readout is logarithmic (R2 = 0.98). Although the imaging system successfully detected highly dilute levels of fluorescein during experimental measurements of fluorescence sensitivity, few resources exist to quantify the level of sensitivity a system must possess to adequately perform in biological fluorescence applications, thus additional verification in additional models are requisite.
The filter transmission characteristics suggest that it performs within specifications up to 30° angle of incidence, which is the limiting FOV given the geometry of the filter. Further iterations of the system could include additional lenses to increase the FOV, which would necessarily require optimization of the light sources and filter coatings to accommodate. Laser line illumination would enable a wider range of angles of incidence, as the filter blocking bands could be made sufficiently wide to accommodate for the shift in wavelength of the spectrum.
4.3 Preclinical testing
Experimental results from biopsy collection confirmed that miniature bite biopsy performed with three-Fr Piranha forceps yields meaningful structural information that pathologists use to identify and confirm hyperplastic and dysplastic tissues in regions identified as potentially cancerous, supporting this method as a useful accessory to be applied in tandem with fluorescence imaging.
Images captured of fluorescent ZsGreen signal localized to the antrum support that the miniature multiband fluorescence imaging system is capable of accurately detecting concentrations of fluorescent moieties within labeled tissue. From fluorescent microscopy images, it is evident that only a small number of cells in the antrum, presumably G cells, were producing the fluorescent protein, suggesting that the device is highly sensitive to ZsGreen. This can be further corroborated by the lack of signal detection in the corpus and duodenum, which are not modified to express the fluorescent reporter.
Preliminary animal testing has highlighted the system’s sensitivity to artificial fluorescent markers as in the studies involving ZsGreen expression; however, results from autofluorescence imaging studies have proven the imaging system to be sensitive to the emissions of endogenous fluorophores. Autofluorescence imaging has been clinically employed as a diagnostic pathway for flat GI tumors through endoscopic autofluorescence imaging, supporting its utility in a miniaturized chip-on-tip imaging system (Bi et al., 2021). When comparing images captured by both the high-resolution MSFI and the miniature multiband fluorescence imaging system, the similarity in tissue autofluorescence pattern is marked. However, images captured by the miniature system are more than 200x smaller by number of pixels, and the overall bit depth of the system is much lower at 8 as opposed to 24, resulting in a significant loss of detail. Between the two systems, images from the miniature imaging device possessed more visual artifacts and had a lower signal-to-noise ratio; although, the miniature system also performed with a much shorter exposure window, at just a fraction of a second. With additional adjustments for gain and thresholding, fluorescent regions could be made more discrete. Despite the high optical density, stray light entering the system that exceeds the specified field of view and angle of incidence of the multiband filter can interfere with the image. Integration of a field stop could suppress this effect, or further optimization of the filter or camera optic could be done to enable wide field of view imaging. Signal artifacts were also caused by the ice bath in which tissues were imaged to preserve tissue quality for subsequent histopathology; consequently, the irregular ice particles reflected fluorescence emissions such that the ice itself appeared to emit a signal.
The animal studies performed with the miniature, multispectral fluorescence imaging system indicate its efficacy in targeted fluorescence and autofluorescence detection. The system is currently limited by the availability of few clinical fluorophores outside of the NIR range. However, as more clinical fluorophores are developed that may extend beyond NIR emission range, the multispectral nature of this system enables label versatility within a singular device. Ultimately, the device reported in this manuscript provides a framework that could be adapted to any fluorescence emission spectrum detectable by silicon sensors with relatively minor adjustments to the system by optimizing the filter transmission spectrum.
5 Conclusion
We present the design and characterization of a miniature, handheld, chip-on-tip fluorescence imaging probe with a front-end multiband filter for the imaging of multiple fluorophores with a singular device to aid in the localization of labeled cancerous lesions. Preliminary testing of the imaging system produced viable images of real-time fluorescence while systematically preventing excitatory light from reaching the detector. We have successfully demonstrated the sensitivity of this miniature chip-on-tip multispectral fluorescence imaging system to both labeled and unlabeled fluorescence, and we have verified that the biopsy results are sufficient for histopathology consistent with cancerous tissue assessment. These preliminary results guide synergistic design improvements between this research device and both clinical gastroscopes and upcoming clinical fluorophores for GI cancer diagnostics.
Data availability statement
The raw data supporting the conclusions of this article will be made available by the authors, without undue reservation.
Ethics statement
The animal study was reviewed and approved by IACUC Protocol 18–440 PH S Animal Welfare Assurance Number: D16-00159 (A-3248–01) University of Arizona.
Author contributions
BS designed, constructed and tested the imaging probe, analyzed all data, and developed the manuscript. SD contributed to the preparation of the animal tissues for imaging. RS maintained the animal colony and contributed to tissue preparation. JM and TS provided guidance on experimental design and interpretation of results. All authors contributed to editing and revising the manuscript.
Funding
Research reported in this publication was supported by Institutional Research Grant number IRG-18-161-40 from the American Cancer Society, National Institutes of Health award number GM132008, the National Cancer Institute of the National Institutes of Health under award number P30 CA023074, and the University of Arizona Cancer Center Cancer Engineering Fellowship. NIH R01 DK45729-27 for Juanita Merchant.
Conflict of interest
The authors declare that the research was conducted in the absence of any commercial or financial relationships that could be construed as a potential conflict of interest.
Publisher’s note
All claims expressed in this article are solely those of the authors and do not necessarily represent those of their affiliated organizations, or those of the publisher, the editors and the reviewers. Any product that may be evaluated in this article, or claim that may be made by its manufacturer, is not guaranteed or endorsed by the publisher.
References
Aisu, Y., Yasukawa, D., Kimura, Y., and Hori, T. (2018). Laparoscopic and endoscopic cooperative surgery for gastric tumors: Perspective for actual practice and oncological benefits. World J. Gastrointest. Oncol. 10, 381–397. Baishideng Publishing Group Inc. doi:10.4251/wjgo.v10.i11.381
Bi, Y., Min, M., Cui, Y., Xu, Y., and Li, X. (2021). Research progress of autofluorescence imaging technology in the diagnosis of early gastrointestinal tumors. Cancer 28, 107327482110443–107327482110447. SAGE Publications Ltd. doi:10.1177/10732748211044337
Blumenthal, R. D., Leon, E., Hansen, H. J., and Goldenberg, D. M. (2007). Expression patterns of CEACAM5 and CEACAM6 in primary and metastatic cancers. BMC Cancer 7 (2), 2. BioMed Central. doi:10.1186/1471-2407-7-2
Burns, P. D. (2000). “Slanted-edge MTF for digital camera and scanner analysis,”Syst. Conf. in Soc. Imaging sci. Technol. Image process. Image qual. Image capture.
clinicaltrials (2022). Phase I of SGM-101 in patients with cancer of the colon, rectum or pancreas - full text view - ClinicalTrials.gov. Available at: (April 22, 2022).
European Broadcasting Union (1995). Measurement and analysis of the performance of film and television camera lenses. Geneva, Switzerland.
Figueras, E., Martins, A., Borbély, A., Le Joncour, V., Cordella, P., Perego, R., et al. (2019). Octreotide conjugates for tumor targeting and imaging. Pharm 11, 220. Multidisciplinary Digital Publishing Institute. doi:10.3390/pharmaceutics11050220
Gaab, M. R. (2013). Instrumentation: Endoscopes and equipment. World Neurosurg. 79, S14.e11–e11S14.e21. Elsevier. doi:10.1016/j.wneu.2012.02.032
Galema, H. A., Meijer, R. P. J., Lauwerends, L. J., Verhoef, C., Burggraaf, J., Vahrmeijer, A. L., et al. (2022). Fluorescence-guided surgery in colorectal cancer; A review on clinical results and future perspectives. Eur. J. Surg. Oncol. 48, 810–821. Eur J Surg Oncol. doi:10.1016/j.ejso.2021.10.005
Greivenkamp, J. E. (2009). in Field guide to geometrical optics. Editors F. Guid, and to Geom. Opt SPIE.
Gutowski, M., Framery, B., Boonstra, M. C., Garambois, V., Quenet, F., Dumas, K., et al. (2017). SGM-101: An innovative near-infrared dye-antibody conjugate that targets CEA for fluorescence-guided surgery. Surg. Oncol. 26, 153–162. Elsevier. doi:10.1016/j.suronc.2017.03.002
Jang, J. Y. (2015). The past, present, and future of image-enhanced endoscopy. Clin. Endosc. 48, 466–475. Korean Society of Gastrointestinal Endoscopy. doi:10.5946/ce.2015.48.6.466
Kiekens, K. C., Romano, G., Galvez, Dominique, Cordova, R., Heusinkveld, J., Hatch, Kenneth, et al. (2020). “Reengineering a falloposcope imaging system for clinical use”.
Lee, J. H., and Lee, S.-W. (2017). The roles of carcinoembryonic antigen in liver metastasis and therapeutic approaches. Gastroenterol. Res. Pract. 2017, 7521987. doi:10.1155/2017/7521987
Lima, N., and Sawyer, T. W. (2022). “Design and validation of a multispectral fluorescence imaging system for characterizing whole organ tissue fluorescence and reflectance properties,” in Multiscale imaging spectrosc. III. Editors K. C. Maitland, D. M. Roblyer, and P. J. Campagnola (Bellingham, WA: SPIE).
Matz, G., Messerschmidt, B., Göbel, W., Filser, S., Betz, C. S., Kirsch, M., et al. (2017). Chip-on-the-tip compact flexible endoscopic epifluorescence video-microscope for in-vivo imaging in medicine and biomedical research. Biomed. Opt. Express 8, 3329. Optical Society of America. doi:10.1364/boe.8.003329
McGoran, J. J., McAlindon, M. E., Iyer, P. G., Seibel, E. J., Haidry, R., Lovat, L. B., et al. (2019). Miniature gastrointestinal endoscopy: Now and the future. World J. Gastroenterol. 25, 4051–4060. Baishideng Publishing Group Inc. doi:10.3748/wjg.v25.i30.4051
Meijer, R. J., Valk, K. S. de., Framery, B., Gutowski, M., Pèlegrin, A., Cailler, F., et al. (2020). The clinical translation of a near-infrared fluorophore for fluorescence guided surgery: SGM-101 from the lab to a phase III trial, 11222, 73–78. SPIE. doi:10.1117/12.2555598
Meijer, R. P. J., de Valk, K. S., Deken, M. M., Boogerd, L. S. F., Hoogstins, C. E. S., Bhairosingh, S. S., et al. (2021). Intraoperative detection of colorectal and pancreatic liver metastases using SGM-101, a fluorescent antibody targeting CEA. Eur. J. Surg. Oncol. 47, 667–673. W.B. Saunders. doi:10.1016/j.ejso.2020.10.034
Miller, S. J., Lee, C. M., Joshi, B. P., Gaustad, A., Seibel, E. J., and Wang, T. D.-S. (2012). Targeted detection of murine colonic dysplasia in vivo with flexible multispectral scanning fiber endoscopy. J. Biomed. Opt. 17, 021103. SPIE. doi:10.1117/1.jbo.17.2.021103
Mitja, C., Escofet, J., Tacho, A., and Revuelta, R. (2011). Slanted edge MTF - image J. January 7, 2022).
Nagaya, T., Nakamura, Y. A., Choyke, P. L., and Kobayashi, H. (2017). Fluorescence-guided surgery. Front. Oncol. 7, 314. Frontiers Media S.A. doi:10.3389/fonc.2017.00314
Pang, S., England, R. W., Solomon, A., Hong, K., and Singh, H. (2022). Single-use versus reusable endoscopes for percutaneous biliary endoscopy with lithotripsy: Technical metrics, clinical outcomes, and cost comparison. J. Vasc. Interv. Radiol. 33, 420–426. Elsevier Inc. doi:10.1016/j.jvir.2021.12.028
Singh, R., Owen, V., Shonde, A., Kaye, P., Hawkey, C., and Ragunath, K. (2009). White light endoscopy, narrow band imaging and chromoendoscopy with magnification in diagnosing colorectal neoplasia. World J. Gastrointest. Endosc. 1, 45. Baishideng Publishing Group Inc. doi:10.4253/wjge.v1.i1.45
Sohrt, A., Ehlers, L., Udsen, F. W., Mærkedahl, A., and McGrath, B. A. (2019). Cost comparison of single-use versus reusable bronchoscopes used for percutaneous dilatational tracheostomy. PharmacoEconomics Open 3, 189–195. Springer. doi:10.1007/s41669-018-0091-2
Song, Y.-H., Xu, L.-D., Xing, M.-X., Li, K.-K., Xiao, X.-G., Zhang, Y., et al. (2021). Comparison of white-light endoscopy, optical-enhanced and acetic-acid magnifying endoscopy for detecting gastric intestinal metaplasia: A randomized trial. World J. Clin. cases 9, 3895–3907. Baishideng Publishing Group Inc. doi:10.12998/wjcc.v9.i16.3895
Subramanian, V., and Ragunath, K. (2014). Advanced endoscopic imaging: A review of commercially available technologies. Clin. Gastroenterol. Hepatol. 12, 368–376.e1. Clin Gastroenterol Hepatol. doi:10.1016/j.cgh.2013.06.015
Voigt, J., Seigerman, D., Lutsky, K., Beredjiklian, P., and Leinberry, C. (2021). Comparison of the costs of reusable versus disposable equipment for endoscopic carpal tunnel release procedures using activity-based costing analysis. J. Hand Surg. Am. 46, 339.e1–e1339.e15. W.B. Saunders. doi:10.1016/j.jhsa.2020.08.019
Keywords: endoscopy, oncology, cancer, fluorescence, miniature imaging, multispectral imaging, chip-on-tip
Citation: Slomka B, Duan S, Knapp TG, Lima N, Sontz R, Merchant JL and Sawyer TW (2023) Design, fabrication, and preclinical testing of a miniaturized, multispectral, chip-on-tip, imaging probe for intraluminal fluorescence imaging of the gastrointestinal tract. Front. Photonics 3:1067651. doi: 10.3389/fphot.2022.1067651
Received: 12 October 2022; Accepted: 02 December 2022;
Published: 05 January 2023.
Edited by:
Ben Sherlock, University of Exeter, United KingdomReviewed by:
Xueli Chen, Xidian University, ChinaJulien Bec, University of California, United States
Copyright © 2023 Slomka, Duan, Knapp, Lima, Sontz, Merchant and Sawyer. This is an open-access article distributed under the terms of the Creative Commons Attribution License (CC BY). The use, distribution or reproduction in other forums is permitted, provided the original author(s) and the copyright owner(s) are credited and that the original publication in this journal is cited, in accordance with accepted academic practice. No use, distribution or reproduction is permitted which does not comply with these terms.
*Correspondence: Travis W. Sawyer, tsawyer9226@arizona.edu