 Riccardo Panella1,2*†
 Floriana Zanderigo3†
 Francesca Morandini3Denise Federico3Elena Vicentini3Filippo Andreetta3
 Alessandro Toniolo2Sakari Kauppinen1
- 1Center for RNA Medicine, Department of Clinical Medicine, Aalborg University, Copenhagen, Denmark
- 2Resalis Therapeutics S.r.l., Torino, Italy
- 3Aptuit (Verona) S.r.l., an Evotec Company, Campus Levi-Montalcini, Verona, Italy
microRNA-22 (miR-22) is a key regulator of lipid and energy homeostasis and represents a promising therapeutic target for NAFLD and obesity. We have previously identified a locked nucleic acid (LNA)-modified antisense oligonucleotide compound complementary to miR-22, designated as RES-010 that mediated robust inhibition of miR-22 function in cultured cells and in vivo. In this study we investigated the immune potential of RES-010 in human peripheral blood mononuclear cells (PBMCs). We treated fresh human peripheral blood mononuclear cells isolated from six healthy volunteers with different concentrations of the RES-010 compound and assessed its proinflammatory effects by quantifying IL-1β, IL-6, IFN-γ, TNF-α, IFN-α2a, IFN-β, IL-10, and IL-17A in the supernatants collected 24 h of treatment with RES-010. The T-cell activation markers, CD69, HLA-DR, and CD25 were evaluated by flow cytometry after 24 and 144 h of treatment, respectively, whereas cell viability was assessed after 24 h of treatment with RES-010. Our results show that RES-010 compound does not induce any significant immunostimulatory responses in human PBMCs in vitro compared to controls, implying that the proinflammatory potential of RES-010 is low.
Introduction
Almost 40% of adult Americans and Europeans (Craig et al., 2019) were described as overweight in 2018 and about 13% of the entire world’s adult population was considered obese, numbers which have nearly tripled since 1975 (Database, 2022). Three of the top ten causes of death (ischemic heart disease, stroke, and diabetes mellitus) are directly correlated with obesity, which is therefore defined by WHO as the primary preventable cause of death and is considered the fifth leading cause of death in western countries. Particularly worrying is the epidemic of childhood obesity (Rice and Steiner, 2016); in 2016, approximately 42 million children under the age of five were considered overweight and over 340 million children and adolescents under the age of 20 were overweight or obese (Database, 2022). Additionally, morbid and often fatal obesity is a central manifestation of genetic disorders such as the Prader-Willi Syndrome (Butler, 2011). Fat accumulation depends on the balance between anabolic processes (such as adipogenesis) (Esteve Rafols, 2014) and catabolic processes (such as thermogenesis) (Fenzl and Kiefer, 2014).
MicroRNAs (miRNAs) are short endogenous non-coding RNAs, about ∼22 nucleotides in length, that function as post-transcriptional regulators of gene expression by repressing protein translation and promoting mRNA cleavage (Bartel, 2009). MiR-22 has been identified as a key regulator of lipid and metabolic homeostasis (Kaur et al., 2011; Wang et al., 2020), which functions by orchestrating multiple gene regulatory networks including lipid biosynthesis (Koufaris et al., 2016; Yang et al., 2021; Lopez-Riera et al., 2017; Yang et al., 2012; Zou et al., 2019), mitochondria biogenesis and brown adipose tissue differentiation (Fenzl and Kiefer, 2014; Lou et al., 2021). Furthermore, the levels of miR-22 are increased during human adipocyte differentiation and in white adipose tissue (WAT) from obese human subjects compared to WAT obtain from lean subjects. Taken together, these data highlight miR-22 as a potential therapeutic target for the treatment of obesity, fatty liver disease (NAFLD) and non-alcoholic steatohepatitis (NASH) (Thibonnier et al., 2020; Lima et al., 2021; Hu et al., 2020).
Pharmacologic inhibition of miRNAs can be achieved using single-stranded, chemically modified antisense oligonucleotides (ASOs) (Exiqon et al., 2013; Quemener et al., 2022) designated as antimiRs. The use of antimiRs to manipulate miRNA levels has shown promise in the treatment of a wide variety of human diseases ranging from inflammation and viral infections to cancer and metabolism (Esau et al., 2006; Straarup et al., 2010; Obad et al., 2011; Stenvang et al., 2012; Beck et al., 2021) We have previously screened a library of LNA-modified (Funder et al., 2020; Roberts et al., 2020; Romero-Palomo et al., 2021) antimiR oligonucleotide compounds targeting miR-22 and identified compound named RES-010, which mediated potent, dose-dependent inhibition of miR-22 in cell culture and in vivo. In this study we assessed the immune potential of RES-010 in human peripheral blood mononuclear cells (PBMCs) isolated from healthy volunteers as part of a series of preclinical studies aimed to assess the safety and tolerability (Minnaert et al., 2021; Walsh et al., 2020) of RES-010 as potential miR-22 targeted drug for the treatment of obesity and metabolic disorders.
Results and discussion
MiR-22 functions as an essential regulator of lipid and metabolic homeostasis and represents a promising target for miRNA-based therapy for obesity, NAFLD and NASH. We have previously identified a potent LNA-modified antimiR compound, RES-10, for pharmacologic inhibition of miR-22 function. To assess the immune potential of RES-010 in human PBMCs, we first quantified eight cytokines (IL-1β, IL-6, IFN-γ, TNF-α, IFN-α2a, IFN-β, IL-10 and IL-17A) in the supernatants of PBMCs collected from six donors after 24 h of treatment with RES-010. Results obtained in PBMCs from all donors after treatment with positive control and with RES-010, normalized with respect to the corresponding vehicle, are reported in Tables 1–8 and are represented in Figures 1A–H whereas the concentration data for each analyte are listed in Supplementary Table S1. All the positive controls tested were efficient in inducing IFN-γ, IL-1β, IL-6, TNF-α, IL-10. Imiquimod treatment induced only IFN-α2a and IFN-β, while T-cell transact induced only IL-17A. By comparison, the levels of the assessed cytokines after treatment with RES-010 at five different concentrations were very low in all donors with most values being below level of quantification and with a slight induction was observed only for IFN-γ. None of the measured cytokines were statistically significantly different compared with the respective vehicle (Supplementary Table S2). Also, the trend analysis does not show any statistically significant differences.
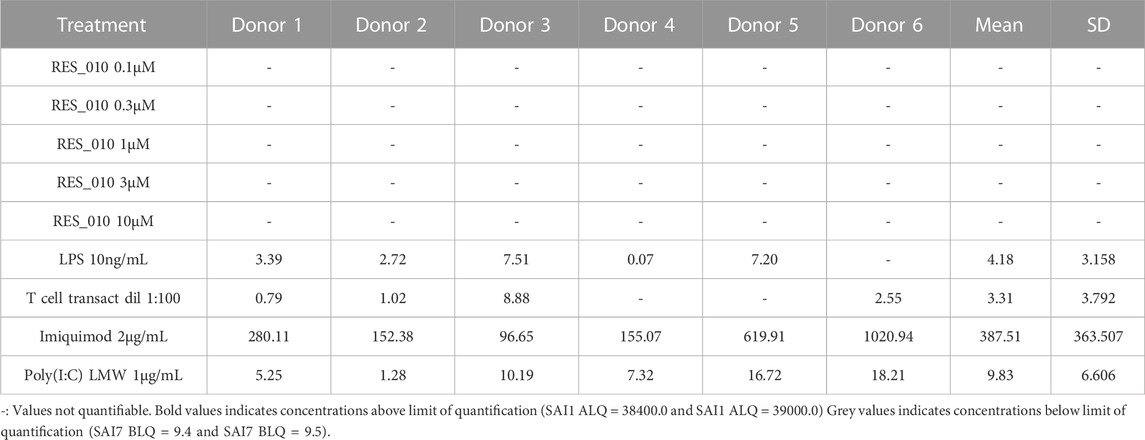
TABLE 1. Concentration Data Vehicle Corrected (pg/mL) for Cytokine IFN-α-2a.
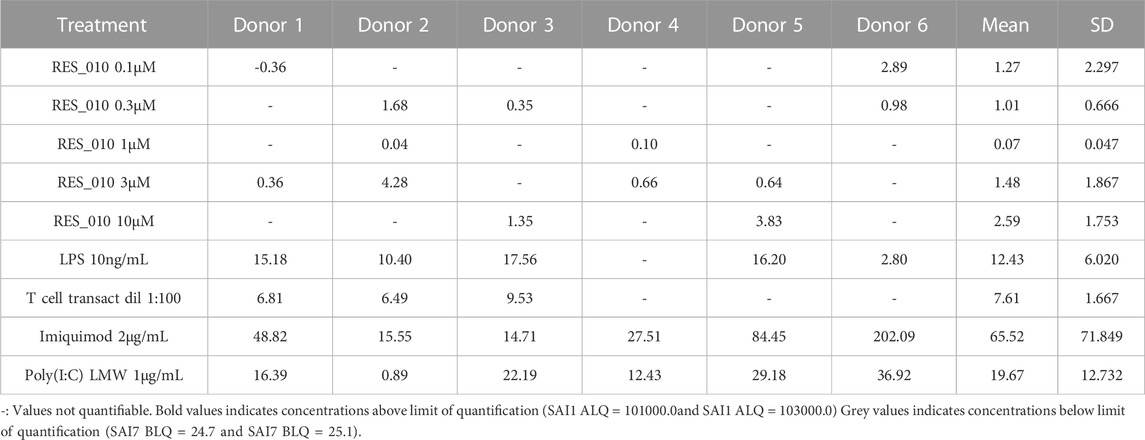
TABLE 2. Concentration Data Vehicle Corrected (pg/mL) for Cytokines: IFN-β.
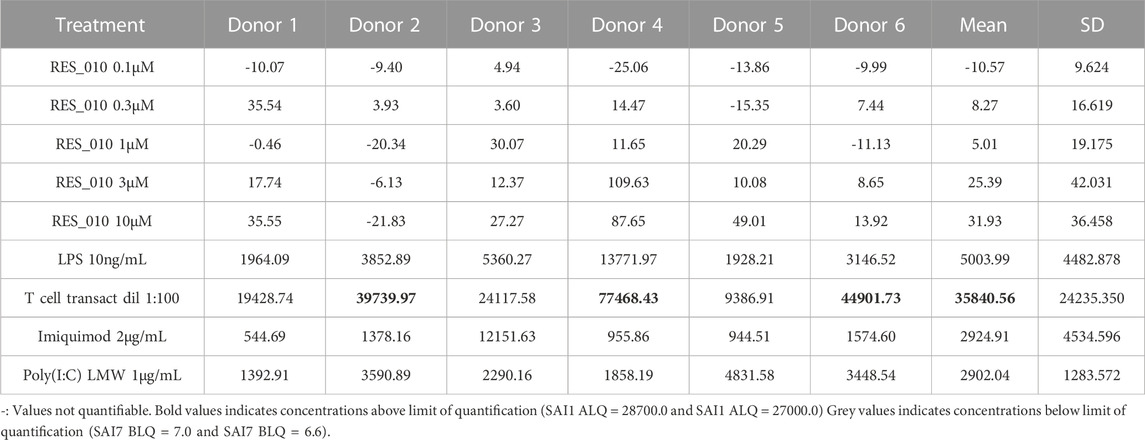
TABLE 3. Concentration Data Vehicle Corrected (pg/mL) for Cytokines: IFN-γ.
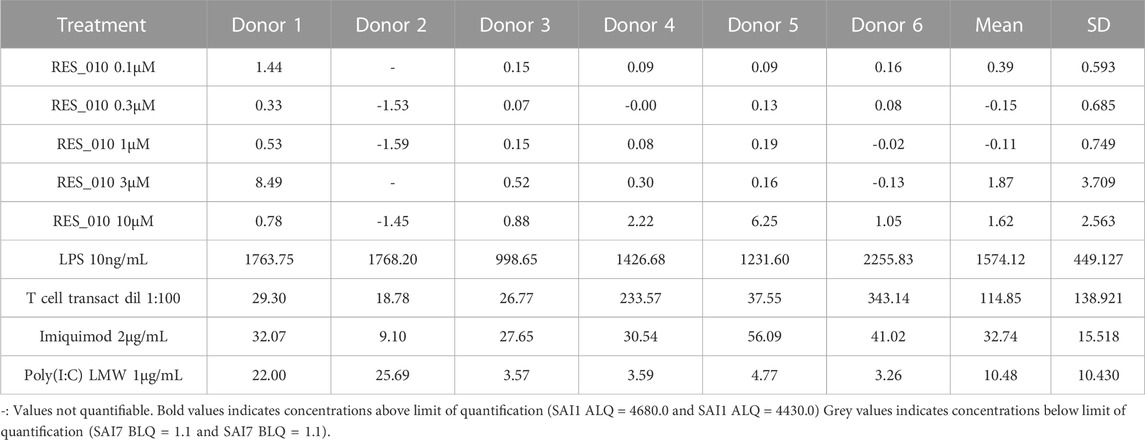
TABLE 4. Concentration Data Vehicle Corrected (pg/mL) for Cytokines: IL-1 β.
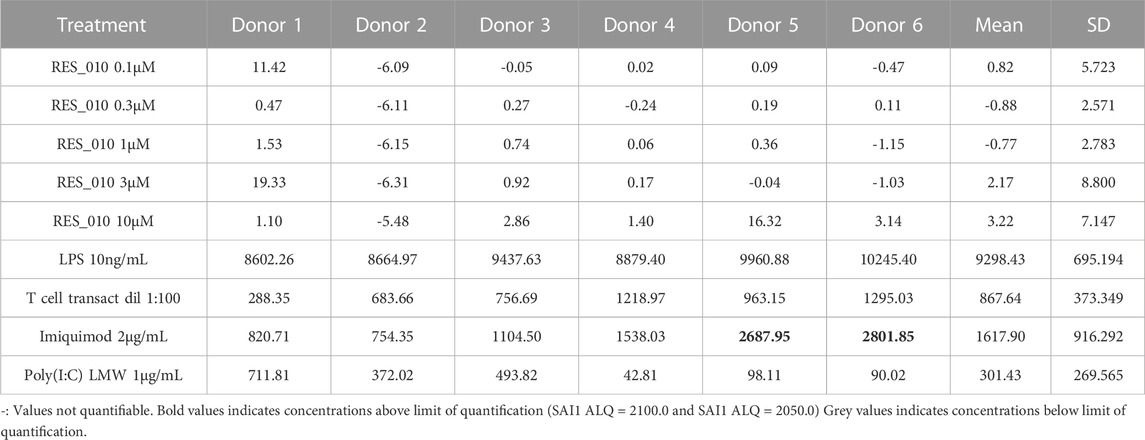
TABLE 5. Concentration Data Vehicle Corrected (pg/mL) for Cytokines: IL-6.

TABLE 6. Concentration Data Vehicle Corrected (pg/mL) for Cytokines: TNF α.
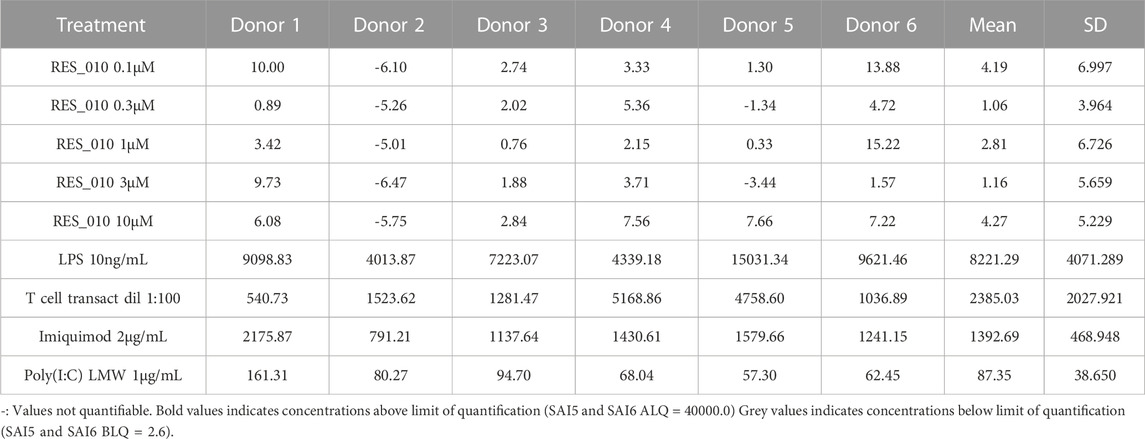
TABLE 7. Concentration Data Vehicle Corrected (pg/mL) for Cytokines: IL-10.
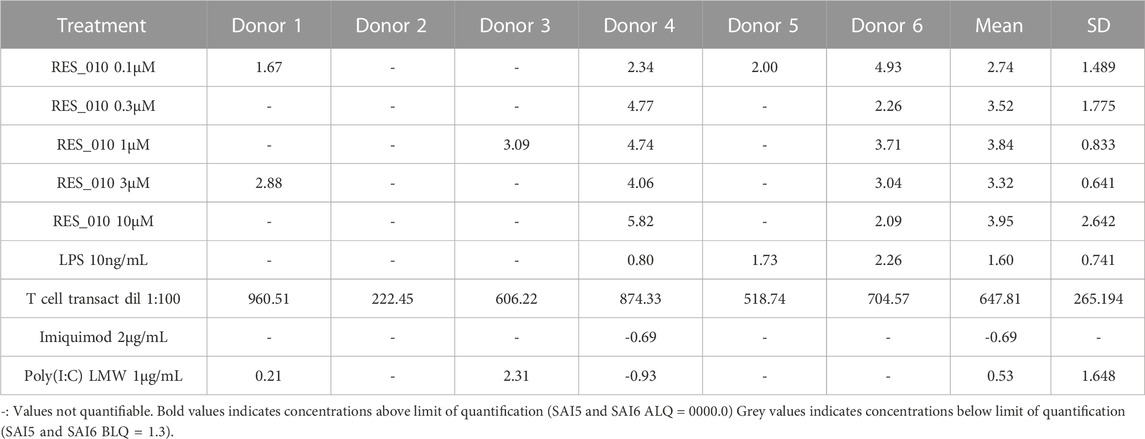
TABLE 8. Concentration Data Vehicle Corrected (pg/mL) for Cytokines: IL-17A.
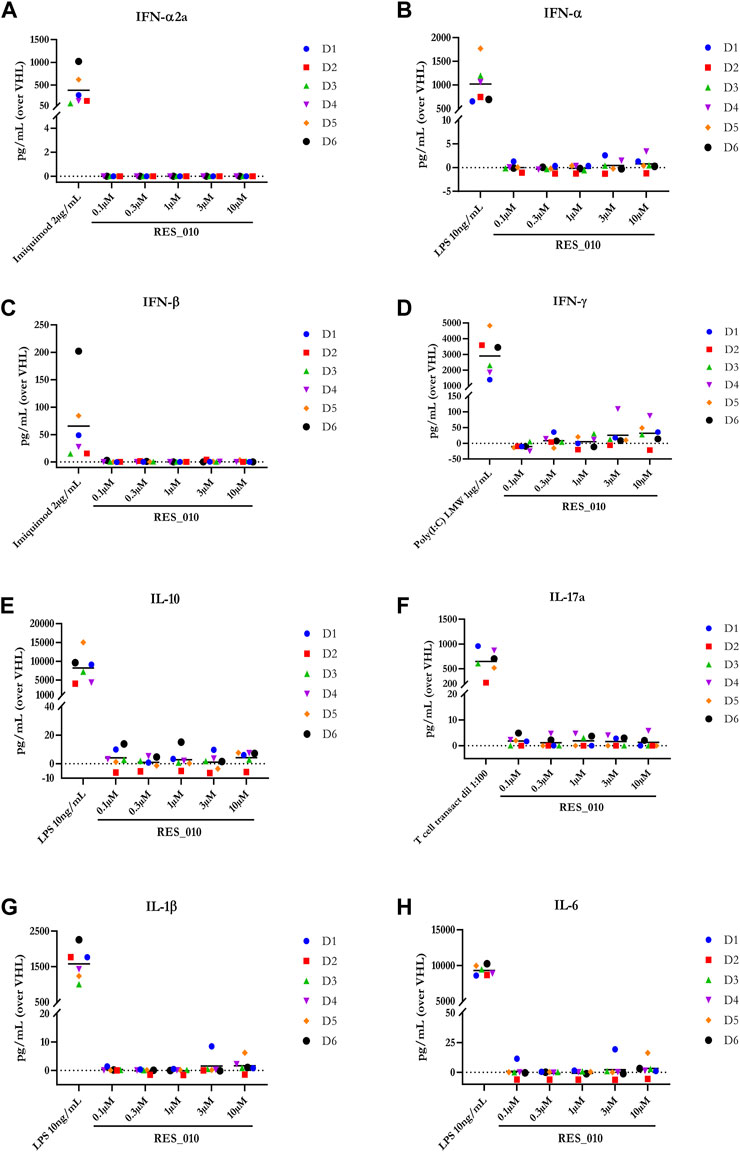
FIGURE 1. Cytokine levels after treatment of human PBMCs with RES-010. Data from individual donors are represented as median of technical triplicates, while the solid line represents the median of the entire group. Each graph represents data for a single cytokine after stimulus with positive control or with RES-010 at different concentrations. The analyzed cytokiens are; (A) IFN α-2a, (B) IFN-α, (C) IFN-β, (D) IFN-γ, (E) IL-10, (F) IL-17α, (G) IL1-β, and (H) IL-6.
Next, we investigated the effect of RES-010 on cell viability 24 h after the addition of RES-010 to the media using the CellTiter-Glo® assay. Results obtained after normalization are represented in Figure 2A and reported in Supplementary Table S3 with the relevant statistically significance presented in Supplementary Table S4. Reduction of cell viability after treatment with Doxorubicin positive control was evident in all donors compared to the DMSO vehicle treated samples, whereas treatment with RES-010 did not affect cell viability compared to vehicle control.
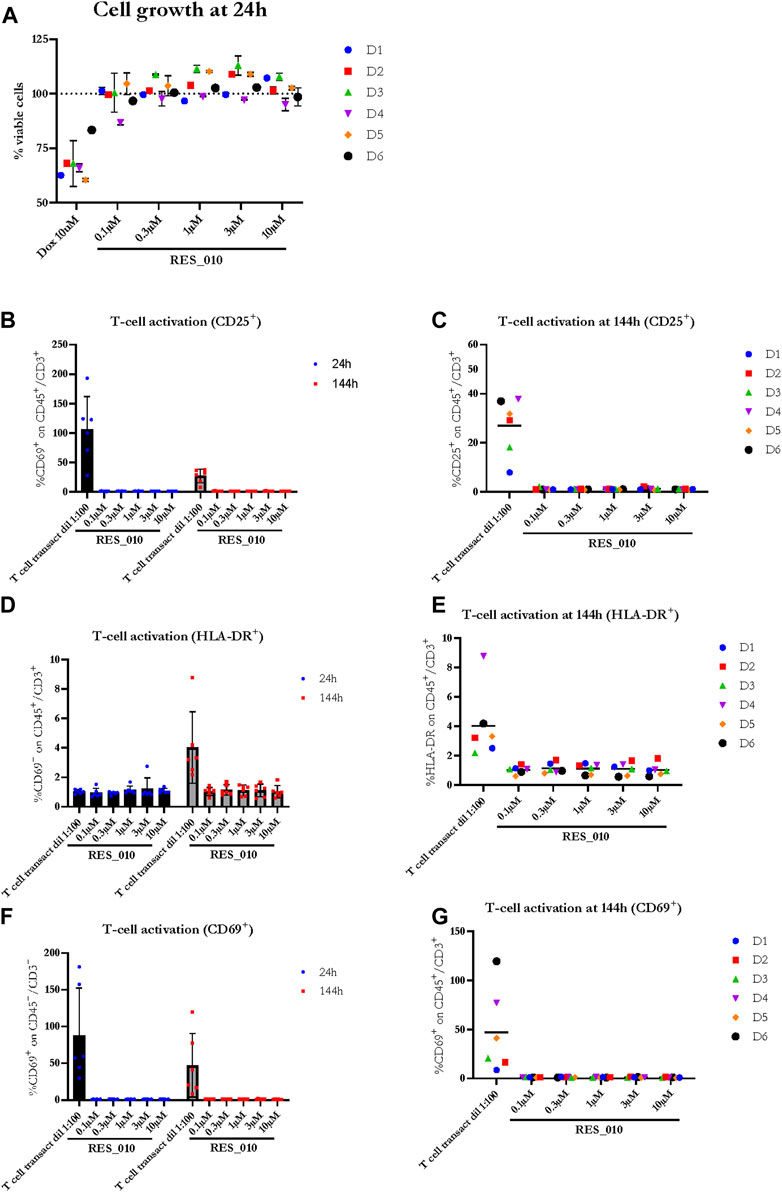
FIGURE 2. The effect of RES-010 on cell viability and T-cell activation. Cell viability for each one of the donors 24 h after RES_010 treatment is reported in (A). (B,D,F) represent the cumulative data on % of CD69, HLA-DR and CD25 positive cells respectively on the total CD45/CD3 double positive portion at both 24 and 144 h after RES_010 treatment. (C,E,G) represent data at 144 h for single donors.
To investigate the effect of RES-010 treatment on T-cell proliferation, we analyzed two parameters for each of the T-cell activation marker, CD69, HLA-DR, CD25; 1) the geometric mean of the marker as measured by MFI, and 2) percentage of marker among the CD3+CD45+ T lymphocyte population. Each parameter was analyzed after 24 and at 144 h of treatment to better understand the kinetic on a possible pro-inflammatory activity. The results are summarized in Supplementary Table S5. The percentage of CD 25 activation is shown in Figures 2B, C while HLA-DR activation is reported in Figure 2D, E and CD69 activation is represented in Figures 2F, G. For each activation marker parameter analyzed, no dose-dependent effect of RES-010 is observed following the increase of RES-010 concentration. The trend for each donor was linear and none of the normalized values differ from the untreated controls remaining between 0.5 and 2 times the variation. The average fold change measured in six donors for each RES-010 concentration as shown by the Geometric mean for all the analyzed marked was between 0,89 and 1,20 for the 24 hour-time point and between 0,89 and 1,33 at the 144-hour time point post treatment (Figures 2B–F; Supplementary Figures S1G–H). Specifically at 24 h (Supplementary Figures S1A–F), CD69 varied between 1.02 and 1.09; HLA-DR values were between 0.96 and 1.00 and CD25 was 1.00. Treatment with RES-010 for 144 h resulted in CD69 values were between 1.03 and 1.06, HLA-DR varied between 1.01 and 1.05 and CD25 values were between 0.89 and 0.96 as show in Figures 2C, E, G. The T-cell transact treatment showed an increase of all the analyzed markers after 24 and 144 h of treatment, except for Geo Mean and % of HLA-DR, which are only weakly activated after 144 h (Figures 2B, D, F; Supplementary Figures S1J–L).
The Geo Mean for CD25, HLADR and CD69 and percentage of CD25 positive, HLADR positive and CD69 positive T Lymphocytes were subsequently selected for statistical analysis. For each parameter, a linear mixed model with Dunnett’s post hoc test was used to test at each timepoint the treatment effect versus the vehicle group. Estimated mean differences from vehicle and of p-values are reported in Table 9. No significant effects on T-cell proliferation were observed for RES-010.
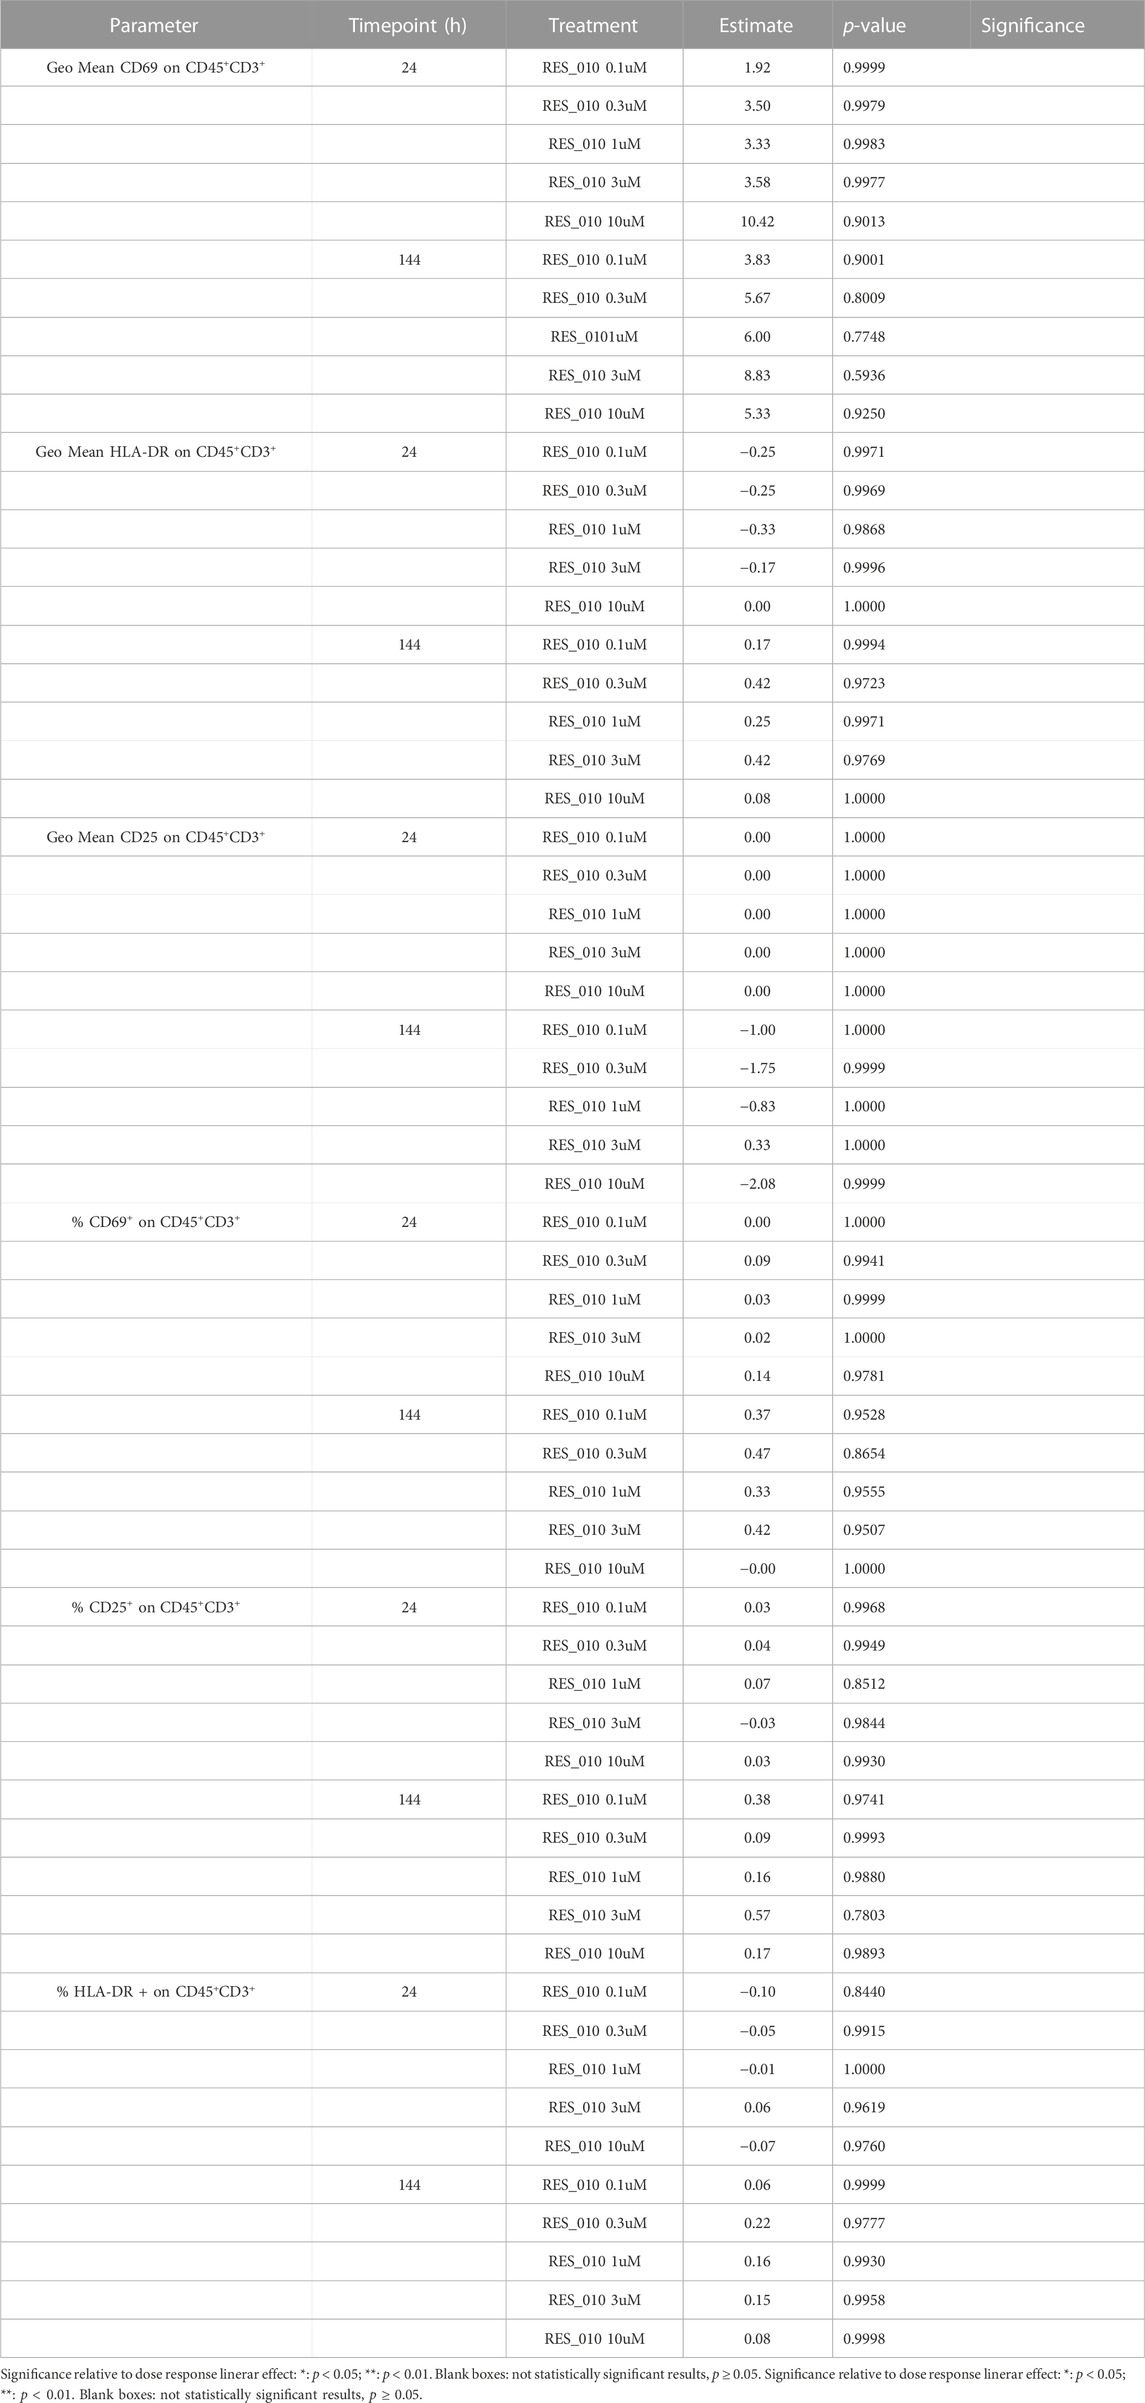
TABLE 9. Statistical Result of Compound Effect vs. Vehicle.
Taken together, the data presented here show that RES-010 compound does not induce any significant immunostimulatory responses in human PBMCs in vitro compared to controls. Moreover, activation of T lymphocytes was assessed after approximately 24 and 144 h of treatment with RES-010 in the whole blood of six donors by evaluating the expression of markers CD25, CD69 and HLA DR by flow cytometry. None of the activation markers were statistically significantly increased after treatment with RES-010 indicating the immune potential of the RES-010 compound is low. The presented data are supporting further clinical development for RES-010 considering its high efficacy in modulating miR-22 levels and it reduced ability to activate any immune response.
Materials and methods
PBMC stimulation
Human PBMCs were isolated by Ficoll gradient centrifugation (Ficoll Plus 1.077 Cytiva Cat#17144003) starting from whole blood of six healthy donors upon blood collection in Sodium Heparin Vacutainer. In Evotec Verona Site an internal procedure regarding the blood donation from volunteer employees is applied. This procedure has been approved by an external Ethical Committee and includes a written informed consent which has to be signed for each donation. PBMCs were cultured for up to 6 days in 96-well plates at a density of 0.75 × 10⁶ cells/mL in a total volume of 200 μL, using supplemented RPMI-1640 medium (RPMI 1640 Medium, GlutaMAX™ Supplement Gibco Cat#61870-01010% FBS HI Gibco Cat#10500-064) and incubated at 37°C in a humidified, 5% CO2 atmosphere. 7.5 × 10 (Esteve Rafols, 2014) PBMCs of each donor were seeded in 96-well plate and treated with RES-010 at five different concentrations: 0.1, 0.3, 1.0, 3.0, or 10 μM, respectively, or with positive controls: LPS at 10 ng/mL (Sigma-Aldrich, Cat. N. L4399), T cell-transact diluted 1:100 (Miltenyi Biotec, Cat. N. 130-111-160), Imiquimod at 2 μg/mL (Invivogen, Cat. N. tlrl-imq) or Poly(I:C) LMW at 1 μg/mL (Invivogen, Cat. N. tlrl-picw).
In parallel to the stimuli describe above, the relative vehicle substances were also tested as negative controls, specifically NaCl 0.9% was used as vehicle control for all RES-010 treated samples, PBS (DPBS Sigma-Aldrich Cat#D8537) was used for LPS and T cell transact treatment and water was the vehicle for imiquimod and Poly(I:C) LMW samples. Additionally, Doxorubicin (Tocris, Cat. N. 2252) was tested at 10 μM to induce cell death as control for cellular viability assay. All the stimuli and vehicle substances were tested in biological duplicates.
The stimulated cells were cultured at 37°C 5% CO2 for approximately 24 and/or 144 h depending on the assay. Two independent plates were used for the two time points.
Cytokine analysis
After approximately 24 h of stimulation, cell culture supernatants were collected and stored in aliquots at −80°C for cytokine analysis. Supernatants isolated from PBMCs stimulated with doxorubicin and its vehicle (DMSO) were not used for cytokine assays, since this stimulus was a cell death control for the CellTiter-Glo® assay (Promega, Cat. N. G7572).
The cytokines IL-1β, IL-6, IFN-γ, TNF-α, IFN-α2, and IFN-β were analyzed using the MSD kit U-PLEX Biomarker Group 1 (MesoScale Discovery (MSD), Cat. N. K15067L-1). IL-10, IL-17A were analyzed using the Millipore kit Human Cytokine/Chemokine/Growth Factor Panel A Magnetic Bead Panel (EMD Millipore, Cat. N. HCYTA-60K).
Each biological duplicate, collected after PBMC stimulation, was analyzed in a single well. Raw data for IL-1β, IL-6, IFN-γ, TNF-α, IFN-α2, and IFN-β analysis were generated using MSD Discovery Workbench software platform. Concentrations for these analytes were determined from the appropriate standard curve according to the manufacturer’s instructions. Raw data for IL-10, IL-17A analysis were generated using Luminex® Array Suspension System platform. Concentrations for these analytes were determined from the appropriate standard curve according to the manufacturer’s instructions by using SAS.
For each stimulus, the concentration of each analyte obtained from both replicates was normalized (by subtraction) for the mean concentration value of the corresponding vehicle. For each analyte, mean normalized value for each donor was represented using SAS. All data obtained from MSD and Luminex platform were included in the graph (even the values extrapolated by the software below the detection range).
Analytes with estimable concentrations, above the lower limit of quantification, were considered for statistical evaluation.
Cell viability analysis
Cell viability was assessed after approximately 24 h from stimulation following the CellTiter-Glo® (Promega, Cat. N. G7572) reagent instruction manual. For this analysis the cells were treated with Doxorubicin to induce cell death as positive control and with DMSO as the corresponding vehicle. Raw data (RLU) for cell viability analysis was generated by the luminometer CLARIOstar (BMGLabtech). Mean raw data obtained from medium sample was subtracted from all values obtained from the stimulated samples and corresponding vehicle. Mean vehicle values were then used for the normalization of the corresponding stimuli (stimulus/vehicle raw data%).
Mean normalized value for each donor were represented using SAS.
Raw data were used for statistical evaluation.
T-Cell activation analysis
Activation of T lymphocytes was assessed after approximately 24 or 144 h of treatment by evaluating the expression of markers such as CD25, CD69 and HLA DR by Flow Cytometry. To this end, 105 PBMCs were stained with CD45-PE-Vio770 (Miltenyi Biotec, Cat. N. 130-110-634)and CD3-APC (Miltenyi Biotec, Cat. N. 130-113-135)to select the total population of T-cells and with CD25 APC-Vio770 (Miltenyi Biotec, Cat. N. 130-123-469), CD69-PE (Miltenyi Biotec, Cat. N. 130-112-613) and HLA-DR PerCP-Vio700 (Miltenyi Biotec, Cat. N. 130-111-793) for cell activation assessment. T-cell activation was assessed using BD FACSVerse cytometer. The results and statistical parameters for each activation marker were expressed as geometric mean (MFI) for CD69, HLA-DR and CD 25 markers in the CD45+CD3+ cells as well as % of CD69HLA-DR and CD25 positive cells among CD45+CD3+ population
Each parameter was analyzed after approximately 24 and at 144 h of RES-010 treatment. Raw data derived from post-treatment of in vitro whole blood from six donors, as well as from all vehicles, were reported: four positive controls (Imiquimod, Poly (I:C) LMW, LPS and T cell transact) and five concentrations of compound (0.1, 0.3, 1, 3, and 10 µM). Furthermore, each raw data represented the average of the two biological replicates. All data were normalized with respect to its own vehicle by performing a ratio between treated and vehicle (fold change results).
The difference between the treatment groups and the vehicle was tested for each parameter using linear mixed model with Dunnett’s test.
Statistical analysis
Linear mixed model with treatment as fixed effect and subject as random effect followed by Dunnnett’s test was performed to evaluate the compound differences versus the respective vehicle. Additional linear trend test was applied on IFNγ, IL-6 and IL-10 cytokines results to verify a dose response effect. P- values lower than 0.05 was considered statistically significant. Statistical analysis was performed using SAS software (version 9.4 SAS Institute, Cary, NC, United States).
Data availability statement
The original contributions presented in the study are included in the article/Supplementary Material, further inquiries can be directed to the corresponding author.
Ethics statement
The studies involving human participants were reviewed and approved by the Comitato ETICO Ufficio di Segreteria Tecnico-Scientifica del Comitato Etico per la Sperimentazione Clinica delle Province di Verona e Rovigo Azienda Ospedaliera Universitaria Integrata Verona c/o UOC Farmacia Ospedale Civile Maggiore p.le A. Stefani, 1 37126 Verona Ufficio ASL: Segreteria tecnico-scientifica del Nucleo per la Ricerca Clinica c/o UOS Ricerca Clinica e Valutazione Farmaci - Responsabile Dr.ssa Roberta Joppi via Salvo d’Acquisto n. 7 - 37122 Verona tel. 045 807 6057. Written informed consent for participation was not required for this study in accordance with the national legislation and the institutional requirements.
Author contributions
RP and SK developed and provided the RES-010 compound and designed the experiments along with FM, FZ, and DF executed the experiments, collected and analyzed data. EV, FA, AT, SK, and RP interpreted the data and co-wrote the manuscript along with FZ and SK.
Conflict of interest
RP is founder, shareholder and member of the board of directors of Resalis Therapeutics srl, a biotech company developing non-coding RNA-targeted therapeutics for metabolic diseases. SK is founder and shareholder of Resalis Therapeutics srl. RP and SK are inventors of patents and patent applications related to miR-22 in cancer and metabolism, owned by Beth Israel Deaconess Medical Center and Aalborg University and licensed to Resalis Therapeutics srl. AT Is CEO and shareholder of Resalis Therapeutics. FZ; FM; DF; EV and FA are employed at Aptuit.
Publisher’s note
All claims expressed in this article are solely those of the authors and do not necessarily represent those of their affiliated organizations, or those of the publisher, the editors and the reviewers. Any product that may be evaluated in this article, or claim that may be made by its manufacturer, is not guaranteed or endorsed by the publisher.
Supplementary material
The Supplementary Material for this article can be found online at: https://www.frontiersin.org/articles/10.3389/fphar.2023.1125654/full#supplementary-material
SUPPLEMENTARY FIGURE S1 | (related to Figure 2) The effect of RES-010 on T-cell proliferation (A-C) Represent the values in % of CD69, HLA-DR and CD25 positive cells from individual donors respectively on the total CD45/CD3 double positive portion 24 h after treatment with RES-010. (D–F) Represent the geometric mean values of CD69, HLA-DR, and CD25 positive cells respectively from individual donors on the total CD45/CD3 double positive portion at 24 h after treatment with RES_010 (G–I) Represent the geometric mean values of CD69, HLA-DR, and CD25 positive cells respectively from individual donors on the total CD45/CD3 double positive portion 144 h after treatment with RES_010 (J–L) Show the comparison between marker activation 2 and 144 h after RES-010 treatment, respectively.
References
Bartel, D. P. (2009). MicroRNAs: Target recognition and regulatory functions. Cell 136, 215–233. doi:10.1016/j.cell.2009.01.002
Beck, J. D., Reidenbach, D., Salomon, N., Sahin, U., Tureci, O., Vormehr, M., et al. (2021). mRNA therapeutics in cancer immunotherapy. Mol. Cancer 20, 69. doi:10.1186/s12943-021-01348-0
Butler, M. G. (2011). Prader-willi Syndrome: Obesity due to genomic imprinting. Curr. Genomics 12, 204–215. doi:10.2174/138920211795677877
Craig, M., Hales, M. D. M. D. C. M. S. P. H. C. D. F. M. S. P. H., Cynthia, L., and Ogden, P. D. (2019). Prevalence of obesity among adults and youth: United States, 2017–2018. Hyattsville Maryland: NCHS Data Brief No.288 288
Esau, C., Davis, S., Murray, S. F., Yu, X. X., Pandey, S. K., Pear, M., et al. (2006). miR-122 regulation of lipid metabolism revealed by in vivo antisense targeting. Cell Metab. 3, 87–98. doi:10.1016/j.cmet.2006.01.005
Esteve Rafols, M. (2014). Adipose tissue: Cell heterogeneity and functional diversity. Endocrinol. Nutr. 61, 100–112. doi:10.1016/j.endonu.2013.03.011
Exiqon, J., Lindow, M., Silahtaroglu, A., Bak, M., Christensen, M., and Lind-Thomsen, A. (2013). Antagonism of microRNA-122 in mice by systemically administered LNA-antimiR leads to up-regulation of a large set of predicted target mRNAs in the liver. Nucleic Acids Res, 2008. doi:10.1093/nar/gkm1113
Fenzl, A., and Kiefer, F. W. (2014). Brown adipose tissue and thermogenesis. Horm. Mol. Biol. Clin. Investig. 19, 25–37. doi:10.1515/hmbci-2014-0022
Funder, E. D., Albaek, N., Moisan, A., Sewing, S., and Koch, T. (2020). Refining LNA safety profile by controlling phosphorothioate stereochemistry. PLoS One 15, e0232603. doi:10.1371/journal.pone.0232603
Hu, Y., Liu, H. X., Jena, P. K., Sheng, L., Ali, M. R., and Wan, Y. J. Y. (2020). miR-22 inhibition reduces hepatic steatosis via FGF21 and FGFR1 induction. JHEP Rep. 2, 100093. doi:10.1016/j.jhepr.2020.100093
Kaur, K., Pandey, A. K., Srivastava, S., Srivastava, A. K., and Datta, M. (2011). Comprehensive miRNome and in silico analyses identify the Wnt signaling pathway to be altered in the diabetic liver. Mol. Biosyst. 7, 3234–3244. doi:10.1039/c1mb05041a
Koufaris, C., Valbuena, G. N., PomYen, Y., Tredwell, G. D., NevEdomskaya, E., Lau, C. H., et al. (2016). Systematic integration of molecular profiles identifies miR-22 as a regulator of lipid and folate metabolism in breast cancer cells. Oncogene 35, 2766–2776. doi:10.1038/onc.2015.333
Lima, V. M., Liu, J., Brandao, B. B., Lino, C. A., Balbino Silva, C. S., Ribeiro, M. A. C., et al. (2021). miRNA-22 deletion limits white adipose expansion and activates Brown fat to attenuate high-fat diet-induced fat mass accumulation. Metabolism 117, 154723. doi:10.1016/j.metabol.2021.154723
Lopez-Riera, M., Conde, I., Tolosa, L., Zaragoza, A., Castell, J. V., Gomez-Lechon, M. J., et al. (2017). New microRNA biomarkers for drug-induced steatosis and their potential to predict the contribution of drugs to non-alcoholic fatty liver disease. Front. Pharmacol. 8, 3. doi:10.3389/fphar.2017.00003
Lou, P., Bi, X., Tian, Y., Li, G., Kang, Q., Lv, C., et al. (2021). MiR-22 modulates Brown adipocyte thermogenesis by synergistically activating the glycolytic and mTORC1 signaling pathways. Theranostics 11, 3607–3623. doi:10.7150/thno.50900
Minnaert, A. K., Vanluchene, H., Verbeke, R., Lentacker, I., De Smedt, S. C., Raemdonck, K., et al. (2021). Strategies for controlling the innate immune activity of conventional and self-amplifying mRNA therapeutics: Getting the message across. Adv. Drug Deliv. Rev. 176, 113900. doi:10.1016/j.addr.2021.113900
Obad, S., dos Santos, C. O., Petri, A., Heidenblad, M., Broom, O., Ruse, C., et al. (2011). Silencing of microRNA families by seed-targeting tiny LNAs. Nat. Genet. 43, 371–378. doi:10.1038/ng.786
Quemener, A. M., Centomo, M. L., Sax, S. L., and Panella, R. (2022). Small drugs, huge impact: The extraordinary impact of antisense oligonucleotides in Research and drug development. Molecules 27, 536. doi:10.3390/molecules27020536
Rice, G. M., and Steiner, R. D. (2016). Inborn errors of metabolism (metabolic disorders). Pediatr. Rev. 37, 3–15. doi:10.1542/pir.2014-0122quiz 16-17
Roberts, T. C., Langer, R., and Wood, M. J. A. (2020). Advances in oligonucleotide drug delivery. Nat. Rev. Drug Discov. 19, 673–694. doi:10.1038/s41573-020-0075-7
Romero-Palomo, F., Festag, M., Lenz, B., Schadt, S., Brink, A., Kipar, A., et al. (2021). Safety, tissue distribution, and metabolism of LNA-containing antisense oligonucleotides in rats. Toxicol. Pathol. 49, 1174–1192. doi:10.1177/01926233211011615
Stenvang, J., Petri, A., Lindow, M., Obad, S., and Kauppinen, S. (2012). Inhibition of microRNA function by antimiR oligonucleotides. Silence 3, 1. doi:10.1186/1758-907x-3-1
Straarup, E. M., Fisker, N., Hedtjarn, M., Lindholm, M. W., Rosenbohm, C., Aarup, V., et al. (2010). Short locked nucleic acid antisense oligonucleotides potently reduce apolipoprotein B mRNA and serum cholesterol in mice and non-human primates. Nucleic Acids Res. 38, 7100–7111. doi:10.1093/nar/gkq457Epub 2010 Jul 8
Thibonnier, M., Esau, C., Ghosh, S., Wargent, E., and Stocker, C. (2020). Metabolic and energetic benefits of microRNA-22 inhibition. BMJ Open Diabetes Res. Care 8, e001478. doi:10.1136/bmjdrc-2020-001478
Walsh, E. E., Frenck, R. W., Falsey, A. R., Kitchin, N., Absalon, J., Gurtman, A., et al. (2020). Safety and immunogenicity of two RNA-based covid-19 vaccine candidates. N. Engl. J. Med. 383, 2439–2450. doi:10.1056/NEJMoa2027906
Wang, L., Wang, Y. S., Mugiyanto, E., Chang, W. C., and Yvonne Wan, Y. J. (2020). MiR-22 as a metabolic silencer and liver tumor suppressor. Liver Res. 4, 74–80. doi:10.1016/j.livres.2020.06.001
Yang, T., Chen, S. L., Lu, X. J., Shen, C. Y., Liu, Y., and Chen, Y. P. (2012). Bone morphogenetic protein 7 suppresses the progression of hepatic fibrosis and regulates the expression of gremlin and transforming growth factor β1. Mol. Med. Rep. 6, 246–252. doi:10.3892/mmr.2012.892
Yang, Z., Qin, W., Huo, J., Zhuo, Q., Wang, J., and Wang, L. (2021). MiR-22 modulates the expression of lipogenesis-related genes and promotes hepatic steatosis in vitro. FEBS Open Bio 11, 322–332. doi:10.1002/2211-5463.13026
Keywords: miRNA, inhibition, drug safetey, primary cell, toxicology, RNA Medicine, Drug development, pre-clinical development
Citation: Panella R, Zanderigo F, Morandini F, Federico D, Vicentini E, Andreetta F, Toniolo A and Kauppinen S (2023) Assessment of immunostimulatory responses to the antimiR-22 oligonucleotide compound RES-010 in human peripheral blood mononuclear cells. Front. Pharmacol. 14:1125654. doi: 10.3389/fphar.2023.1125654
Received: 16 December 2022; Accepted: 27 February 2023;
Published: 23 March 2023.
Edited by:
Subhash Chander, Amity University, IndiaReviewed by:
Aloukick Kumar Singh, Center for Stem Cell Research (CSCR), IndiaRupesh K. Gautam, Indore Institute of Pharmacy, India
Copyright © 2023 Panella, Zanderigo, Morandini, Federico, Vicentini, Andreetta, Toniolo and Kauppinen. This is an open-access article distributed under the terms of the Creative Commons Attribution License (CC BY). The use, distribution or reproduction in other forums is permitted, provided the original author(s) and the copyright owner(s) are credited and that the original publication in this journal is cited, in accordance with accepted academic practice. No use, distribution or reproduction is permitted which does not comply with these terms.
*Correspondence: Riccardo Panella, riccardop@dcm.aau.dk
†These authors have contributed equally to this work