 Stefan Poschner1Alexandra Maier-Salamon1
 Martin Zehl2Judith Wackerlig3Daniel Dobusch3Anastasia Meshcheryakova4Diana Mechtcheriakova4Theresia Thalhammer4Bettina Pachmann1
 Walter Jäger1,5*
- 1Division of Clinical Pharmacy and Diagnostics, Department of Pharmaceutical Chemistry, University of Vienna, Vienna, Austria
- 2Department of Analytical Chemistry, Faculty of Chemistry, University of Vienna, Vienna, Austria
- 3Division of Drug Design and Medicinal Chemistry, Department of Pharmaceutical Chemistry, University of Vienna, Vienna, Austria
- 4Department of Pathophysiology and Allergy Research, Center for Pathophysiology, Infectiology and Immunology, Medical University of Vienna, Vienna, Austria
- 5Vienna Metabolomics Center, University of Vienna, Vienna, Austria
The role of resveratrol (RES) in preventing breast cancer is controversial, as low concentrations may stimulate the proliferation of estrogen-receptor alpha positive (ERα+) breast cancer cells. As metabolism is the key factor in altering cellular estrogens, thereby influencing breast tumor growth, we investigated the effects of RES on the formation of estrogen metabolites, namely 4-androstene-3,17-dione (AD), dehydroepiandrosterone (DHEA), dehydroepiandrosterone-3-O-sulfate (DHEA-S), estrone (E1), estrone-3-sulfate (E1-S), 17β-estradiol (E2), 17β-estradiol-3-O-(β-D-glucuronide) (E2-G), 17β-estradiol-3-O-sulfate (E2-S), 16α-hydroxy-17β-estradiol (estriol, E3), and testosterone (T) in ERα- MDA-MB-231 and ERα+ MCF-7 cells. Incubation of both of the cell lines with the hormone precursors DHEA and E1 revealed that sulfation and glucuronidation were preferred metabolic pathways for DHEA, E1 and E2 in MCF-7 cells, compared with in MDA-MB-231 cells, as the Vmax values were significantly higher (DHEA-S: 2873.0 ± 327.4 fmol/106 cells/h, E1-S: 30.4 ± 2.5 fmol/106 cells/h, E2-S: 24.7 ± 4.9 fmol/106 cells/h, E2-G: 7.29 ± 1.36 fmol/106 cells/h). RES therefore significantly inhibited DHEA-S, E1-S, E2-S and E2-G formation in MCF-7, but not in MDA-MB-231 cells (Kis: E2-S, 0.73 ± 0.07 μM < E1-S, 0.94 ± 0.03 μM < E2-G, 7.92 ± 0.24 μM < DHEA-S, 13.2 ± 0.2 μM). Suppression of these metabolites subsequently revealed twofold higher levels of active E2, concomitant with an almost twofold increase in MCF-7 cell proliferation, which was the most pronounced upon the addition of 5 μM RES. As the content of RES in food is relatively low, an increased risk of breast cancer progression in women is likely to only be observed following the continuous consumption of high-dose RES supplements. Further long-term human studies simultaneously monitoring free estrogens and their conjugates are therefore highly warranted to evaluate the efficacy and safety of RES supplementation, particularly in patients diagnosed with ERα+ breast cancer.
Introduction
Breast cancer is a major cause of death in women worldwide (Ferlay et al., 2015). Chemoprevention is therefore crucial to reduce morbidity and mortality. Several epidemiological and experimental studies have indicated that certain natural phenolic compounds may inhibit mammary carcinogenesis, and may therefore act as chemopreventive agents (Pan et al., 2015). One of such compound is trans-resveratrol (3,5,4′-trihydroxy-trans-stilbene), a naturally occurring polyphenol found in red wine and foods, including peanuts, blueberries and cranberries, as well as the skin of grapes (Aiyer et al., 2012). The anti-proliferative properties of RES have been demonstrated in vitro against hormone-dependent and hormone-independent breast cancer cells through the induction of apoptosis via the down-regulation of p53, NF-κB and Bcl-2, the inhibition of ribonucleotide reductase and DNA polymerases, and the suppression of the RhoA/Lats1/YAP signaling axis (Saluzzo et al., 2016; Kim et al., 2017). RES is also a radical scavenger and an inhibitor of cyclooxygenases (COX-1 and COX-2), which partly explains why this compound may reduce the occurrence of breast cancer (Murias et al., 2005). In addition, animal experiments identified significantly reduced tumor growth in human breast cancer xenografts subsequent to RES treatment, therefore supporting the use of this polyphenol as a chemotherapeutic agent (Garvin et al., 2006). Furthermore, a human case-control study using data from 369 cases and 602 controls reported a significant inverse association for the relationship between dietary RES intake and the risk of developing breast cancer (Levi et al., 2005).
However, based on the estrogen-like effects of RES due to its structural similarity with 17β-estradiol (E2) (Yildiz, 2005), some researchers and clinicians are concerned that the intake of RES may negatively affect hormone-dependent malignancies. Indeed, RES stimulates the proliferation of estrogen-receptor alpha positive (ERα+) breast cancer cells at low concentrations, but inhibits tumor growth at high doses. In ER alpha negative (ERα-) cells, this biphasic effect has not been observed; RES only exhibits anti-proliferative effects (Basly et al., 2000).
In addition to interactions with ERs, the stimulatory effects of RES on ERα+ breast cancer cells may also be linked to increased steroid hormone levels, which induce cellular proliferation and thus are an important factor for carcinogenesis (Folkerd and Dowsett, 2013). Indeed, RES treatment of mice (4 mg/kg i.p. for 7 days) resulted in an approximately twofold increase in E2 levels (El-Sayed and Bayan, 2015). Also a previous clinical study of post-menopausal women who were administered 1 g RES once a day for 12 weeks demonstrated a non-significant increase in serum E2 concentrations by 22.4% (Chow et al., 2014). Another study in healthy female volunteers (Chow et al., 2010) reported RES-associated menstrual changes as an adverse event in 4.8% of the subjects after oral consumption (1 g once a day for 4 weeks); again indicating altered steroid hormone levels.
We therefore hypothesized that RES may increase the level of active E2 in a dose-dependent manner, either by increasing the concentration of estrogen precursor steroids, or via inhibition of the biotransformation of E2 to conjugated metabolites, which do not promote ER-mediated activity (Samavat and Kurzer, 2015). Our hypothesis was supported by several previous in vitro and in vivo studies, which showed that RES inhibits various enzymes involved in the metabolism of estrogens, including 3β-hydroxysteroid dehydrogenase (3β-HSD), cytochrome P450 3A4 (CYP3A4), sulfotransferases (SULTs) and UDP-glucuronosyltransferases (UGTs) (Chan and Delucchi, 2000; Mesía-Vela and Kauffman, 2003; Furimsky et al., 2008; Chow et al., 2010; Mohamed and Frye, 2011; Li et al., 2014).
Therefore, the aim of the present study was to investigate the impact of RES on steroid metabolism in human ERα- MDA-MB-231 and ERα+ MCF-7 breast cancer cells. For this purpose, a specific and sensitive LC–HRMS assay was conducted to simultaneously quantify the 10 main steroids of the estrogenic metabolic pathway (Poschner et al., 2017). Differences in metabolism should be correlated with cell proliferation, which may explain the observed tumor-promoting effect of RES in ERα+ breast cancer.
Materials and Methods
Materials
4-Androstene-3,17-dione, 16α-hydroxy-17β-estradiol, 17β-estradiol, 17β-estradiol-3-O-(β-D-glucuronide) sodium salt, dehydroepiandrosterone, dehydroepiandrosterone-2,2,3,4,4,6-d6, dehydroepiandrosterone-3-O-sulfate, dehydroepiandrosterone-3-O-sulfate-2,2,3,4,4,6-d6-sodium salt, estrone and testosterone, as well as acetic acid, acetonitrile, ammonium acetate, dimethylsulfoxide, and trans-resveratrol, were obtained from Merck KGaA (Darmstadt, Germany). 17β-estradiol-3-O-sulfate sodium salt and estrone-3-O-sulfate sodium salt were purchased from Steraloids, Inc. (Newport, RI, United States). 4-Androstene-3,17-dione-2,2,4,6,6,16,16-d7 (AD-d7), 16α-hydroxy-17β-estradiol-2,4,17-d3 (E3-d3), 17β-estradiol-2,4,16,16-d4 (E2-d4), 17β-estradiol-16,16,17-d3-3-O-(β-D-glucuronide) sodium salt (E2-G-d3), 17β-estradiol-2,4,16,16-d4-3-O-sulfate sodium salt (E2-S-d4), estrone-2,4,16,16-d4 (E1-d4), estrone-2,4,16,16-d4-3-O-sulfate sodium salt (E1-S-d4), and testosterone-2,2,4,6,6-d5 (T-d5) were obtained from C/D/N Isotopes, Inc. (Pointe-Claire, QC, Canada). Trans-resveratrol-3-O-(β-D-glucuronide) sodium salt, trans-resveratrol-3-O-sulfate sodium salt, trans-resveratrol-4′-O-(β-D-glucuronide) sodium salt, trans-resveratrol-4′-O-sulfate sodium salt, and trans-resveratrol-3-O-4′-O-disulfate disodium salt were purchased from Santa Cruz Biotechnology, Inc. (Dallas, TX, United States). Purified water was obtained using an arium pro ultrapure water system (Sartorius AG, Göttingen, Germany).
Cell Proliferation Studies
MDA-MB-231 and MCF-7 breast cancer cells were purchased from the American Type Culture Collection (ATCC; Manassas, VA, United States) and routinely cultivated at 37°C (95% humidity and 5% CO2) in phenolred-free Dulbecco’s modified Eagle medium F-12 (DMEM/F-12), fortified with 1% PenStrep®-solution and 10% fetal bovine serum (Invitrogen; Thermo Fisher Scientific, Inc., Waltham, MA, United States). All experiments were performed during the exponential growth phase of both cell lines. For the experiments, cells were seeded in 6-well-plates at a density of 1.0 × 10⁶ cells per well and allowed to attach for 24 h. Prior to incubation with RES or hormone precursors (DHEA and E1), the cells were washed twice with Dulbecco’s phosphate-buffered saline (DPBS; Invitrogen), and DMEM/F-12, containing 10% HyClone® heat-inactivated charcoal-stripped fetal bovine serum (GE Healthcare Life Sciences, Logan, UT, United States), was subsequently added to exclude the interference of external hormones.
To elucidate the influence of RES, DHEA and E1 on MDA-MB-231 and MCF-7 cell proliferation, cells were incubated for 48 h with RES (0–100 μM), DHEA (0–100 nM), and E1 (0–100 nM), respectively. RES, DHEA, and E1 were dissolved in sterile-filtered DMSO prior to their addition to the cell medium to give a final DMSO concentration of 0.1%. Prior to cell counting with a Casy® TT Cell Counter (OLS OMNI Life Science, Bremen, Germany), the supernatant medium was removed and cells were detached using 400 μl TrypLe® solution (Invitrogen). All experiments were performed in triplicate, and the data were reported as the means ± standard deviation of all values.
Metabolism of RES in MDA-MB-231 and MCF-7 Cells
MDA-MB-231 and MCF-7 cells were cultivated as described above and incubated with increasing concentrations of RES (0–100 μM). After 48 h, the cellular media (100 μl) were mixed with 200 μl ice-cold (-20°C) methanol and subsequently centrifuged (14000 rpm, 5 min). The clear supernatants were then diluted 1:1 with aqueous ammonium acetate buffer (5 mM, pH = 7.4), and 80 μl of the samples were injected onto the HPLC column. RES and its five glucuronidated and sulfated biotransformation products were quantified by HPLC, as described previously (Riha et al., 2014), using a Dionex UltiMate 3000 system (Sunnyvale, CA, United States) equipped with an L-7250 injector, an L-7100 pump, an L-7300 column oven (set at 15°C), a D-7000 interface and an L-7400 UV detector (Thermo Fisher Scientific, Inc.) set at a wavelength of 307 nm. Calibration of the chromatogram was accomplished using the external standard method. Linear calibration curves were produced by spiking drug-free DMEM/F-12 medium with standard solutions of RES, RES-3G, RES-3S, RES-4G, RES-4S, and RES-DS to give a concentration range from 0.001 to 10.0 μg/ml (mean correlation coefficients: >0.999). For this method, the lower limits of quantification (LLOQs) for RES, RES glucuronides and RES sulfates were 2.5, 10.1, and 4.0 ng/ml, respectively. The coefficients of accuracy and precision for these compounds were <11%.
Inhibition of Steroid Metabolism by RES
Both cell lines were cultivated in the presence of HyClone® heat-inactivated charcoal-stripped fetal bovine serum as described above and then treated with increasing concentrations of DHEA or E1 (0–100 nM), respectively, in the absence and presence of RES (0–100 μM). After 48 h (preliminary experiments showed the linearity of metabolite formation for this time-span), 2000 μl media aliquots were mixed with 20 μl deuterated internal standard solution and pre-cleaned using SPE on Oasis HLB 1 cc SPE cartridges (30 mg; Waters Corporation, Milford, MA, United States), as described previously (Poschner et al., 2017). Briefly, cartridges were preconditioned with 2 × 1.0 ml acetonitrile and 3 × 1.0 ml ammonium acetate buffer (10 mM, pH = 5.0), and the samples were loaded onto the columns. After washing with 1 × 1.0 ml ammonium acetate buffer (10 mM, pH = 5.0) and 2 × 1.0 ml acetonitrile/ammonium acetate buffer (10 mM, pH 5.0) 10:90 (v/v), the analytes were eluted using 2 × 650 μl acetonitrile/ammonium acetate buffer (10 mM, pH = 5.0) 95:5 (v/v) and evaporated until dry. Subsequently, samples were reconstituted in 270 μl acetonitrile/ammonium acetate buffer (10 mM, pH = 5.0) 25:75 (v/v) and stored at -80°C until further LC–HRMS analysis.
After media collection, cell monolayers were washed five times with 2.0 ml DPBS, detached using 400 μl TrypLE® solution (37°C, 5 min), mixed with 600 μl DPBS and transferred into sample vials. Aliquots of these suspensions (100 μl each) were diluted and counted using the Casy® TT Cell Counter to determine the exact number of cells per sample well. The remaining cell suspensions (900 μl each) were gently centrifuged (1000 rpm, 8 min), and the supernatants were discarded. The cell pellets were subsequently resuspended in 100 μl aqueous ammonium acetate buffer (10 mM, pH = 5.0) and lysed by five freeze-thaw-cycles in liquid nitrogen (3 min each), followed by thawing at ambient temperature. Ammonium acetate buffer (1000 μl) was added, and the suspensions were centrifuged (14000 rpm, 5 min). Subsequently, the supernatants were concentrated using the same SPE protocol as described above. All processed samples were then stored at -80°C until further LC–HRMS analysis. For each condition, three biologically independent experiments were performed; the reported values represent the overall means ± SD of all values.
Steroid Hormone Quantification Using LC–HRMS
The 10 predominant metabolites of the estrogenic metabolic pathway (AD, DHEA, DHEA-S, E1, E1-S, E2, E2-S, E2-G, E3, and T) were then quantified using a selective and sensitive LC–HRMS assay, which was validated according to the ICH Q2(R1) guidelines, as described previously (Poschner et al., 2017). LC was performed with an UltiMate 3000 RSLC-series system coupled to a maXis HD ESI-Qq-TOF mass spectrometer (Bruker Corporation, Bremen, Germany). A Phenomenex Luna® 3 μm C18(2) 100 Å LC column (250 mm × 4.6 mm I.D.; Phenomenex, Inc., Torrance, CA, United States), preceded by a Hypersil® BDS-C18 guard column (5 μm, 10 mm × 4.6 mm I.D.; Thermo Fisher Scientific, Inc.) was used for the separation of the analytes at a flow rate of 1.0 ml/min and a temperature of 43°C. The injection volume was set to 100 μl for each sample; aqueous ammonium acetate buffer (10 mM, pH = 5.0) was used as solvent A, and acetonitrile as solvent B. The gradient was as follows: 25% solvent B at 0 min, 56.3% solvent B at 19 min, a washing step at 90% solvent B from 19.5 to 24.0 min, and column re-equilibration with 25% solvent B from 24.5 to 30.5 min. The ESI ion source settings were as follows: capillary voltage: -4.5 kV; dry gas flow rate: 8.0 l/min N2; nebulizer: 1.0 bar N2; and dry temperature: 200°C. The ion transfer parameters were set to 400 Vpp funnel RF and 300 Vpp multipole RF, the quadrupole ion energy was 8.0 eV, and the collision cell parameters were as follows: collision RF, 1100 Vpp; collision energy, 10.0 eV; transfer time, 38 μs; and pre-pulse storage, 18 μs. In the range of m/z 150–500, full-scan mass spectra were recorded. Quality control samples, containing each analyte at a concentration of 6-, 60-, or 600-fold of the respective LLOQs, were analyzed in triplicate with each LC batch to ensure accurate quantification results (Supplementary Figure S1). The LLOQs for all 10 analytes, defined as the concentrations where the signal to noise ratio (S/N) is ≥9, were determined as follows: AD: 74.9 pg/ml; DHEA: 1904.0 pg/ml; DHEA-S: 8.0 pg/ml; E1: 19.0 pg/ml; E1-S: 4.0 pg/ml; E2: 140.9 pg/ml; E2-G: 12.0 pg/ml; E2-S: 3.4 pg/ml; E3: 28.4 pg/ml; and T: 54.1 pg/ml.
Real-Time PCR Analysis
MCF-7 breast cancer cells were seeded in 6-well plates at a density of 1.0 × 10⁶ cells per well and allowed to attach overnight. Next day, cells were treated in kinetics (2, 4, 24, and 48 h, respectively) with 10 μM RES or with DMSO for the control samples (0 h time-point). Expression profiling of genes of interest was performed as detailed previously (Mechtcheriakova et al., 2007; Meshcheryakova et al., 2016). Upon treatment, total RNA was isolated using peqGOLD TriFASTTM reagent (VWR, Vienna, Austria) according to the manufacturer’s protocol. 1 μg RNA was used for cDNA generation using the High Capacity cDNA Reverse Transcription Kit (Thermo Fisher Scientific, Inc.) according to the instructions of the manufacturer. Real-time PCR analysis was performed in the 96-well plate format on a QuantStudio 12K Flex Real-Time PCR System (Thermo Fisher Scientific, Inc.). SULT1A1 and SULT2A1 were detected using the corresponding TaqMan Assays (Thermo Fisher Scientific, Inc.). UBC, GAPDH, and ACTB were used as HKGs for normalization, based on the selection for the most stable expression during the treatment conditions among four pre-tested HKGs (ACTB, UBC, GAPDH, and HPRT). HKGs primers were self-designed using the Primer Express 3.0 software (Thermo Fisher Scientific, Inc.) and validated using the Human Total RNA Master Panel (TaKaRa Bio, Inc., Saint-Germain-en-Laye, France), as described before (Mechtcheriakova et al., 2007, 2011); Primers: UBC forward: ATTTGGGTCGCAGTTCTTG; UBC reverse: TGCCTTGACATTCTCGATGGT; GAPDH forward: CGGGTCAACGGATTTGGTC; GAPDH reverse: TGGCAACAATATCCACTTTACCAG; ACTB forward: AGGCACCAGGGCGTGAT; ACTB reverse: TGTAGAAGGTGTGGTGCCAGATT. For relative quantification, data were analyzed by applying the ΔΔCT method. Expression levels of target genes were normalized to the average of the HKGs and shown relative to unstimulated cells (0 h time-point). Gene(s) with Ct > 36 are classified herein as not expressed; gene(s) with Ct > 30 are classified as low expressing gene(s). Using the GENEVESTIGATOR and the Affymetrix Human Genome U133 Plus 2.0 Array web based analysis platforms (Hruz et al., 2008), SULT1E1 was found to be not expressed in MCF-7 cells and was therefore not assessed by real-time PCR.
Data Analysis and Statistics
Compass DataAnalysis 4.2 and QuantAnalysis 2.2 software (Bruker Corporation) were used to analyze the acquired LC–HRMS data. For each analyte and internal standard pair, EICs were created, from which the respective peak areas were determined and the analyte/internal standard ratios were calculated for quantification.
Kinetic analyses of RES metabolism and steroid metabolism in the presence and absence of RES in both cell lines were performed using GraphPad Prism 6.0 software (GraphPad Software, Inc., La Jolla, CA, United States). Kinetic parameters for the formation of RES metabolites were best fitted to the substrate inhibition model: V = Vmax/(1 + Km/[S] + [S]/Ki), or the sigmoidal Hill model: V = Vmax × [S]n/([S50]n + [S]n), whereas kinetics regarding steroid hormone metabolism were better estimated using the Michaelis–Menten model: V = Vmax × [S]/(Km + [S]), where V is the rate of the reaction, Vmax is the maximum reaction velocity, Km is the Michaelis constant, [S] is the initial substrate concentration, Ki is the inhibition constant, n is the Hill slope and S50 the concentration of substrate that produces a half-maximal enzyme velocity. The modes of inhibition were subsequently determined from Lineweaver–Burk plots, and the corresponding Ki values were calculated from Dixon plots using GraphPad Prism 6.0.
The same software package was also used for all statistical analyses. All values were expressed as the means ± SD of three independent biological replicates and one-way ANOVA combined with Tukey’s post-test were used to compare differences between control samples and treatment groups. The statistical significance threshold was defined as P < 0.05 for all calculations.
Results
Effects of RES on the Proliferation of MDA-MB-231 and MCF-7 Cells
To evaluate the effects of RES on breast cancer cell growth, ERα- MDA-MB-231 and ERα+ MCF-7 cells were exposed to increasing concentrations of RES (0–100 μM) in the absence of DHEA and E1. As shown in Figure 1A, RES inhibited the cell growth of MDA-MB-231 cells in a concentration-dependent manner. Even after the addition of 2.5 μM RES, the number of viable cells decreased non-significantly from 2.17 ± 0.18 × 10⁶ to 2.03 ± 0.16 × 10⁶ cells, but 100 μM RES resulted in a significant reduction by 68.6 ± 4.7%. Contrary to the MDA-MB-231 cells, RES demonstrated a biphasic effect in MCF-7 cells, as concentrations below 10 μM stimulated cellular growth with a maximal effect by 21.2 ± 3.3% to 2.92 ± 0.16 × 10⁶ cells at 5 μM RES (Figure 1B). A further increase of RES concentration (>10 μM), however, led to a significant inhibition of cell growth (1.08 ± 0.11 × 10⁶ cells at 100 μM RES). Interestingly, the inhibitory effect of RES was more evident in MDA-MB-231 compared with MCF-7 cells, as indicated by lower IC50 values (15.1 ± 4.9 vs. 37.4 ± 14.5 μM).
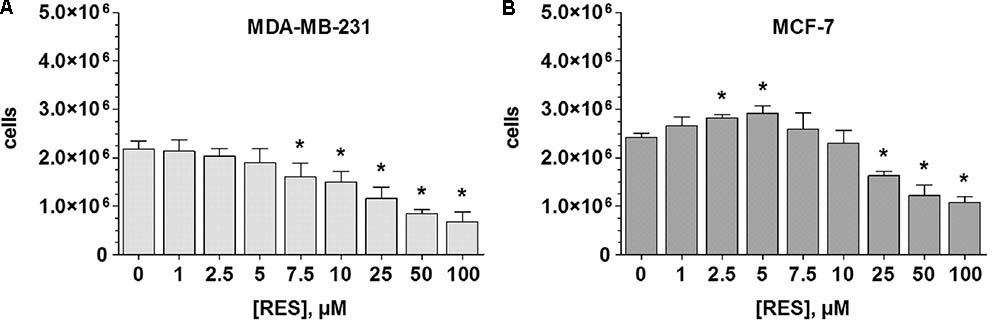
FIGURE 1. Influence of RES on MDA-MB-231 and MCF-7 cell proliferation. (A) MDA-MB-231 or (B) MCF-7 cells were incubated for 48 h with increasing concentrations of RES (0–100 μM) in steroid-deprived conditions. All data represent the means ± SD of three independent biological replicates. ∗P < 0.05 vs. untreated control samples.
RES Metabolism by MDA-MB-231 and MCF-7 Cells
In order to investigate whether the observed differences in the proliferation of MDA-MB-231 and MCF-7 cells by RES were due to alterations in RES metabolism, both cell lines were screened for the formation of the five major human conjugated RES metabolites. In addition to native RES, only RES-3G and RES-3S could be quantified in both cell lines, as the levels of RES-4G, RES-4S, or RES-DS formation were below the detection limit.
In MDA-MB-231 cells, the maximum metabolite formation was observed following incubation with 25 μM RES, with a notable preference for glucuronidation (23.9 ± 2.4 pmol RES-3G/106 cells/h) compared with sulfation (2.28 ± 0.33 pmol RES-3S/106 cells/h) (Figures 2A,B). At higher RES concentrations, the formation of both RES conjugates decreased, best fitting to the substrate inhibition model, with Ki values of 54.0 ± 5.3 μM for RES-3G and 76.3 ± 35.2 μM for RES-3S.
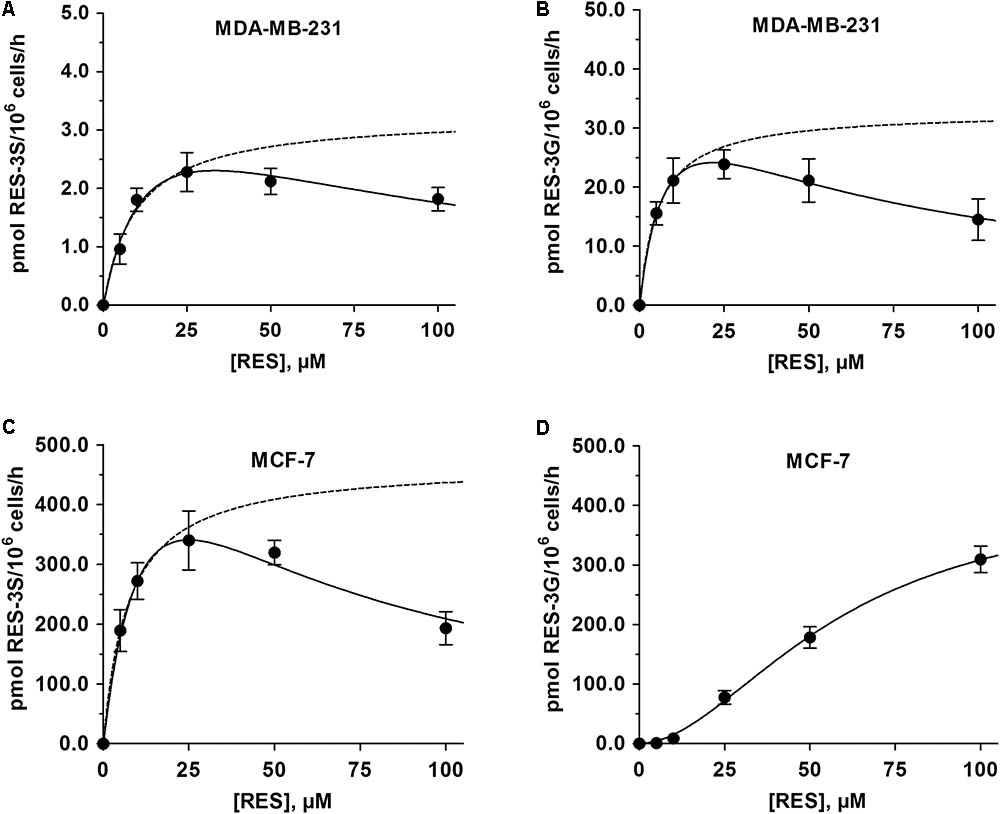
FIGURE 2. Kinetic profiles for the formation of 3-O-conjugated RES-metabolites by MDA-MB-231 and MCF-7 cells. The formation of (A) RES-3S and (B) RES-3G by MDA-MB-231 cells was determined following incubation with 0–100 μM RES for 48 h, and modeled using the substrate inhibition model. The formation of (C) RES-3S and (D) RES-3G by MCF-7 cells were evaluated with the same protocol. While the formation of RES-3S correlated with the substrate inhibition model, the formation of RES-3S was best described by the sigmoidal Hill model. Dashed lines represent the kinetic profiles without substrate inhibition. All data represent the means ± SD of three independent biological replicates.
Compared with MDA-MB-231 cells, the formation of RES-3S in MCF-7 cells was increased by 150-fold, with a mean maximum formation rate of 340.1 ± 49.4 pmol RES-3S/106 cells/h (Figure 2C). As observed in MDA-MB-231 cells, treatment with RES up to 100 μM led to a pronounced reduction in RES-3S by 43.2%, again indicating substrate inhibition (Ki: 39.4 ± 14.3 μM). Glucuronidation of RES in MCF-7 cells was also higher (10-fold increase), demonstrating a sigmoidal Hill kinetic pattern, with a maximum formation rate of 309.4 ± 22.2 pmol RES-3G/106 cells/h at 100 μM RES (Figure 2D). Individual kinetic parameters for RES-S and RES-G in both cell lines are presented in Table 1.
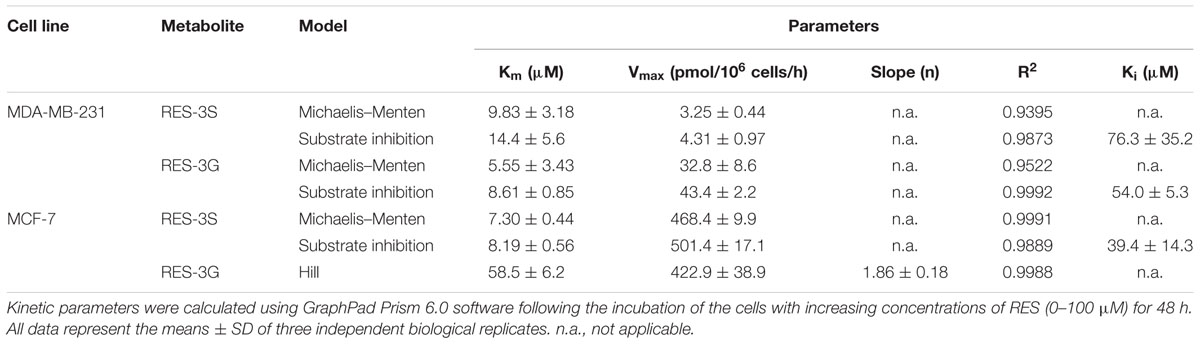
TABLE 1. Kinetic parameters of RES metabolism by MDA-MB-231 and MCF-7 cells.
Effects of DHEA and E1 on the Proliferation of MDA-MB-231 and MCF-7 Cells
ERα- MDA-MB-231 and ERα+ MCF-7 breast cancer cells were cultured in a hormone-deprived environment for 48 h. In these conditions, the number of MDA-MB-231 cells doubled from 1.0 × 10⁶ to 2.17 ± 0.18 × 10⁶. A comparable increase in cell proliferation was also observed in the MCF-7 cell line (final cell count: 2.41 ± 0.94 × 10⁶ cells). Incubation of ERα- MDA-MB-231 cells with either DHEA or E1 (0–100 nM) did not further increase cell growth (Figures 3A,B). In ERα+ MCF-7 cells, the presence of DHEA only led to a minor, non-significant increase in cell numbers, to 2.69 ± 0.24 × 10⁶ cells at 100 nM (Figure 3C). Incubation with E1, however, significantly stimulated the proliferation of MCF-7 cells by 59.8%, to 3.85 ± 0.36 × 10⁶ cells at 100 nM (Figure 3D), confirming the hormone-dependency of this cell line.
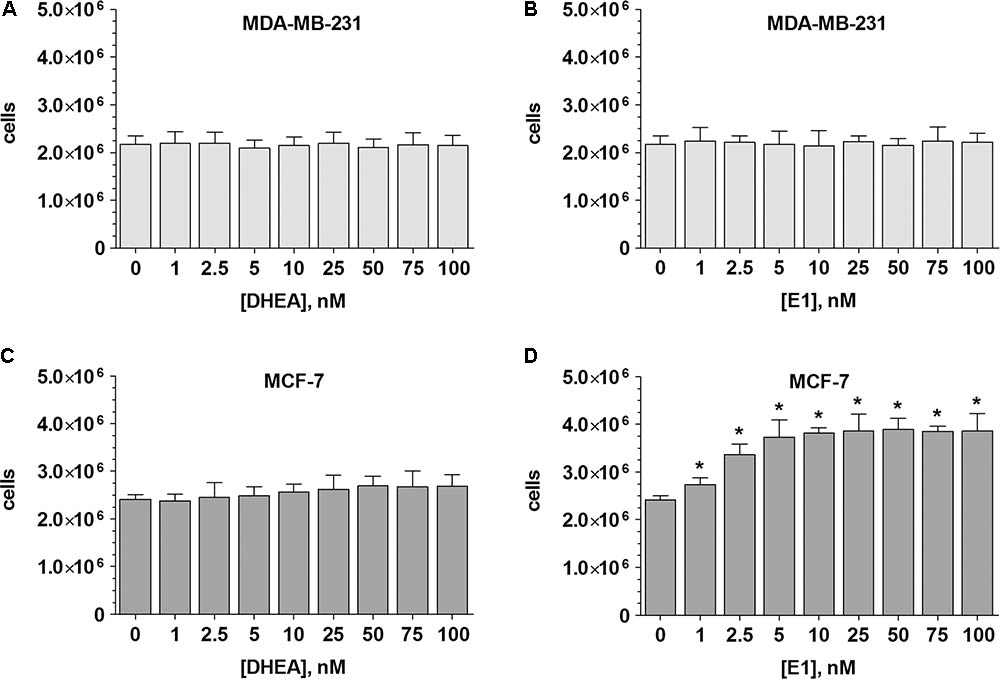
FIGURE 3. Influence of the hormone precursors DHEA and E1 on MDA-MB-231 and MCF-7 cell proliferation. MDA-MB-231 cells were incubated with increasing concentrations (0–100 nM) of (A) DHEA or (B) E1 for 48 h. MCF-7 cells were incubated with increasing concentrations (0–100 nM) of (C) DHEA or (D) E1 for 48 h. All data represent the means ± SD of three independent biological replicates.∗P < 0.05 vs. untreated control samples.
DHEA and E1 Metabolism by MDA-MB-231 and MCF-7 Cells
To assess differences in the metabolism of steroids by MDA-MB-231 and MCF-7 cells, both cell lines were incubated in the presence and absence of DHEA (100 nM) as a hormone precursor, and the formation of the nine major biotransformation products, namely DHEA-S, AD, T, E1, E1-S, E2, E2-S, E2-G and E3, was investigated by using a specific and sensitive LC–HRMS assay. The control samples (containing DMSO only) were performed for both cell lines to evaluate a possible endogenous steroid formation; however, neither in MCF-7 nor in MDA-MB-231 cells any endogenous steroid metabolites could be detected. Upon addition of 100 nM DHEA, the three metabolites DHEA-S, AD, and T could be quantified besides native DHEA in the supernatants of both cell lines; all other metabolites were below the LLOQ (Figure 4A).
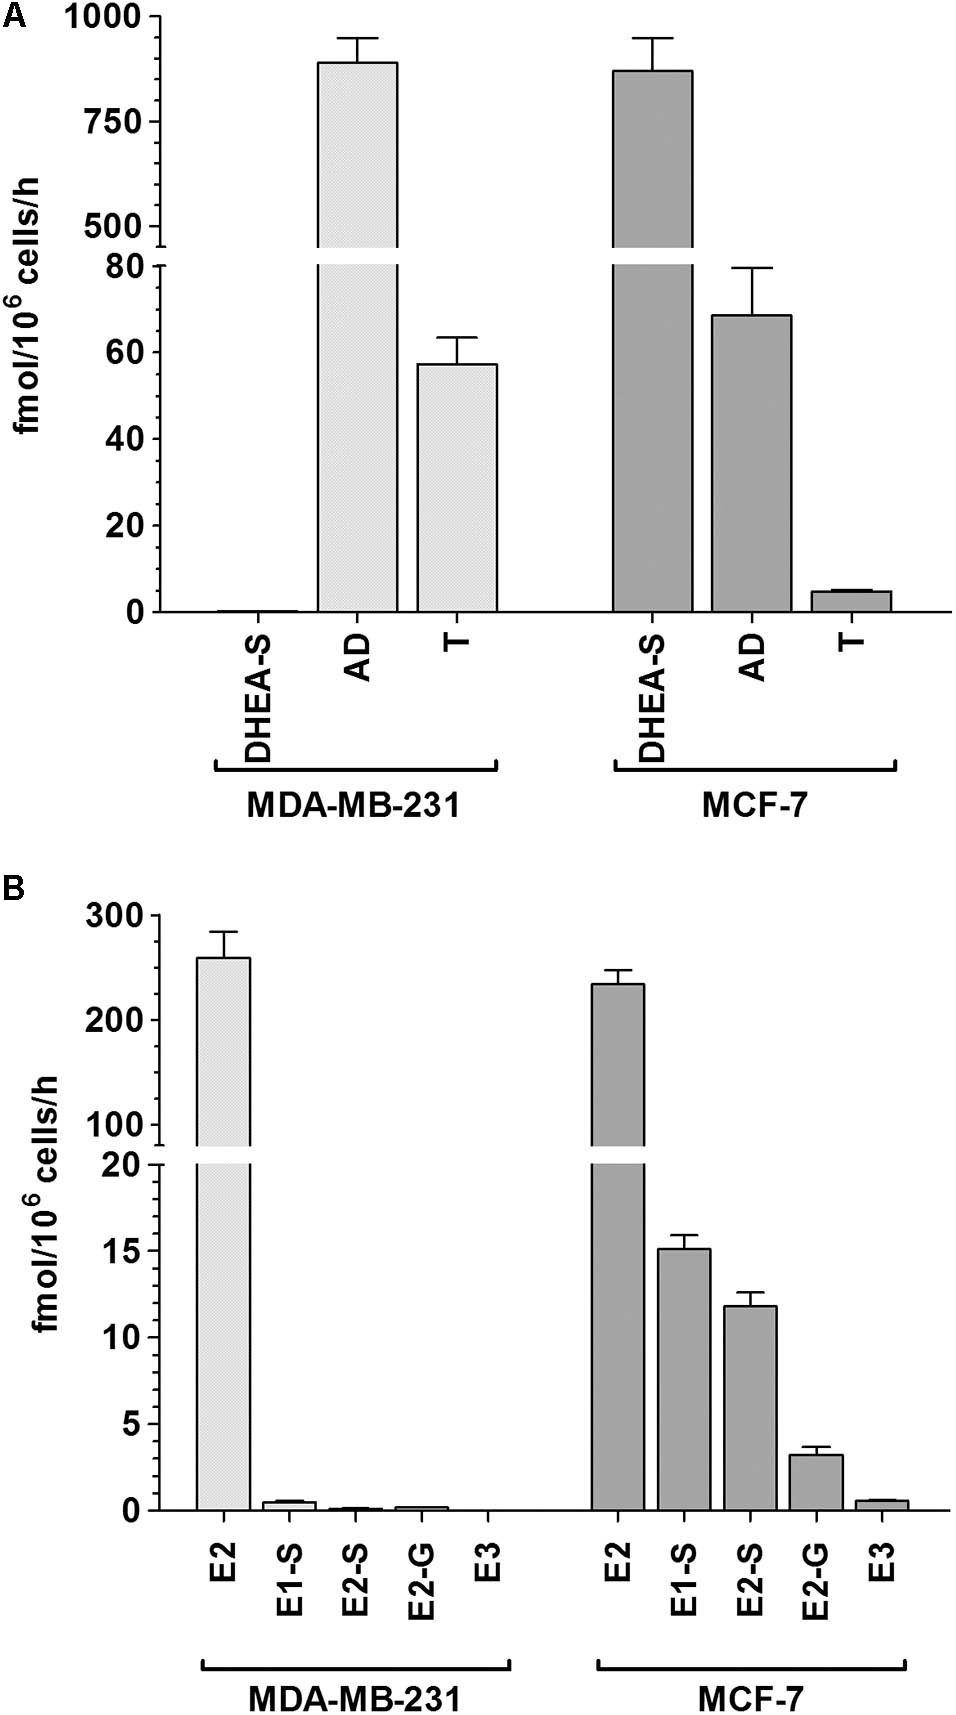
FIGURE 4. Patterns of steroid biotransformation rates in MDA-MB-231 and MCF-7 cells. MDA-MB-231 and MCF-7 cells were incubated with (A) 100 nM DHEA or (B) 100 nM E1 as hormone precursors, and media aliquots were analyzed for steroid metabolites after 48 h. All data represent the means ± SD of three independent biological replicates.
In MDA-MB-231 cells, we observed that the 3β-HSD-mediated formation of AD was evidently favored (mean formation rate: 888.9 ± 60.1 fmol/106 cells/h). AD was further metabolized via 17β-HSD to T, however, to a significantly lower extent (57.1 ± 6.2 fmol/106 cells/h). The sulfation of DHEA was negligible, as the formation rate of DHEA-S was only 0.14 ± 0.02 fmol/106 cells/h. Concomitant with the formation of these metabolites, DHEA concentration in the medium decreased by 26.8% from 100 to 73.2 ± 2.5 nM after 48 h. The total molar proportion of AD, T, and DHEA-S was 26.2%, indicating that these three biotransformation products represent almost 100% of all metabolites formed from the precursor DHEA in MDA-MB-231 cells (unmetabolized DHEA + total detected metabolites: 99.4%).
In MCF-7 cells, the formation rates of DHEA-S, AD, and T notably differed from MDA-MB-231 cells. DHEA-S was now the primary metabolite (mean formation rate: 870.0 ± 79.1 fmol/106 cells/h), whereas the formation of AD and T was less pronounced (68.5 ± 11.1 and 4.78 ± 0.38 fmol/106 cells/h, respectively). Concomitantly, the remaining DHEA concentration decreased by 54.9% from 100.0 to 45.1 ± 1.8 nM, which once again reflected the total molar proportion of these three metabolites (54.7%).
To further evaluate the formation rates of estrogens and their respective conjugates, MDA-MB-231 and MCF-7 cells were also incubated in the presence and absence of 100 nM E1 as a hormone precursor (Figure 4B). Again, control samples (containing DMSO only) revealed no endogenous formation of estrogen metabolites in both cell lines. E2 was identified as the predominant metabolite with comparable formation rates in MDA-MB-231 and MCF-7 cells (258.9 ± 25.1 fmol/106 cells/h vs. 233.9 ± 13.4 fmol/106 cells/h). The hydroxylation of E2 to E3 was a minor pathway in MCF-7 cells (0.57 ± 0.06 fmol/106 cells/h), and was below the LLOQ in MDA-MB-231 cells. However, the formation rates of steroid conjugates differed markedly between both cell lines. While the formation of E1-S, E2-S and E2-G were negligible in MDA-MB-231 cells (E1-S: 0.49 ± 0.07 > E2-G: 0.18 ± 0.02 > E2-S: 0.12 ± 0.02 fmol/106 cells/h), the total conjugation of E1 and E2 was up to 40-fold higher in MCF-7 cells (E1-S: 15.1 ± 0.8 > E2-S: 11.8 ± 0.8 > E2-G: 3.23 ± 0.45 fmol/106 cells/h). In both cell lines, the total molar proportions of all detected metabolites amounted to 12.0% and 12.8%, with a concomitant decrease of native E1 by 12.3% and 12.9%, respectively.
The kinetic profiles for the formation of DHEA and E1 metabolites by MDA-MB-231 and MCF-7 cells were then evaluated over a DHEA and E1 concentration range of 0–100 nM for 48 h. The formation kinetics of DHEA-S, AD, T, E1-S, E2, E2-S, and E2-G best fitted to a hyperbolic Michaelis–Menten model, with the highest Vmax values for AD in MDA-MB-231 cells (1994.0 ± 364.5 fmol/106 cells/h) and for DHEA-S in MCF-7-cells (2873.0 ± 327.4 fmol/106 cells/h). Km values in both cell lines were within a similar range for AD, E2, E1-S and E2-G, but were significantly lower for DHEA-S, T and E2-S in MDA-MB-231 cells, compared with in MCF-7 cells (Table 2). The kinetic parameters for the formation of E3 could not be calculated, as only the highest concentration of E1 (100 nM) resulted in concentrations of E3 above the LLOQ for this assay.
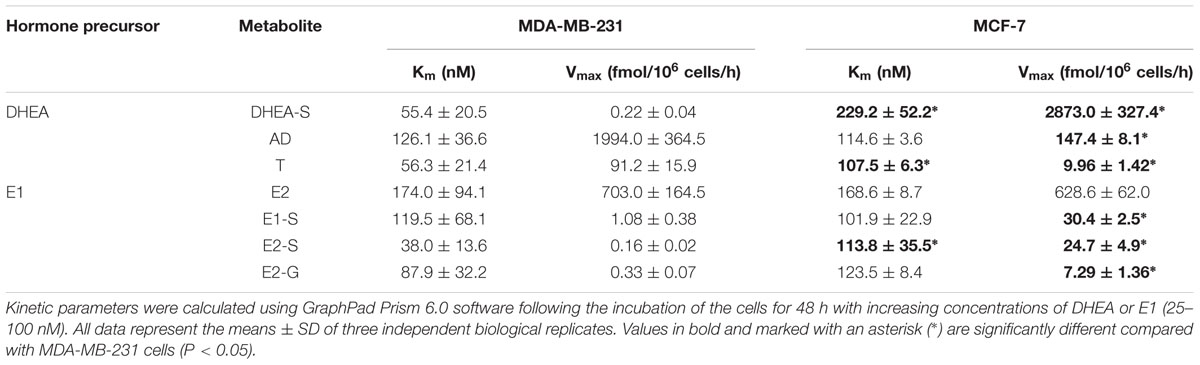
TABLE 2. Kinetic parameters of steroid metabolism by MDA-MB-231 and MCF-7 cells.
Inhibition of Conjugated DHEA and E1 Metabolites by RES
To determine whether there was a possible inhibitory effect of RES on steroid metabolism, MDA-MB-231 and MCF-7 cells were treated with 100 nM DHEA or E1 for 48 h, in the presence or absence of 100 μM RES. As shown in Figures 5A,B, RES did not affect the formation of DHEA-S, E1-S, E2-S, and E2-G in MDA-MB-231 cells. Conversely, a marked effect of RES on the conjugation of DHEA, E1, and E2 was observed in MCF-7 cells (Figures 5C,D). The mean formation of DHEA-S, E1-S, E2-S, and E2-G was almost quantitatively reduced by 87.7%, 99.1%, 98.8%, and 89.7%, respectively.
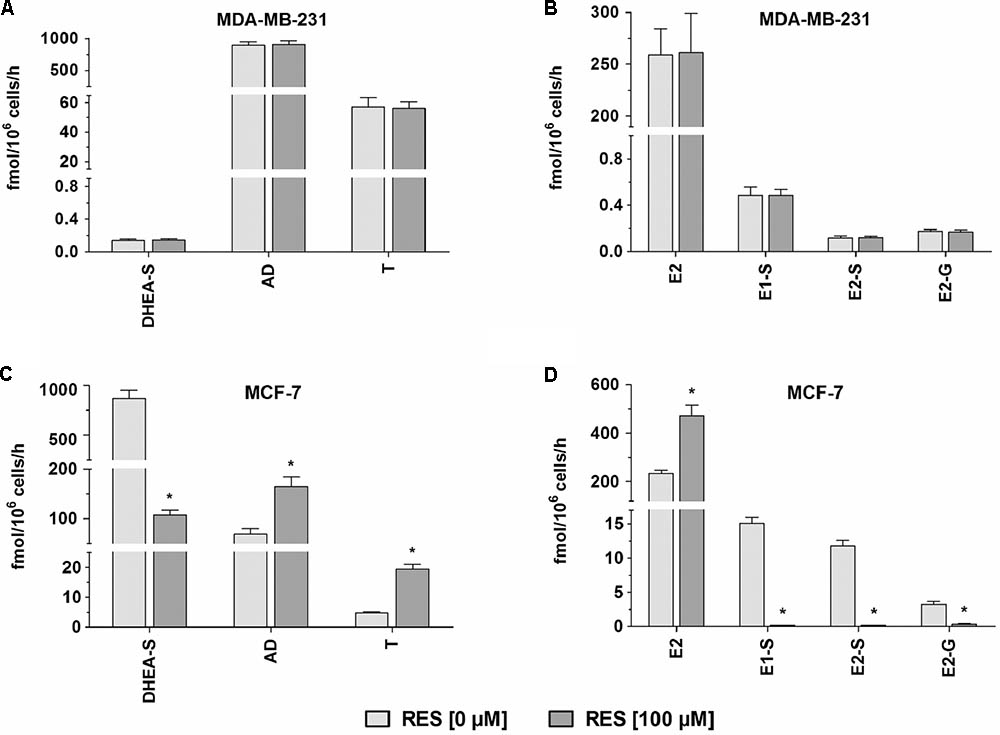
FIGURE 5. Effect of RES on steroid metabolism by MDA-MB-231 and MCF-7 cells. MDA-MB-231 cells were incubated with (A) 100 nM DHEA or (B) 100 nM E1 as a hormone precursor in the presence and absence of 100 μM RES for 48 h. MCF-7 cells were incubated with (C) 100 nM DHEA or (D) 100 nM E1 as a hormone precursor in the presence and absence of 100 μM RES for 48 h. All data represent the means ± SD of three independent biological replicates.∗P < 0.05.
The inhibition of all four metabolites best fitted to the Michaelis–Menten kinetic model (Figures 6, 7). The Vmax values for the formation of the conjugates were significantly decreased with increasing concentrations of RES, while the corresponding Km values were virtually unaffected (Table 3). This indicated non-competitive inhibition by RES for all conjugates, which was further confirmed by Lineweaver–Burk and Dixon plots. The more pronounced inhibition of E1 and E2 sulfation compared with DHEA sulfation and E2 glucuronidation by RES was also associated with significantly lower Ki values (E2-S: 0.73 ± 0.07 μM < E1-S: 0.94 ± 0.03 μM < E2-G: 7.92 ± 0.24 μM < DHEA-S: 13.2 ± 0.2 μM), indicating decreased rates of E1-S and E2-S formation even at low RES concentrations.
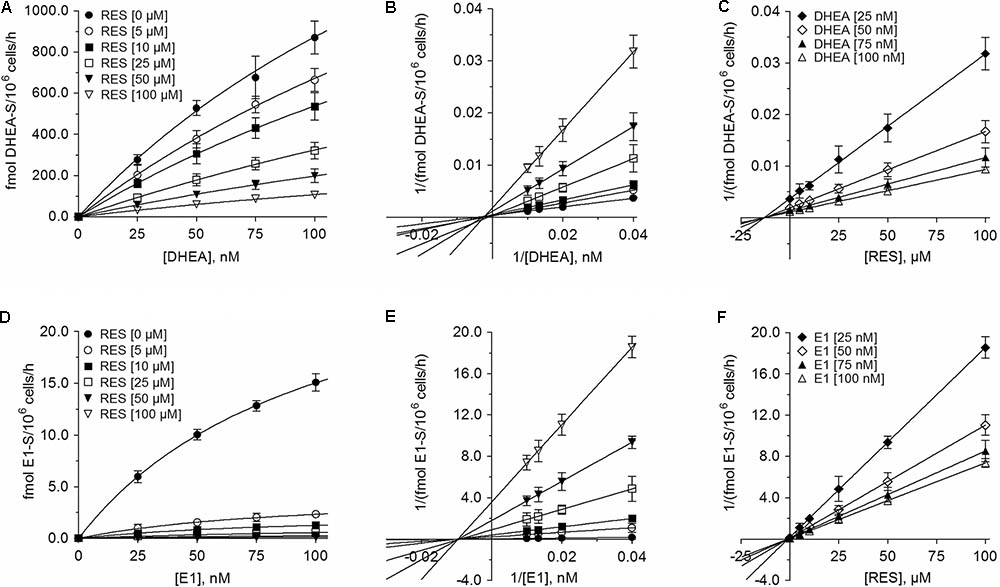
FIGURE 6. Kinetic profiles of the inhibition of DHEA sulfation and E1 sulfation in MCF-7 cells by RES. The kinetics of (A–C) DHEA sulfation and (D–F) E1 sulfation were calculated following the incubation of MCF-7 cells with 0–100 nM DHEA or E1 as hormone precursors in the absence or presence of 0–100 μM RES for 48 h. Data are displayed as Michaelis–Menten, Lineweaver–Burk, and Dixon plots. All data represent the means ± SD of three independent biological replicates.
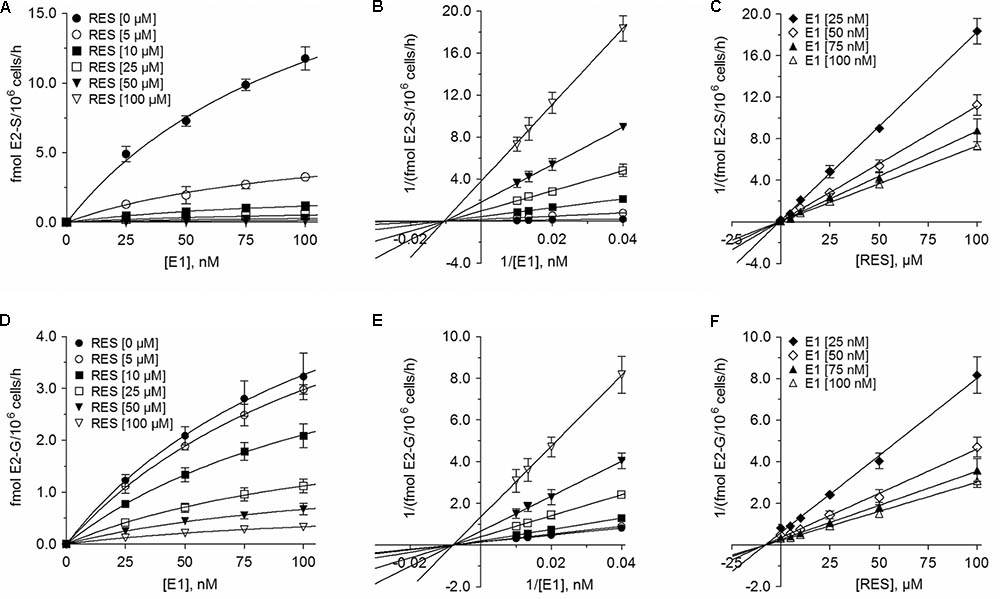
FIGURE 7. Kinetic profiles of the inhibition of E2 conjugations in MCF-7 cells by RES. The kinetics of (A–C) E2 sulfation and (D–F) E2 glucuronidation were calculated following the incubation of MCF-7 cells with 0–100 nM E1 as a hormone precursor in the absence or presence of 0–100 μM RES for 48 h. Data are displayed as Michaelis–Menten, Lineweaver–Burk, and Dixon plots. All data represent the means ± SD of three independent biological replicates.
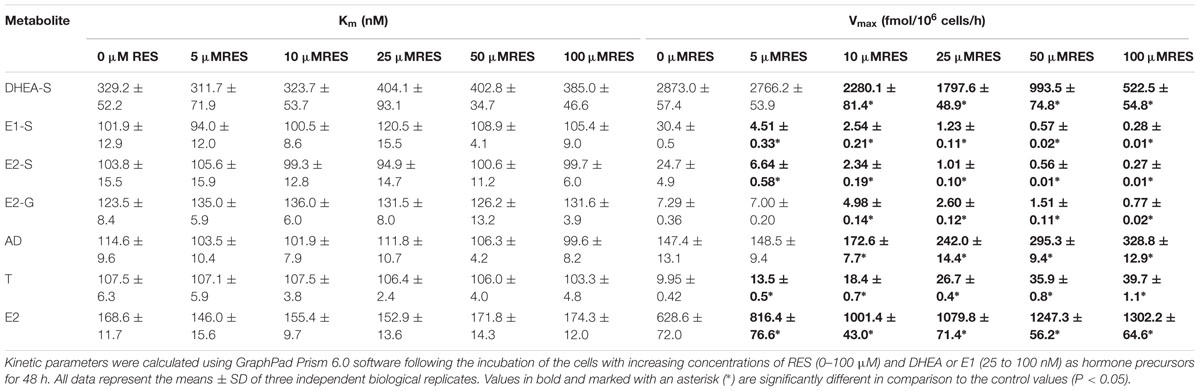
TABLE 3. Kinetic parameters of steroid metabolism by MCF-7 cells in the absence and presence of RES.
Effect of RES on Unconjugated DHEA and E1 Metabolites
In addition to the quantification of steroid conjugates, we also assessed the effects of RES treatment on the formation of unconjugated AD, T, and E2. Again, RES exerted no significant influence in MDA-MB-231 cells (Figures 5A,B); however, in MCF-7 cells, RES markedly increased the levels of these three metabolites (Figures 5C,D). 100 μM RES treatment led to a significant increase in AD concentrations by 141.0% (from 68.5 ± 11.1 to 165.1 ± 18.7 fmol/106 cells/h), whereas T levels increased by 305.9% (from 4.78 ± 0.38 to 19.4 ± 1.6 fmol/106 cells/h); unconjugated E2 concentrations also increased by 101.6% (from 233.9 ± 13.4 to 471.5 ± 43.6 fmol/106 cells/h). The kinetic profiles for AD, T, and E2 in MCF-7 cells were then evaluated over a concentration range of 0–100 nM DHEA and E1, respectively. As observed for the inhibition of DHEA, E1, and E2 conjugates, the Km values were not affected by RES treatment, whereas the Vmax values increased in a concentration-dependent manner (Figure 8 and Table 3), thereby confirming a stimulatory effect of RES on the formation of AD, T, and E2.
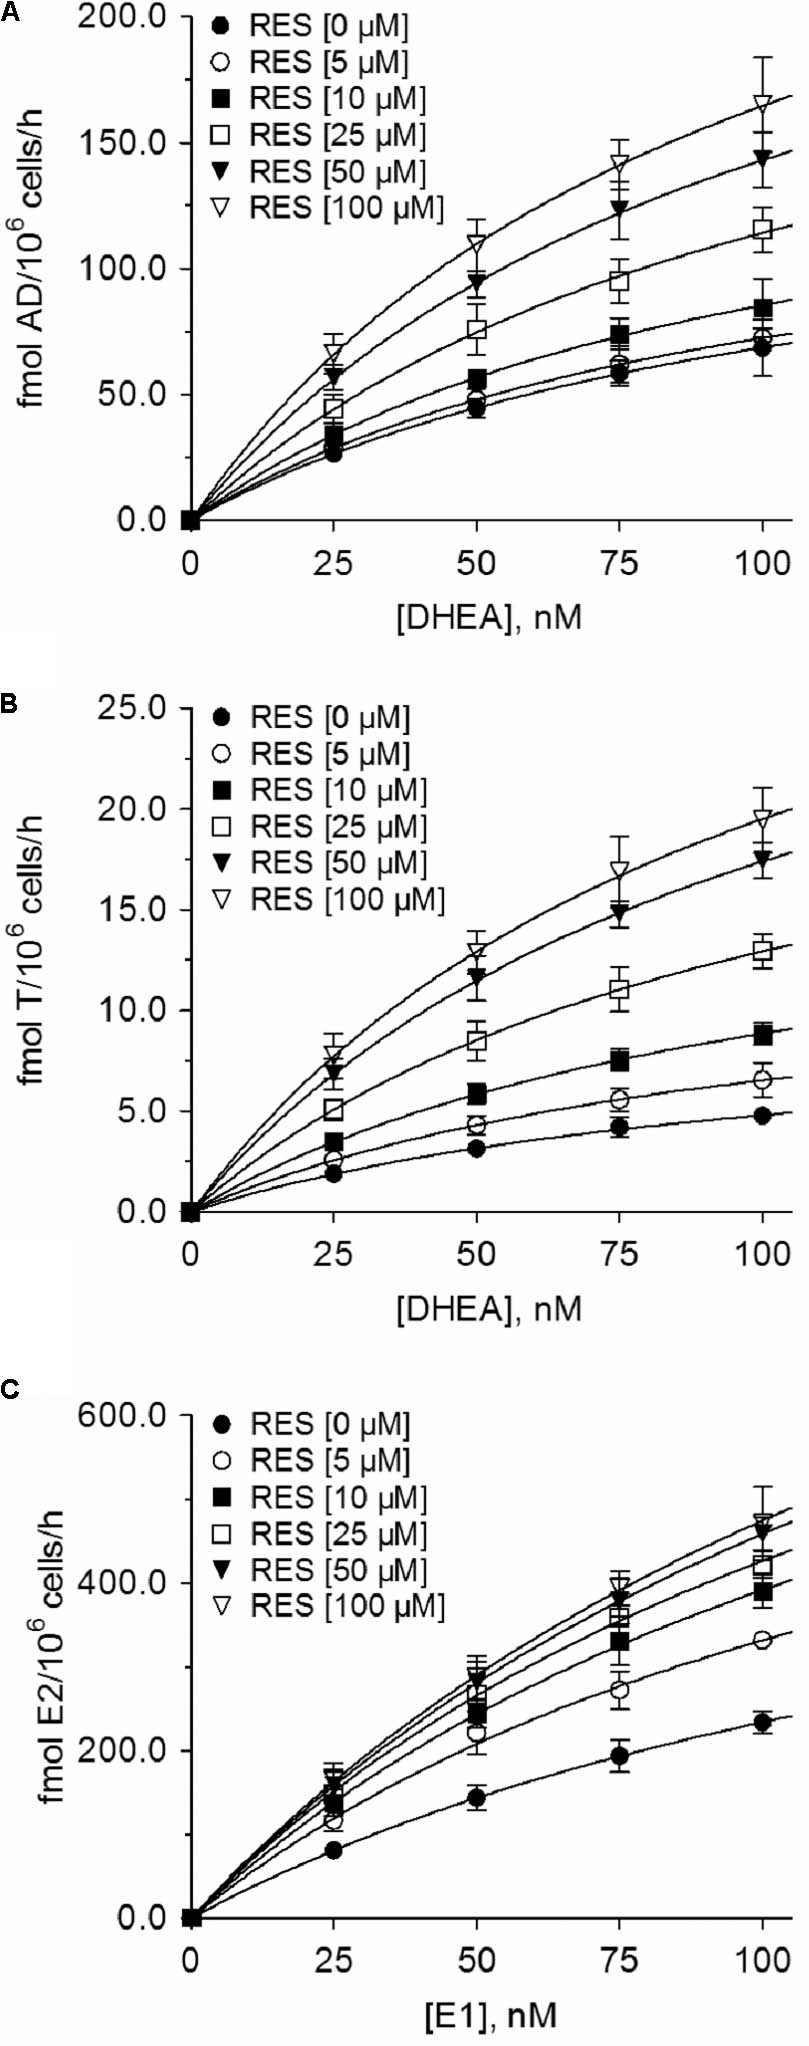
FIGURE 8. Kinetic profiles of the increase of unconjugated steroids in MCF-7 cells in the presence of RES. Michaelis–Menten plots for the formation of (A) AD, (B) T, and (C) E2 were calculated following the incubation of MCF-7 cells with 0–100 nM DHEA or E1 as hormone precursors in the absence or presence of 0–100 μM RES for 48 h. All data represent the means ± SD of three independent biological replicates.
Down-Regulation of SULT1A1 and SULT2A1 mRNA Expression in MCF-7 Cells by RES
Next, we raised the question whether RES regulates SULT1A1 and SULT2A1 on the transcriptional level during the time of treatment. Therefore, MCF-7 cells were treated with 10 μM RES for 2, 4, 24, and 48 h. We found that RES did not affect the transcription of SULT1A1 for up to 4 h of treatment (Supplementary Figure S2). However, a moderate, but non-significant down-regulation on the mRNA level was observed after 24 and 48 h (23.6 ± 13.0 and 30.4 ± 11.0%, respectively). Expression levels of SULT2A1 were low at time 0 h (Ct > 30) and again marginally down-regulated after 24 and 48 h (data not shown).
Effect of RES in the Presence of E1 on the Proliferation of MDA-MB-231 and MCF-7 Cells
The simultaneous incubation of MDA-MB-231 cells with RES and E1 up to 100 μM had no observable effect on cell proliferation (Figure 9A); however, in MCF-7 cells we observed a pronounced induction of cellular proliferation after co-incubation for 48 h (Figure 9B). Interestingly, the induction of cell growth was most pronounced at 5 μM RES, resulting in a twofold increase in cell counts after co-incubation with 100 nM E1, compared with the control samples in the absence of E1. The stimulatory effects of 100 nM E1 were also observed at higher RES concentrations up to 100 μM, thereby almost counteracting the observed anti-proliferative effects of RES in a hormone-deprived setting.
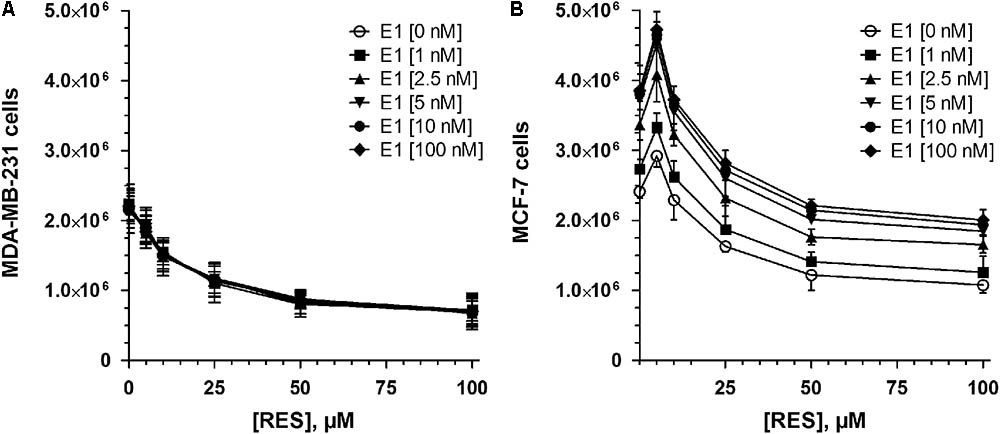
FIGURE 9. Effect of co-incubation with RES and E1 on cellular proliferation. (A) MDA-MB-231 and (B) MCF-7 breast cancer cells were incubated in the absence or presence of 0–100 μM RES with increasing concentrations of E1 (0–100 nM) as a hormone precursor. All data represent the means ± SD of three independent biological replicates.
Discussion
The role of RES in preventing breast cancer is controversial, as some studies have proposed it may increase its risk. Our data revealed that higher RES concentrations (up to 100 μM) significantly inhibited proliferation in both ERα- and ERα+ breast cancer cell lines, with IC50 values of 15.1 ± 4.9 μM for MDA-MB-231 cells and 37.4 ± 14.5 μM for MCF-7 cells. These data are in accordance with in vivo data from animal experiments (Garvin et al., 2006), which also reported a reduction of cancer xenograft growth in mice treated with 25 mg/kg RES per day for 3 weeks. The approximately 2.5-fold higher IC50 value of RES against MCF-7 cells may be partially explained by altered RES metabolism, as the formation of RES-3G and RES-3S was increased by up to 150-fold compared with MDA-MB-231 cells. Our data are supported by the findings of Murias et al. (2008), who also reported a distinct correlation between RES metabolism efficacy and cytotoxicity in various breast cancer cell lines.
However, at concentrations below 10 μM RES, the growth of ERα+ MCF-7 cells, but not ERα- MDA-MB-231 cells, was increased, with a maximal stimulatory effect of 21.2% at 5 μM RES compared with untreated controls. A similar effect was also reported by a recent in vivo study (Andreani et al., 2017), which reported an induction of ERα+ breast cancer growth at low RES concentrations in Δ16HER2 mice receiving 4 μg RES daily for 15 weeks.
These conflicting results with regards to RES may be attributed to altered estrogen levels in breast tissue, as breast cancer growth and progression are closely associated with female steroid hormones. As metabolism is the key factor for the alteration of cellular estrogens, we investigated, for the first time, the effects of RES on the metabolism of steroids within ERα- MDA-MB-231, and ERα+ MCF-7 human breast cancer cells. In the absence of RES, DHEA, and E1 induced no effect on the proliferation of ERα- MDA-MB-231 cells after 48 h. Conversely, in ERα+ MCF-7 cells, DHEA produced a slight increase and E1 a significant increase in cell proliferation, which once again indicated the hormone-dependency of this breast cancer cell line. Additionally, we screened for the formation of DHEA and E1 metabolites in both cell lines. After incubation with DHEA, three metabolites, namely DHEA-S, AD and T, were quantified in the supernatant media of both cell lines. Interestingly, the sulfation of DHEA was identified as the dominant pathway in MCF-7 cells (Vmax: 2873.0 ± 527.4 fmol/106 cells/h), while in MDA-MB-231 cells, the formation levels of AD and T were approximately 10-fold higher compared with in MCF-7 cells; the formation of DHEA-S only amounted to a Vmax value of 0.22 ± 0.04 fmol/106 cells/h.
Subsequently, we also incubated both cell lines with E1 as a hormone precursor. LC–HRMS analyses revealed that E2 was the predominant metabolite, with Vmax values of 703.0 ± 164.5 fmol/106 cells/h and 628.6 ± 62.0 fmol/106 cells/h for MDA-MB-231 and MCF-7 cells, respectively. While the formation of all other metabolites was almost negligible in MDA-MB-231 cells (Vmax values < 1.1 fmol/106 cells/h), E1-S, E2-S, E2-G, and E3 formation levels amounted to 11.6% of all biotransformation products in MCF-7 cells. CYP3A4-mediated hydroxylation of E2 to E3, however, was suggested to involve a minor metabolic pathway undertaken by MCF-7 cells, as the formation of E3 could not be quantified at E1 concentrations of < 100 nM. Sulfation was evidently the preferred pathway for E1 and E2 metabolism in MCF-7 cells, as the Vmax values were significantly higher (E1-S: 30.4 ± 2.5 fmol/106 cells/h and E2-S: 24.7 ± 4.9 fmol/106 cells/h) compared with those for E2 glucuronidation (7.29 ± 1.36 fmol/106 cells/h). These data were supported by previous in vitro investigations, which also revealed, based on significantly higher SULT expression, that the formation levels of E1-S and E2-S in ERα+ MCF-7 cells were more than sevenfold higher than in ERα- MDA-MB-231 cells after incubation with E1 for 24 h (Pasqualini, 2009). This may also occur in breast cancer patients, as higher SULT expression levels were also reported in ERα+ breast tumors compared with in ERα- breast cancer tissues (Adams et al., 1979).
In the ERα- MDA-MB-231 cells, RES did not significantly affect the formation of DHEA and E1 metabolites; however, in the ERα+ MCF-7 cells, RES significantly inhibited the formation of DHEA-S, consequently increasing the pool of unconjugated DHEA and leading to increased AD and T levels. Contrary to breast tumor tissue, MCF-7 cells express low levels of aromatase (Zhou et al., 1993), explaining why AD and T were not metabolized to E1 and E2, respectively. The presence of aromatase in females may thus further increase both levels (Figure 10).
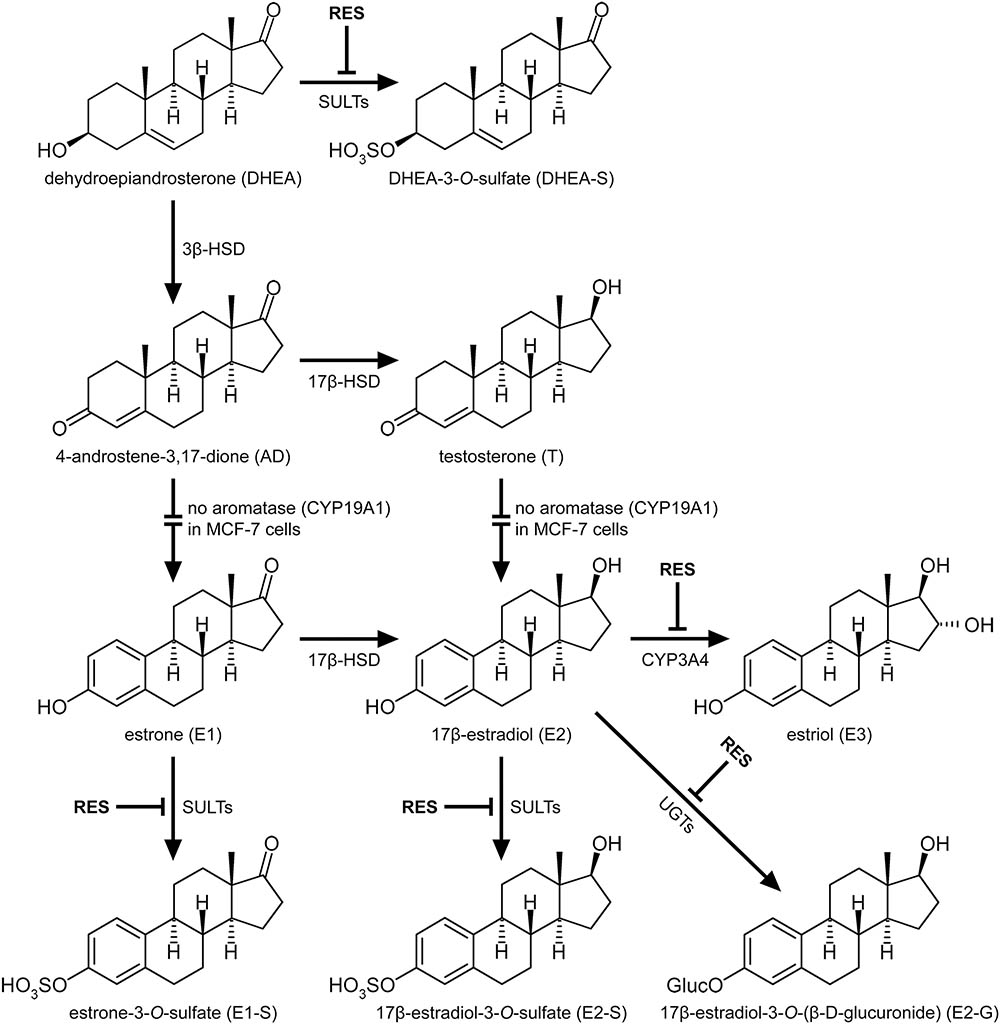
FIGURE 10. Interaction of RES with the metabolism of steroid hormones in MCF-7 breast cancer cells. RES inhibited the formation of the conjugated metabolites DHEA-S, E1-S, E2-S and E2-G, as well as the formation of E3, in a dose-dependent manner, thereby increasing the levels of AD, T, and active E2.
We therefore incubated MCF-7 cells with E1 as a hormone precursor in the presence of RES. As shown in Figure 5, RES significantly inhibited the formation of E1-S, E2-S and E2-G, thereby resulting in an approximate twofold increase in active E2 levels (Figure 10). Our data are in line with previous animal studies, which also observed that RES increased free E2 levels via the inhibition of E2 hydroxylation, glucuronidation, or sulfation in mice (Oskarsson et al., 2014) and rats (Banu et al., 2016). A non-significant increase in E2 serum concentrations (22.4%) was also reported in post-menopausal women receiving 1 g RES once a day for 12 weeks; however, as dansylchloride-derivatization was used for steroid quantification, the authors could not distinguish between free E2 and its conjugates (Chow et al., 2014).
This increase in unconjugated E2 may cause the observed induction of cell proliferation in ERα+ MCF-7 cells, particularly at RES concentrations < 10 μM. Similar findings have been reported by Chen et al. (2015), who also revealed that at physiological concentrations of E2, low doses of RES may stimulate the proliferation of ERα+ breast cancer cells. Therefore, increased E2 levels may be observed in hormone-dependent breast cancer patients following the intake of high-dose dietary supplements containing RES, as Ki values for the formation of E1-S and E2-S in MCF-7 breast cancer cells were 0.94 ± 0.03 and 0.73 ± 0.07 μM, respectively. The pronounced inhibition of estrogen sulfation by RES may also occur in other organs, as demonstrated by Furimsky et al. (2008) in S9 fractions from human liver (Ki: 1.1 μM) and jejunum (Ki: 0.6 μM).
In breast tumor tissue, steroid sulfation is catalyzed by SULT1E1, SULT1A1, and SULT2A1 (Mueller et al., 2015). Contrary to tumor tissue, MCF-7 cells do not express SULT1E1; steroid sulfation by this enzyme can be therefore excluded (Falany et al., 2002; Hruz et al., 2008). As the sulfation of E1, E2, and DHEA was strongly inhibited by RES in MCF-7 cells even upon addition of low concentrations, we also investigated a possible regulation of SULT1A1 and SULT2A1 mRNA expression after incubating MCF-7 cells with 10 μM RES. RES at this concentration showed an almost complete inhibition of E1 and E2 sulfation (91.6 ± 1.1% and 90.0 ± 1.0%, respectively, see Figures 6D, 7A), but had no effect on the cellular proliferation (Figure 1B) even after 48 h. Possible candidates for RES mediating a down-regulation of estrogen sulfating enzymes are the AhR and the pregnane X receptor (PXR) (Casper et al., 1999; Kodama and Negishi, 2013; Moscovitz et al., 2018). Both receptors are known to regulate mRNA expression of estrogen-metabolizing enzymes including SULTs. Because RES is known to work as an antagonist for AhR and PXR and is capable of down-regulating both nuclear receptors and SULTs, RES might inhibit estrogen sulfation via these pathways.
We found only an insignificant down-regulation of SULT1A1 mRNA by 30.4 ± 11.0% after longer-term application of 10 μM RES, suggesting that transcriptional regulation by these receptors might not contribute significantly to the observed reduction in the formation of steroid sulfates in the MCF-7 cells. These data might also implicate that breast cancer cell lines are different from the benign MCF-10A breast epithelial cells, where down-regulation of the AhR by RES significantly affect estrogen-metabolizing enzymes and cause a down-regulation of SULT1E1, particularly as SULT1E1 is not expressed in MCF-7 cells (Licznerska et al., 2017). Further in vitro studies are therefore needed to elucidate the differences in the down-regulation of steroid metabolizing enzymes between benign and malign human breast cell lines.
Our data also showed that autophagy might not be induced in MCF-7 cells by 10 μM RES since cell proliferation was not affected. However, at higher RES concentrations, formation of autophagosomes might become important and was indeed observed by Scarlatti et al. (2008) in MCF-7 cells incubated with 64 μM RES for 48 h.
Based on our data, RES inhibits steroid sulfation in MCF-7 cells mainly via direct binding to SULT enzymes, thereby reducing their activities. This is supported by the Lineweaver–Burk plots in our study that clearly show non-competitive inhibition of E1, E2, and DHEA sulfation by 5–100 μM RES (Figures 6B,E, 7B); both RES and the steroid substrates bind to the SULT enzymes at any given time forming an enzyme-substrate-inhibitor complex. Our observation is confirmed by the in vitro study of Ung and Nagar (2009), demonstrating RES-induced SULT1A1 and SULT1E1 inhibition in stably transfected MCF-7 cells.
Whether RES may accumulate to levels in human breast tissue necessary to inhibit DHEA, E1, and E2 metabolism remains unknown. Our recent study demonstrated that following oral application to rats (10 mg/kg), RES distributes to a variety of organs, including the liver, spleen, kidney, heart, lung and brain, strongly indicating the potential uptake of RES also into breast tissue (Böhmdorfer et al., 2017). Due to its low oral bioavailability, blood and tissue concentrations of RES following the dietary intake of red wine, peanuts or berries to inhibit estrogen metabolism may be markedly lower than our calculated Ki values, suggesting no significant effect on E2 levels. However, the daily high-dose administration of RES (0.5–5.0 g/day) for up to 29 days to 40 healthy subjects resulted in peak plasma concentrations of up to 4.24 μM (Brown et al., 2010). Additionally, the levels of RES-3S and RES-3G were approximately 10- and 6-fold higher, respectively. Whether RES glucuronides and sulfates also exhibit inhibitory effects toward DHEA, E1, and E2 conjugation remains to be investigated. Any inhibitory effects may further increase the plasma concentration of free E2 following high-dose RES supplementation, thereby inducing the progression of ERα+ breast cancer.
Conclusion
The present study demonstrated the non-competitive inhibition of the steroid metabolomics pathway in ERα+ MCF-7 but not in ERα- MDA-MB-231 breast cancer cells by low micromolar concentrations of RES, which led to a significant, twofold increase of free E2, capable of stimulating the proliferation of ERα+ breast cancer cells. As the content of RES in food is relatively low, an increased risk of breast cancer progression may only be observed after the continuous consumption of high-dose RES supplements. Further long-term human studies simultaneously monitoring free estrogens and their conjugates are therefore highly warranted to evaluate the efficacy and safety of RES supplementation, particularly in patients diagnosed with ERα+ breast cancer.
Author Contributions
SP performed all cell culture experiments, the LC–HRMS analysis and the data analysis, and contributed to the manuscript. AM-S analyzed the data and contributed to the manuscript. MZ, JW, and DD performed the LC–HRMS analyses. AM and DM performed the real-time PCR analyses and contributed to the manuscript together with TT. BP cultivated the breast cancer cell lines and performed the inhibition experiments. WJ supervised the experiments, analyzed the data, and wrote the final version of the manuscript.
Funding
This research was supported by grants from the Austrian Science Fund (FWF) awarded to WJ (Grant No. I 3417-B31) and to DM (Grant No. P23228-B19).
Conflict of Interest Statement
The authors declare that the research was conducted in the absence of any commercial or financial relationships that could be construed as a potential conflict of interest.
Supplementary Material
The Supplementary Material for this article can be found online at: https://www.frontiersin.org/articles/10.3389/fphar.2018.00742/full#supplementary-material
Abbreviations
3β-HSD, 3β-hydroxysteroiddehydrogenase; 17β-HSD, 17β-hydroxysteroiddehydrogenase; AD, 4-androstene-3,17-dione; AhR, aryl hydrocarbon receptor; cDNA, complementary deoxyribonucleic acid; CYP, cytochrome P450; DHEA, dehydroepiandrosterone; DHEA-S, dehydroepiandrosterone-3-O-sulfate; DMEM, Dulbecco’s modified Eagle’s medium; DMSO, dimethylsulfoxide; DPBS, Dulbecco’s phosphate-buffered saline; E1, estrone; E1-S, estrone-3-O-sulfate; E2, 17β-estradiol; E2-G, 17β-estradiol-3-O-(β-D-glucuronide); E2-S, 17β-estradiol-3-O-sulfate; E3, estriol (16α-OH-17β-estradiol); EIC, extracted ion chromatogram; ERα, estrogen-receptor alpha; ESI, electro-spray ionization; HKGs, housekeeping genes; Ki, inhibition constant; Km, Michaelis constant; LC–HRMS, liquid chromatography–high resolution mass spectrometry; LLOQ, lower limit of quantification; mRNA, messenger ribonucleic acid; PCR, polymerase chain reaction; PXR, pregnane X receptor; RES, trans-resveratrol; RES-3G, trans-resveratrol-3-O-(β-D-glucuronide); RES-3S, trans-resveratrol-3-O-sulfate; RES-4G, trans-resveratrol-4′-O-(β-D-glucuronide); RES-4S, trans-resveratrol-4′-O-sulfate; RES-DS, trans-resveratrol-3-O-4′-O-disulfate; SD, standard deviation; SPE, solid phase extraction; SULT, sulfotransferase; T, testosterone; UGT, UDP-glucuronosyl transferase; Vmax, maximum reaction velocity.
References
Adams, J. B., Pewnim, T., Chandra, D. P., Archibald, L., and Foo, M. S. (1979). A correlation between estrogen sulfotransferase levels and estrogen receptor status in human primary breast carcinoma. Cancer Res. 39, 5124–5126.
Aiyer, H. S., Warri, A. M., Woode, D. R., Hilakivi-Clarke, L., and Clarke, R. (2012). Influence of berry polyphenols on receptor signaling and cell-death pathways: implications for breast cancer prevention. J. Agric. Food Chem. 60, 5693–5708. doi: 10.1021/jf204084f
Andreani, C., Bartolacci, C., Wijnant, K., Crinelli, R., Bianchi, M., Magnani, M., et al. (2017). Resveratrol fuels HER2 and ERα-positive breast cancer behaving as proteasome inhibitor. Aging 9, 508–523. doi: 10.18632/aging.101175
Banu, S. K., Stanley, J. A., Sivakumar, K. K., Arosh, J. A., and Burghardt, R. C. (2016). Resveratrol protects the ovary against chromium-toxicity by enhancing endogenous antioxidant enzymes and inhibiting metabolic clearance of estradiol. Toxicol. Appl. Pharmacol. 303, 65–78. doi: 10.1016/j.taap.2016.04.016
Basly, J. P., Marre-Fournier, F., Le Bail, J. C., Habrioux, G., and Chulia, A. J. (2000). Estrogenic/antiestrogenic and scavenging properties of (E)- and (Z)-resveratrol. Life Sci. 66, 769–777. doi: 10.1016/S0024-3205(99)00650-5
Böhmdorfer, M., Szakmary, A., Schiestl, R. H., Vaquero, J., Riha, J., Brenner, S., et al. (2017). Involvement of UDP-glucuronosyltransferases and sulfotransferases in the excretion and tissue distribution of resveratrol in mice. Nutrients 9:E1347. doi: 10.3390/nu9121347
Brown, V. A., Patel, K. R., Viskaduraki, M., Crowell, J. A., Perloff, M., Booth, T. D., et al. (2010). Repeat dose study of the cancer chemopreventive agent resveratrol in healthy volunteers: safety, pharmacokinetics, and effect on the insulin-like growth factor axis. Cancer Res. 70, 9003–9011. doi: 10.1158/0008-5472.CAN-10-2364
Casper, R. F., Quesne, M., Rogers, I. M., Shirota, T., Jolivet, A., Milgrom, E., et al. (1999). Resveratrol has antagonist activity on the aryl hydrocarbon receptor: implications for prevention of dioxin toxicity. Mol. Pharmacol. 56, 784–790.
Chan, W. K., and Delucchi, A. B. (2000). Resveratrol, a red wine constituent, is a mechanism-based inactivator of cytochrome P450 3A4. Life Sci. 67, 3103–3112. doi: 10.1016/S0024-3205(00)00888-2
Chen, F. P., Chien, M. H., and Chern, I. Y. (2015). Impact of lower concentrations of phytoestrogens on the effects of estradiol in breast cancer cells. Climacteric 18, 574–581. doi: 10.3109/13697137.2014.1001357
Chow, H. H., Garland, L. L., Heckman-Stoddard, B. M., Hsu, C. H., Butler, V. D., Cordova, C. A., et al. (2014). A pilot clinical study of resveratrol in postmenopausal women with high body mass index: effects on systemic sex steroid hormones. J. Transl. Med. 12:223. doi: 10.1186/s12967-014-0223-0
Chow, H. H., Garland, L. L., Hsu, C. H., Vining, D. R., Chew, W. M., Miller, J. A., et al. (2010). Resveratrol modulates drug- and carcinogen-metabolizing enzymes in a healthy volunteer study. Cancer Prev. Res. 3, 1168–1175. doi: 10.1158/1940-6207.CAPR-09-0155
El-Sayed, N. S., and Bayan, Y. (2015). Possible role of resveratrol targeting estradiol and neprilysin pathways in lipopolysaccharide model of Alzheimer disease. Adv. Exp. Med. Biol. 822, 107–118. doi: 10.1007/978-3-319-08927-0_12
Falany, J. L., Macrina, N., and Falany, C. N. (2002). Regulation of MCF-7 breast cancer cell growth by beta-estradiol sulfation. Breast Cancer Res. Treat. 74, 167–176. doi: 10.1023/A:1016147004188
Ferlay, J., Soerjomataram, I., Dikshit, R., Eser, S., Mathers, C., Rebelo, M., et al. (2015). Cancer incidence and mortality worldwide: sources, methods and major patterns in GLOBOCAN 2012. Int. J. Cancer. 136, E359–E386. doi: 10.1002/ijc.29210
Folkerd, E., and Dowsett, M. (2013). Sex hormones and breast cancer risk and prognosis. Breast 22(Suppl. 2), 38–43. doi: 10.1016/j.breast.2013.07.007
Furimsky, A. M., Green, C. E., Sharp, L. E., Catz, P., Adjei, A. A., Parman, T., et al. (2008). Effect of resveratrol on 17beta-estradiol sulfation by human hepatic and jejunal S9 and recombinant sulfotransferase 1E1. Drug Metab. Dispos. 36, 129–136. doi: 10.1124/dmd.107.016725
Garvin, S., Ollinger, K., and Dabrosin, C. (2006). Resveratrol induces apoptosis and inhibits angiogenesis in human breast cancer xenografts in vivo. Cancer Lett. 231, 113–122. doi: 10.1016/j.canlet.2005.01.031
Hruz, T., Laule, O., Szabo, G., Wessendorp, F., Bleuler, S., Oertle, L., et al. (2008). Genevestigator v3: a reference expression database for the meta-analysis of transcriptomes. Adv. Bioinformatics 2008:420747. doi: 10.1155/2008/420747
Kim, Y. N., Choe, S. R., Cho, K. H., Cho, D. Y., Kang, J., Park, C. G., et al. (2017). Resveratrol suppresses breast cancer cell invasion by inactivating a RhoA/YAP signaling axis. Exp. Mol. Med. 49:e296. doi: 10.1038/emm.2016.151
Kodama, S., and Negishi, M. (2013). Sulfotransferase genes: regulation by nuclear receptors in response to xeno/endo-biotics. Drug Metab. Rev. 45, 441–449. doi: 10.3109/03602532.2013.835630
Levi, F., Pasche, C., Lucchini, F., Ghidoni, R., Ferraroni, M., and La Vecchia, C. (2005). Resveratrol and breast cancer risk. Eur. J. Cancer Prev. 14, 139–142. doi: 10.1097/00008469-200504000-00009
Li, L., Chen, X., Zhu, Q., Chen, D., Guo, J., Yao, W., et al. (2014). Disrupting androgen production of Leydig cells by resveratrol via direct inhibition of human and rat 3β-hydroxysteroid dehydrogenase. Toxicol. Lett. 226, 14–19. doi: 10.1016/j.toxlet.2014.01.022
Licznerska, B., Szaefer, H., Wierzchowski, M., Sobierajska, H., and Baer-Dubowska, W. (2017). Resveratrol and its methoxy derivatives modulate the expression of estrogen metabolism enzymes in breast epithelial cells by AhR down-regulation. Mol. Cell. Biochem. 425, 169–179. doi: 10.1007/s11010-016-2871-2
Mechtcheriakova, D., Sobanov, Y., Holtappels, G., Bajna, E., Svoboda, M., Jaritz, M., et al. (2011). Activation-induced cytidine deaminase (AID)-associated multigene signature to assess impact of AID in etiology of diseases with inflammatory component. PLoS One 6:e25611. doi: 10.1371/journal.pone.0025611
Mechtcheriakova, D., Wlachos, A., Sobanov, J., Kopp, T., Reuschel, R., Bornancin, F., et al. (2007). Sphingosine 1-phosphate phosphatase 2 is induced during inflammatory responses. Cell. Signal. 19, 748–760. doi: 10.1016/j.cellsig.2006.09.004
Meshcheryakova, A., Svoboda, M., Tahir, A., Kofeler, H. C., Triebl, A., Mungenast, F., et al. (2016). Exploring the role of sphingolipid machinery during the epithelial to mesenchymal transition program using an integrative approach. Oncotarget 7, 22295–22323. doi: 10.18632/oncotarget.7947
Mesía-Vela, S., and Kauffman, F. C. (2003). Inhibition of rat liver sulfotransferases SULT1A1 and SULT2A1 and glucuronosyltransferase by dietary flavonoids. Xenobiotica 33, 1211–1220. doi: 10.1080/00498250310001615762
Mohamed, M. E., and Frye, R. F. (2011). Effects of herbal supplements on drug glucuronidation. Review of clinical, animal, and in vitro studies. Planta Med. 77, 311–321. doi: 10.1055/s-0030-1250457
Moscovitz, J. E., Kalgutkar, A. S., Nulick, K., Johnson, N., Lin, Z., Goosen, T. C., et al. (2018). Establishing transcriptional signatures to differentiate PXR-, CAR-, and AhR-mediated regulation of drug metabolism and transport genes in cryopreserved human hepatocytes. J. Pharmacol. Exp. Ther. 365, 262–271. doi: 10.1124/jpet.117.247296
Mueller, J. W., Gilligan, L. C., Idkowiak, J., Arlt, W., and Foster, P. A. (2015). The regulation of steroid action by sulfation and desulfation. Endocr. Rev. 36, 526–563. doi: 10.1210/er.2015-1036
Murias, M., Jäger, W., Handler, N., Erker, T., Horvath, Z., Szekeres, T., et al. (2005). Antioxidant, prooxidant and cytotoxic activity of hydroxylated resveratrol analogues: structure-activity relationship. Biochem. Pharmacol. 69, 903–912. doi: 10.1016/j.bcp.2004.12.001
Murias, M., Miksits, M., Aust, S., Spatzenegger, M., Thalhammer, T., Szekeres, T., et al. (2008). Metabolism of resveratrol in breast cancer cell lines: impact of sulfotransferase 1A1 expression on cell growth inhibition. Cancer Lett. 261, 172–182. doi: 10.1016/j.canlet.2007.11.008
Oskarsson, A., Spatafora, C., Tringali, C., and Andersson, Å. O. (2014). Inhibition of CYP17A1 activity by resveratrol, piceatannol, and synthetic resveratrol analogs. Prostate 74, 839–851. doi: 10.1002/pros.22801
Pan, M. H., Chiou, Y. S., Chen, L. H., and Ho, C. T. (2015). Breast cancer chemoprevention by dietary natural phenolic compounds: specific epigenetic related molecular targets. Mol. Nutr. Food Res. 59, 21–35. doi: 10.1002/mnfr.201400515
Pasqualini, J. R. (2009). Estrogen sulfotransferases in breast and endometrial cancers. Ann. N. Y. Acad. Sci. 1155, 88–98. doi: 10.1111/j.1749-6632.2009.04113.x
Poschner, S., Zehl, M., Maier-Salamon, A., and Jäger, W. (2017). Simultaneous quantification of estrogens, their precursors and conjugated metabolites in human breast cancer cells by LC-HRMS without derivatization. J. Pharm. Biomed. Anal. 138, 344–350. doi: 10.1016/j.jpba.2017.02.033
Riha, J., Brenner, S., Böhmdorfer, M., Giessrigl, B., Pignitter, M., Schueller, K., et al. (2014). Resveratrol and its major sulfated conjugates are substrates of organic anion transporting polypeptides (OATPs): impact on growth of ZR-75-1 breast cancer cells. Mol. Nutr. Food Res. 58, 1830–1842. doi: 10.1002/mnfr.201400095
Saluzzo, J., Hallman, K. M., Aleck, K., Dwyer, B., Quigley, M., Mladenovik, V., et al. (2016). The regulation of tumor suppressor protein, p53, and estrogen receptor (ERα) by resveratrol in breast cancer cells. Genes Cancer 7, 414–425. doi: 10.18632/genesandcancer.125
Samavat, H., and Kurzer, M. S. (2015). Estrogen metabolism and breast cancer. Cancer Lett. 356, 231–243. doi: 10.1016/j.canlet.2014.04.018
Scarlatti, F., Maffei, R., Beau, I., Codogno, P., and Ghidoni, R. (2008). Role of non-canonical Beclin 1-independent autophagy in cell death induced by resveratrol in human breast cancer cells. Cell Death Differ. 15, 1318–1329. doi: 10.1038/cdd.2008.51
Ung, D., and Nagar, S. (2009). Trans-resveratrol-mediated inhibition of beta-oestradiol conjugation in MCF-7 cells stably expressing human sulfotransferases SULT1A1 or SULT1E1, and human liver microsomes. Xenobiotica 39, 72–79. doi: 10.1080/00498250802604082
Yildiz, F. (2005). Phytoestrogens in Functional Foods. Boca Raton, FL: CRC Press. doi: 10.1201/9781420027594
Keywords: resveratrol, breast cancer, MDA-MB-231, MCF-7, steroids, metabolomics
Citation: Poschner S, Maier-Salamon A, Zehl M, Wackerlig J, Dobusch D, Meshcheryakova A, Mechtcheriakova D, Thalhammer T, Pachmann B and Jäger W (2018) Resveratrol Inhibits Key Steps of Steroid Metabolism in a Human Estrogen-Receptor Positive Breast Cancer Model: Impact on Cellular Proliferation. Front. Pharmacol. 9:742. doi: 10.3389/fphar.2018.00742
Received: 26 March 2018; Accepted: 19 June 2018;
Published: 10 July 2018.
Edited by:
Dagmar Meyer zu Heringdorf, Goethe-Universität Frankfurt am Main, GermanyReviewed by:
Marc Poirot, Institut National de la Santé et de la Recherche Médicale (INSERM), FranceDan Cacsire Castillo-Tong, Medizinische Universität Wien, Austria
Copyright © 2018 Poschner, Maier-Salamon, Zehl, Wackerlig, Dobusch, Meshcheryakova, Mechtcheriakova, Thalhammer, Pachmann and Jäger. This is an open-access article distributed under the terms of the Creative Commons Attribution License (CC BY). The use, distribution or reproduction in other forums is permitted, provided the original author(s) and the copyright owner(s) are credited and that the original publication in this journal is cited, in accordance with accepted academic practice. No use, distribution or reproduction is permitted which does not comply with these terms.
*Correspondence: Walter Jäger, walter.jaeger@univie.ac.at