Update on the Crosstalk Between Adipose Tissue and Mineral Balance in General Population and Chronic Kidney Disease
 Vasiliki Karava
 Athanasios Christoforidis2
  John Dotis
 Nikoleta Printza
- 1Pediatric Nephrology Unit, 1st Department of Pediatrics, Hippokratio General Hospital, Aristotle University of Thessaloniki, Thessaloniki, Greece
- 2Pediatric Endocrinology Unit, 1st Department of Pediatrics, Hippokratio General Hospital, Aristotle University of Thessaloniki, Thessaloniki, Greece
Adipose tissue is nowadays considered as a major endocrine organ, which apart from controlling lipid metabolism, displays a significant role in energy expenditure, food intake and in the regulation of various systemic physiological processes. Adipose derived pro-inflammatory cytokines and adipokines, particularly leptin and adiponectin, provide inter-communication of adipose tissue with various metabolic pathways, ultimately resulting in a complex network of interconnected organ systems. Recent clinical and experimental research has been focused on exploring the direct interaction between adipokine profile and elements of mineral metabolism, including parathormone (PTH), fibroblast growth factor-23 (FGF23) and calcitriol. The emerging crosstalk between adipose tissue and calcium and phosphorus homeostasis suggests that metabolic disorders from one system may directly affect the other and vice versa. It is current knowledge that fat metabolism disturbance, commonly encountered in obese individuals, influences the expression of calciotriopic hormones in general population, while various clinical trials attempting to successfully achieve body fat loss by modulating mineral profile have been published. In chronic kidney disease (CKD) state, there is an increasing evidence suggesting that mineral disorders, influence adipose tissue and linked endocrine function. On the contrary, the impact of disturbed fat metabolism on CKD related mineral disorders has been also evocated in clinical studies. Recognizing the pathogenetic mechanisms of communication between adipose tissue and mineral balance is critical for understanding the effects of metabolic perturbations from the one system to the other and for identifying possible therapeutic targets in case of disrupted homeostasis in one of the two connected systems. To that end, this review aims to enlighten the recent advances regarding the interplay between mineral metabolism, fat mass and adipokine profile, based on in vitro, in vivo and clinical studies, in general population and in the course of CKD.
Introduction
It is current knowledge that white adipose tissue serves as a principal human energy repository in the form of triglycerides, and coordinates lipid metabolism in order to maintain whole body free fatty acid balance. Among the adipocyte-derived secreted proteins, also called adipokines, adiponectin boosts lipid storage and adipogenesis, while leptin blocks adipogenesis and enhances triglyceride hydrolysis (1). Both hormones stimulate fatty acid beta oxidation, inhibiting ectopic fat deposition (1). Emerging evidence indicates that adipokines exhibit not only autocrine and paracrine but also pleiotropic endocrine activity. Leptin and adiponectin intercommunicate with central nervous system, though reciprocal hypothalamic effects, providing homeostasis of energy expenditure, appetite, and subsequently body weight (2). Moreover, adipose tissue derived pro-inflammatory cytokines and adipokines are involved in the regulation of various physiological processes, such as local and systemic inflammation (3), cardiovascular function (4), glucose homeostasis (5), bone hematopoiesis (6), renin-angiotensin system and sodium balance (7). Components of these systems are, in turn, interconnected with elements of mineral homeostasis (8–10). Nevertheless, emerging evidence indicate, apart from indirect, a reciprocal direct communication between mineral metabolism, adiposity and related endocrine function (11). Chronic kidney disease (CKD) is a condition characterized by mineral disorders, which potentially modulate fat metabolism. On the opposite, body fat mass and adipokine profile affects mineral metabolism in general population and may additionally affect CKD-related mineral disorders. The purpose of this review paper is to enlighten the recent advances regarding the direct crosstalk between mineral metabolism, fat mass and adipokine profile, in general population and in CKD, based on in vitro, in vivo and clinical studies.
Adipokines Balance and Mineral Homeostasis in General Population and CKD
Adipokines Balance in General Population and CKD
In general population, serum adipokines levels are principally influenced by adipose tissue mass and individual energy demands. In specific, adiponectin expression is enhanced in lean individuals, while leptin expression increases with obesity (12, 13). Low energy expenditure state, including fasting and caloric deprivation diets, is significantly linked to decreased serum leptin and possibly to increased serum adiponectin (14).
CKD is associated with perturbated adipokine profile. Reduced renal clearance of leptin and adiponectin, although the latter is primarily excreted by the liver, may in part explicate the higher serum leptin and adiponectin levels commonly observed in both adult and pediatric patients, compared to healthy controls (15–23). Moreover, body fat mass plays, as expected, a major role on adipokines expression among CKD patients (24, 25). In detail, relatively higher serum leptin (15, 24, 25) and relatively lower serum adiponectin levels (26) are often encountered in overweight adult and pediatric patients, while poor nutritional status is often related to lower leptin and higher adiponectin serum profile (27, 28). Furthermore, uremic condition may affect adipokines production (20, 29). Experimental studies indicated that uremic milieu increased adipocyte production of adiponectin and leptin (30–32). In clinical studies, serum leptin levels were positively correlated to various serum inflammatory cytokines levels in CKD 5 patients, suggesting a possible contributive role of systemic inflammation on leptin overproduction in CKD (33, 34). However, other researchers report that adipose tissue leptin and adiponectin expression are downregulated in CKD, as a result of a negative feedback regulation from reduced renal clearance (19, 35, 36).
Mineral Homeostasis in General Population and CKD
Mineral metabolism is based on a complex network of interconnected organs including intestine, kidney and parathyroid gland, ensuring homeostasis of calcium, phosphate, vitamin D, parathormone (PTH), and fibroblast growth factor-23 (FGF23). Each regulator of mineral metabolism possesses multiple roles. In brief, PTH secretion inhibits phosphate reabsorption in renal proximal tubule, promotes calcium reabsorption in the distal tubules, stimulates renal calcitriol production and increases calcium and phosphate resorption from bone (37). Osteocyte and osteoblast released FGF23 downregulates phosphate reabsorption in renal proximal tubule, activates calcium reabsorption in distal tubules, decreases serum calcitriol, by both suppression of renal 1a-hydroxylase synthesis and stimulation of 24-hydroxylase, and weakly inhibits PTH excretion (38). Both actions on kidney and parathyroid gland are mediated via requisite linkage of FGF23 with its co-receptor and co-factor transmembrane protein called Klotho (39). Finally, calcitriol stimulates intestinal calcium and phosphorus absorption, triggers FGF23 synthesis and renal klotho expression and blocks PTH production.
CKD is strongly associated with mineral abnormalities leading to defective bone mineralization. Progressive decline in renal function reduces renal phosphorus clearance and calcitriol synthesis, which in turn, directly stimulate PTH secretion (40). Hypocalcemia, secondary to decreased calcitriol-induced calcium intestinal absorption, calcium-phosphate precipitation in extra-skeletal tissues and skeletal resistance to PTH action, further enhances and sustains secondary hyperparathyroidism (41). Current clinical data indicate that FGF23 rise precedes increments in PTH during the course of CKD (42). In fact, increased phosphate levels boost FGF23 production, which additionally aggravates calcitriol suppression, leading to further stimulation of PTH production (40). Furthermore, renal klotho expression is reduced in parallel with progression of CKD, which according to two hypothetical scenarios, may either precede serum FGF23 rise, leading possibly to target-organ resistance to FGF23 and maintenance of increased serum FGF23 levels, or may be secondary to negative feedback from primary FGF23 excess (42).
Effects of Adipokine Profile on Mineral Homeostasis
Results From Experimental Studies
Our current knowledge regarding the effects of adipokine profile on mineral homeostasis partially derives from experimental in-vitro and in-vivo studies (11) (Figure 1). We will focus on the reported impact of adipose tissue derived leptin and adiponectin on mineral metabolism.
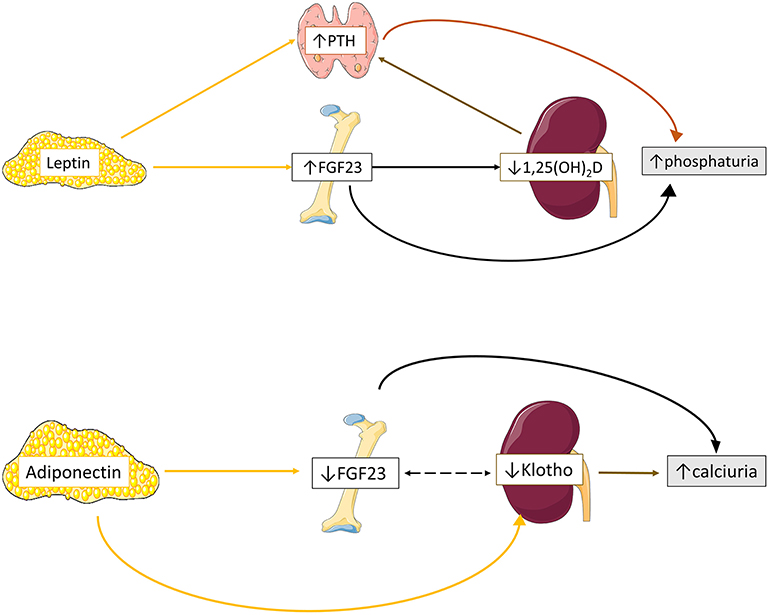
Figure 1. Proposed schematic overview of adipokines effects on mineral homeostasis. Leptin upregulates bone FGF23 expression leading to reduced 1,25(OH)2D production and subsequently to enhanced PTH excretion. In parallel, leptin directly stimulates PTH excretion. Both elevated FGF23 and PTH secretion ultimately results in increased phosphaturia. Adiponectin downregulates bone FGF23 and renal Klotho expression, leading to increased calciuria. Data from (11, 43–45).
Effects of Leptin on Mineral Metabolism
Tsuji et al. were the first to demonstrate that leptin administration directly stimulates bone FGF23 but not renal Klotho transcription in leptin-deficient mice (43), probably through activation of JAK-STAT pathway, leading to downregulation of type II sodium phosphate tubular cotransporter (NPT2a) and phosphaturia (43). Interestingly, in another study on osteocyte-like bone cells leptin administration lacked direct influence on FGF23 expression but positively modulated calcitriol induction of bone FGF23 production (46). The positive effect of leptin on FGF23 expression has shed light regarding its impact on vitamin D metabolism. In-vivo studies on leptin deficient mice have shown that upregulation of bone FGF23 secretion by leptin administration blocks proximal tubular calcitriol production, leading to reduction of serum calcitriol levels and vitamin D 1-a hydroxylase activity (43, 46–48).
The effects of leptin on PTH secretion has been examined in few experimental models (44). Leptin administration increased PTH expression in animal (49) and human (50) incubated parathyroid glands and in leptin-deficient and wild-type mice (43, 47, 49, 50). An indirect effect of leptin on parathyroid glands was suggested by Matsunuma et al. and Tsuji et al. studies, through upregulation of FGF23 expression (43) and downregulation of calcitriol production (43, 47). Nevertheless, Lopez et al. showed that leptin administration increased PTH levels, although no significant change in calcitriol and FGF23 expression was observed (49). Subsequently, leptin receptors were detected in the cytoplasm of both animal (49) and human parathyroid chief cells (50), suggesting a direct positive modulatory role of leptin on PTH secretion. Moreover, the detection of leptin expression on parathyroid gland tissue, and especially in case of hyperplasia, indicated that parathyroid gland is also a source of leptin production (50).
Effects of Adiponectin on Mineral Metabolism
Adiponectin seems to exert an opposite to leptin effect on FGF23 metabolism (45). According to Rutkowski, adiponectin inhibited osteocyte FGF23 and renal tubular epithelial Klotho expression in vitro, with no effect regarding to NPT2a transcriptional regulation (45), resulting in reduced serum FGF23 and Klotho levels and increased tubular fraction calcium excretion in adiponectin-overexpressing mice (45). Interestingly, although no change on PTH and calcitriol expression was observed in-vivo among adiponectin overexpressing, knockout and wildtype mice, adiponectin seems to modulate their expression after phosphorus and calcium loading (45). In detail, phosphorus loading resulted to relatively attenuated PTH in adiponectin knockout mice and amplified FGF23 release in adiponectin-overexpressing mice, while calcium loading boosted calcitriol expression in the latter type of mice (45).
Impact of Obesity on Mineral Metabolism in General Population
The impact of obesity on mineral profile has been intensively studied during the last decades in various populations. Earlier studies were focused on patients with morbid obesity, in whom serum 25(OH)D levels were lower and serum PTH levels higher compared to healthy controls (51–54). Subsequent studies in healthy population confirmed that increased body mass index (BMI) is associated to hypovitaminosis D, while body fat mass is inversely correlated to serum 25(OH)D levels and positively correlated to serum PTH levels in both adult (55–61) and pediatric subjects (62–68). Furthermore, weight loss was accompanied by increase in serum 25(OH)D levels (69, 70) and decrease in serum PTH levels (70, 71) in both adult and pediatric cohort studies, suggesting that obesity is a modifiable risk factor of mineral disorder.
Impact of Obesity on Mineral Metabolism in CKD
Along with clinical observations in general population, serum 25(OH)D deficiency was more prevalent in adult and pediatric overweight patients with CKD in various clinical studies (72–78) (Table 1). Moreover, obesity was positively associated with secondary hyperparathyroidism in adult patients with CKD (79–82) and in pediatric kidney transplant recipients (83), while low PTH level was considered as a marker of malnutrition-inflammation complex condition in CKD 5D patients (82) (Table 2). However, no association was observed between PTH and BMI status in other cross-sectional studies (75, 84).
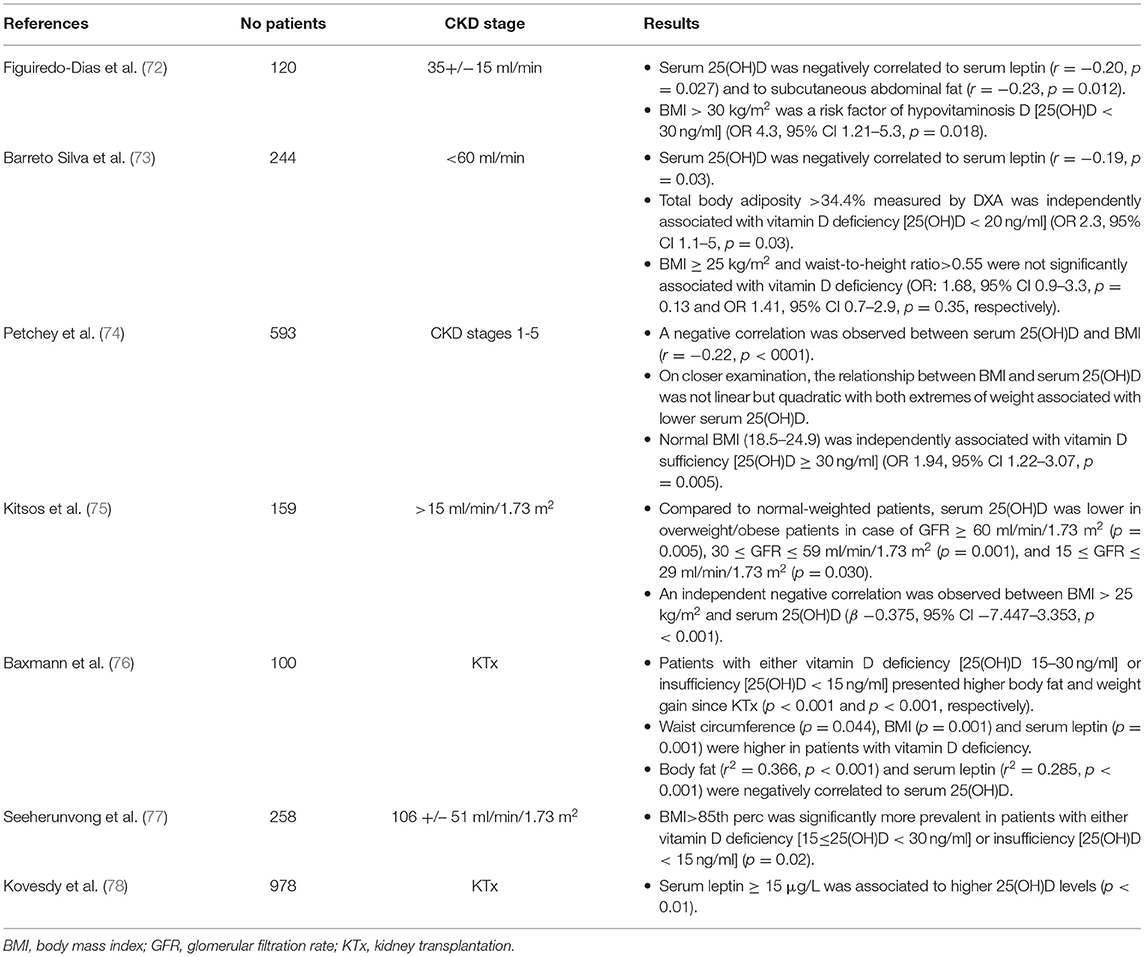
Table 1. Results of clinical studies investigating the association between serum 25(OH)D levels, fat mass and adipokine profile in patients with chronic kidney disease (CKD).
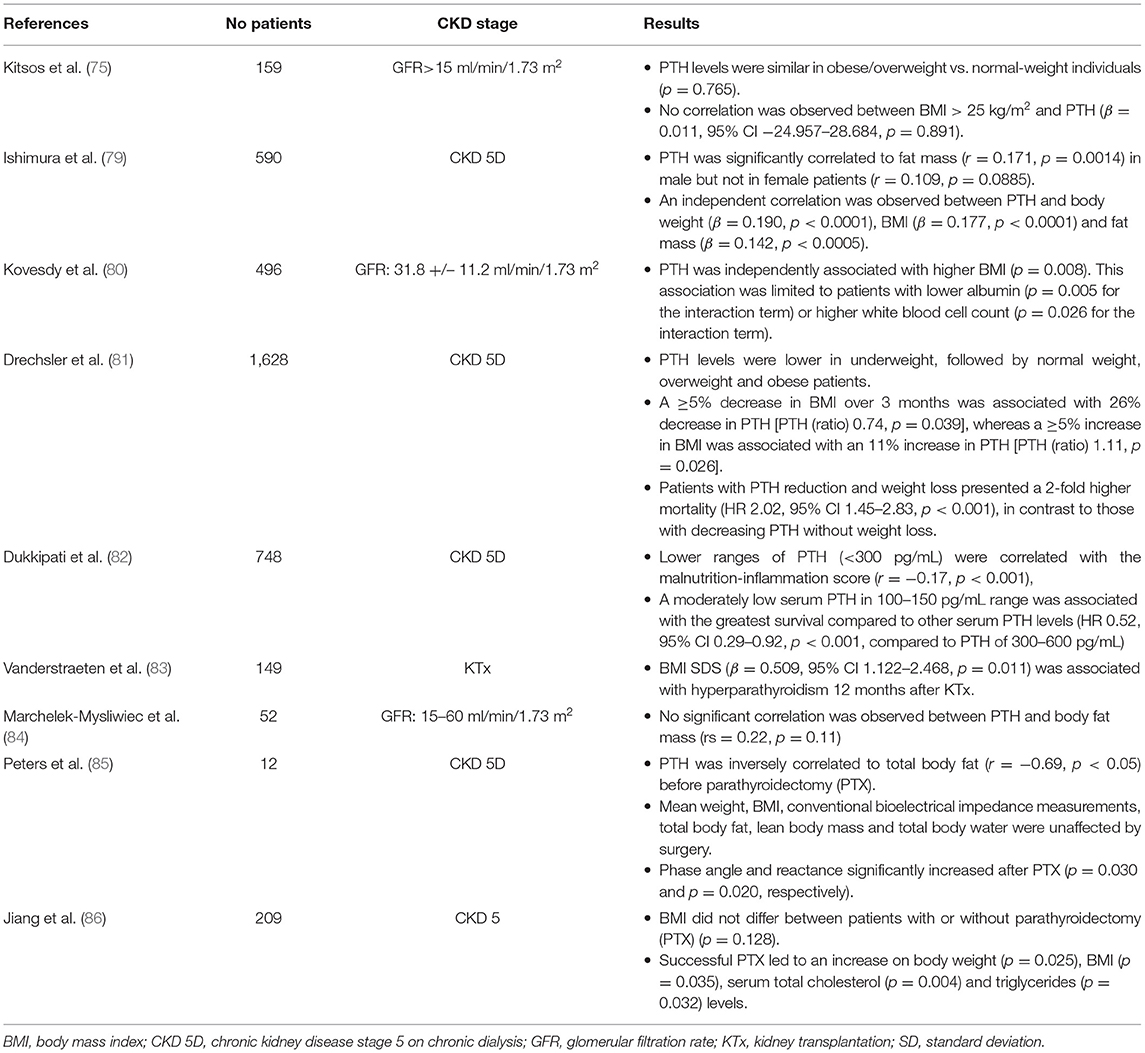
Table 2. Results of clinical studies investigating the association between parathormone (PTH) and fat mass in patients with chronic kidney disease (CKD).
Pathogenesis of Obesity Related Mineral Disorders
Obesity and Vitamin D Deficiency
Multiple pathogenetic mechanisms have been proposed for the comprised vitamin D status in obese population (Figure 2). Decreased bioavailability of vitamin D from cutaneous and dietary sources due to sequestration in body fat compartments (87–89) or volumetric dilution in the large fat mass (90) largely explains the lower serum 25(OH)D levels in obese population. Reduced sun ultraviolet B exposure, attributed to sedentary lifestyle, involving limited outdoor activities, and inadequate mineral intake from unhealthy high caloric food, may also play a role on the occurrence of hypovitaminosis D in obese individuals, who frequently require higher amount of cholecalciferol supplementation to normalize 25(OH)D levels compared to normal-weight controls (91–93). Nevertheless, in few adult and pediatric studies, the negative association between 25(OH)D and body fat mass remained significant after controlling for sunlight exposure and dietary intake of calcium and vitamin D3 (51, 94). Furthermore, according to some authors, lower serum 25(OH)D levels may be attributed to negative feedback from increased 1,25(OH)2D production, due to high serum PTH, on hepatic 25(OH)D synthesis (51). However, this assumption was not confirmed in all clinical studies. In specific, serum 1,25(OH)2D levels have been variously reported as higher (51, 54, 95, 96), similar (94), or lower (56, 97, 98) in obese population compared to normal-weight controls and the association between serum 25(OH)D and body adiposity status seems independent of serum PTH levels (58).
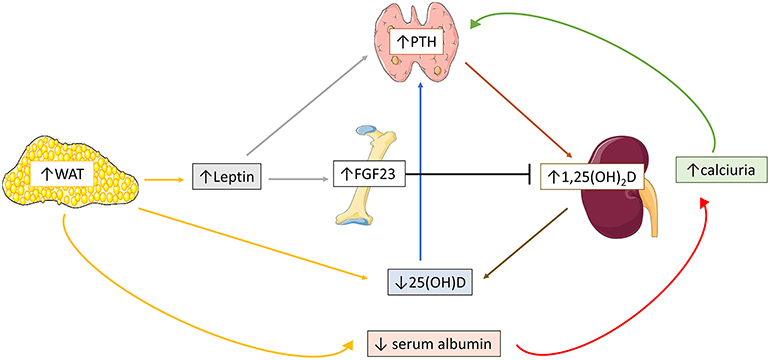
Figure 2. Schematic overview of the possible pathogenetic mechanisms implicated in obesity-related mineral disorders. Increased white adipose tissue (WAT) stimulates adipocyte leptin expression, which in turn triggers fibroblast growth-factor-23 (FGF23) and parathormone (PTH) secretion. High body fat mass is also associated with reduced serum 25(OH)D levels, which in turn accentuates PTH secretion. Increased 1,25(OH)2D expression secondary to high PTH levels further enhances 25(OH)D deficiency. Reduced renal tubular calcium reabsorption, due to decreased serum calcium-binding protein profile, additionally increases PTH expression.
Obesity and Hyperparathyroidism
The pathogenesis of obesity-related hyperparathyroidism has been partly clarified (Figure 2). Hypovitaminosis D does not determinedly affect occurrence of obesity induced hyperparathyroidism, given that the association between serum PTH and body fat mass is independent of vitamin D status (54, 58). Some investigators suggest that the reduced calcium binding protein profile often encountered in obese subjects, may decrease renal tubular calcium reabsorption and serum ionized calcium, ultimately leading to hyperparathyroidism (71, 99). Nevertheless, the difference of serum ionized calcium between obese and normal-weight individuals was not always significant (51, 100). The absence of elevated serum PTH in non-obese vitamin D deficient subjects implies that adipose endocrine function modifies vitamin D—PTH axis (101). Recent clinical studies have shown that disrupted adipokine profile along with increased body fat mass is the main incriminating factor of disturbed mineral homeostasis. In specific, hyperleptinemia, commonly observed in obesity, was positively correlated to PTH in both adult and pediatric individuals (97, 102), indicating that stimulation of leptin—PTH axis is the initial source of hyperparathyroidism. Furthermore, increased serum leptin levels are probably implicated in the enhanced FGF23 expression in obesity. In detail, circulating FGF23 levels were often elevated in both adult and pediatric obese population, and positively correlated to fat mass accumulation (102–107). Of notice, non-remarkable changes in serum FGF23 levels were reported between hypertensive obese and non-obese children, while serum FGF23 levels were decreased in obese pediatric subjects in a cross-sectional study (108, 109). The conflicting impact of PTH and FGF23 on 1,25(OH)2D expression and vice versa may be the cause of the discrepancy of serum 1,25(OH)2D and FGF23 levels in obese population among different clinical studies (97).
Effects of Mineral Homeostasis on Adipose Tissue and Adipokine Profile
Results From Experimental Studies
Effects of Calcium on Adipose Tissue
During the last decades, there is emerging evidence favoring a key role of calcium balance on regulation of adiposity. Firstly, experimental studies demonstrated that agouti protein, an obesity gene product, acts on adipocytes via a calcium dependent mechanism, suggesting that adipocyte intracellular calcium regulates adipocyte lipid metabolism by stimulation of lipogenesis and inhibition of lipolysis (110). Calcium deficiency state promotes intracellular calcium overload, a state defined as calcium paradox (111). Toward this direction, enhancement of calcium intake in transgenic mice expressing the agouti gene reduced adipocyte calcium influx, and subsequently led to weight loss (110, 112). Further studies indicate that high-calcium intake disrupts gut fat absorption by promoting the formation of insoluble calcium-fatty acid soaps, which are ultimately excreted in the feces (113, 114), and may also negatively influence appetite (113, 115), or even activate calcium dependent apoptotic proteases in mature adipocytes (116), signifying a complex modulatory control of adiposity by calcium homeostasis (117).
Effects of PTH on Adipose Tissue and Adipokine Profile
The effect of PTH on adipose tissue remains controversial. It was generally hypothesized that PTH promotes fat storage, by enhancing calcium influx in adipocytes (118). Nonetheless, in vitro studies have shown that PTH induces lipolysis (119–121), probably via protein kinase A (PKA)-mediated phosphorylation of hormone-sensitive lipase (122). Further experiments in mice with primary hyperparathyroidism indicate that elevated PTH promotes browning of white adipose tissue, contributing to body weight loss (123). Toward the same direction, a recent study on CKD mice remarked that PTH contributes to white adipose tissue browning and wasting, by promotion of thermogenic genes expression, and more precisely uncoupling protein-1 (Ucp1), via PKA pathway activation, eventually leading to fat store depletion (124, 125).
The effect of PTH on leptin expression has not been clarified yet. In a study by Hoang et al., subcutaneous adipose tissue explants treatment with PTH resulted in increased leptin expression, indicating a positive modulatory role of PTH on leptin expression (50). Nevertheless, a negative feedback effect of PTH on leptin secretion was proposed in case of secondary hyperparathyroidism (44). Jiang et al. studied leptin and PTH interaction in case of secondary hyperparathyroidism by treating differentiated adipocytes in vitro with human serum belonging to CKD patients with severe secondary hyperparathyroidism before and after parathyroidectomy and to CKD patients with lower PTH levels (86). Adipocyte leptin expression and production was relatively reduced in case of severe secondary hyperparathyroidism and increased after parathyroidectomy (86). Furthermore, the authors found that high PTH levels suppressed adipocyte leptin production in vitro via inhibition of Akt signaling, indicating a negative effect of PTH on adipocyte leptin secretion (86). Conclusively, a positive loop between leptin and PTH is probably the case in primary hyperparathyroidism, whereas PTH seems to inhibit leptin expression in severe secondary hyperparathyroidism (44).
Effects of Calcitriol on Adipose Tissue and Adipokine Profile
The role of calcitriol on adipogenesis is probably equivocal, by either promoting (126) or impeding (127, 128) adipogenesis, depending of the type of adipocyte and stage of adipocyte differentiation (129). In specific, calcitriol treatment increases intracellular calcium and inhibits thermogenic gene uncoupling protein 2 (UCP2) expression in human adipocytes, leading to stimulation of lipogenesis and suppression of lipolysis (130, 131). On the contrary, calcitriol induces apoptosis of mature mouse 3T3-L1 adipocytes probably via activation of calcium-dependent calpain and caspase-12 (132). In CKD mice, intraperitoneal administration of calcitriol ameliorated cachexia, stimulated appetite, improved weight gain and fat mass content and attenuated the expression of thermogenic genes and other key molecules involved in adipose tissue browning (133).
The reciprocal effect of FGF23-calcitriol axis on adipokines secretion has not been elucidated yet. Long-term FGF23 deficiency does not affect fat metabolism in animal vitamin D receptor mutant mice (134) and FGF23 receptors are not present in adipose tissue (39), suggesting that FGF23 effect on adipose tissue is probably indirect, mediated by calcitriol induced activation of adipose tissue vitamin D receptor (135–137). The results of experimental models investigating the interplay between calcitriol and adipokine profile are contradictory and inconsistent. In vivo studies have shown that vitamin D receptor knockout mice develop a lean phenotype combined with lower serum leptin and higher serum adiponectin levels (138, 139), while mice with targeted overexpression of vitamin D receptor present obesity associated with higher serum leptin and lower serum adiponectin levels (140). Besides, direct stimulatory effect of calcitriol on leptin expression via a vitamin D receptor dependent manner was demonstrated in adipose tissue derived from mice epididymal fat pads (141). Accordingly, calcitriol attenuates adiponectin production in human pre-adipocytes (142). Nevertheless, in vitro studies have shown negative control of leptin secretion by calcitriol on human adipose tissue (143) and in mouse 3T3-L1 adipocytes (144). Furthermore, calcitriol treatment upregulated adiponectin in 3T3-L1 mature adipocytes (145) and in high glucose cultured 3T3-L1 adipocytes (146), while it had no effect on leptin expression in differentiated cultured human adipocytes in another in-vitro study (147). Taken together, there is a discrepancy regarding the role of calcitriol on leptin and adiponectin expression between in-vivo animal and in-vitro animal and human studies. Further studies are needed to enlighten the possible effect of calcitriol on the adipose tissue mass and adipokine profile depending on the type and maturation stage of target tissue.
Effects of Klotho on Adipose Tissue
Few experimental models have attempted to detect the role of Klotho on adipose tissue, through regulation of energy homeostasis. Administration of a-Klotho in obese high-fat feed mice resulted in reduced adiposity, increased lean mass, elevated energy expenditure and reduced lipid accumulation in liver and adipose tissue, probably by downregulating the expression of lipogenic genes (148). On the other hand, a-Klotho knock-out mice presented a barely detectable amount of white adipose tissue but preserved brown adipose tissue, reduced energy expenditure, mimicking a food-restricted condition (149). Moreover, a-Klotho suppression reduced while a-Klotho overexpression increased mRNA expression of adipocyte differentiation markers in vitro, suggesting that this hormone promotes adipocyte differentiation during the period of transient proliferation in the differentiation process (150). Further studies are needed to enlighten the potential role of a-klotho on fat metabolism.
Impact of Mineral Homeostasis on Fat Mass and Adipokine Profile in General Population
The potential role of mineral homeostasis, including PTH, calcium and vitamin D status, on body fat mass in humans has been thoroughly investigated. It is current knowledge that patients with primary hyperparathyroidism usually exhibit higher BMI compared to healthy controls (151). Nevertheless, parathyroidectomy does not seem to determinately influence lipid profile and cardiovascular outcome of these patients (152, 153). On the other hand, according to a recent large-scale longitudinal case-control study, parathyroidectomy seems to finally lead to increased truck fat mass (152). Therefore, it is probable that obesity predisposes to the incidence of primary hyperparathyroidism, but it is unlikely that obesity is the result of the PTH anabolic effect on adipose tissue (151).
Although weight loss is associated with increased circulating 25(OH)D levels (69, 70), the reciprocal beneficial effect of vitamin D status on body fat mass remains controversial among clinical studies. Some clinical trials have reported that native vitamin D supplementation favorizes weight loss, body fat mass reduction and metabolic profile in obese adult (154) and pediatric (155, 156) population, while in other studies no related difference on weight loss was observed in obese subjects assigned to receive daily native vitamin D (157). Therefore, the effect of native vitamin D supplementation on successfully body fat mass reduction remains unclear, with a total insignificant effect reported by some (158, 159) but not all meta-analysis studies (160).
Emerging clinical data remarking a significant association between lower calcium intake and greater fat mass in both adult and pediatric population have raised the question whether calcium supplementation may facilitate weight loss in obese subjects (113). Despite the encouraging results of several trials indicating that higher calcium intake results in relatively lower fat mass gain (161), increased fecal fat excretion (162, 163), and ultimately fat loss (164), no significant effect was evoked in meta-analysis studies in both adult (165), and pediatric (166) subjects. Calcium combined to vitamin D supplementation seems a promising therapeutic option for facilitating weight loss, according to some trials, but data are still limited (167, 168). Conclusively, whether supplementation of both calcium and vitamin D may favorize weight loss and body fat mass reduction in subjects with initially low calcium diet and vitamin D deficiency as well as the supplementation dose required to achieve such outcome needs further investigation.
Impact of Mineral Homeostasis on Fat Mass and Adipokine Profile in Patients With CKD
Clinical studies investigating the effects of mineral balance on fat mass and adipokine profile in patients with CKD are limited and principally concern adult population. We present the current relevant literature, and we suggest the possible mechanisms involved in the disturbed fat metabolism in the setting of CKD-related mineral disorders.
Effects of Secondary Hyperparathyroidism on Fat Mass and Adipokine Profile in Patients With CKD
According to Peters et al., severely increased serum PTH levels in CKD 5D patients with need for parathyroidectomy exerted a negative effect on total body fat mass (85). Moreover, successful parathyroidectomy led to improvement of malnutrition and increase in weight and BMI in adult patients with severe secondary hyperparathyroidism (86). Therefore, although obesity per se may be associated with higher serum PTH levels in CKD patients, severe secondary hyperparathyroidism seems to be inversely correlated to body adiposity status and implicated in the pathogenesis of advanced CKD-related cachexia (169). These results are in accordance with the white adipose tissue browning effect of secondary hyperparathyroidism observed in CKD mice (124, 125).
Taking into consideration that adipokine profile majorly reflects body fat mass levels even in patients with CKD, the discrepancy among the reports investigating the association between PTH and fat mass may also explain the variety of associations observed regarding the correlation between PTH and adipokine profile in this population (29, 44). In detail, serum leptin was negatively correlated to PTH in three clinical studies including 46, 73, and 161 hemodialysis patients, respectively (25, 170, 171), confirming the negative impact of secondary hyperparathyroidism on leptin secretion remarked in experimental studies (44, 86). However, leptin was positively correlated to circulating PTH levels in a cohort of 978 kidney transplant recipients (78) and 142 patients with CKD stage 2–5 (172), while no correlation was observed in three cross-sectional studies of 37, 72, and 107 hemodialysis patients (173–175). Interestingly, serum adiponectin levels were positively correlated to circulating PTH levels in a large scale cross-sectional study, including 716 patients with various CKD stages (176). This result accords with the findings of lessened PTH secretion in adiponectin knockout mice after phosphate loading (45). Considering that phosphate retention is increased in CKD, higher adiponectin levels are expected to be correlated to higher PTH levels.
Conclusively, according to clinical and experimental studies, higher body fat mass may promote secondary hyperparathyroidism, but simultaneously, severe secondary hyperparathyroidism may contribute to white adipose tissue reduction. Additionally, PTH possibly blocks leptin secretion in case of severe secondary hyperparathyroidism. Moreover, higher serum adiponectin levels seem to favorize PTH secretion, especially in the context of increased phosphate retention (Figure 3). Further studies are needed to draw firm conclusions regarding the potential role of the severity and duration of secondary hyperparathyroidism on the disturbed fat metabolism in CKD.
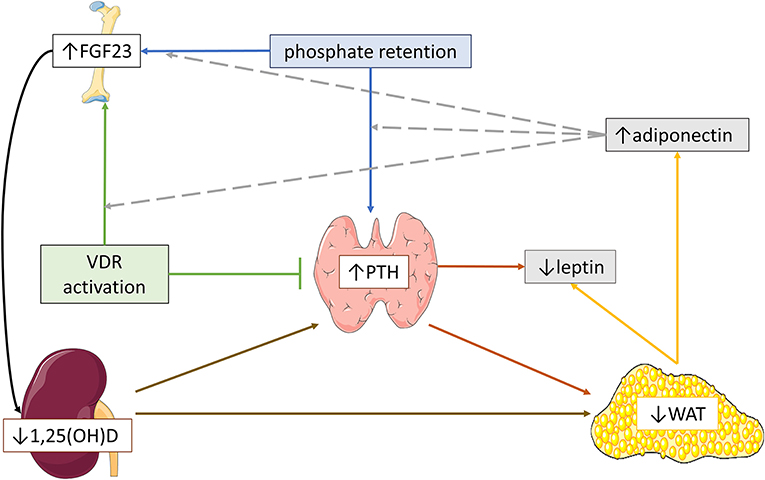
Figure 3. Schematic hypothetical overview of the possible pathogenetic mechanisms implicated in the effects of parathormone (PTH) and fibroblast growth factor-23 (FGF23)-calcitriol axis on adipose tissue and adipokine profile in severe CKD. In advanced chronic kidney disease, severe secondary hyperparathyroidism and reduced 1,25(OH)2D expression may induce white adipose tissue (WAT) reduction, leading to lower serum leptin and higher serum adiponectin. In parallel, high circulating FGF23 levels might aggravate WAT reduction via blockage of 1,25(OH)2D expression, which in turn, further stimulates PTH secretion. Moreover, severe secondary hyperparathyroidism possibly downregulates leptin expression. Higher serum adiponectin may favorize the upregulation of FGF23 and PTH secretion by phosphate retention and the upregulation of FGF23 secretion by vitamin D receptor (VDR) activation.
Effects of FGF23/Calcitriol Axis on Fat Mass and Adipokine Profile in Patients With CKD
The association between FGF23 and body adiposity status has been rarely studied in CKD. Circulating FGF23 levels were negatively correlated to BMI (177) and fat mass (178) in adult CKD 5D patients in two recent studies. There are some hypotheses that may justify these findings. Although higher body fat mass may enhance FGF23 secretion, excessive FGF23 expression may reflect the decreased calcitriol expression or the severe secondary hyperparathyroidism, which in turn, aggravate adipose tissue metabolism leading to reduced fat mass (124, 125, 133) (Figure 3). Nevertheless, no correlations were observed between body weight, BMI or fat mass and serum FGF23 levels in early and moderate CKD in both adult (84) and pediatric (179, 180) patients (Table 3). The reasons behind the discrepancy among the results of different studies might be attributed to the variable FGF23 release, which rises along with the severity of CKD, but additional studies are required for further clarification.
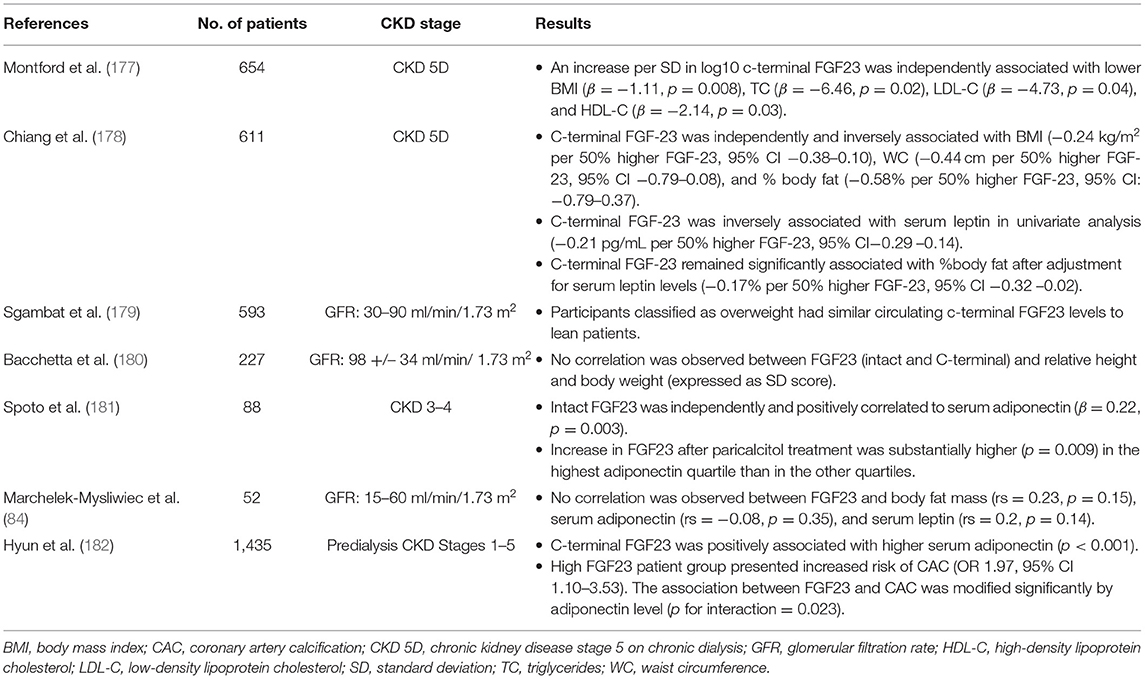
Table 3. Results of studies investigating the association between fibroblast growth factor-23 (FGF23) levels, fat mass and/or adipokine profile in patients with chronic kidney disease.
Results of studies investigating the association between FGF23 and adipokine profile are controversial. Both serum adiponectin levels and changes were positively correlated to corresponding serum FGF23 levels and changes in adult CKD patients (181, 182). Interestingly, serum leptin was negatively correlated to circulating FGF23 in an adult CKD 5D study (178). Nevertheless, no significant correlations between FGF23 and either serum adiponectin or leptin were observed in early and moderate CKD adult patients (84). Moreover, paricalcitol-induced stimulation of FGF23 release was amplified in patients with higher serum adiponectin levels, suggesting that adiponectin is a strong modulator of FGF23 response to vitamin D receptor (VDR) activation (181). Therefore, higher serum adiponectin levels possibly enhance FGF23 secretion, in the context of increased phosphate retention, similarly to the findings observed in adiponectin-overexpressing transgenic mice (45), or possibly after VDR activation (181) (Figure 3).
Conclusions
In conclusion, there is emerging compelling evidence that fat and mineral metabolism are linked in both general population and CKD patients. Therefore, aiming for balanced fat mass and mineral homeostasis is crucial for optimal health of both systems. In general population, randomized controlled trials are necessary to target the optimal mineral status in order to impede or even facilitate reduction of obesity. In CKD state, prospective studies are needed to explore the impact level of increased adiposity on mineral disorders, as well as the impact level of severe mineral disorders on CKD-related fat loss.
Author Contributions
VK and NP contributed to initial conception. VK, AC, and NP contributed to design. VK, AK, and JD contributed to literature review. VK contributed to writing of the manuscript. AK and JD contributed to revision of the manuscript. AC and NP contributed to final revision of the manuscript. All authors contributed to the article and approved the submitted version.
Conflict of Interest
The authors declare that the research was conducted in the absence of any commercial or financial relationships that could be construed as a potential conflict of interest.
Publisher's Note
All claims expressed in this article are solely those of the authors and do not necessarily represent those of their affiliated organizations, or those of the publisher, the editors and the reviewers. Any product that may be evaluated in this article, or claim that may be made by its manufacturer, is not guaranteed or endorsed by the publisher.
Acknowledgments
Graphical elements of bone, kidney, parathyroid gland, and adipose tissue in Figures 1–3 are provided by smart SERVIER MEDICAL ART licensed under CC by 3.0.
References
1. Stern JH, Rutkowski JM, Scherer PE. Adiponectin, leptin, and fatty acids in the maintenance of metabolic homeostasis through adipose tissue crosstalk. Cell Metab. (2016) 23:770–84. doi: 10.1016/j.cmet.2016.04.011
2. Kershaw EE, Flier JS. Adipose tissue as an endocrine organ. J Clin Endocrinol Metab. (2004) 89:2548–56. doi: 10.1210/jc.2004-0395
3. Mancuso P. The role of adipokines in chronic inflammation. Immunotargets Ther. (2016) 5:47–56. doi: 10.2147/ITT.S73223
4. Oikonomou EK, Antoniades C. The role of adipose tissue in cardiovascular health and disease. Nat Rev Cardiol. (2019) 16:83–99. doi: 10.1038/s41569-018-0097-6
5. Rosen ED, Spiegelman BM. Adipocytes as regulators of energy balance and glucose homeostasis. Nature. (2006) 444:847–53. doi: 10.1038/nature05483
6. Hawkes CP, Mostoufi-Moab S. Fat-bone interaction within the bone marrow milieu: impact on hematopoiesis and systemic energy metabolism. Bone. (2019) 119:57–64. doi: 10.1016/j.bone.2018.03.012
7. Cassis LA, Police SB, Yiannikouris F, Thatcher SE. Local adipose tissue renin-angiotensin system. Curr Hypertens Rep. (2008) 10:93–8. doi: 10.1007/s11906-008-0019-9
8. Vaidya A, Brown JM. Williams JS. The renin-angiotensin-aldosterone system and calcium-regulatory hormones. J Hum Hypertens. (2015) 29:515–21. doi: 10.1038/jhh.2014.125
9. Cipriani C, Colangelo L, Santori R, Renella M, Mastrantonio M, Minisola S, et al. The interplay between bone and glucose metabolism. Front Endocrinol. (2020) 11:122. doi: 10.3389/fendo.2020.00122
10. Voelkl J, Egli-Spichtig D, Alesutan I, Wagner CA. Inflammation: a putative link between phosphate metabolism and cardiovascular disease. Clin Sci. (2021) 135:201–27. doi: 10.1042/CS20190895
11. Wagner CA, Imenez Silva PH, Rubio-Aliaga I. And the fat lady sings about phosphate and calcium. Kidney Int. (2017) 91:270–2. doi: 10.1016/j.kint.2016.11.009
12. Zhang M, Cheng H, Zhao X, Hou D, Yan Y, Cianflone K, et al. Leptin and leptin-to-adiponectin ratio predict adiposity gain in nonobese children over a six-year period. Child Obes. (2017) 13:213–21. doi: 10.1089/chi.2016.0273
13. Frühbeck G, Catalán V, Rodríguez A, Gómez-Ambrosi J. Adiponectin-leptin ratio: a promising index to estimate adipose tissue dysfunction. Relation with obesity-associated cardiometabolic risk. Adipocyte. (2018) 7:57–62. doi: 10.1080/21623945.2017.1402151
14. Varkaneh Kord H, Tinsley MG, Santos OH, Zand H, Nazary A, Fatahi S, et al. The influence of fasting and energy-restricted diets on leptin and adiponectin levels in humans: a systematic review and meta-analysis. Clin Nutr. (2021) 40:1811–21. doi: 10.1016/j.clnu.2020.10.034
15. Daschner M, Tönshoff B, Blum WF, Englaro P, Wingen AM, Schaefer F, et al. Inappropriate elevation of serum leptin levels in children with chronic renal failure. European study group for nutritional treatment of chronic renal failure in childhood. J Am Soc Nephrol. (1998) 9:1074–9. doi: 10.1681/ASN.V961074
16. Besbas N, Ozaltin F, Coşkun T, Ozalp S, Saatçi U, Bakkaloglu A, et al. Relationship of leptin and insulin-like growth factor I to nutritional status in hemodialyzed children. Pediatr Nephrol. (2003) 18:1255–9. doi: 10.1007/s00467-003-1264-4
17. Shankar A, Syamala S, Xiao J, Muntner P. Relationship between plasma leptin level and chronic kidney disease. Int J Nephrol. (2012) 2012:269532. doi: 10.1155/2012/269532
18. Sharma K, Considine RV, Michael B, Dunn SR, Weisberg LS, Kurnik BR, et al. Plasma leptin is partly cleared by the kidney and is elevated in hemodialysis patients. Kidney Int. (1997) 51:1980–5. doi: 10.1038/ki.1997.269
19. Nordfors L, Lönnqvist F, Heimbürger O, Danielsson A, Schalling M, Stenvinkel P. Low leptin gene expression and hyperleptinemia in chronic renal failure. Kidney Int. (1998) 54:1267–75. doi: 10.1046/j.1523-1755.1998.00088.x
20. Przybyciński J, Dziedziejko V, Puchałowicz K, Domański L, Pawlik A. Adiponectin in chronic kidney disease. Int J Mol Sci. (2020) 21:9375. doi: 10.3390/ijms21249375
21. Kollerits B, Fliser D, Heid IM, Ritz E, Kronenberg F. Gender-specific association of adiponectin as a predictor of progression of chronic kidney disease: the mild to moderate kidney disease study. Kidney Int. (2007) 71:1279–86. doi: 10.1038/sj.ki.5002191
22. Mitsnefes M, Kartal J, Khoury P, Daniels S. Adiponectin in children with chronic kidney disease: role of adiposity and kidney dysfunction. Clin J Am Soc Nephrol. (2007) 2:46–50. doi: 10.2215/CJN.02790806
23. Nanayakkara PW, Le Poole CY, Fouque D, van Guldener C, Stehouwer CD, Smulders YM, et al. Plasma adiponectin concentration has an inverse and a non-linear association with estimated glomerular filtration rate in patients with K/DOQI 3 - 5 chronic kidney disease. Clin Nephrol. (2009) 72:21–30. doi: 10.5414/CNP72021
24. Nehus E, Furth S, Warady B, Mitsnefes M. Correlates of leptin in children with chronic kidney disease. J Pediatr. (2014) 165:825–9. doi: 10.1016/j.jpeds.2014.06.030
25. Kokot F, Chudek J, Karkoszka H, Adamczak M, Wiecek A, Klimek D. Does PTH influence leptin concentration in haemodialysed uraemic patients? Nephron. (1999) 82:372–3. doi: 10.1159/000045462
26. Guebre-Egziabher F, Bernhard J, Funahashi T, Hadj-Aissa A, Fouque D. Adiponectin in chronic kidney disease is related more to metabolic disturbances than to decline in renal function. Nephrol Dial Transplant. (2005) 20:129–34. doi: 10.1093/ndt/gfh568
27. Dervisoglu E, Eraldemir C, Kalender B, Kir HM, Caglayan C. Adipocytokines leptin and adiponectin, and measures of malnutrition-inflammation in chronic renal failure: is there a relationship? J Ren Nutr. (2008) 18:332–7. doi: 10.1053/j.jrn.2008.02.001
28. Canpolat N, Sever L, Agbas A, Tasdemir M, Oruc C, Ekmekci OB, et al. Leptin and ghrelin in chronic kidney disease: their associations with protein-energy wasting. Pediatr Nephrol. (2018) 33:2113–22. doi: 10.1007/s00467-018-4002-7
29. Zhang J, Wang N. Leptin in chronic kidney disease: a link between hematopoiesis, bone metabolism, and nutrition. Int Urol Nephrol. (2014) 46:1169–74. doi: 10.1007/s11255-013-0623-8
30. Martinez Cantarin MP, Waldman SA, Doria C, Frank AM, Maley WR, Ramirez CB, et al. The adipose tissue production of adiponectin is increased in end-stage renal disease. Kidney Int. (2013) 83:487–94. doi: 10.1038/ki.2012.421
31. Aminzadeh MA, Pahl MV, Barton CH, Doctor NS, Vaziri ND. Human uraemic plasma stimulates release of leptin and uptake of tumour necrosis factor-α in visceral adipocytes. Nephrol Dial Transplant. (2009) 24:3626–31. doi: 10.1093/ndt/gfp405
32. Kalbacher E, Koppe L, Zarrouki B, Pillon NJ, Fouque D, Soulage CO. Human uremic plasma and not urea induces exuberant secretion of leptin in 3T3-L1 adipocytes. J Ren Nutr. (2011) 21:72–5. doi: 10.1053/j.jrn.2010.11.009
33. Pecoits-Filho R, Nordfors L, Heimbürger O, Lindholm B, Anderstam B, Marchlewska A, et al. Soluble leptin receptors and serum leptin in end-stage renal disease: relationship with inflammation and body composition. Eur J Clin Invest. (2002) 32:811–7. doi: 10.1046/j.1365-2362.2002.01063.x
34. Stenvinkel P, Lindholm B, Lönnqvist F, Katzarski K, Heimbürger O. Increases in serum leptin levels during peritoneal dialysis are associated with inflammation and a decrease in lean body mass. J Am Soc Nephrol. (2000) 11:1303–9. doi: 10.1681/ASN.V1171303
35. Marchlewska A, Stenvinkel P, Lindholm B, Danielsson A, Pecoits-Filho R, Lönnqvist F, et al. Reduced gene expression of adiponectin in fat tissue from patients with end-stage renal disease. Kidney Int. (2004) 66:46–50. doi: 10.1111/j.1523-1755.2004.00705.x
36. Ho KJ, Xue H, Mauro CR, Nguyen B, Yu P, Tao M, et al. Impact of uremia on human adipose tissue phenotype. J Surg Res. (2013) 179:175–82. doi: 10.1016/j.jss.2012.08.043
37. Fish RS, Cunningham J. Chronic kidney disease: mineral and bone disorder (CKD-MBD). In: Practical Nephrology. London: Springer-Verlag London Ltd (2014). p. 581–7. Available online at: http://link.springer.com/10.1007/978-1-4471-5547-8_51 (accessed April 1, 2021).
38. Erben RG. Physiological actions of fibroblast growth factor-23. Front Endocrinol. (2018) 9:267. doi: 10.3389/fendo.2018.00267
39. Richter B, Faul C. FGF23 actions on target tissues-with and without klotho. Front Endocrinol. (2018) 9:189. doi: 10.3389/fendo.2018.00189
40. Komaba H, Fukagawa M. FGF23–parathyroid interaction: implications in chronic kidney disease. Kidney Int. (2010) 77:292–8. doi: 10.1038/ki.2009.466
41. Fukagawa M, Kazama JJ, Shigematsu T. Skeletal resistance to pth as a basic abnormality underlying uremic bone diseases. Am J Kidney Dis. (2001) 38(4Suppl.1):S152-5. doi: 10.1053/ajkd.2001.27426
42. Musgrove J, Wolf M. Regulation and effects of FGF23 in chronic kidney disease. Annu Rev Physiol. (2020) 82:365–90. doi: 10.1146/annurev-physiol-021119-034650
43. Tsuji K, Maeda T, Kawane T, Matsunuma A, Horiuchi N. Leptin stimulates fibroblast growth factor 23 expression in bone and suppresses renal 1α,25-dihydroxyvitamin D3 synthesis in leptin-deficient mice. J Bone Miner Res. (2010) 25:1711–23. doi: 10.1002/jbmr.65
44. Polyzos SA, Duntas L, Bollerslev J. The intriguing connections of leptin to hyperparathyroidism. Endocrine. (2017) 57:376–87. doi: 10.1007/s12020-017-1374-6
45. Rutkowski JM, Pastor J, Sun K, Park SK, Bobulescu IA, Chen CT, et al. Adiponectin alters renal calcium and phosphate excretion through regulation of klotho expression. Kidney Int. (2017) 91:324–37. doi: 10.1016/j.kint.2016.09.016
46. Saini RK, Kaneko I, Jurutka PW, Forster R, Hsieh A, Hsieh JC, et al. 1,25-Dihydroxyvitamin D(3) regulation of fibroblast growth factor-23 expression in bone cells: evidence for primary and secondary mechanisms modulated by leptin and interleukin-6. Calcif Tissue Int. (2013) 92:339–53. doi: 10.1007/s00223-012-9683-5
47. Matsunuma A, Kawane T, Maeda T, Hamada S, Horiuchi N. Leptin corrects increased gene expression of renal 25-hydroxyvitamin D3-1 alpha-hydroxylase and−24-hydroxylase in leptin-deficient, ob/ob mice. Endocrinology. (2004) 145:1367–75. doi: 10.1210/en.2003-1010
48. Matsunuma A, Horiuchi N. Leptin attenuates gene expression for renal 25-hydroxyvitamin D3-1α-hydroxylase in mice via the long form of the leptin receptor. Arch Biochem Biophys. (2007) 463:118–27. doi: 10.1016/j.abb.2007.02.031
49. Lopez I, Pineda C, Raya AI, Rodriguez-Ortiz ME, Diaz-Tocados JM, Rios R, et al. Leptin directly stimulates parathyroid hormone secretion. Endocrine. (2017) 56:675–8. doi: 10.1007/s12020-016-1207-z
50. Hoang D, Broer N, Sosa JA, Abitbol N, Yao X, Li F, et al. Leptin Is Produced by Parathyroid Glands and Stimulates Parathyroid Hormone Secretion. Ann Surg. (2017) 266:1075–83. doi: 10.1097/SLA.0000000000002004
51. Bell NH, Epstein S, Greene A, Shary J, Oexmann MJ, Shaw S. Evidence for alteration of the vitamin D-endocrine system in obese subjects. J Clin Invest. (1985) 76:370–3. doi: 10.1172/JCI111971
52. Goldner WS, Stoner JA, Thompson J, Taylor K, Larson L, Erickson J, et al. Prevalence of vitamin D insufficiency and deficiency in morbidly obese patients: a comparison with non-obese controls. Obes Surg. (2008) 18:145–50. doi: 10.1007/s11695-007-9315-8
53. Ybarra J, Sánchez-Hernández J, Gich I, De Leiva A, Rius X, Rodríguez-Espinosa J, et al. Unchanged hypovitaminosis D and secondary hyperparathyroidism in morbid obesity after bariatric surgery. Obes Surg. (2005) 15:330–5. doi: 10.1381/0960892053576758
54. Grethen E, McClintock R, Gupta CE, Jones RM, Cacucci BM, Diaz D, et al. Vitamin D and hyperparathyroidism in obesity. J Clin Endocrinol Metab. (2011) 96:1320–6. doi: 10.1210/jc.2010-2202
55. Guasch A, Bulló M, Rabassa A, Bonada A, Del Castillo D, Sabench F, et al. Plasma vitamin D and parathormone are associated with obesity and atherogenic dyslipidemia: a cross-sectional study. Cardiovasc Diabetol. (2012) 11:149. doi: 10.1186/1475-2840-11-149
56. Parikh SJ, Edelman M, Uwaifo GI, Freedman RJ, Semega-Janneh M, Reynolds J, et al. The relationship between obesity and serum 1,25-dihydroxy vitamin D concentrations in healthy adults. J Clin Endocrinol Metab. (2004) 89:1196–9. doi: 10.1210/jc.2003-031398
57. Kamycheva E, Sundsfjord J, Jorde R. Serum parathyroid hormone level is associated with body mass index. The 5th Tromsø study. Eur J Endocrinol. (2004) 151:167–72. doi: 10.1530/eje.0.1510167
58. Snijder MB, Van Dam RM, Visser M, Deeg DJ, Dekker JM, Bouter LM, et al. Adiposity in relation to vitamin D status and parathyroid hormone levels: a population-based study in older men and women. J Clin Endocrinol Metab. (2005) 90:4119–23. doi: 10.1210/jc.2005-0216
59. Arunabh S, Pollack S, Yeh J, Aloia JF. Body fat content and 25-hydroxyvitamin D levels in healthy women. J Clin Endocrinol Metab. (2003) 88:157–61. doi: 10.1210/jc.2002-020978
60. Vimaleswaran KS, Berry DJ, Lu C, Tikkanen E, Pilz S, Hiraki LT, et al. Causal relationship between obesity and vitamin D status: bi-directional Mendelian randomization analysis of multiple cohorts. PLoS Med. (2013) 10:e1001383. doi: 10.1371/journal.pmed.1001383
61. Gunther CW, Legowski PA, Lyle RM, Weaver CM, McCabe LD, McCabe GP, et al. Parathyroid hormone is associated with decreased fat mass in young healthy women. Int J Obes. (2006) 30:94–9. doi: 10.1038/sj.ijo.0803066
62. Roth CL, Elfers C, Kratz M, Hoofnagle AN. Vitamin d deficiency in obese children and its relationship to insulin resistance and adipokines. J Obes. (2011) 2011:495101. doi: 10.1155/2011/495101
63. Turer CB, Lin H, Flores G. Prevalence of vitamin D deficiency among overweight and obese us children. Pediatrics. (2013) 131:e152–161. doi: 10.1542/peds.2012-1711
64. Torun E, Gönüllü E, Ozgen IT, Cindemir E, Oktem F. Vitamin d deficiency and insufficiency in obese children and adolescents and its relationship with insulin resistance. Int J Endocrinol. (2013) 2013:631845. doi: 10.1155/2013/631845
65. Pacifico L, Anania C, Osborn JF, Ferraro F, Bonci E, Olivero E, et al. Low 25(OH)D3 levels are associated with total adiposity, metabolic syndrome, and hypertension in Caucasian children and adolescents. Eur J Endocrinol. (2011) 165:603–11. doi: 10.1530/EJE-11-0545
66. Olson ML, Maalouf NM, Oden JD, White PC, Hutchison MR. Vitamin D deficiency in obese children and its relationship to glucose homeostasis. J Clin Endocrinol Metab. (2012) 97:279–85. doi: 10.1210/jc.2011-1507
67. Lenders CM, Feldman HA, Von Scheven E, Merewood A, Sweeney C, Wilson DM, et al. Relation of body fat indexes to vitamin D status and deficiency among obese adolescents. Am J Clin Nutr. (2009) 90:459–67. doi: 10.3945/ajcn.2008.27275
68. Osman A, Osman NR, Fouad DA, Toaima NN. Vitamin D deficiency in obese children and adolescents and relation to glucose homeostasis. QJM An Int J Med. (2018) 111(suppl.1). doi: 10.1093/qjmed/hcy200.128
69. Mason C, Xiao L, Imayama I, Duggan CR, Bain C, Foster-Schubert KE, et al. Effects of weight loss on serum vitamin D in postmenopausal women. Am J Clin Nutr. (2011) 94:95–103. doi: 10.3945/ajcn.111.015552
70. Reinehr T, de Sousa G, Alexy U, Kersting M, Andler W. Vitamin D status and parathyroid hormone in obese children before and after weight loss. Eur J Endocrinol. (2007) 157:225–32. doi: 10.1530/EJE-07-0188
71. Andersen T, McNair P, Hyldstrup L, Fogh-Andersen N, Nielsen TT, Astrup A, et al. Secondary hyperparathyroidism of morbid obesity regresses during weight reduction. Metabolism. (1988) 37:425–8. doi: 10.1016/0026-0495(88)90041-8
72. Figuiredo-Dias V, Cuppari L, Garcia-Lopes MG, de Carvalho AB, Draibe SA, Kamimura MA. Risk factors for hypovitaminosis D in non-dialyzed chronic kidney disease patients. J Ren Nutr. (2012) 22:4–11. doi: 10.1053/j.jrn.2011.02.001
73. Barreto Silva MI, Cavalieri VV, Lemos CC, Klein MR, Bregman R. Body adiposity predictors of vitamin D status in non-dialyzed patients with chronic kidney disease: a cross-sectional analysis in a tropical climate city. Nutrition. (2017) 33:240–7. doi: 10.1016/j.nut.2016.06.012
74. Petchey WG, Johnson DW, Hawley CM, Isbel NM. Predictors of vitamin D status in predialysis chronic kidney disease patients: a cross-sectional analysis in a high ultraviolet climate. J Ren Nutr. (2012) 22:400–8. doi: 10.1053/j.jrn.2011.08.007
75. Kitsos A, Dounousi E, Kalaitzidis R, Challa A, Siamopoulos KC, Tigas S. Serum vitamin D in obese and overweight subjects according to estimated glomerular filtration rate. Hormones. (2018) 17:237–46. doi: 10.1007/s42000-018-0022-8
76. Baxmann AC, Menon VB, Medina-Pestana JO, Carvalho AB, Heilberg IP. Overweight and body fat are predictors of hypovitaminosis D in renal transplant patients. Clin Kidney J. (2015) 8:49–53. doi: 10.1093/ckj/sfu120
77. Seeherunvong W, Abitbol CL, Chandar J, Zilleruelo G, Freundlich M. Vitamin D insufficiency and deficiency in children with early chronic kidney disease. J Pediatr. (2009) 154:906–11.e1. doi: 10.1016/j.jpeds.2008.12.006
78. Kovesdy CP, Molnar MZ, Czira ME, Rudas A, Ujszaszi A, Rosivall L, et al. Associations between serum leptin level and bone turnover in kidney transplant recipients. Clin J Am Soc Nephrol. (2010) 5:2297–304. doi: 10.2215/CJN.03520410
79. Ishimura E, Okuno S, Tsuboniwa N, Norimine K, Fukumoto S, Yamakawa K, et al. Significant positive association between parathyroid hormone and fat mass and lean mass in chronic hemodialysis patients. J Clin Endocrinol Metab. (2013) 98:1264–70. doi: 10.1210/jc.2012-3883
80. Kovesdy CP, Ahmadzadeh S, Anderson JE, Kalantar-Zadeh K. Obesity is associated with secondary hyperparathyroidism in men with moderate and severe chronic kidney disease. Clin J Am Soc Nephrol. (2007) 2:1024–9. doi: 10.2215/CJN.01970507
81. Drechsler C, Grootendorst DC, Boeschoten EW, Krediet RT, Wanner C, Dekker FW. Changes in parathyroid hormone, body mass index and the association with mortality in dialysis patients. Nephrol Dial Transplant. (2011) 26:1340–6. doi: 10.1093/ndt/gfq541
82. Dukkipati R, Kovesdy CP, Colman S, Budoff MJ, Nissenson AR, Sprague SM, et al. Association of relatively low serum parathyroid hormone with malnutrition-inflammation complex and survival in maintenance hemodialysis patients. J Ren Nutr. (2010) 20:243–54. doi: 10.1053/j.jrn.2009.10.006
83. Vanderstraeten K, De Pauw R, Knops N, Bouts A, Cransberg K, El Amouri A, et al. Body mass index is associated with hyperparathyroidism in pediatric kidney transplant recipients. Pediatr Nephrol. (2021) 36:977–86. doi: 10.1007/s00467-020-04796-w
84. Marchelek-Mysliwiec M, Wisniewska M, Nowosiad-Magda M, Safranow K, Kwiatkowska E, Banach B, et al. Association between plasma concentration of klotho protein, osteocalcin, leptin, adiponectin, and bone mineral density in patients with chronic kidney disease. Horm Metab Res. (2018) 50:816–21. doi: 10.1055/a-0752-4615
85. Peters BSE, Jorgetti V, Martini LA. Body composition changes in haemodialysis patients with secondary hyperparathyroidism after parathyroidectomy measured by conventional and vector bioimpedance analysis. Br J Nutr. (2006) 95:353–7. doi: 10.1079/BJN20051637
86. Jiang Y, Zhang J, Yuan Y, Zha X, Xing C, Shen C, et al. Association of increased serum leptin with ameliorated anemia and malnutrition in stage 5 chronic kidney disease patients after parathyroidectomy. Sci Rep. (2016) 6:27918. doi: 10.1038/srep27918
87. Wortsman J, Matsuoka LY, Chen TC, Lu Z, Holick MF. Decreased bioavailability of vitamin D in obesity [published correction appears in Am J Clin Nutr. 2003 May;77:1342]. Am J Clin Nutr. (2000) 72:690–3. doi: 10.1093/ajcn/72.3.690
88. Lin E, Armstrong-Moore D, Liang Z, Sweeney JF, Torres WE, Ziegler TR, et al. Contribution of adipose tissue to plasma 25-hydroxyvitamin D concentrations during weight loss following gastric bypass surgery. Obesity. (2011) 19:588–94. doi: 10.1038/oby.2010.239
89. Blum M, Dolnikowski G, Seyoum E, Harris SS, Booth SL, Peterson J, et al. Vitamin D(3) in fat tissue. Endocrine. (2008) 33:90–4. doi: 10.1007/s12020-008-9051-4
90. Drincic AT, Armas LA, Van Diest EE, Heaney RP. Volumetric dilution, rather than sequestration best explains the low vitamin D status of obesity. Obesity. (2012) 20:1444–8. doi: 10.1038/oby.2011.404
91. Harel Z, Flanagan P, Forcier M, Harel D. Low vitamin D status among obese adolescents: prevalence and response to treatment. J Adolesc Health. (2011) 48:448–52. doi: 10.1016/j.jadohealth.2011.01.011
92. Dong Y, Pollock N, Stallmann-Jorgensen IS, Gutin B, Lan L, Chen TC. Low 25-hydroxyvitamin D levels in adolescents: race, season, adiposity, physical activity, and fitness. Pediatrics. (2010) 125:1104–11. doi: 10.1542/peds.2009-2055
93. Rajakumar K, Fernstrom JD, Holick MF, Janosky JE, Greenspan SL. Vitamin D status and response to vitamin D(3) in obese vs. non-obese African American children. Obesity. (2008) 16:90–5. doi: 10.1038/oby.2007.23
94. Nunlee-Bland G, Gambhir K, Abrams C, Abdul M, Vahedi M, Odonkor W. Vitamin D deficiency and insulin resistance in obese African-American adolescents. J Pediatr Endocrinol Metab. (2011) 24:29–33. doi: 10.1515/jpem.2011.107
95. Hamoui N, Anthone G, Crookes PF. Calcium metabolism in the morbidly obese. Obes Surg. (2004) 14:9–12. doi: 10.1381/096089204772787211
96. Zamboni G, Soffiati M, Giavarina D, Tato L. Mineral metabolism in obese children. Acta Paediatr Scand. (1988) 77:741–6. doi: 10.1111/j.1651-2227.1988.tb10740.x
97. Grethen E, Hill KM, Jones R, Cacucci BM, Gupta CE, Acton A, et al. Serum leptin, parathyroid hormone, 1,25-dihydroxyvitamin D, fibroblast growth factor 23, bone alkaline phosphatase, and sclerostin relationships in obesity. J Clin Endocrinol Metab. (2012) 97:1655–62. doi: 10.1210/jc.2011-2280
98. Konradsen S, Ag H, Lindberg F, Hexeberg S, Jorde R. Serum 1,25-dihydroxy vitamin D is inversely associated with body mass index. Eur J Nutr. (2008) 47:87–91. doi: 10.1007/s00394-008-0700-4
99. Andersen T, McNair P, Fogh-Andersen N, Nielsen TT, Hyldstrup L, Transbøl I. Increased parathyroid hormone as a consequence of changed complex binding of plasma calcium in morbid obesity. Metabolism. (1986) 35:147–51. doi: 10.1016/0026-0495(86)90116-2
100. Amini Z, Bryant S, Smith C, Singh R, Kumar S. Is the serum vitamin D-parathyroid hormone relationship influenced by obesity in children? Horm Res Paediatr. (2013) 80:252–6. doi: 10.1159/000354645
101. Maetani M, Maskarinec G, Franke AA, Cooney RV. Association of leptin, 25-hydroxyvitamin D, and parathyroid hormone in women. Nutr Cancer. (2009) 61:225–31. doi: 10.1080/01635580802455149
102. Saber LM, Mahran HN, Baghdadi HH, Al Hawsawi ZM. Interrelationship between bone turnover markers, calciotropic hormones and leptin in obese Saudi children. Eur Rev Med Pharmacol Sci. (2015) 19:4332–43.
103. Mirza MA, Alsiö J, Hammarstedt A, Erben RG, Michaëlsson K, Tivesten Å, et al. Circulating fibroblast growth factor-23 is associated with fat mass and dyslipidemia in two independent cohorts of elderly individuals. Arterioscler Thromb Vasc Biol. (2011) 31:219–27. doi: 10.1161/ATVBAHA.110.214619
104. Hu X, Ma X, Luo Y, Xu Y, Xiong Q, Pan X, et al. Associations of serum fibroblast growth factor 23 levels with obesity and visceral fat accumulation. Clin Nutr. (2018) 37:223–8. doi: 10.1016/j.clnu.2016.12.010
105. Ali FN, Falkner B, Gidding SS, Price HE, Keith SW, Langman CB. Fibroblast growth factor-23 in obese, normotensive adolescents is associated with adverse cardiac structure. J Pediatr. (2014) 165:738–43. doi: 10.1016/j.jpeds.2014.06.027
106. Hanks LJ, Casazza K, Judd SE, Jenny NS, Gutiérrez OM. Associations of fibroblast growth factor-23 with markers of inflammation, insulin resistance and obesity in adults. PLoS ONE. (2015) 10:e0122885. doi: 10.1371/journal.pone.0122885
107. Holecki M, Chudek J, Wiecek A, Titz-Bober M, Duława J. The serum level of fibroblast growth factor-23 and calcium-phosphate homeostasis in obese perimenopausal women. Int J Endocrinol. (2011) 2011:707126. doi: 10.1155/2011/707126
108. Lin Y, Shi L, Liu Y, Zhang H, Liu Y, Huang X, et al. Plasma fibroblast growth factor 23 is elevated in pediatric primary hypertension. Front Pediatr. (2019) 7:135. doi: 10.3389/fped.2019.00135
109. Kutluturk Y, Akinci A, Ozerol IH, Yologlu S. The relationship between serum FGF-23 concentration and insulin resistance, prediabetes and dyslipidemia in obese children and adolescents. J Pediatr Endocrinol Metab. (2019) 32:707–14. doi: 10.1515/jpem-2018-0507
110. Zemel MB, Shi H, Greer B, Dirienzo D, Zemel PC. Regulation of adiposity by dietary calcium. FASEB J. (2000) 14:1132–8. doi: 10.1096/fasebj.14.9.1132
111. Fujita T, Palmieri GM. Calcium paradox disease: calcium deficiency prompting secondary hyperparathyroidism and cellular calcium overload. J Bone Miner Metab. (2000) 18:109–25. doi: 10.1007/s007740050101
112. Shi H, Dirienzo D, Zemel MB. Effects of dietary calcium on adipocyte lipid metabolism and body weight regulation in energy-restricted aP2-agouti transgenic mice. FASEB J. (2001) 15:291–3. doi: 10.1096/fj.00-0584fje
113. Major GC, Chaput JP, Ledoux M, St-Pierre S, Anderson GH, Zemel MB, et al. Recent developments in calcium-related obesity research. Obes Rev. (2008) 9:428–45. doi: 10.1111/j.1467-789X.2007.00465.x
114. Papakonstantinou E, Flatt WP, Huth PJ, Harris RBS. High dietary calcium reduces body fat content, digestibility of fat, and serum vitamin D in rats. Obes Res. (2003) 11:387–94. doi: 10.1038/oby.2003.52
115. Tordoff MG. Calcium: taste, intake, and appetite. Physiol Rev. (2001) 81:1567–97. doi: 10.1152/physrev.2001.81.4.1567
116. Sergeev IN, Song Q. High vitamin D and calcium intakes reduce diet-induced obesity in mice by increasing adipose tissue apoptosis. Mol Nutr Food Res. (2014) 58:1342–8. doi: 10.1002/mnfr.201300503
117. Soares MJ, Murhadi LL, Kurpad AV, Chan She Ping-Delfos WL, Piers LS. Mechanistic roles for calcium and vitamin D in the regulation of body weight. Obes Rev. (2012) 13:592–605. doi: 10.1111/j.1467-789X.2012.00986.x
118. McCarty MF, Thomas CA, PTH. excess may promote weight gain by impeding catecholamine-induced lipolysis-implications for the impact of calcium, vitamin D, and alcohol on body weight. Med Hypotheses. (2003) 61:535–42. doi: 10.1016/S0306-9877(03)00227-5
119. Bousquet-Mélou A, Galitzky J, Lafontan M, Berlan M. Control of lipolysis in intra-abdominal fat cells of non-human primates: comparison with humans. J Lipid Res. (1995) 36:451–61. doi: 10.1016/S0022-2275(20)39879-5
120. Ziegler R, Jobst W, Minne H, Faulhaber JD. Calciotropic hormones and lipolysis of human adipose tissue: role of extracellular calcium as conditioning but not regulating factor. Endokrinologie. (1980) 75:77–88.
121. Taniguchi A, Kataoka K, Kono T, Oseko F, Okuda H, Nagata I, et al. Parathyroid hormone-induced lipolysis in human adipose tissue. J Lipid Res. (1987) 28:490–4. doi: 10.1016/S0022-2275(20)38677-6
122. Larsson S, Jones HA, Göransson O, Degerman E, Holm C. Parathyroid hormone induces adipocyte lipolysis via PKA-mediated phosphorylation of hormone-sensitive lipase. Cell Signal. (2016) 28:204–13. doi: 10.1016/j.cellsig.2015.12.012
123. He Y, Liu RX, Zhu MT, Shen WB, Xie J, Zhang ZY, et al. The browning of white adipose tissue and body weight loss in primary hyperparathyroidism. EBioMedicine. (2019) 40:56–66. doi: 10.1016/j.ebiom.2018.11.057
124. Thomas SS, Mitch WE. Parathyroid hormone stimulates adipose tissue browning: a pathway to muscle wasting. Curr Opin Clin Nutr Metab Care. (2017) 20:153–7. doi: 10.1097/MCO.0000000000000357
125. Kir S, Komaba H, Garcia AP, Economopoulos KP, Liu W, Lanske B, et al. PTH/PTHrP receptor mediates cachexia in models of kidney failure and cancer. Cell Metab. (2016) 23:315–23. doi: 10.1016/j.cmet.2015.11.003
126. Bellows CG, Wang YH, Heersche JN, Aubin JE. 1,25-dihydroxyvitamin D3 stimulates adipocyte differentiation in cultures of fetal rat calvaria cells: comparison with the effects of dexamethasone. Endocrinology. (1994) 134:2221–9. doi: 10.1210/endo.134.5.8156925
127. Blumberg JM, Tzameli I, Astapova I, Lam FS, Flier JS, Hollenberg AN. Complex role of the vitamin D receptor and its ligand in adipogenesis in 3T3-L1 cells. J Biol Chem. (2006) 281:11205–13. doi: 10.1074/jbc.M510343200
128. Kong J, Li YC. Molecular mechanism of 1,25-dihydroxyvitamin D3 inhibition of adipogenesis in 3T3-L1 cells. Am J Physiol Endocrinol Metab. (2006) 290:E916–24. doi: 10.1152/ajpendo.00410.2005
129. Mutt SJ, Hyppönen E, Saarnio J, Järvelin MR, Herzig KH. Vitamin D and adipose tissue-more than storage. Front Physiol. (2014) 5:228. doi: 10.3389/fphys.2014.00228
130. Shi H, Norman AW, Okamura WH, Sen A, Zemel MB. 1alpha,25-dihydroxyvitamin D3 inhibits uncoupling protein 2 expression in human adipocytes. FASEB J. (2002) 16:1808–10. doi: 10.1096/fj.02-0255fje
131. Shi H, Norman AW, Okamura WH, Sen A, Zemel MB. 1alpha,25-Dihydroxyvitamin D3 modulates human adipocyte metabolism via non-genomic action. FASEB J. (2001) 15:2751–3. doi: 10.1096/fj.01-0584fje
132. Sergeev IN. 1,25-Dihydroxyvitamin D3 induces Ca2+-mediated apoptosis in adipocytes via activation of calpain and caspase-12. Biochem Biophys Res Commun. (2009) 384:18–21. doi: 10.1016/j.bbrc.2009.04.078
133. Cheung WW, Ding W, Hoffman HM, Wang Z, Hao S, Zheng R, et al. Vitamin D ameliorates adipose browning in chronic kidney disease cachexia. Sci Rep. (2020) 10:14175. doi: 10.1038/s41598-020-70190-z
134. Streicher C, Zeitz U, Andrukhova O, Rupprecht A, Pohl E, Larsson TE, et al. Long-term Fgf23 deficiency does not influence aging, glucose homeostasis, or fat metabolism in mice with a non-functioning vitamin D receptor. Endocrinology. (2012) 153:1795–805. doi: 10.1210/en.2011-1878
135. Ding C, Gao D, Wilding J, Trayhurn P, Bing C. Vitamin D signalling in adipose tissue. Br J Nutr. (2012) 108:1915–23. doi: 10.1017/S0007114512003285
136. Bouillon R, Carmeliet G, Lieben L, Watanabe M, Perino A, Auwerx J, et al. Vitamin D and energy homeostasis: of mice and men. Nat Rev Endocrinol. (2014) 10:79–87. doi: 10.1038/nrendo.2013.226
137. Abbas MA. Physiological functions of Vitamin D in adipose tissue. J Steroid Biochem Mol Biol. (2017) 165:369–81. doi: 10.1016/j.jsbmb.2016.08.004
138. Wong KE, Szeto FL, Zhang W, Ye H, Kong J, Zhang Z, et al. Involvement of the vitamin D receptor in energy metabolism: regulation of uncoupling proteins. Am J Physiol Endocrinol Metab. (2009) 296:E820–8. doi: 10.1152/ajpendo.90763.2008
139. Narvaez CJ, Matthews D, Broun E, Chan M, Welsh J. Lean phenotype and resistance to diet-induced obesity in vitamin D receptor knockout mice correlates with induction of uncoupling protein-1 in white adipose tissue. Endocrinology. (2009) 150:651–61. doi: 10.1210/en.2008-1118
140. Wong KE, Kong J, Zhang W, Szeto FL, Ye H, Deb DK, et al. Targeted expression of human vitamin D receptor in adipocytes decreases energy expenditure and induces obesity in mice. J Biol Chem. (2011) 286:33804–10. doi: 10.1074/jbc.M111.257568
141. Kong J, Chen Y, Zhu G, Zhao Q, Li YC. 1,25-Dihydroxyvitamin D3 upregulates leptin expression in mouse adipose tissue. J Endocrinol. (2013) 216:265–71. doi: 10.1530/JOE-12-0344
142. Lorente-Cebrián S, Eriksson A, Dunlop T, Mejhert N, Dahlman I, Aström G, et al. Differential effects of 1α,25-dihydroxycholecalciferol on MCP-1 and adiponectin production in human white adipocytes. Eur J Nutr. (2012) 51:335–42. doi: 10.1007/s00394-011-0218-z
143. Menendez C, Lage M, Peino R, Baldelli R, Concheiro P, Diéguez C, et al. Retinoic acid and vitamin D3 powerfully inhibit in vitro leptin secretion by human adipose tissue. J Endocrinol. (2001) 170:425–31. doi: 10.1677/joe.0.1700425
144. Kaneko I, Sabir MS, Dussik CM, Whitfield GK, Karrys A, Hsieh JC, et al. 1,25-Dihydroxyvitamin D regulates expression of the tryptophan hydroxylase 2 and leptin genes: implication for behavioral influences of vitamin D. FASEB J. (2015) 29:4023–35. doi: 10.1096/fj.14-269811
145. Walker GE, Ricotti R, Roccio M, Moia S, Bellone S, Prodam F, et al. Pediatric obesity and vitamin D deficiency: a proteomic approach identifies multimeric adiponectin as a key link between these conditions. PLoS ONE. (2014) 9:e83685. doi: 10.1371/journal.pone.0083685
146. Manna P, Jain SK. Vitamin D up-regulates glucose transporter 4 (GLUT4) translocation and glucose utilization mediated by cystathionine-γ-lyase (CSE) activation and H2S formation in 3T3L1 adipocytes. J Biol Chem. (2012) 287:42324–32. doi: 10.1074/jbc.M112.407833
147. Sun X, Zemel MB. Calcium and 1,25-dihydroxyvitamin D3 regulation of adipokine expression. Obesity. (2007) 15:340–8. doi: 10.1038/oby.2007.540
148. Rao Z, Landry T, Li P, Bunner W, Laing BT, Yuan Y, et al. Administration of alpha klotho reduces liver and adipose lipid accumulation in obese mice. Heliyon. (2019) 5:e01494. doi: 10.1016/j.heliyon.2019.e01494
149. Mori K, Yahata K, Mukoyama M, Suganami T, Makino H, Nagae T, et al. Disruption of klotho gene causes an abnormal energy homeostasis in mice. Biochem Biophys Res Commun. (2000) 278:665–70. doi: 10.1006/bbrc.2000.3864
150. Chihara Y, Rakugi H, Ishikawa K, Ikushima M, Maekawa Y, Ohta J, et al. Klotho protein promotes adipocyte differentiation. Endocrinology. (2006) 147:3835–42. doi: 10.1210/en.2005-1529
151. Bolland MJ, Grey AB, Gamble GD, Reid IR. Association between primary hyperparathyroidism and increased body weight: a meta-analysis. J Clin Endocrinol Metab. (2005) 90:1525–30. doi: 10.1210/jc.2004-1891
152. Lind L, Jacobsson S, Palmér M, Lithell H, Wengle B, Ljunghall S. Cardiovascular risk factors in primary hyperparathyroidism: a 15-year follow-up of operated and unoperated cases. J Intern Med. (1991) 230:29–35. doi: 10.1111/j.1365-2796.1991.tb00403.x
153. Godang K, Lundstam K, Mollerup C, Fougner SL, Pernow Y, Nordenström J, et al. The effect of surgery on fat mass, lipid and glucose metabolism in mild primary hyperparathyroidism. Endocr Connect. (2018) 7:941–8. doi: 10.1530/EC-18-0259
154. Salehpour A, Hosseinpanah F, Shidfar F, et al. A 12-week double-blind randomized clinical trial of vitamin D3 supplementation on body fat mass in healthy overweight and obese women. Nutr J. (2012) 11:78. doi: 10.1186/1475-2891-11-78
155. Samaranayake DBDL, Adikaram SGS, Atapattu N, Kendaragama KMDLD, Senevirathne JTN, Jayasekera HD, et al. Vitamin D supplementation in obese Sri Lankan children: a randomized controlled trial. BMC Pediatr. (2020) 20:426. doi: 10.1186/s12887-020-02329-w
156. Giannios C, Gennitsaridi S, Kolaitis G, Nicolaides NC, Farakla I, Karampatsou S, et al. The effect of vitamin D supplementation on cardiometabolic risk factors and mental health symptoms in obese children. J Mol Biochem. (2020) 1:41–53. doi: 10.1016/j.jped.2013.06.006
157. Wamberg L, Kampmann U, Stødkilde-Jørgensen H, Rejnmark L, Pedersen SB, Richelsen B. Effects of vitamin D supplementation on body fat accumulation, inflammation, and metabolic risk factors in obese adults with low vitamin D levels - results from a randomized trial. Eur J Intern Med. (2013) 24:644–9. doi: 10.1016/j.ejim.2013.03.005
158. Bassatne A, Chakhtoura M, Saad R, Fuleihan GE. Vitamin D supplementation in obesity and during weight loss: a review of randomized controlled trials. Metabolism. (2019) 92:193–205. doi: 10.1016/j.metabol.2018.12.010
159. Duan L, Han L, Liu Q, Zhao Y, Wang L, Wang Y. Effects of vitamin D supplementation on general and central obesity: results from 20 randomized controlled trials involving apparently healthy populations. Ann Nutr Metab. (2020) 76:153–64. doi: 10.1159/000507418
160. Perna S. Is vitamin D supplementation useful for weight loss programs? a systematic review and meta-analysis of randomized controlled trials. Medicina. (2019) 55:368. doi: 10.3390/medicina55070368
161. Lin YC, McCabe LD, Weaver CM, Teegarden D, Lyle RM, McCabe GP. Dairy calcium is related to changes in body composition during a two-year exercise intervention in young women. J Am Coll Nutr. (2000) 19:754–60. doi: 10.1080/07315724.2000.10718075
162. Jacobsen R, Lorenzen JK, Toubro S, Krog-Mikkelsen I, Astrup A. Effect of short-term high dietary calcium intake on 24-h energy expenditure, fat oxidation, and fecal fat excretion. Int J Obes. (2005) 29:292–301. doi: 10.1038/sj.ijo.0802785
163. Denke MA, Fox MM, Schulte MC. Short-term dietary calcium fortification increases fecal saturated fat content and reduces serum lipids in men. J Nutr. (1993) 123:1047–53.
164. Zemel MB, Thompson W, Milstead A, Morris K, Campbell P. Calcium and dairy acceleration of weight and fat loss during energy restriction in obese adults. Obes Res. (2004) 12:582–90. doi: 10.1038/oby.2004.67
165. Trowman R, Dumville JC, Hahn S, Torgerson DJ A. systematic review of the effects of calcium supplementation on body weight. Br J Nutr. (2006) 95:1033–8. doi: 10.1079/BJN20051727
166. Winzenberg T, Shaw K, Fryer J, Jones G. Calcium supplements in healthy children do not affect weight gain, height, or body composition. Obesity. (2007) 15:1789–98. doi: 10.1038/oby.2007.213
167. Zhu W, Cai D, Wang Y, Lin N, Hu Q, Qi Y, et al. Calcium plus vitamin D3 supplementation facilitated fat loss in overweight and obese college students with very-low calcium consumption: a randomized controlled trial. Nutr J. (2013) 12:1–8. doi: 10.1186/1475-2891-12-43
168. Rosenblum JL, Castro VM, Moore CE, Kaplan LM. Calcium and vitamin D supplementation is associated with decreased abdominal visceral adipose tissue in overweight and obese adults. Am J Clin Nutr. (2012) 95:101–8. doi: 10.3945/ajcn.111.019489
169. Wyatt CM, Mitch WE. In experimental chronic kidney disease or cancer, parathyroid hormone is a novel mediator of cachexia. Kidney Int. (2016) 89:973–5. doi: 10.1016/j.kint.2016.03.003
170. Coen G, Ballanti P, Fischer MS, Balducci A, Calabria S, Colamarco L, et al. Serum Leptin in Dialysis Renal Osteodystrophy. Am J Kidney Dis. (2003) 42:1036–42. doi: 10.1016/j.ajkd.2003.07.005
171. Zoccali C, Panuccio V, Tripepi G, Cutrupi S, Pizzini P, Mallamaci F. Leptin and biochemical markers of bone turnover in dialysis patients. J Nephrol. (2004) 17:253–60.
172. de Oliveira RB, Liabeuf S, Okazaki H, Lenglet A, Desjardins L, Lemke HD, et al. The clinical impact of plasma leptin levels in a cohort of chronic kidney disease patients. Clin Kidney J. (2013) 6:63–70. doi: 10.1093/ckj/sfs176
173. Polymeris A, Doumouchtsis K, Grapsa E. Bone mineral density and bone metabolism in hemodialysis patients. Correlation with PTH, 25OHD3 and leptin. Nefrologia. (2012) 32:73–8. doi: 10.3265/Nefrologia.pre2011.Jul.10916
174. Ahmadi F, Salari S, Maziar S, Esfahanian F, Khazaeipour Z, Ranjbarnovin N. Relationship between serum leptin levels and bone mineral density and bone metabolic markers in patients on hemodialysis. Saudi J Kidney Dis Transpl. (2013) 24:41–7. doi: 10.4103/1319-2442.106238
175. Ghorban-Sabbagh M, Nazemian F, Naghibi M, Shakeri MT, Ahmadi-Simab S, Javidi-Dasht-Bayaz R. Correlation between serum leptin and bone mineral density in hemodialysis patients. J Ren Inj Prev. (2016) 5:112–7. doi: 10.15171/jrip.2016.24
176. Kim CS, Bae EH, Ma SK, Park SK, Lee JY, Chung W, et al. Association of serum adiponectin concentration with aortic arterial stiffness in chronic kidney disease: from the KNOW-CKD study. Clin Exp Nephrol. (2017) 21:608–16. doi: 10.1007/s10157-016-1322-4
177. Montford JR, Chonchol M, Cheung AK, Kaufman JS, Greene T, Roberts WL, et al. Low body mass index and dyslipidemia in dialysis patients linked to elevated plasma fibroblast growth factor 23. Am J Nephrol. (2013) 37:183–90. doi: 10.1159/000346941
178. Chiang JM, Kaysen GA, Schafer AL, Delgado C, Johansen KL. Fibroblast growth factor 23 is associated with adiposity in patients receiving hemodialysis: possible cross talk between bone and adipose tissue. J Ren Nutr. (2018) 28:278–82. doi: 10.1053/j.jrn.2017.12.010
179. Sgambat K, Roem J, Mitsnefes M, Portale AA, Furth S, Warady B, et al. Waist-to-height ratio, body mass index, and cardiovascular risk profile in children with chronic kidney disease. Pediatr Nephrol. (2018) 33:1577–83. doi: 10.1007/s00467-018-3987-2
180. Bacchetta J, Dubourg L, Harambat J, Ranchin B, Abou-Jaoude P, Arnaud S, et al. The influence of glomerular filtration rate and age on fibroblast growth factor 23 serum levels in pediatric chronic kidney disease. J Clin Endocrinol Metab. (2010) 95:1741–8. doi: 10.1210/jc.2009-1576
181. Spoto B, Pizzini P, Tripepi G, Mallamaci F, Zoccali C. Circulating adiponectin modifies the FGF23 response to Vitamin D receptor activation: a post-hoc analysis of a double-blind, randomized clinical trial. Nephrol Dial Transplant. (2018) 33:1764–9. doi: 10.1093/ndt/gfx344
182. Hyun YY, Kim H, Oh YK, Oh KH, Ahn C, Sung SA, et al. High fibroblast growth factor 23 is associated with coronary calcification in patients with high adiponectin: analysis from the KoreaN cohort study for Outcome in patients With Chronic Kidney Disease (KNOW-CKD) study. Nephrol Dial Transplant. (2019) 34:123–9. doi: 10.1093/ndt/gfy11
Keywords: calcitriol, parathormone, FGF23, adipose tissue, adipokine, adiponectin, leptin, chronic kidney disease-mineral and bone disease
Citation: Karava V, Christoforidis A, Kondou A, Dotis J and Printza N (2021) Update on the Crosstalk Between Adipose Tissue and Mineral Balance in General Population and Chronic Kidney Disease. Front. Pediatr. 9:696942. doi: 10.3389/fped.2021.696942
Received: 18 April 2021; Accepted: 06 July 2021;
Published: 06 August 2021.
Edited by:
Rukshana Shroff, University College London, United KingdomReviewed by:
Andrea Angeletti, Giannina Gaslini Institute (IRCCS), ItalyAlberto Carlo Edefonti, Ospedale Policlinico Maggiore IRCCS Fondazione Ca 'Granda, Italy
Copyright © 2021 Karava, Christoforidis, Kondou, Dotis and Printza. This is an open-access article distributed under the terms of the Creative Commons Attribution License (CC BY). The use, distribution or reproduction in other forums is permitted, provided the original author(s) and the copyright owner(s) are credited and that the original publication in this journal is cited, in accordance with accepted academic practice. No use, distribution or reproduction is permitted which does not comply with these terms.
*Correspondence: Vasiliki Karava, vasilikikarava@hotmail.fr