Unravelling var complexity: Relationship between DBLα types and var genes in Plasmodium falciparum
 Mun Hua Tan
 Heejung Shim
 Yao-ban Chan
 Karen P. Day
- 1Department of Microbiology and Immunology, The University of Melbourne, Bio21 Institute, Melbourne, VIC, Australia
- 2School of Mathematics and Statistics/Melbourne Integrative Genomics, The University of Melbourne, Melbourne, VIC, Australia
The enormous diversity and complexity of var genes that diversify rapidly by recombination has led to the exclusion of assembly of these genes from major genome initiatives (e.g., Pf6). A scalable solution in epidemiological surveillance of var genes is to use a small ‘tag’ region encoding the immunogenic DBLα domain as a marker to estimate var diversity. As var genes diversify by recombination, it is not clear the extent to which the same tag can appear in multiple var genes. This relationship between marker and gene has not been investigated in natural populations. Analyses of in vitro recombination within and between var genes have suggested that this relationship would not be exclusive. Using a dataset of publicly-available assembled var sequences, we test this hypothesis by studying DBLα-var relationships for four study sites in four countries: Pursat (Cambodia) and Mae Sot (Thailand), representing low malaria transmission, and Navrongo (Ghana) and Chikwawa (Malawi), representing high malaria transmission. In all study sites, DBLα-var relationships were shown to be predominantly 1-to-1, followed by a second largest proportion of 1-to-2 DBLα-var relationships. This finding indicates that DBLα tags can be used to estimate not just DBLα diversity but var gene diversity when applied in a local endemic area. Epidemiological applications of this result are discussed.
1 Introduction
The microbiological paradigm for surveillance of diverse pathogens requires documenting the diversity of genes encoding major variant surface antigens [e.g (World Health Organization; World Health Organization; Nicholson et al., 2003; Wang et al., 2021)]. In the case of the malaria parasite, Plasmodium falciparum, the major surface antigen of the blood stages is known as P. falciparum erythrocyte membrane-1 protein (PfEMP1) encoded by the var multigene family. This molecule plays a key role in the biology and epidemiology of P. falciparum. Differential switching of var genes results in immune evasion by clonal antigenic variation (Smith et al., 1995; Su et al., 1995). Furthermore, PfEMP1 mediates sequestration via cytoadherence (Baruch, 1999; Newbold et al., 1999; Chen et al., 2000) to allow parasite maturation and replication. The molecule is also considered a virulence factor as cytoadhesion characteristics of specific variants are associated with the incidence of severe disease (Wang et al., 2012; Bengtsson et al., 2013; Turner et al., 2013; Bernabeu et al., 2016; Magallón-Tejada et al., 2016; Lennartz et al., 2017; Tonkin-Hill et al., 2018; Tessema et al., 2019). Unlike merozoite surface antigens that are exposed to the immune system for seconds to minutes, PfEMP1 variants remain on the surface for up to 24 hours, making these variants subject to intense immune selection.
P. falciparum has approximately 40 to 60 distinct var genes in the haploid genome. They are distributed across all 14 chromosomes but are mostly located within subtelomeric regions, with a small subset clustered in the central regions of specific chromosomes (Gardner et al., 2002; Otto et al., 2018). Analysis of var genes in seven P. falciparum genomes has shown that var repertoires and genes evolve by recombination (Rask et al., 2010). Subtelomeric regions, which contain var genes, have shown susceptibility to high rates of ectopic recombination during both meiosis and mitosis, based on observations largely from in vitro long-term cultured lines (Freitas-Junior et al., 2000; Duffy et al., 2009; Bopp et al., 2013; Claessens et al., 2014; Zhang et al., 2019). The proposed combined mechanisms involving telomere healing and homologous recombination (HR) for DNA repair (Calhoun et al., 2017; Zhang et al., 2019) place a limit on possible recombination events and thus create chimeric var genes that are intact and functional (Bopp et al., 2013; Claessens et al., 2014; Zhang et al., 2019). These constraints are reflected in the higher frequency of observed recombination between var genes classified in the same ups group (Bopp et al., 2013; Claessens et al., 2014; Feng et al., 2022) where these groupings define chromosomal locations. Recombination has also been shown in vitro to preferentially occur between sequence pairs belonging to the same domain class (Smith et al., 2000; Kraemer and Smith, 2006; Rask et al., 2010), though this constraint does not appear to apply to recombination between domain subclasses (Claessens et al., 2014).
Assessing var diversity in endemic areas is not a simple task. Many var genes in different parasite genomes are non-orthologous and the overall numbers of var genes in a genome vary in different P. falciparum isolates (Otto et al., 2018). Multigenome infections (i.e., complex infections) are also common in individuals. These factors, in addition to the often uneven sequence coverage of var genes during whole genome sequencing, greatly challenges the sequence assembly process. Until recently (Dara et al., 2017; Otto et al., 2019; Mackenzie et al., 2022), no large repository of var sequences existed as these genes were routinely excluded from studies using whole genome sequencing datasets (e.g., Pf3k, Pf6). The assembled var dataset made publicly available by Otto et al. (2019) therefore represents the largest var repository currently available. Sampled from 2,459 clinical isolates from 15 countries (six in Asia, nine in Africa), the 377,924 var sequences from the ‘Full Dataset’, however, contains a mix of complete and partial var sequences, further highlighting the bioinformatic challenges in recovering full length var genes.
Of all domains encoded by var, the DBLα domain has been identified as the domain with the highest recombination rate in vitro (Claessens et al., 2014) and is immunogenic with variant-specific epitopes, recognized serologically in an age-dependent manner (Barry et al., 2011). Thus, a scalable solution to studying this highly-diverse var multigene family in natural populations has been to target a small conserved region within the DBLα domain of var genes (i.e., DBLα tags) (Barry et al., 2007; Chen et al., 2011; Yalcindag et al., 2012; Tessema et al., 2015; Day et al., 2017; Rougeron et al., 2017; Ruybal-Pesántez et al., 2017). This marker has been used as a proxy to characterize var diversity (Barry et al., 2007; Chen et al., 2011; Albrecht et al., 2006, 2010) and repertoire structure (Day et al., 2017), and has served as empirical data for the analysis of interventions (Tiedje et al., 2022; Pilosof et al., 2019). Studies in high transmission showed limited overlap of var DBLα repertoires (Day et al., 2017; Ruybal-Pesántez et al., 2017; Tiedje et al., 2017; Ruybal-Pesántez et al., 2022) as a consequence of immune selection (He et al., 2021). Subsequently, these studies have also served as proof of concept for the use of DBLα tags for estimating complexity/multiplicity of infection (MOI) in surveillance (Ruybal-Pesántez et al., 2022; Tiedje et al., 2022) and this has been evaluated compared to SNP barcoding using a mathematical modelling exercise (Labbé et al., 2023). These studies made the assumption that each DBLα tag represents a unique var gene, especially for the non-upsA var. If the high mitotic recombination rates observed by Claessens et al., 2014 in vitro also occur in vivo, this assumption would be incorrect in natural populations as we would see many chimeric var genes that share a same DBLα tag. Now that a dataset of var gene sequences is recently available (Otto et al., 2019), we can test this assumption to better understand the DBLα-var relationship (i.e., whether it is a specific 1-to-1 or 1-to-many).
Using a subset of the assembled var dataset published by Otto et al. (2019), we investigated the relationships between DBLα tags and var in four study sites located in four countries: Pursat (Cambodia) and Mae Sot (Thailand), representing low malaria transmission, and Navrongo (Ghana) and Chikwawa (Malawi), representing high malaria transmission. In all four study sites, DBLα-var relationships were shown to be predominantly specific (i.e., 1-to-1) with much smaller proportions of DBLα types associated with many var exon 1 sequences. We attribute this specificity to the field observation that most DBLα sequences are found to be rare in a local population and that targeting sequences encoding a fast-evolving domain will yield a highly-specific domain-to-var relationship. Finding mostly highly-specific DBLα types has an important and practical implication; it indicates that the diversity of DBLα types can be used as an approximation of diversity levels of var genes (more specifically, var exon 1) in genomic epidemiological studies conducted in a local endemic area, supporting a simple strategy to monitor and tackle the complexity of the var system in endemic areas where whole genome sequencing efforts often ignore these important genes.
2 Methods
2.1 Data selection
Assembled var sequences are available for 15 countries in the ‘Full Dataset’ published in Otto et al. (2019), of which six are in Asia and nine are in Africa (Figure S1 in Data Sheet 1), and represent clinical isolates with varying malaria disease status (e.g., severe, acute/uncomplicated) (Consortium P., 2016; MalariaGen et al., 2021). The four countries (Cambodia, Thailand, Ghana, Malawi) with the highest number of isolates were identified. For each country, the study site with the highest number of isolates available was selected for analysis in this study. These are Pursat (Cambodia) and Mae Sot (Thailand), representing study sites with low malaria transmission, and Navrongo (Ghana) and Chikwawa (Malawi), representing study sites with high malaria transmission (Figure 1). Maps in Figure 1 were produced using data from the rnaturalearth R package (South, 2017) and visualized with ggplot2 (Wickham, 2016).
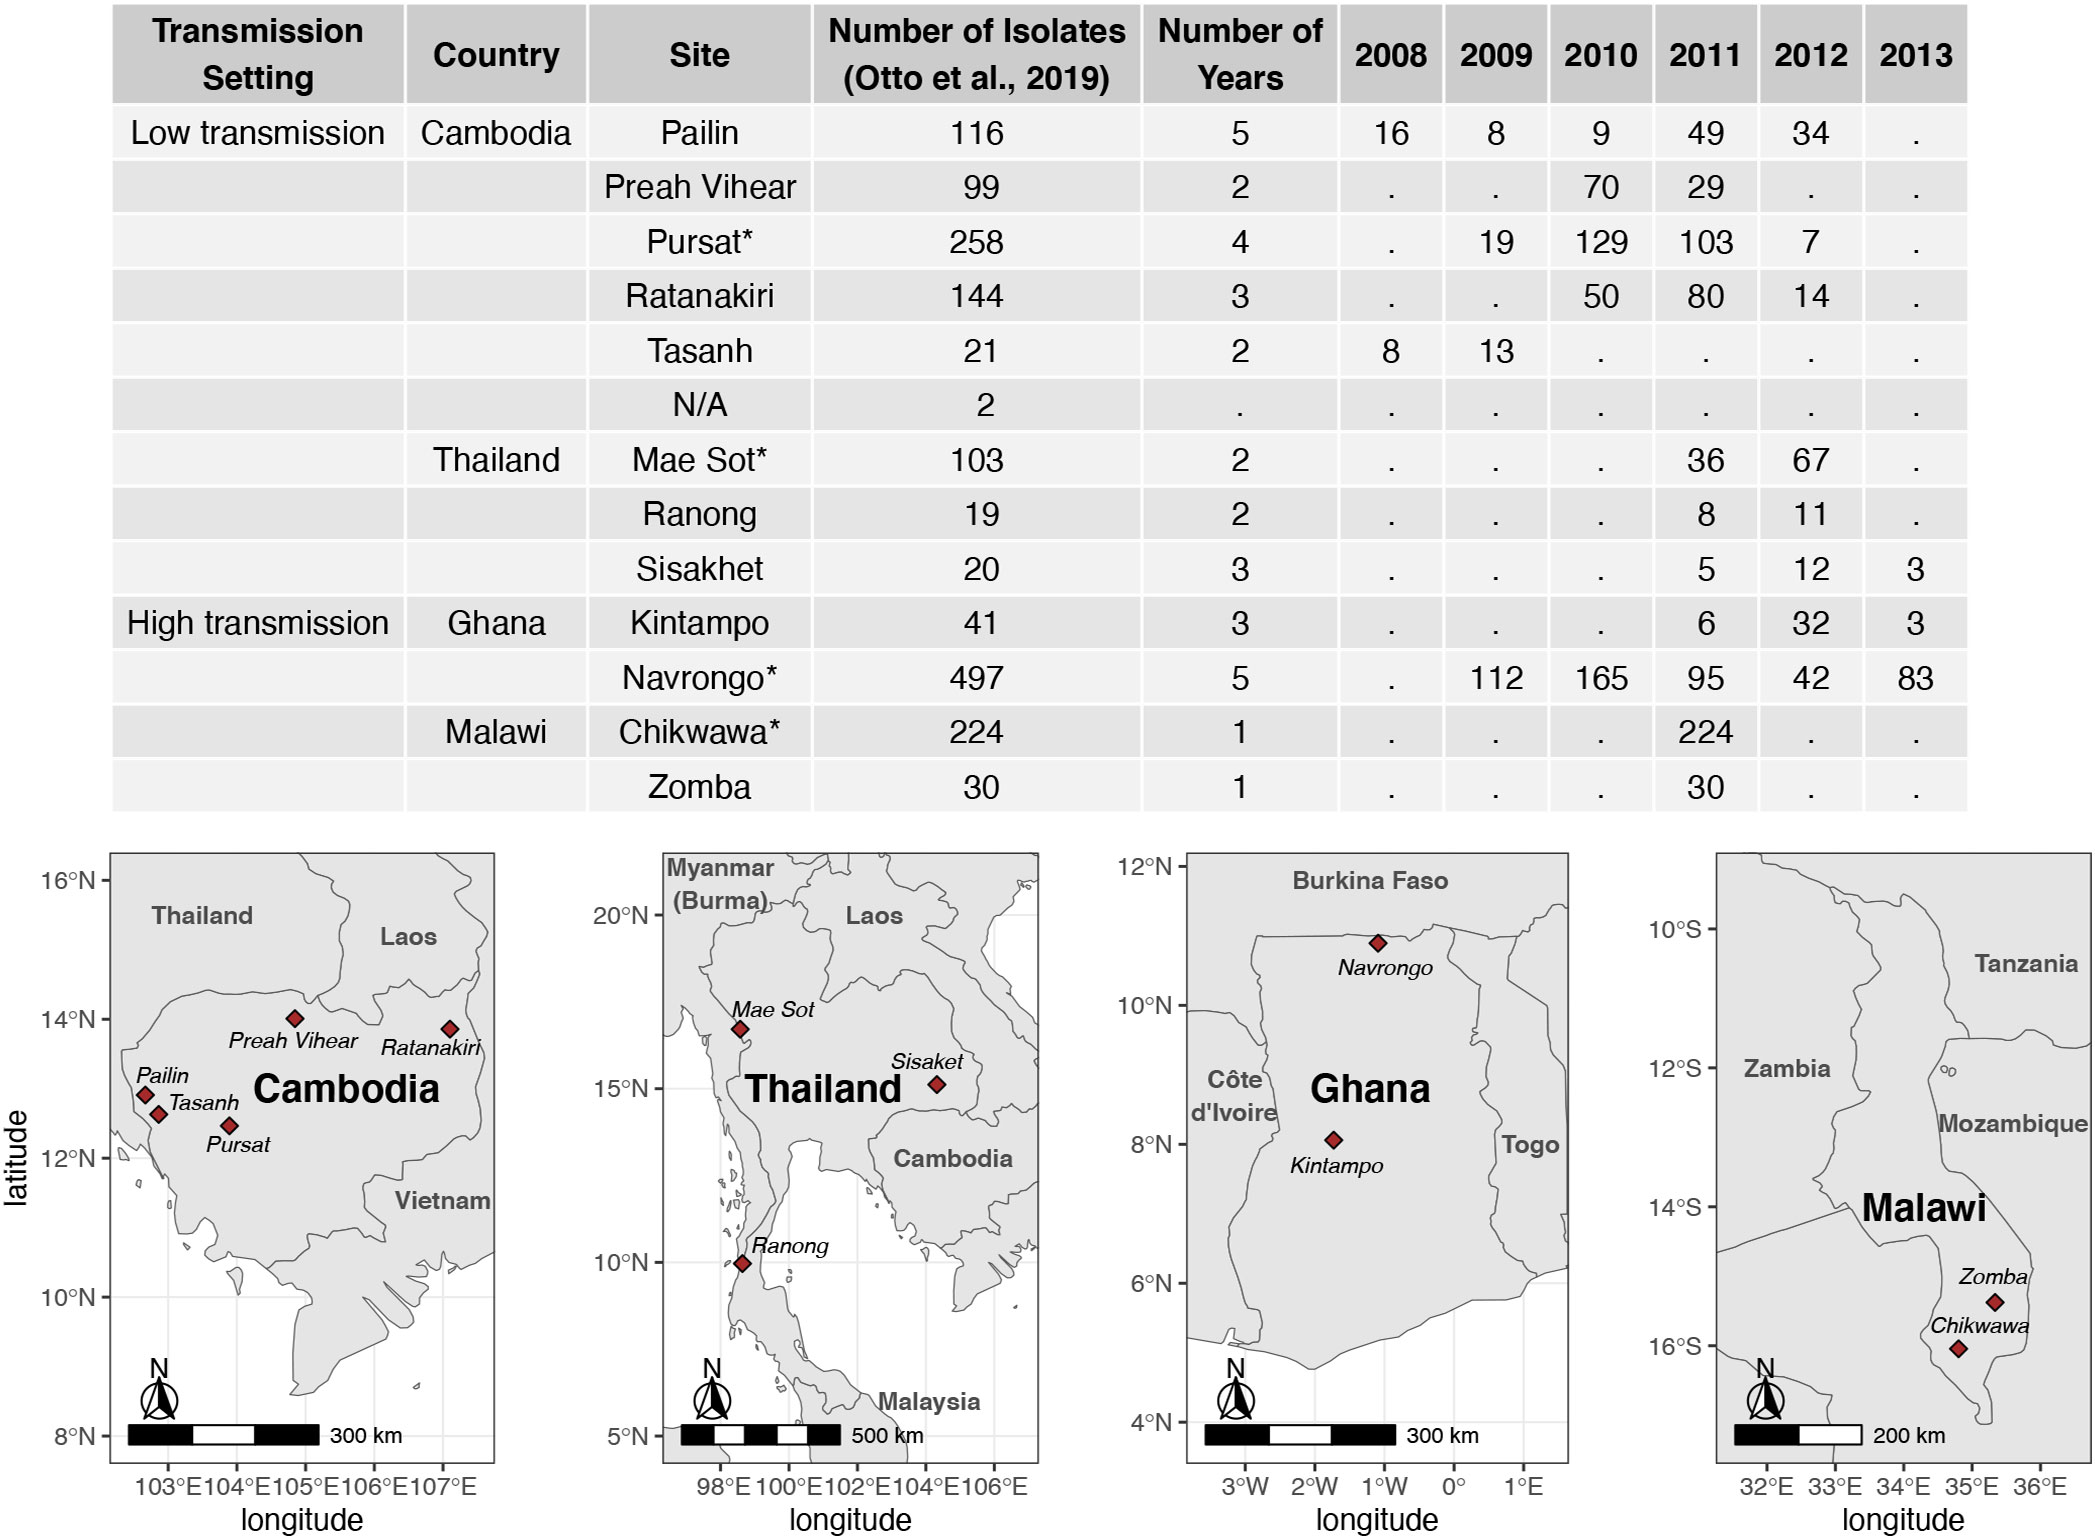
Figure 1 Number of isolates with available var sequences from study sites in Cambodia, Thailand, Ghana, and Malawi. Var sequences were downloaded from the published ‘Full Dataset’ by Otto et al. 2019. Study sites marked with ‘*’ in the table were selected for analysis in this study.
2.2 Extraction of complete var exon 1 sequences
The ‘Full Dataset’ was filtered to retain only complete var exon 1 sequences. The majority of var genes have been reported to contain an N-terminal segment (NTS) on the 5’ end and a transmembrane region (TM) on the 3’ end of exon 1 (Rask et al., 2010). Therefore, in this study, the NTS and TM domains were used to represent the left (5’ end) and right (3’ end) boundaries of var exon 1, respectively (Figure 2). Given that this study aims to investigate relationships between DBLα types and var sequences, var sequences with missing DBLα domain annotations were excluded, and in doing so, var2csa genes that do not contain the DBLα domain and var3 genes that contain a particularly distinct DBLα-ζ hybrid domain were also not analyzed. In summary, to be considered as containing a complete var exon 1, the following criteria must be met:
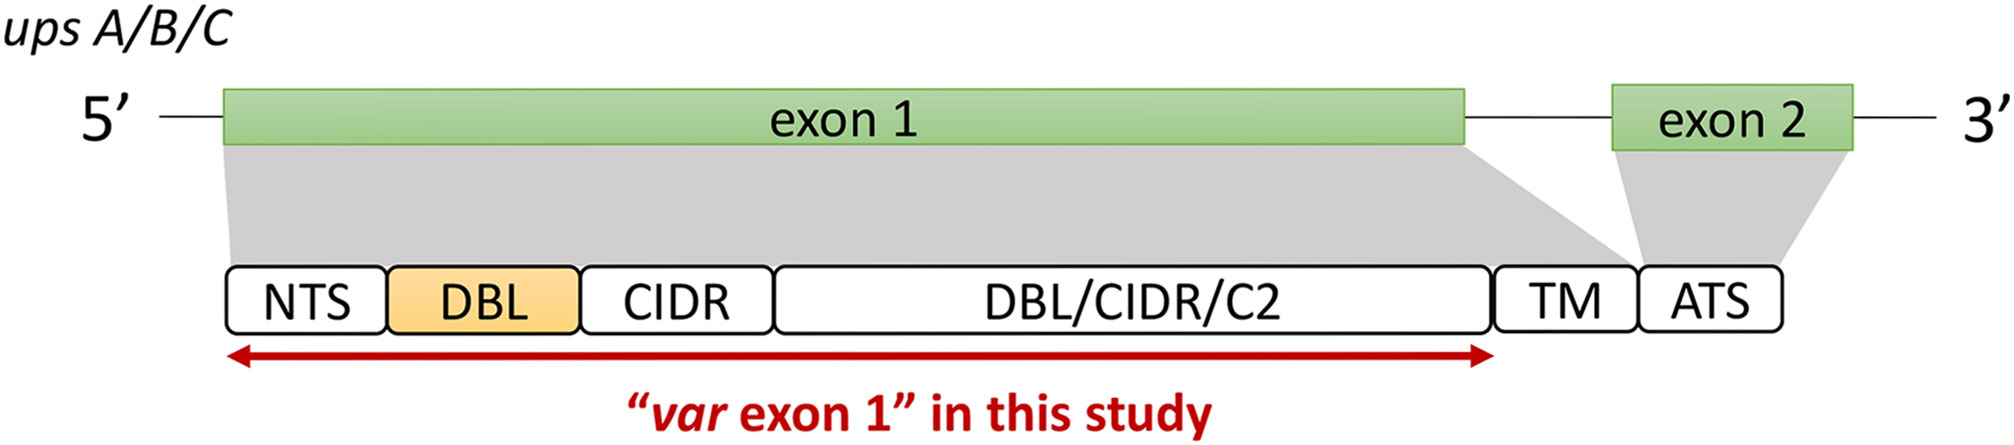
Figure 2 General var gene structure and "var exon 1" in this study (see Methods for details). Generally, the var gene structure consists of two exons; a larger exon 1 that encodes the extracellular antigenic portion of the PfEMP1 protein that is ‘exposed’ to host receptors and antibodies, and a smaller, semi-conserved exon 2 that remains intracellular (Su et al., 1995; Smith et al., 2000). The first exon typically consists of an N-terminal segment (NTS) on the 5’ end, followed by sequences encoding multiple semi-conserved domains such as the Duffy binding-like domains (DBL), cysteine-rich interdomain regions (CIDR) and/or C2 domains that, when combined, make up various var domain compositions and structures (Kraemer and Smith, 2006; Rask et al., 2010). While domains such as the DBLδ and CIDRα have been shown to be highly diverse (Otto et al., 2019), the DBLα domain has the added importance of being present in most var genes (Rask et al., 2010). Based on the upstream promoter sequence, var genes in this multigene family can be further divided into four subgroups of upsA, upsB, upsC, and upsE, with each group exhibiting unique characteristics related to general genomic location, transcription direction, host receptor binding, and disease severity (Gardner et al., 2002; Lavstsen et al., 2003; Kraemer and Smith, 2006).
● The var sequence must be translatable and must begin with a start codon (‘Met’)
● The var sequence must not contain gaps (‘N’s)
● The var sequence must encode exactly one NTS domain, exactly one DBLα domain and exactly one TM domain
To detect the presence of these domains, the annotation of domains provided by Otto et al. (2019) was firstly used to check that a sequence encodes both the NTS and DBLα domains. To further verify that a var encodes the NTS and TM domains, each sequence was translated according to its best reading frames and, using hmmsearch (Eddy, 2011), was searched for homology blocks HB20 (found in NTS) and HB21 (found in TM) (Rask et al., 2010). Domain score cut-offs of 10 and 20 were used for NTS and TM alignments, respectively, and these were determined from distributions of domain scores from alignments of var genes recovered from a set of 16 whole genome assemblies (Figure S2 in Data Sheet 1), downloaded from PlasmoDB and NCBI (14 from PlasmoDB (Otto et al., 2018), two from NCBI). Var sequences that did not contain alignments to both homology blocks were removed. Var sequences containing multiple NTS, DBLα or TM domains were also removed as these may be a result of mis-assemblies. The remaining sequences were then truncated on the 3’ end to include sequences from the start of the var gene to just before the region encoding the TM domain (i.e., excluding the TM sequence region) (Figure 2). This was done using the coordinate position of the alignment to HB21 (i.e., ‘from’ position (env coords)). Var1 sequences were also identified based on information in the sequence headers (Otto et al., 2019) and excluded.
2.3 Extraction of DBLα tags from var exon 1
Nucleotide sequences encoding the DBLα domains were extracted from complete var exon 1 sequences using domain annotations provided alongside the assembled var datasets (Otto et al., 2019). These DBLα sequences were further translated according to their best reading frame and, using hmmsearch (Eddy, 2011), the resulting amino acid sequences were further searched against positions 189 to 430 of the PFAM profile alignment (PF05424_seed.txt) to extract the ‘tag’ region. A domain score cut-off of 60 was used. This was determined from a distribution of domain scores from alignments of DBLα tags of var genes from a set of 16 whole genome assemblies (Figure S2 in Data Sheet 1), downloaded from PlasmoDB and NCBI (as above). For each sequence, if 100 (out of 111) positions of the HMM profile were aligned (hmm coords), the best aligned hit was retained. The identified ‘from’ and ‘to’ positions (env coords) were used to extract the DBLα tag region that would have been typically amplified with universal degenerate primers (Taylor et al., 2000).
2.4 Clustering of DBLα tags into DBLα types
DBLα tags were clustered with vsearch (Rognes et al., 2016) using the cluster_fast function at a range of thresholds from 90% to 100% nucleotide identity, calculated over whole alignment lengths, including terminal gaps (–iddef 1). The 96% nucleotide identity threshold was selected for further downstream analyses to reflect the application of this method in the field and in current bioinformatic workflows when defining representative DBLα types [e.g (Barry et al., 2007; Ruybal-Pesántez et al., 2017; Tonkin-Hill et al., 2021)].
2.5 Sampling curves
Rarefaction curves for var exon 1 and DBLα types clustered at a threshold of 96% nucleotide identity were generated with the rarecurve function in the vegan R package (Oksanen et al., 2022) and plot with ggplot2 (Wickham, 2016).
2.6 Classification of DBLα types and var into upsA or non-upsA groups
The classifyDBLalpha pipeline (Ruybal-Pesántez et al., 2017) was used to assign domain classes and subclasses to DBLα types. DBLα types that were assigned the DBLα1 domain class were classified into the upsA group whereas DBLα types assigned with the DBLα0 or DBLα2 domain classes were classified into the non-upsA group (i.e., upsB/upsC) (Rask et al., 2010). Similarly, var exon 1 sequences were also classified into the different ups groups based on the classification of their associated DBLα types.
2.7 Determination of DBLα-var relationships
An overview of the workflow to determine DBLα-var relationships is illustrated in Figure 3. DBLα types were globally aligned to var exon 1 with vsearch (Rognes et al., 2016) using the usearch_global function, according to the following configurations:
● Alignments of DBLα types to site-specific var (e.g., Pursat DBLα types to Pursat var exon 1)
● Alignments of DBLα types to country-specific var (e.g., Pursat DBLα types to Cambodia var exon 1)
● Alignments of DBLα types to continent-specific var (e.g., Pursat DBLα types to Asia var exon 1; Navrongo DBLα types to Africa var exon 1)
● Alignments of DBLα types to time-specific var (e.g., Pursat DBLα types to Pursat var exon 1 found in 2010)
DBLα types generated from clustering at a 96% nucleotide identity threshold were aligned to var exon 1 sequences at the same alignment threshold of 96%. Pairwise nucleotide identities of these alignments were calculated over the alignment length, excluding terminal gaps (–iddef 2). For each group of var exon 1 sequences that share a same DBLα type, the DBLα tag region of these var exon 1 sequences were masked with ‘N’s and dereplicated. The relationship between a DBLα type and var exon 1 was then determined from the number of unique var exon 1 sequences in each group of var exon 1 that share a same DBLα type. Therefore:
● a 1-to-1 relationship is defined as a DBLα type found in only one unique var exon 1
● a 1-to-2 relationship is defined as a DBLα type shared by two unique var exon 1
● a 1-to-n relationship is defined as a DBLα type shared by n unique var exon 1
2.8 Determination of DBLα type-to-domain relationships
From the same set of var exon 1 sequences as described above, sequences encoding the DBLα domain were extracted based on the annotation of domains provided by Otto et al. (2019). Similar to the method used to determine DBLα-var relationships, DBLα types were aligned to DBLα domain sequences at an alignment threshold of 96%. The DBLα type-to-domain relationship was then determined from the number of unique sequences encoding the DBLα domain in each group that share a same DBLα type.
2.9 Pairwise alignment of var exon 1
For each group of var exon 1 that share a same DBLα type, an all vs all sequence alignment of var exon 1 sequences in the group was performed using the allpairs_global option within vsearch (Rognes et al., 2016) and set to include all pairwise alignments (–acceptall). Pairwise nucleotide identities were estimated based on calculations over whole alignment lengths, including terminal gaps (–iddef 1), to account for differences in pairs of var exon 1 of variable lengths. Pairs of var exon 1 were randomly chosen as examples for alignments for different ranges of sequence similarity (40-50%, 50-60%, 60-70%, 70-80%, 80-90%, 90-99%, ≥99%), then aligned and visualized using mVISTA (Frazer et al., 2004) in glocal alignment mode (Shuffle-LAGAN) (conservation parameters: Min ID=70, Min Length=100) (Brudno et al., 2003). Domain organization of var genes were obtained from domain annotation information provided by Otto et al. (2019).
3 Results
3.1 Description of datasets representing low and high malaria transmission
Datasets of clinical isolates from study sites in each of the countries in Asia (Pursat, Cambodia and Mae Sot, Thailand) and Africa (Navrongo, Ghana and Chikwawa, Malawi) were chosen as these have the largest number of isolates, to represent areas with low and high malaria transmission, respectively (Figure 1). An overview of the workflow used in this study is illustrated in Figure 3, with details and definitions outlined in Methods. In the ‘Full Dataset’ of assembled var sequences (Otto et al., 2019), more var sequences were available for African study sites (Navrongo: 94,802; Chikwawa: 54,814) compared to Asian study sites (Pursat: 27,933; Mae Sot: 12,093) (Figure 4A). Across all four study sites, an average of 22.6% of var sequences contained the complete var exon 1 sequence (Figure 4A, see Figure 2 and Methods for a definition of ‘complete var exon 1’), with var1 homologs excluded, due to their unusual characteristics as isolate-transcendent var genes that are semi-conserved and have unique features different from all other var genes (Kraemer et al., 2007). Homologs of other isolate-transcendent var genes (i.e., var2csa and var3) were also absent from these datasets; var2csa lacks a DBLα domain whereas var3 contains a particularly distinct DBLα-ζ hybrid domain instead (Rask et al., 2010). The final cleaned datasets consisted of var exon 1 sequences from 230, 103, 476, and 224 isolates from Pursat, Mae Sot, Navrongo, and Chikwawa, respectively, sampled over varying time spans ranging from one to five years (Figure 4B). Var exon 1 and DBLα tag sequences are available as Data Sheet 2.
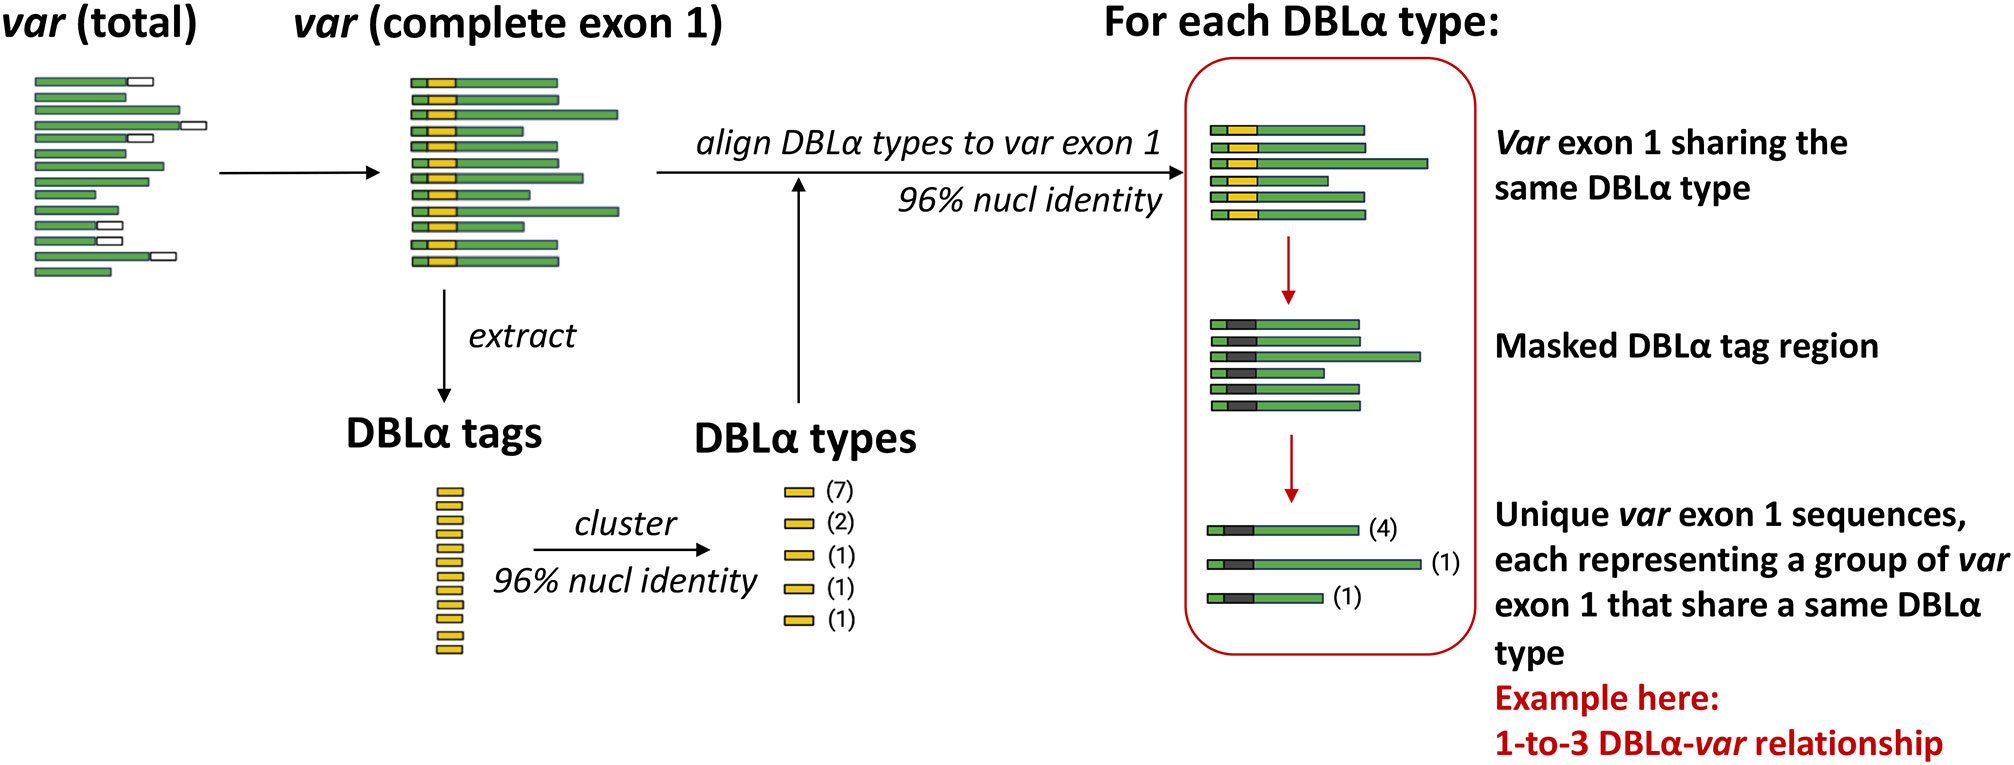
Figure 3 Overview of workflow to determine DBLα-var relationships. Numbers in parentheses represent the frequency of sequences.
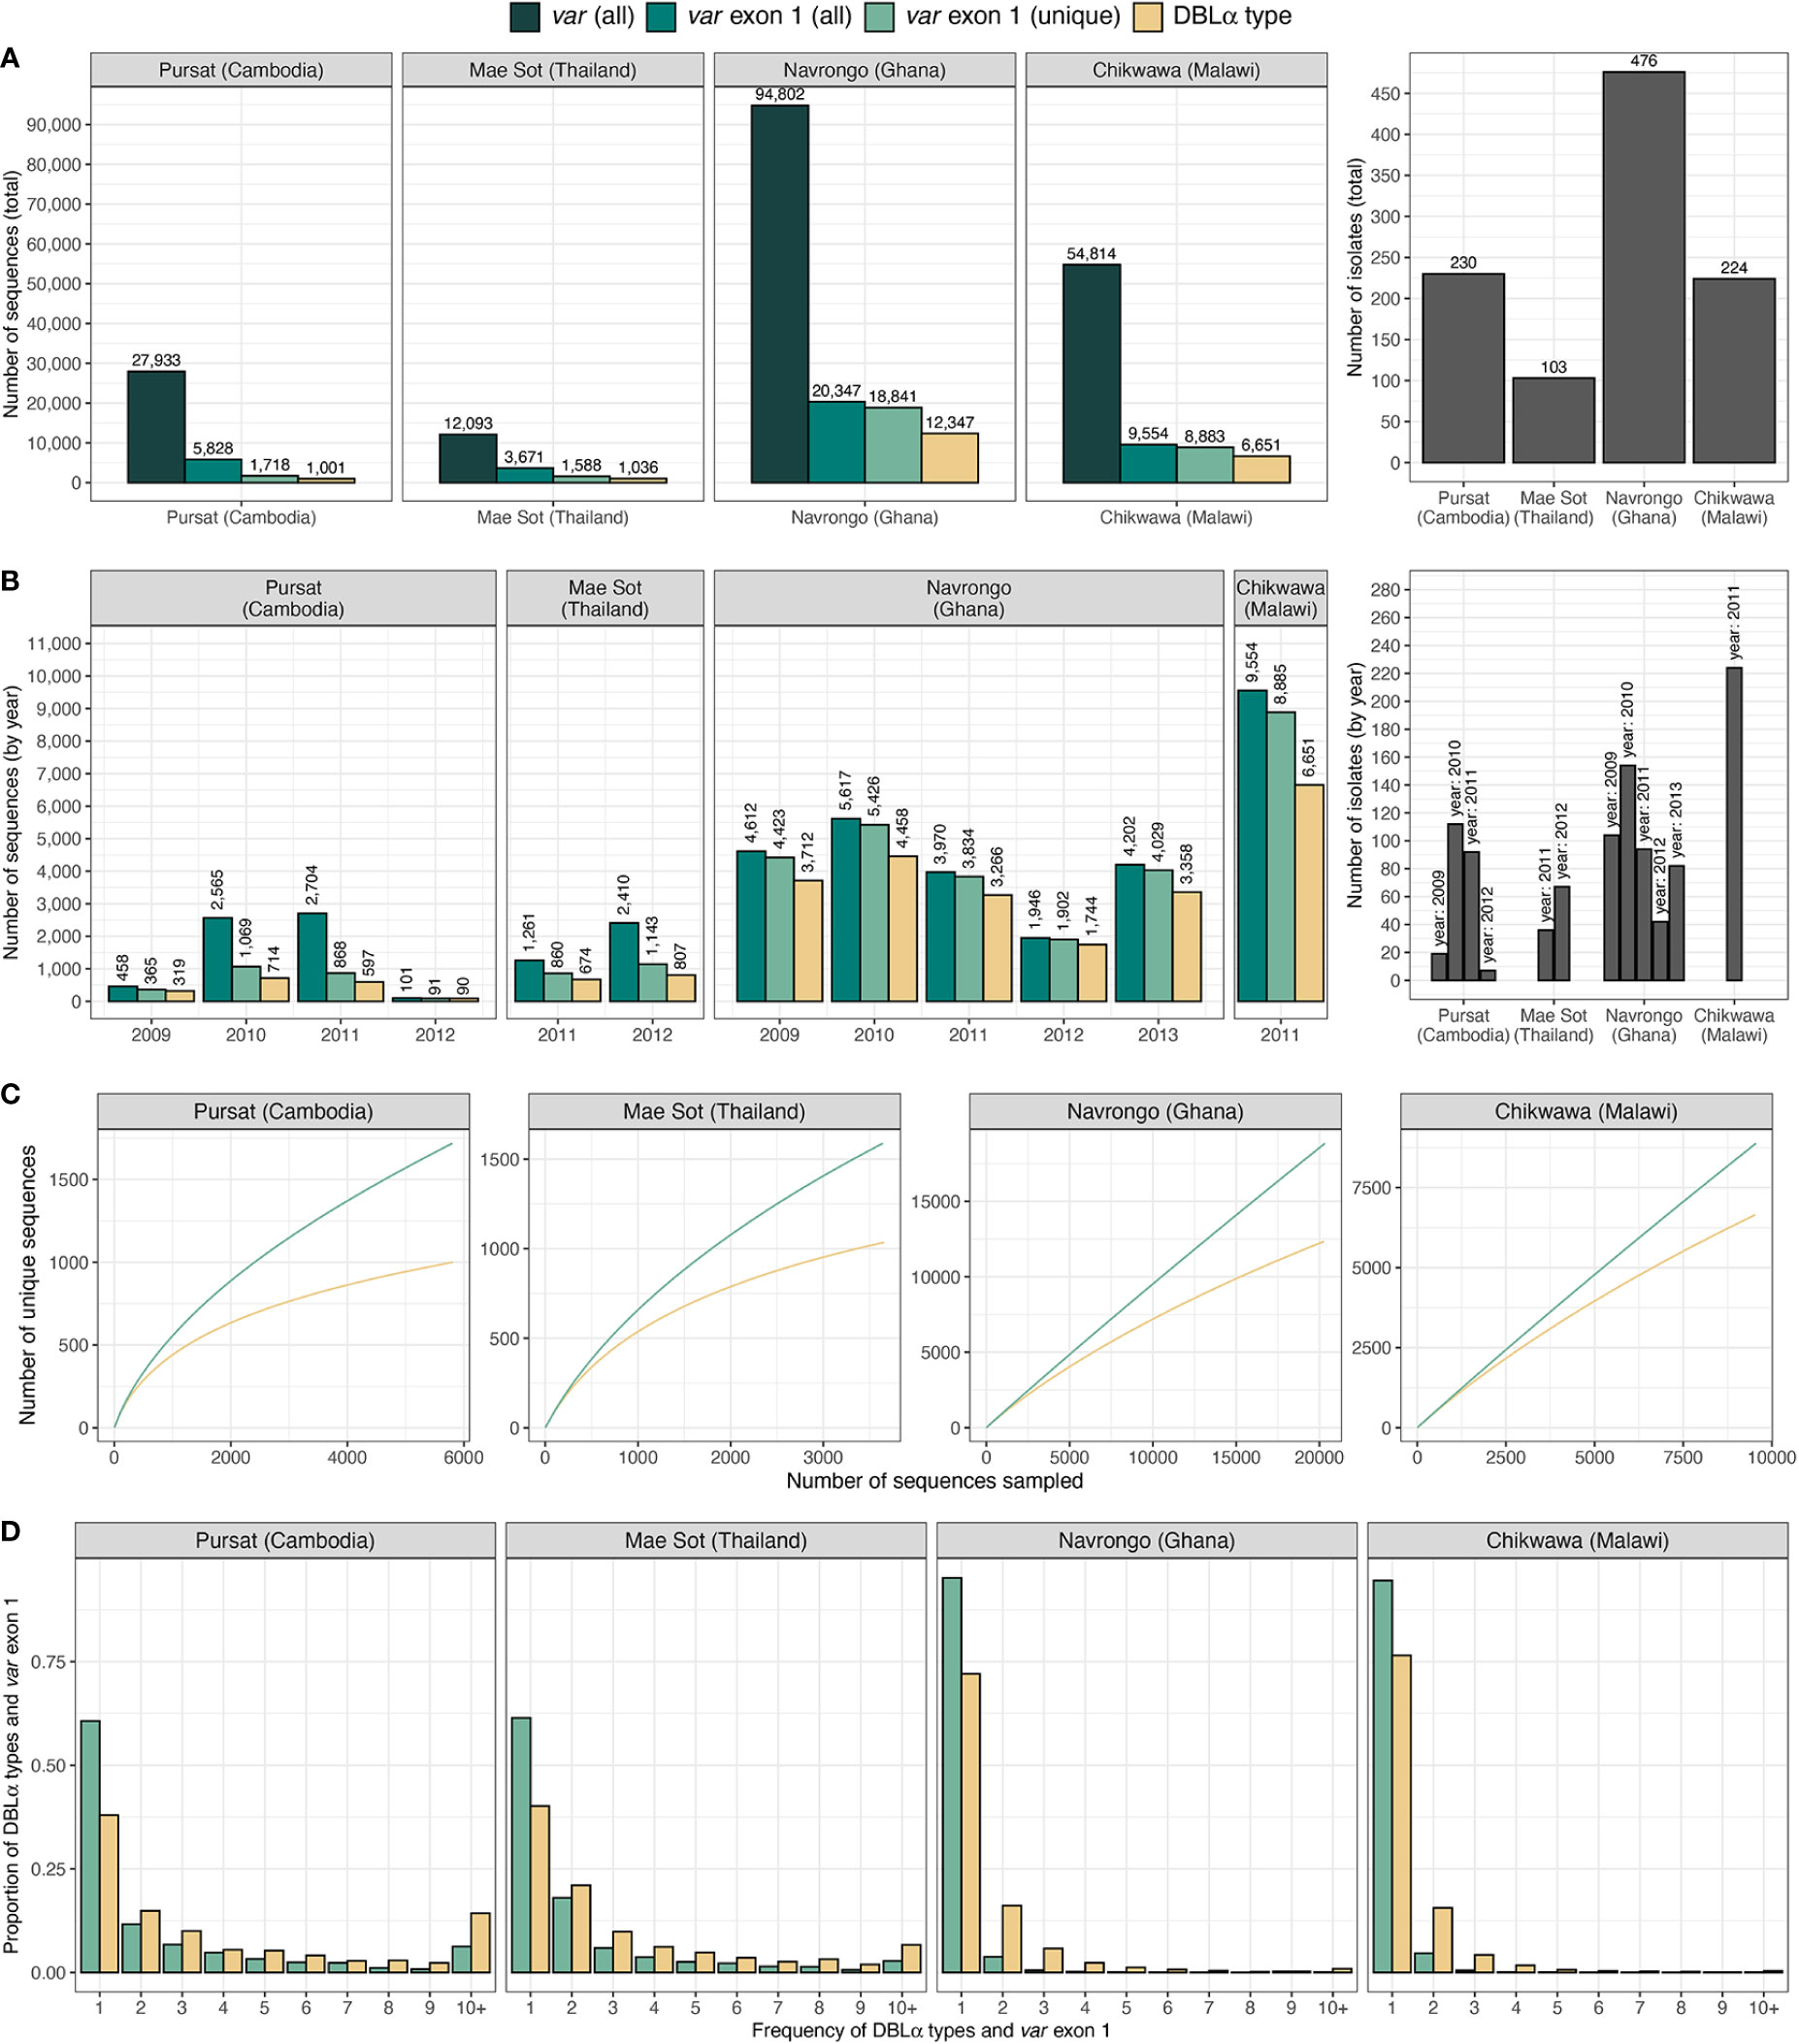
Figure 4 Description of var and DBLα type data from countries and sites. Number of sequences and isolates in the final dataset of var exon 1 (green) and DBLα type (yellow) sequences are presented (A) in total, and (B) by year. (C) Sampling curves of var exon 1 and DBLα type sequences. (D) Distribution of var exon 1 and DBLα type frequencies. Note: ‘var exon 1 (all)' represents a collection of all var genes inclusive of replicated sequences whereas ‘var exon 1 (unique)’ refers to representative var exon 1 sequences, each representing a group of var exon 1 that share a same DBLα type (clustered at 96%).
Using a previously-determined threshold of 96% nucleotide identity (Barry et al., 2007) that has been used in several studies [e.g (Chen et al., 2011; Day et al., 2017; Rougeron et al., 2017; Tessema et al., 2019)], clustering of DBLα tags at this threshold resulted in 1,001, 1,036, 12,347, and 6,651 DBLα types for Pursat, Mae Sot, Navrongo, and Chikwawa, respectively (Figure 4, results from varying threshold values shown in Figure S3 in Data Sheet 1). Although larger numbers of var exon 1 and DBLα type sequences were available for Navrongo and Chikwawa, depths of sampling of both var exon 1 and DBLα type sequences were better achieved in Pursat and Mae Sot. Rarefaction sampling curves showed early indications of approaching data saturation in these study sites with low malaria transmission, more so for DBLα types than var exon 1 (Figure 4C). On the other hand, substantially elevated diversity of var exon 1 and DBLα types in high-transmission study sites was evident, with curves that continue to progressively increase with minimal signs of plateauing, indicative of under-sampling of both var exon 1 and DBLα type sequences in these datasets. When explored by ups groups, DBLα types were observed to most closely reflect diversity estimates of var exon 1 in non-upsA genes and in high-transmission sites (Figure S4 in Data Sheet 1). In all study sites, differences in the number of DBLα types and var exon 1, as well as deflections in the curves, provide preliminary indications of some level of sharing of DBLα types between different var exon 1 sequences.
Regardless of transmission intensity, most var exon 1 and DBLα types were present in these datasets at low frequencies, with median frequencies of 1 or 2 at each study site (Figure 4D). However, within datasets for each study site, there were also smaller subsets of var exon 1 and DBLα types that were observed many times. The highest frequency var exon 1 in Pursat (PH0055-C.g29; NTS-DBLα-CIDRα-DBLδ-CIDRγ-DBLϵ-DBLϵ-DBLϵ), Mae Sot (PD0461-C.g223; NTS-DBLα-CIDRα-DBLδ-CIDRγ), Navrongo (PF0035-C.g504; NTS-DBLα-CIDRα-DBLδ-CIDRβ), and Chikwawa (PT0041-C.g416; NTS-DBLα-CIDRα-DBLδ-CIDRβ) were seen 83, 47, 39, and 20 times, respectively, in each population. The ‘NTS-DBLα-CIDRα-DBLδ-CIDRβ’ and ‘NTS-DBLα-CIDRα-DBLδ-CIDRγ’ domain architectures have been previously shown to be the most frequently observed in known var genes (Kraemer and Smith, 2006). On the other hand, the triple DBLϵ structure of the highest frequency var exon 1 in Pursat is less common; this var gene may potentially be defined as domain cassette 7 (DC7) in Rask et al. (2010). Notably, although the highest frequency var exon 1 in Navrongo and Chikwawa were of comparable lengths (5,226 and 5,184 nucleotides) and shared the same domain composition and structure, these sequences shared only 59.5% nucleotide identity and are, therefore, very different var genes.
3.2 Site-specific analysis suggests strong DBLα-var relationships in local populations
The workflow to determine varying degrees of relationships between DBLα types and var exon 1 is detailed in Figure 3 and Methods. For simplicity and ease of understanding, we refer to these quantitative relationships between DBLα types and var exon 1 as “DBLα-var relationships”. For example, a 1-to-1 DBLα-var relationship refers to a DBLα type that is associated with only one unique var exon 1 sequence.
In site-specific analysis (i.e., alignment of DBLα types to var exon 1 available from a local study site, see Methods), a consistent pattern of proportions of DBLα-var relationships was observed across all study sites (Figure 5 and Data Sheet 3). For all four study sites, mainly 1-to-1 DBLα-var relationships were observed, indicating a highly-specific relationship between these DBLα types and var exon 1 sequences (Figure 5A, dark blue). On average, these 1-to-1 relationships were seen for 65.3% of DBLα types in low-transmission sites and 77.1% of DBLα types in high-transmission sites. This was followed by a second largest proportion of DBLα types linked to two different var exon 1 sequences (lighter blue, i.e., 1-to-2) and, finally, much smaller proportions of DBLα types linked to many var exon 1 sequences (red, i.e., 1-to-many or >5 unique var exon 1 per DBLα type). These relationships were also found to be robust for DBLα types clustered and aligned at varying thresholds, ranging from 90 to 100% nucleotide identities (Figure S5 in Data Sheet 1). A further analysis to determine relationships between DBLα types and sequence regions encoding the complete DBLα domain (i.e., complete DBLα sequence) showed substantially higher levels of 1-to-1 and 1-to-2 specific type-to-domain relationships (Figure S6 in Data Sheet 1), which implies that the observed 1-to-many DBLα-var relationships result from variation in sequence regions of the var gene outside of the DBLα domain. In the 1-to-1 DBLα-var relationship category, var exon 1 sequences associated with highly-specific DBLα types shared mostly 60 to 70% nucleotide sequence identity with other var exon 1 sequences and also varied considerably in sequence length (Figure S7 in Data Sheet 1), suggesting that DBLα types in these highly-specific DBLα-var relationships also likely represent antigenically very different var genes; this remains to be explored and verified in future proteomic studies.
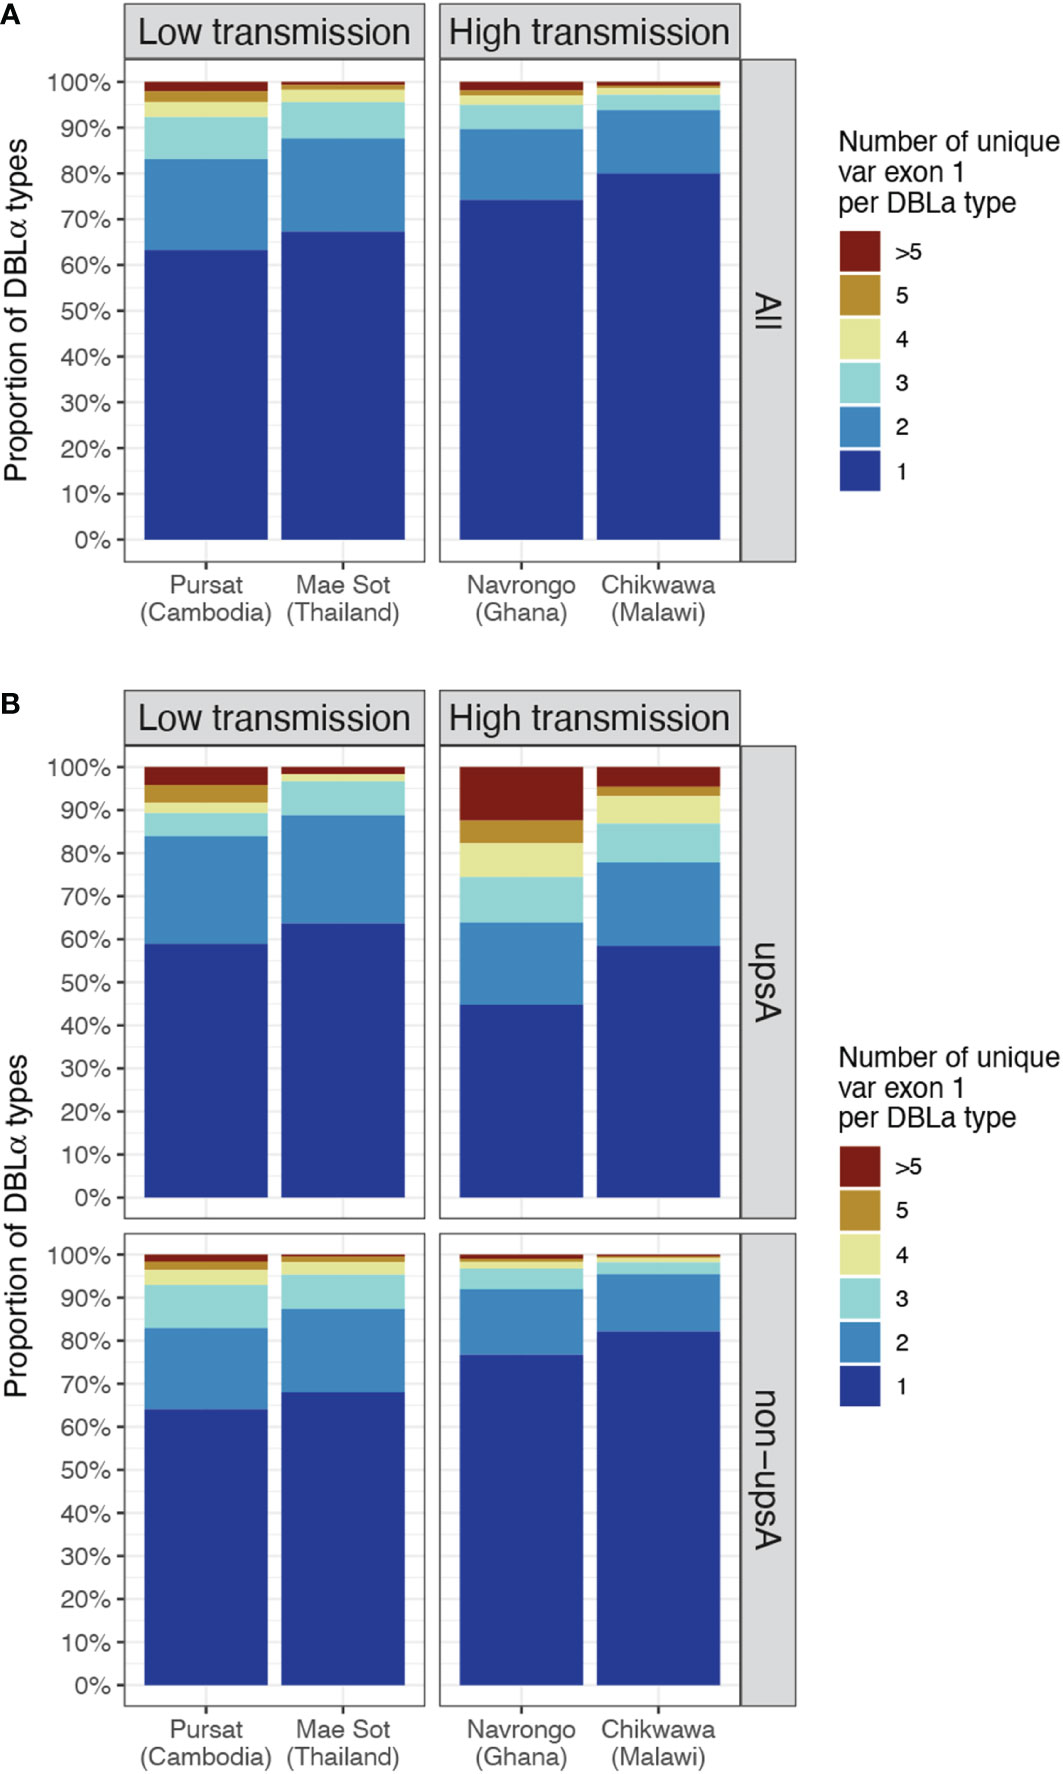
Figure 5 DBLα-var relationships based on alignments of DBLα types to site-specific var exon 1. The relationship between a DBLα type and var exon 1 is represented by the number of unique var exon 1 sequences that share a same DBLα type (clustered at 96% nucleotide identity threshold). Example: "1" represents "1-to-1", ">5" represents “1-to-many” DBLα-var relationships. (A) DBLα-var relationships for all DBLα types (B) DBLα-var relationships for DBLα types assigned to upsA and non-upsA groups based on DBLα domain classes. The minor upsA group accounts for an average of only 17.05% and 8.6% of DBLα types in low and high-transmission study sites, respectively.
Classification of DBLα types into upsA and non-upsA (i.e., upsB/upsC) groups showed that, in all study sites, the majority of DBLα types were assigned to the non-upsA group (Pursat: 83.2%, Mae Sot: 82.7%, Navrongo: 92.0%, Chikwawa: 90.8%). All levels of DBLα-var relationships were observed for DBLα types in both upsA and non-upsA groups (Figure 5B). Especially in study sites in Africa, where malaria transmission is high, those in the upsA group are more likely to be in non-1-to-1 DBLα-var relationships, relative to DBLα types in the non-upsA group. This observation was most prominent in Navrongo, with 12.44% of upsA DBLα types (123 of 989) showing a 1-to-many DBLα-var relationship compared to 0.97% of non-upsA DBLα types (110 of 11,358) with 1-to-many DBLα-var relationships (red, Figure 5B). Further classifications of these DBLα-var relationships according to the DBLα domain subclasses (Figure S8 in Data Sheet 1) showed higher observed levels of DBLα1.4, DBLα1.7, and DBLα1.8 domain subclasses for upsA DBLα types in 1-to-many DBLα-var relationships in high-transmission study sites of Navrongo and Chikwawa.
Examination of var gene domain organizations showed the ‘NTS-DBLα-CIDRα-DBLδ-CIDRβ’ structure to be the most common across the lower levels of DBLα-var relationships (i.e., 1-to-1 to 1-to-5) (Data Sheet 4); this structure has been previously reported for var genes mainly in the non-upsA group (Kraemer and Smith, 2006; Rask et al., 2010). In contrast, there was greater variation in the domain organization of var genes associated with 1-to-many DBLα-var relationships, particularly in high-transmission study sites. For this latter category, in addition to the common ‘NTS-DBLα-CIDRα-DBLδ-CIDRβ’ structure, we also observed other var domain organizations in high frequencies (e.g., ‘NTS-DBLα-CIDRα-DBLβ-DBLγ-DBLδ-CIDRβ’ and ‘NTS-DBLα-CIDRα-DBLβ-DBLγ-DBLγ-DBLδ-CIDRβ’) (Data Sheet 4).
Repeated observations of identical var exon 1 sequences that were categorized in 1-to-1 DBLα-var relationships in multiple isolates provide confidence that these inferences of specific relationships were likely true observations. Some of the var exon 1 sequences with these highly-specific 1-to-1 DBLα-var relationships were observed at high frequency within a study site and these were present in both upsA and non-upsA groups (Figure 6A). This was most prominent in sites with low malaria transmission, with some var exon 1 sequences that were categorized in 1-to-1 DBLα-var relationships seen frequently in Pursat (up to 52 times) and Mae Sot (up to 47 times). Some var exon 1 sequences in 1-to-1 DBLα-var relationships were also observed repeatedly in sites of high malaria transmission, but at relatively lower frequencies in Navrongo (up to 18 times) and Chikwawa (up to 8 times). These differences in frequencies between study sites with different malaria endemicities may reflect obvious differences in population frequencies, where parasite populations in low-transmission sites exhibit high linkage disequilibrium and clonality, features that are uncommon in high-transmission sites.
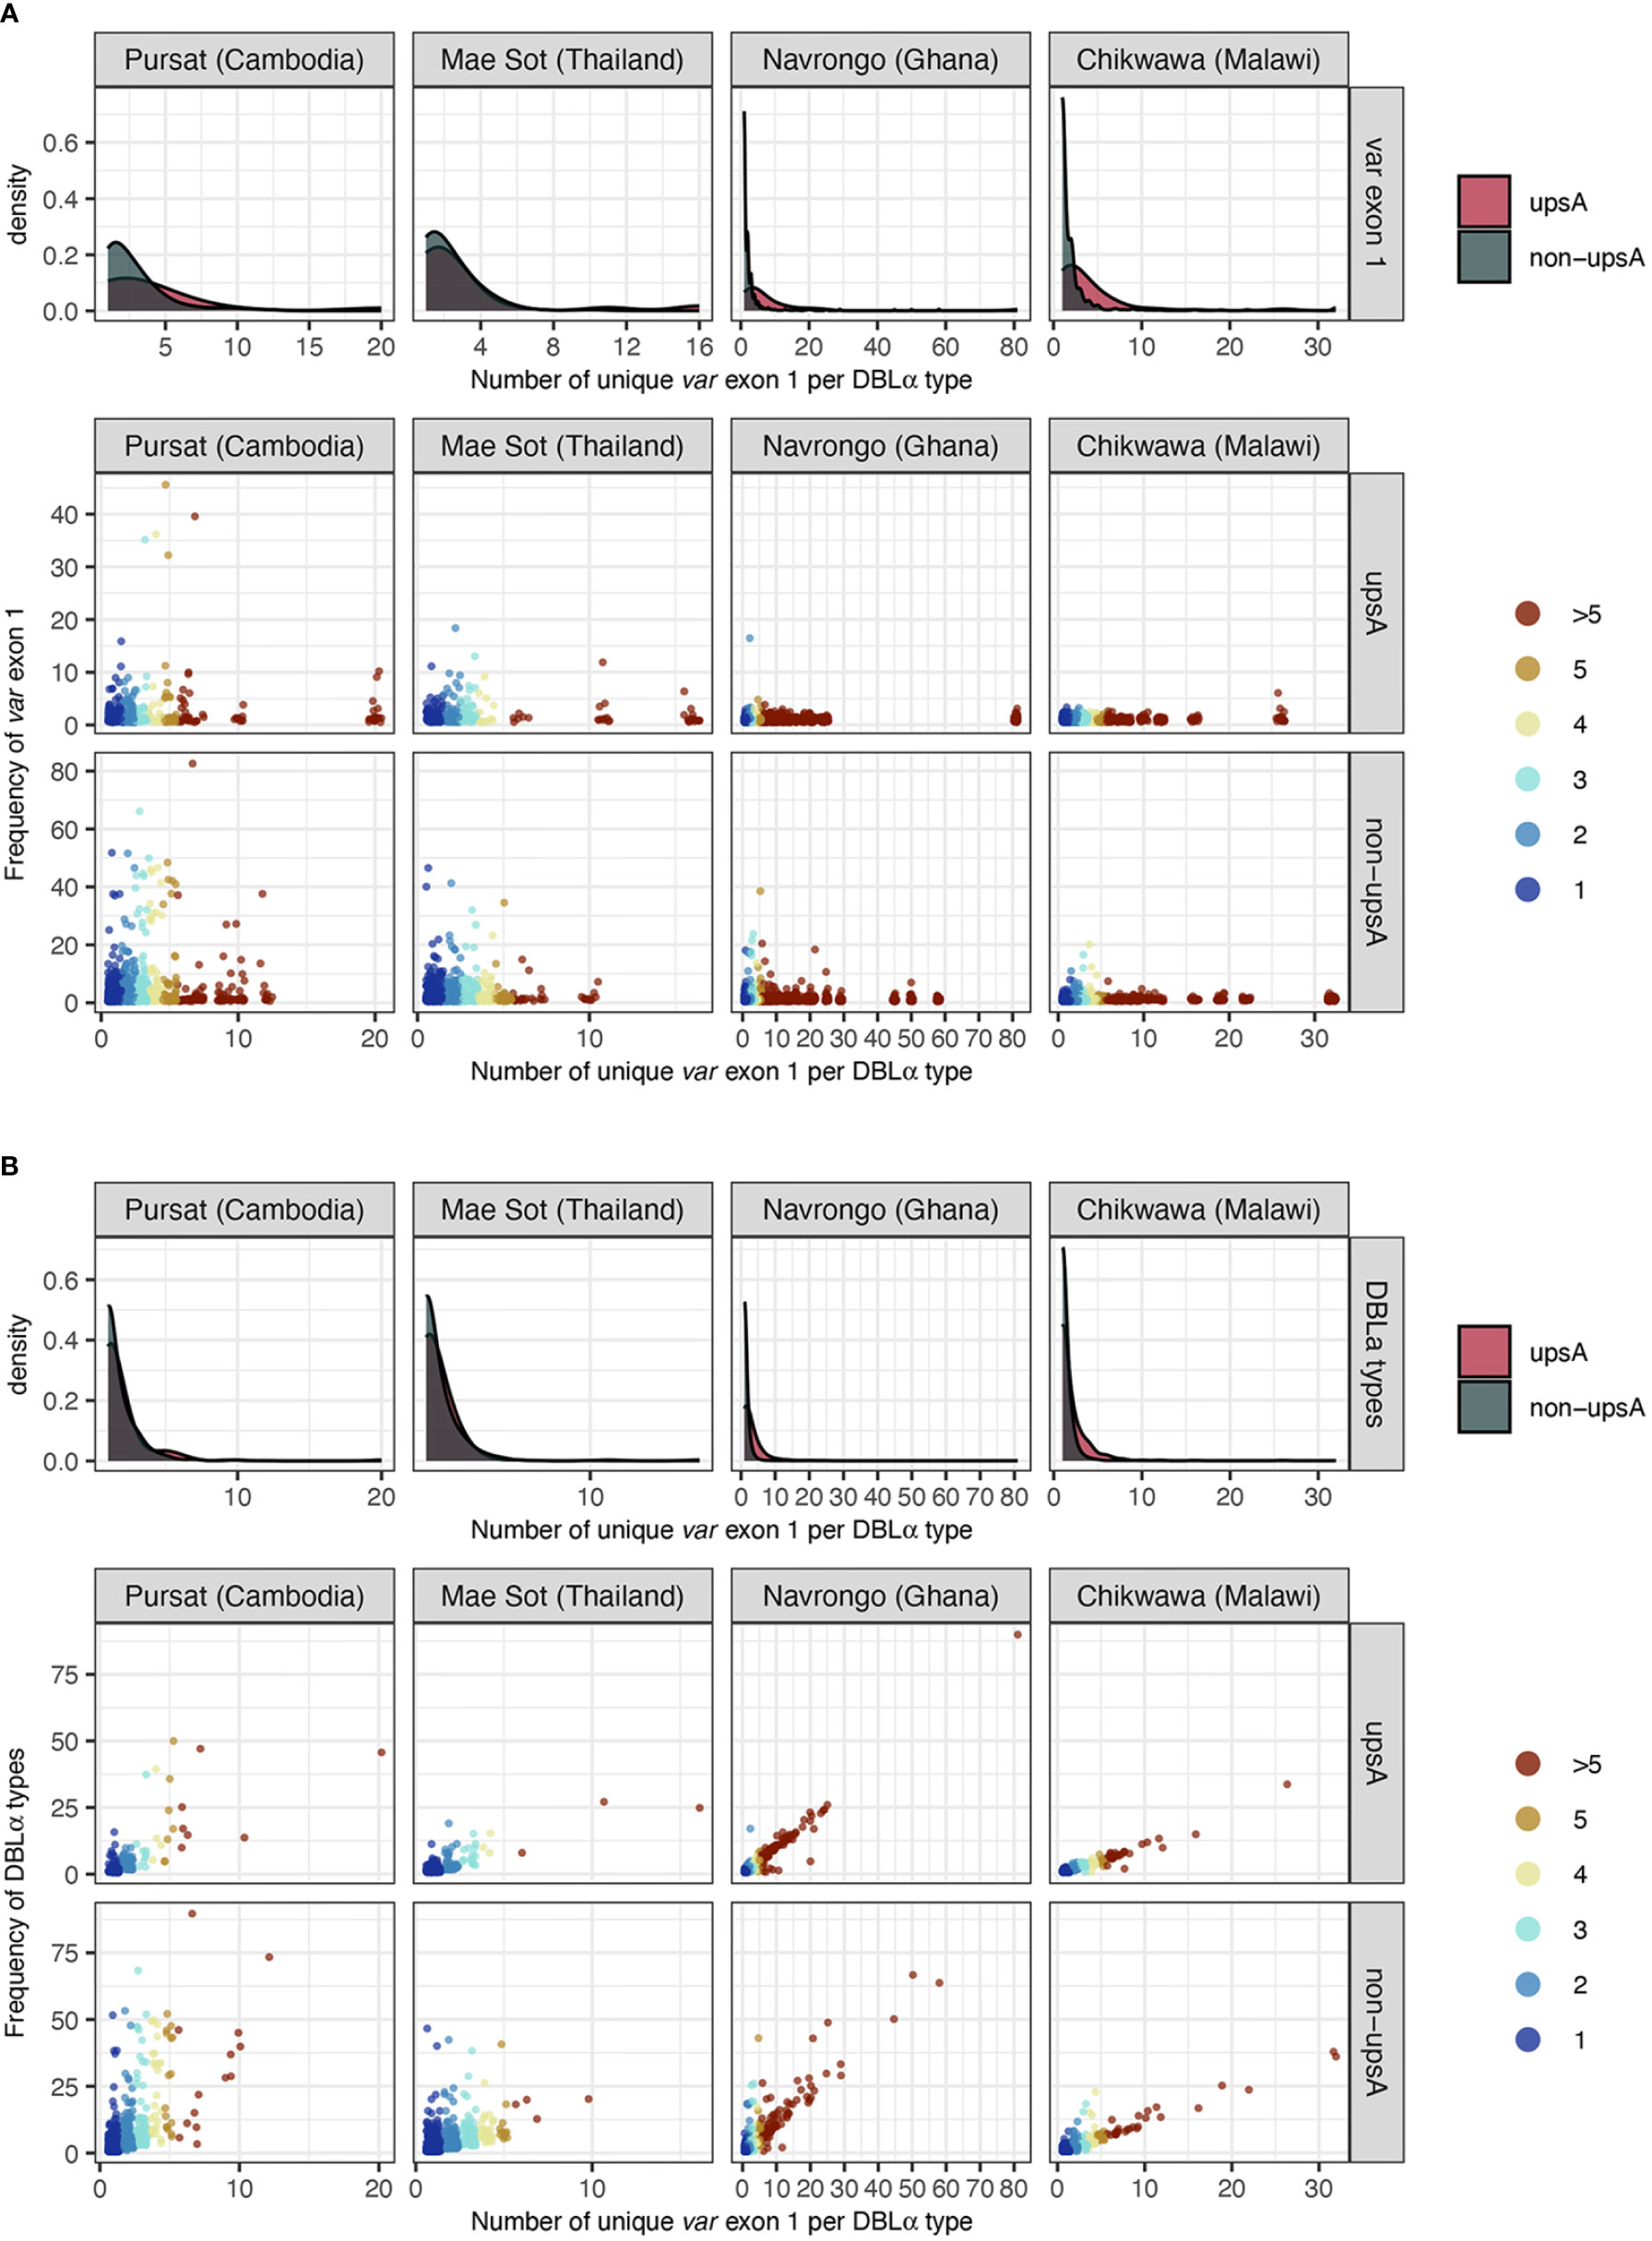
Figure 6 Frequency of (A) var exon 1 and (B) DBLα types (y-axes), categorised by DBLα-var relationships (x-axis). For each plot, density plots (top) show positively-skewed distributions of var exon 1/DBLα type sequences, indicating that most var exon 1/DBLα type sequences are involved in relatively specific DBLα-var relationships (i.e., 1-to-1, 1-to-2). Each point in the jitter plot (bottom) represents a unique var exon 1 or DBLα type sequence in a studied population, colored by its categorized DBLα-var relationship. For Figure 6 (B), although data points are expected to lie above the y=x boundary (i.e., if a DBLα type corresponds to at least n unique var exon 1 sequences, it must occur at least n times), it is possible for two different DBLα types to be aligned to the same var exon 1 due to the nature of centroid selection in the clustering step (see Rognes et al., 2016 for explanation on ‘centroid’). However, this observation is minimal (var exon 1 with >1 aligned DBLα types: 0.5%, 0.4%, 1.1%, and 0.4% for Pursat, Mae Sot, Navrongo, and Chikwawa, respectively).
Time-specific analysis from alignments of DBLα types to var exon 1 from individual years within a study site (see Methods) showed even larger proportions of DBLα types with specific 1-to-1 DBLα-var relationships (Figure S9 in Data Sheet 1). For instance, these 1-to-1 relationships were observed for an average of 88.4% of DBLα types per year (over five years) in Navrongo vs 74.2% of DBLα types in the previous site-specific (but not time-specific) analysis. The lack of deep longitudinal sampling of var sequences in the current dataset hinders further analyses of DBLα-var relationships over time, therefore we cannot rule out the possibility that these DBLα-var relationships will change or be affected by frequency-dependent selection (He et al., 2021) or short-term persistence of clones.
Unsurprisingly, the DBLα-var relationship was weak when relationships were explored in relation to var exon 1 sourced from a larger geographical region (i.e., country- or continent-specific var exon 1, see Methods), showcasing the underlying effects of spatial variation that are also seen with other molecular markers such as SNPs (Amambua-Ngwa et al., 2019). This was evident from substantially reduced proportions of DBLα types with 1-to-1 DBLα-var relationships and increased proportions of DBLα types with 1-to-many DBLα-var relationships within these larger spatial contexts (Figure S10 in Data Sheet 1). This is expected given that, in the absence of gene flow (limited migration of people between distant locations and continents) and the prevailing view of typical mosquito dispersals of distances up to 5 to 25km (Costantini et al., 1996; Service, 1997), geographically-isolated parasite populations would undergo different recombination events in their var evolutionary histories and recombinants would have been generated from ‘parents’ or mosaic pieces that exist in a local var gene pool. This is also evidenced from local signatures found in recombinant sequences that are effective in informing geographic population structure (Tonkin-Hill et al., 2021). Thus, in this study, we show that the use of DBLα types to estimate var diversity is limited to the scale of a local site and caution should be applied when discussing the population genetics of DBLα types in relation to var in larger spatial contexts. As malaria control is local, this does not present a problem for the assessment of interventions and interactions with the theory of diversity thresholds (He and Pascual, 2021).
3.3 DBLα-var relationships are driven by DBLα type frequencies in high transmission
When determining DBLα-var relationships, DBLα types observed only once per population were, by default, assigned a 1-to-1 DBLα-var relationship. On the other hand, it is possible for more frequent DBLα types to be assigned to other DBLα-var relationships, the upper limit of these relationships being the frequency of the DBLα type in the studied population. Notably, the population frequencies of DBLα types in all study sites, regardless of transmission intensity, largely consisted of low-frequency DBLα types (Figure 4D) and this is concordant with observations of mostly rare DBLα types in other natural populations (Chen et al., 2011; Day et al., 2017; Ruybal-Pesántez et al., 2017; Ruybal-Pesántez et al., 2022).
Due to this attribute, the majority of DBLα types with 1-to-1 DBLα-var relationships were also DBLα types that have a frequency of one (Figure 6B). In study sites with low malaria transmission, we still observed many highly-frequent DBLα types that were still categorized in highly-specific DBLα-var relationships (e.g., 1-to-1, 1-to-2). In contrast, in study sites with high malaria transmission that also showcased relatively higher diversity levels of DBLα types and var exon 1 sequences, a strong correlation was found between DBLα type frequencies and DBLα-var relationships. Therefore, in high transmission, the more times a DBLα type was observed in the population, the higher the likelihood that the DBLα type was observed in many different var exon 1 in the same population, though notably, in these currently available datasets, the proportion of these high-frequency DBLα types in natural populations was relatively small (average of 1.4% of DBLα type in 1-to-many DBLα-var relationships across the four study sites). This also supports our earlier observation of greater proportions of upsA with 1-to-many DBLα-var relationships (Figure 5B), as DBLα types within the upsA group have been reported to be significantly more likely to be found in higher frequencies in parasite populations (Ruybal-Pesántez et al., 2017). The underlying forces driving this selection to conserve DBLα types through time remain to be explored.
3.4 Alignments of var exon 1 with the same DBLα type suggest findings of alleles and different genes
Different var exon 1 sequences with the same DBLα type can display a range of sequence similarities, estimated from pairwise nucleotide identities from all vs all alignments of var exon 1 sequences within groups that share the same DBLα type (Figure 7A). In low malaria transmission sites (Pursat and Mae Sot), many of these var exon 1 sequences, especially those in 1-to-2 or 1-to-3 DBLα-var relationships, tended to share high sequence similarities (≥99%) with other var exon 1 of the same group (Figure 7A). In contrast, in Navrongo and Chikwawa, while there was a substantial portion of var exon 1 that also share high levels of sequence similarity (≥99%), there was an even greater portion of var exon 1 sequences that are dissimilar, mostly sharing approximately 60 to 80% of nucleotide identity (Figure 7A), and these were observed for sequences classified in both upsA and non-upsA groups (Figure S11 in Data Sheet 1).
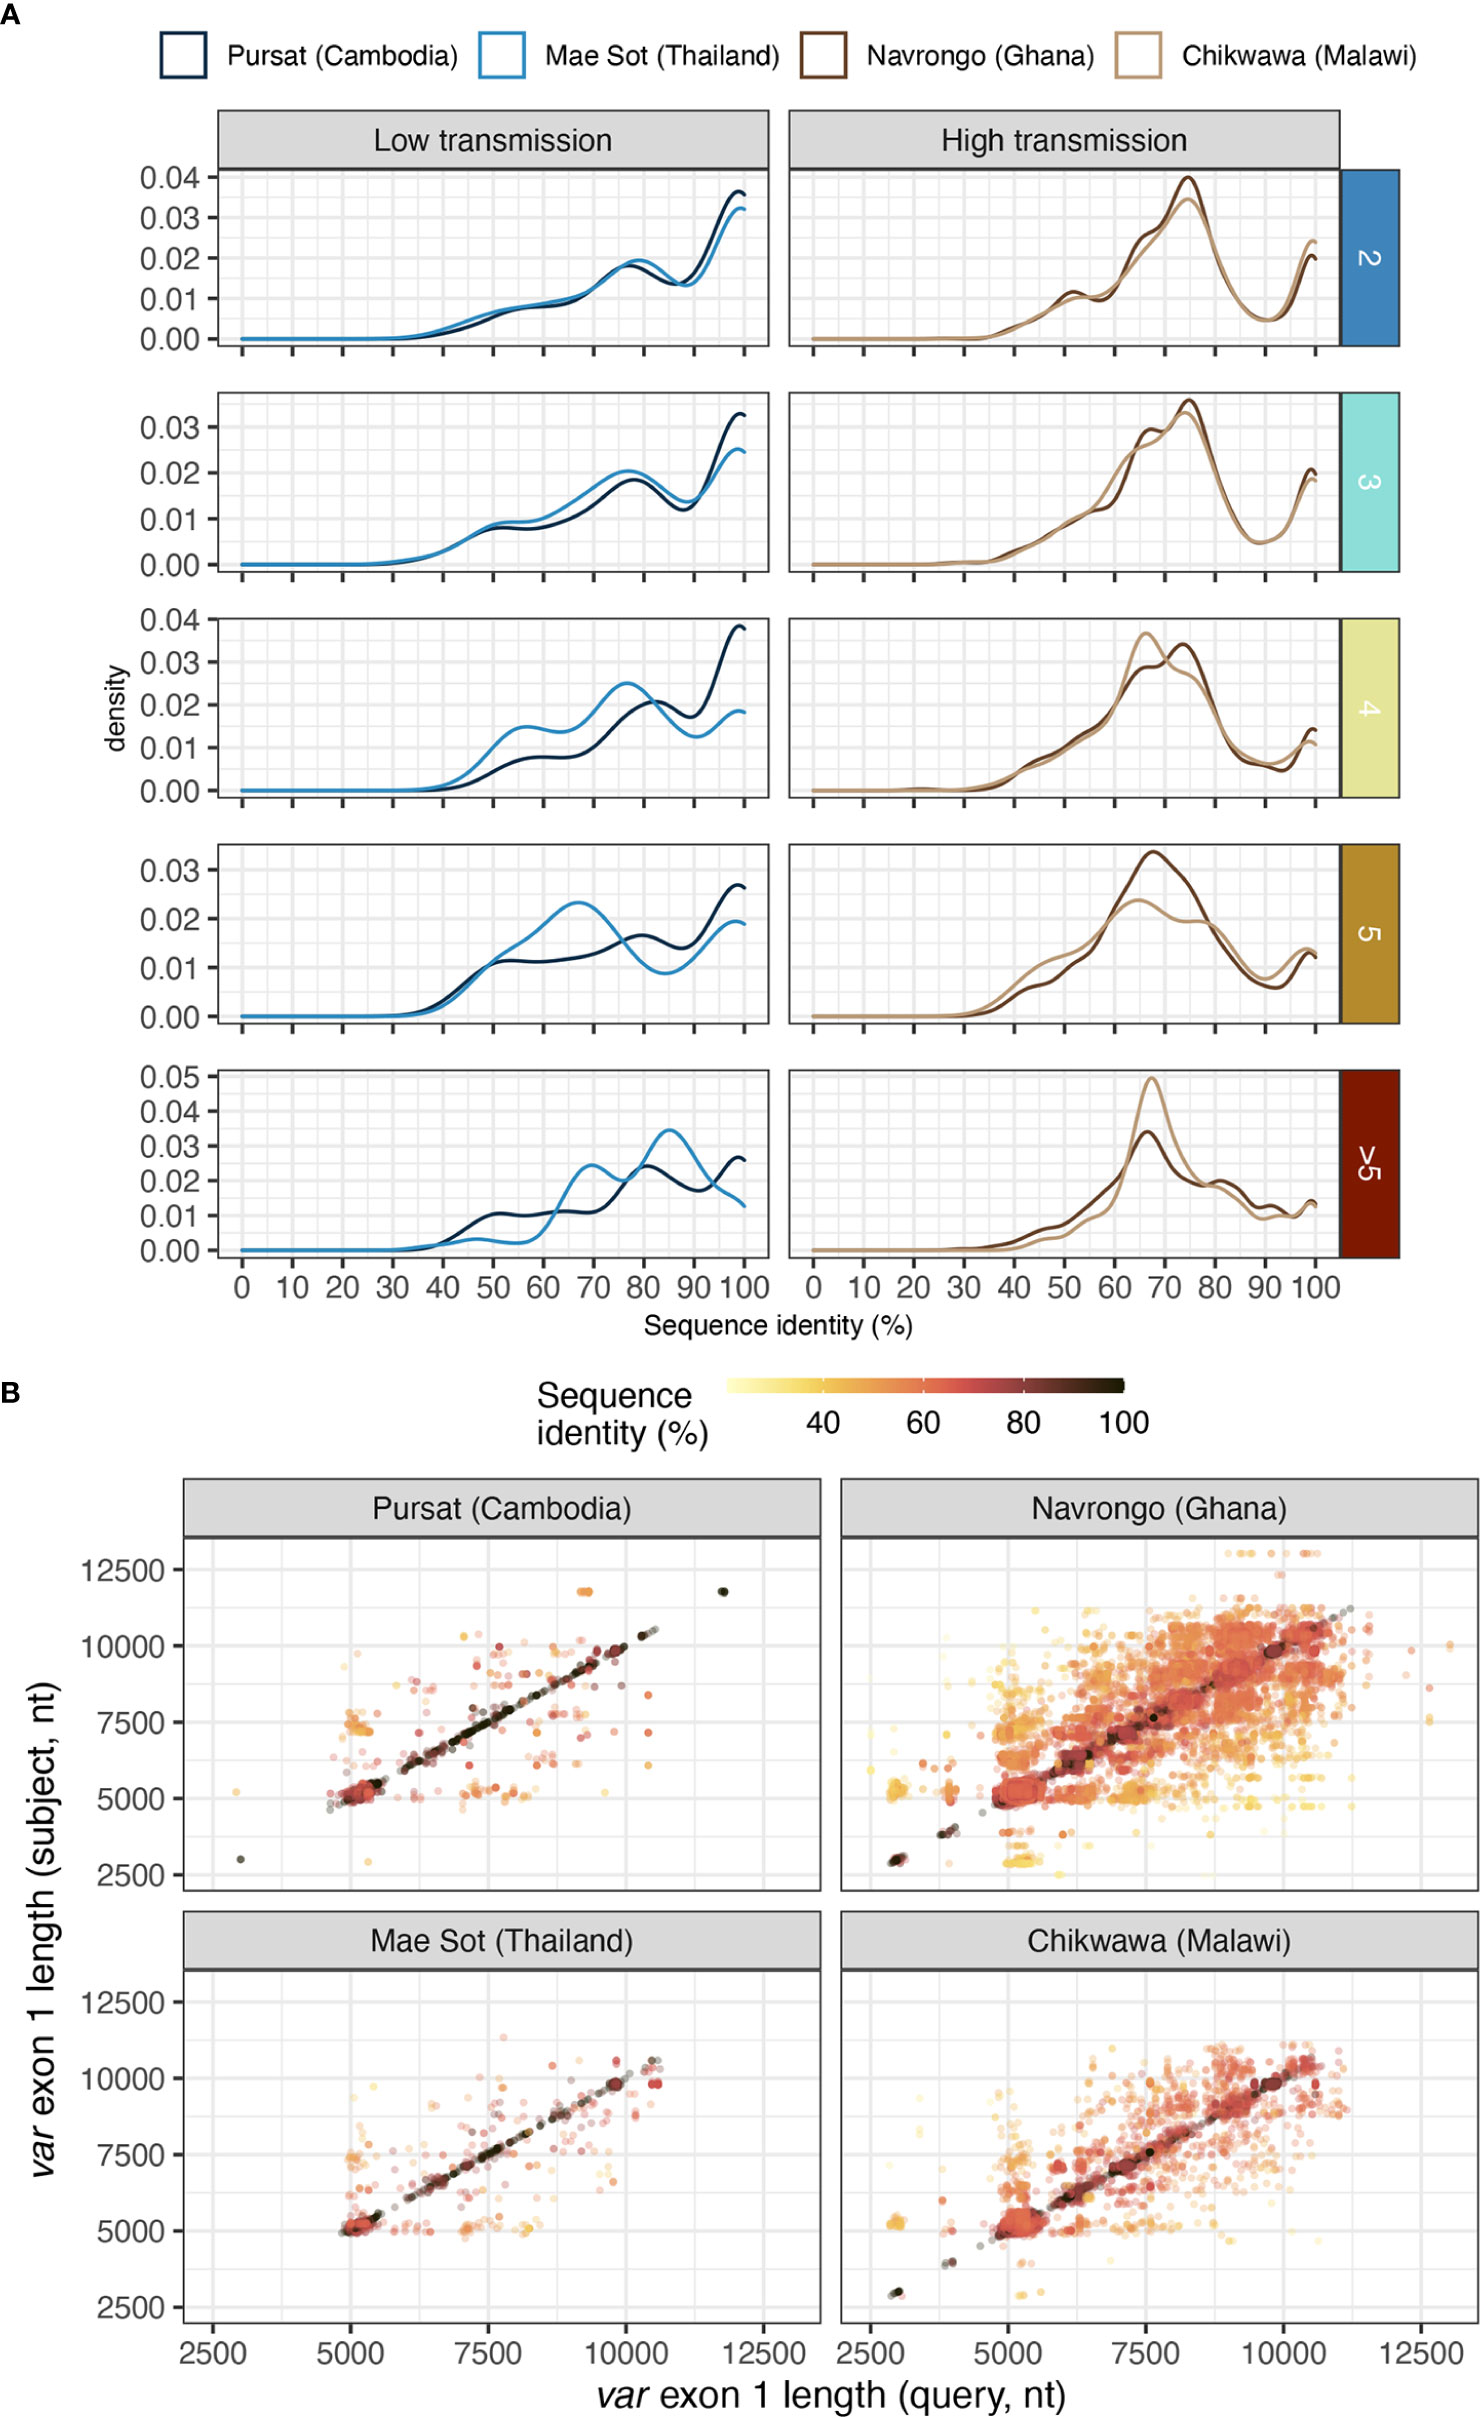
Figure 7 Sequence similarity of pairs of var exon 1 sharing a same DBLα type. (A) Distribution of nucleotide identities of pairs of aligned var exon 1. Horizontal rows represent the different levels of DBLα-var relationships (1-to-2, 1-to-3, …, 1-to-many). (B) Sequence length comparison (on x- and y- axes) for every pairwise aligned var exon 1 sequences that share the same DBLα type, coloured by sequence identity [i.e., nucleotide identity (%)].
Notably, because var sequences were highly variable in length, the aforementioned sequence identity between two aligned var exon 1 sequences was calculated over the length of an alignment (including terminal gaps). Therefore, pairs of aligned var exon 1 sequences with high sequence similarities (e.g., ≥99%) were both highly similar in sequence and length. In contrast, var exon 1 pairs that exhibited low sequence similarity (e.g., <80%) can represent genes that differ in sequence or in length, or both, suggesting that these sequences were likely very different var genes (Figure 7B). Upon detailed examination of several randomly-selected alignments within each range of sequence identities (Figure S12 in Data Sheet 1), alignments of var exon 1 pairs with ≥99% sequence identity showed largely-conserved sequence regions. On the other hand, for alignments with low sequence similarity, conserved regions were observed on the 5’ end of alignments and were truncated, potentially indicative of a putative recombination breakpoint in these var exon 1 sequences.
The evolution of var genes by ectopic recombination makes it difficult to define an allele of any var gene even in a population, especially in populations with high malaria transmission as seen in Ghana and Malawi. In this study, DBLα-var relationships were determined conservatively; i.e., two var genes in a group that share a same DBLα type were considered to be different genes even if there was only a single polymorphism found outside of the DBLα tag region, leading to an inference of a 1-to-2 DBLα-var relationship. If we could properly define var gene alleles, we would expect to observe even higher proportions of DBLα types with highly-specific 1-to-1 DBLα-var relationships, particularly in sites with low malaria transmission.
To check whether var genes that shared the same DBLα type also shared the same or different domain organizations, we further compared the domain organization of var exon 1 sequences in the simplest category of 1-to-2 DBLα-var relationships in three bins of nucleotide identity (i.e., in ranges from low to high identities of 60-80%, 80-99%, and ≥99%) (Data Sheet 4). For alignments reporting relatively higher sequence similarities, an average of 98.4% and 82.8% of alignments within the ≥99% and 80-99% categories, respectively, were observed to be between two var genes with identical domain organizations, majority of which have the common ‘NTS-DBLα-CIDRα-DBLδ-CIDRβ’ domain organization. In contrast, this characteristic was observed for an average of 47.1% of alignments in the 60-80% sequence identity category. For this category, there were a number of alignments between two var genes with different domain compositions and organizations. Most notably, in all study sites, a relatively large proportion of aligned var genes (average 20.5% of alignments) consisted of cases where one of the genes has the ‘NTS-DBLα-CIDRα-DBLδ-CIDRβ’ structure and the other gene has a ‘NTS-DBLα-CIDRα-DBLδ-CIDRγ’ structure; structurally, these var genes differ in only the last CIDRβ/γ domain. Whether these alignment breakpoints between two different domain structures lie intra- and/or inter-domain (and in which domain) is of interest and remains to be explored in future comprehensive analyses.
4 Discussion
Here, we present analysis of population data showing largely 1-to-1 DBLα-var relationships in multiple local sites of varying transmission intensities. This study provides in vivo evidence to question the rates of mitotic recombination reported in vitro (Claessens et al., 2014) as such recombination should lead to a higher frequency of 1-to-many relationships. Alternatively, these recombinants may be created but are selected against. Overall, our findings justify the use of DBLα tags as a reasonable surrogate for var diversity within and between hosts. It also supports the translation of these findings to use DBLα tags for var surveillance.
DBLα-var relationships appear to be largely determined by the frequencies of DBLα types in a local population; i.e., greater proportions of rare DBLα types result in majority of DBLα-var relationships being highly specific. This is especially the case in high malaria transmission settings, which are often characterized by a large proportion of DBLα types occurring at very low frequencies, particularly in the non-upsA group (Ruybal-Pesántez et al., 2017). This observation, coupled with the predominantly non-overlapping structure of DBLα types in high transmission, consequently underpins a specific application that has been proposed (Labbé et al., 2023; Ruybal-Pesántez et al., 2022; Tiedje et al., 2022), which is to measure complexity/multiplicity of infection (MOI) from the number of non-upsA DBLα types identified in an isolate (i.e., infected individual). Based on the assumption that there are approximately 45 unique non-upsA var genes in a parasite genome (Ruybal-Pesántez et al., 2022), the current approach has been to estimate the number of diverse parasite genomes in an isolate by counting the number of sets of 45 unique non-upsA DBLα types. The finding of predominantly 1-to-1 relationships for non-upsA DBLα types in high transmission strengthens the strategic assumption that counts of unique non-upsA DBLα types are representative of actual counts of unique var genes in an isolate. This approach presents an alternative for estimating MOI in highly-multiclonal isolates (i.e., MOI > 5), for which current methods using SNP and microsatellite data are limited (Chang et al., 2017; Gerlovina et al., 2022).
Strong DBLα-var relationships, especially those observed in areas with high malaria transmission, extends our ability to estimate diversity of not only DBLα tags but of var genes. For example, previous work by Tiedje et al. (2022) reported the decline in observed DBLα type diversity in relation to an indoor residual spraying (IRS) intervention over 3 years that reduced transmission intensity by >90% and parasite prevalence by 40-50%. Notably, this is done by counting the number of different DBLα types detected to obtain an estimate of the minimum number of different var genes in a population. The finding of a proportion of DBLα types with non-1-to-1 DBLα-var relationships, however, indicates that using DBLα types to estimate local population size (Barton, 2010) or diversity thresholds (He and Pascual, 2021) of adaptive var genes will present a degree of underestimation. While the currently-available var and DBLα datasets are under-sampled, especially in high-transmission settings, we hypothesize that the pattern of DBLα-var relationships will remain consistent with greater sampling, given the trend of uncovering largely rare DBLα types in non-overlapping repertoires in high malaria transmission (Ruybal-Pesántez et al., 2017) and especially if we can properly define alleles. In the absence of deep site-specific sequencing and assembly of var genes, there is also an avenue for a future method to be developed to better distinguish alleles and to quantify this underestimation, taking into account DBLα-var relationships (e.g., 1-to-1, 1-to-2, 1-to-many) in a natural population, much of which are correlated with DBLα type frequencies.
In addition to estimating var diversity using DBLα, previous studies have shown that DBLα tags contain signatures of geographic variation within the African continent. This allows one to track DBLα types to specific localities, countries and continents when analyzed using a jumping hidden Markov model (Tonkin-Hill et al., 2021) with greater resolution than has been reported for large numbers of SNPs. Therefore, with regard to malaria surveillance, with this application termed ‘varcoding’ (i.e., one single PCR to recover DBLα tags in an isolate), we can obtain information about geographic origin of parasites, MOI as well as estimate var gene diversity. This var coding methodology using DBLα tag sequences is akin to microhaplotyping (LaVerriere et al., 2022; Tessema et al., 2022) and is potentially more informative, especially in high transmission.
Even with recent advancements in genomics methods and technologies, there remains a dearth of available genomic resources for var genes. The exception has been the impressive efforts of Otto et al. (2019), upon whose work we have based this analysis. Understandably, the var system is so diverse and complex that obtaining large comprehensive collections of var genomic sequences will, for now, continue to be costly and will require a global collaborative effort. To this end, the justified ability to now use DBLα tags in genomic surveillance of var diversity and MOI estimation is highly valuable, especially in high-transmission settings, where malaria continues to pose a major threat to public health.
Data availability statement
Publicly available datasets were analyzed in this study. The names of the repository/repositories and accession number(s) can be found in the article/Supplementary Material.
Author contributions
KPD conceptualized the research idea and project. MT and KPD designed the research and direction of analyses. MT performed formal analysis of the data and wrote the initial draft of the manuscript. KPD, YC, and HS critically reviewed and edited the manuscript. All authors read and approved the final version of the manuscript.
Funding
Funding was provided by the National Institute of Allergy and Infectious Diseases, National Institutes of Health through the joint NIH-NSF-NIFA Ecology and Evolution of Infectious Disease award R01-AI149779 to KPD. Salary support for MT was provided by R01-AI149779.
Acknowledgments
This publication uses data from the MalariaGEN Plasmodium falciparum Community Project as described in ‘An open dataset of Plasmodium falciparum genome variation in 7,000 worldwide samples. MalariaGEN et al, Wellcome Open Research 2021642 DOI: 10.12688/wellcomeopenres.16168.1. This research was supported by The University of Melbourne’s Research Computing Services and the Petascale Campus Initiative. We thank Dr. Tiedje and Dr. Duffy for helpful comments with the manuscript.
Conflict of interest
The authors declare that the research was conducted in the absence of any commercial or financial relationships that could be construed as a potential conflict of interest.
Publisher’s note
All claims expressed in this article are solely those of the authors and do not necessarily represent those of their affiliated organizations, or those of the publisher, the editors and the reviewers. Any product that may be evaluated in this article, or claim that may be made by its manufacturer, is not guaranteed or endorsed by the publisher.
Supplementary material
The Supplementary Material for this article can be found online at: https://www.frontiersin.org/articles/10.3389/fpara.2022.1006341/full#supplementary-material
References
Albrecht L., Castiñeiras C., Carvalho B. O., Ladeia-Andrade S., Santos da Silva N., Hoffmann E. H. E., et al. (2010). The south American Plasmodium falciparum var gene repertoire is limited, highly shared and possibly lacks several antigenic types. Gene 453 (1), 37–44.
Albrecht L., Merino E. F., Hoffmann E. H. E., Ferreira M. U., de Mattos Ferreira R. G., Osakabe A. L., et al. (2006). Extense variant gene family repertoire overlap in Western Amazon Plasmodium falciparum isolates. Mol. Biochem. Parasitol. 150 (2), 157–165.
Amambua-Ngwa A., Amenga-Etego L., Kamau E., Amato R., Ghansah A., Golassa L., et al. (2019). Major subpopulations of Plasmodium falciparum in sub-Saharan Africa. Science (80-) 365 (6455), 813–816. doi: 10.1126/science.aav5427
Barry A. E., Leliwa-Sytek A., Tavul L., Imrie H., Migot-Nabias F., Brown S. M., et al. (2007). Population genomics of the immune evasion (var) genes of Plasmodium falciparum. PloS Pathog. 3 (3), e34. doi: 10.1371/journal.ppat.0030034
Barry A. E., Trieu A., Fowkes F. J. I., Pablo J., Kalantari-Dehaghi M., Jasinskas A., et al. (2011). The stability and complexity of antibody responses to the major surface antigen of Plasmodium falciparum are associated with age in a malaria endemic area. Mol. Cell Proteomics 10 (11). doi: 10.1074/mcp.M111.008326
Barton N. (2010). Understanding adaptation in Large populations. PloS Genet. 6 (6), e1000987. doi: 10.1371/journal.pgen.1000987
Baruch D. I. (1999). Adhesive receptors on malaria-parasitized red cells. Best Pract. Res. Clin. Haematol. 12 (4), 747–761. doi: 10.1053/beha.1999.0051
Bengtsson A., Joergensen L., Rask T. S., Olsen R. W., Andersen M. A., Turner L., et al. (2013). A novel domain cassette identifies Plasmodium falciparum PfEMP1 proteins binding ICAM-1 and is a target of cross-reactive, adhesion-inhibitory antibodies. J. Immunol. 190 (1), 240. doi: 10.4049/jimmunol.1202578
Bernabeu M., Danziger S. A., Avril M., Vaz M., Babar P. H., Brazier A. J., et al. (2016). Severe adult malaria is associated with specific PfEMP1 adhesion types and high parasite biomass. Proc. Natl. Acad. Sci. 113 (23), E3270. doi: 10.1073/pnas.1524294113
Bopp S. E. R., Manary M. J., Bright A. T., Johnston G. L., Dharia N. V., Luna F. L., et al. (2013). Mitotic evolution of Plasmodium falciparum shows a stable core genome but recombination in antigen families. PloS Genet. 9 (2), e1003293. doi: 10.1371/journal.pgen.1003293
Brudno M., Malde S., Poliakov A., Do C. B., Couronne O., Dubchak I., et al. (2003). Glocal alignment: finding rearrangements during alignment. Bioinformatics 19 (suppl_1), i54–i62. doi: 10.1093/bioinformatics/btg1005
Calhoun S. F., Reed J., Noah A., Mason C. E., Deitsch K. W., Kirkman L. A., et al. (2017). Chromosome end repair and genome stability in Plasmodium falciparum. MBio 8 (4), e00547–e00517. doi: 10.1128/mBio.00547-17
Chang H.-H., Worby C. J., Yeka A., Nankabirwa J., Kamya M. R., Staedke S. G., et al. (2017). THE REAL McCOIL: A method for the concurrent estimation of the complexity of infection and SNP allele frequency for malaria parasites. PloS Comput. Biol. 13 (1), e1005348. doi: 10.1371/journal.pcbi.1005348
Chen D. S., Barry A. E., Leliwa-Sytek A., Smith T.-A., Peterson I., Brown S. M., et al. (2011). A molecular epidemiological study of var gene diversity to characterize the reservoir of Plasmodium falciparum in humans in Africa. PloS One 6 (2), e16629. doi: 10.1371/journal.pone.0016629
Chen Q., Schlichtherle M., Wahlgren M. (2000). Molecular aspects of severe malaria. Clin. Microbiol. Rev. 13 (3), 439–450. doi: 10.1128/CMR.13.3.439
Claessens A., Hamilton W. L., Kekre M., Otto T. D., Faizullabhoy A., Rayner J. C., et al. (2014). Generation of antigenic diversity in Plasmodium falciparum by structured rearrangement of var genes during mitosis. PloS Genet. 10 (12), e1004812. doi: 10.1371/journal.pgen.1004812
Consortium P. (2016) The Pf3K project: pilot data release 5. Available at: http://www.malariagen.net/data/pf3k-5.
Costantini C., Li S., Della T. A., Sagnon N., Coluzzi M., Taylor C. E. (1996). Density, survival and dispersal of Anopheles gambiae complex mosquitoes in a West African Sudan savanna village. Med. Vet. Entomol. 10 (3), 203–219. doi: 10.1111/j.1365-2915.1996.tb00733.x
Dara A., Drábek E. F., Travassos M. A., Moser K. A., Delcher A. L., Su Q., et al. (2017). New var reconstruction algorithm exposes high var sequence diversity in a single geographic location in Mali. Genome Med. 9 (1), 30. doi: 10.1186/s13073-017-0422-4
Day K. P., Artzy-Randrup Y., Tiedje K. E., Rougeron V., Chen D. S., Rask T. S., et al. (2017). Evidence of strain structure in Plasmodium falciparum var gene repertoires in children from Gabon, West Africa. Proc. Natl. Acad. Sci. 114 (20), E4103–E4111. doi: 10.1073/pnas.1613018114
Duffy M. F., Byrne T. J., Carret C., Ivens A., Brown G. V. (2009). Ectopic recombination of a malaria var gene during mitosis associated with an altered var switch rate. J. Mol. Biol. 389 (3), 453–469. doi: 10.1016/j.jmb.2009.04.032
Eddy S. R. (2011). Accelerated profile HMM searches. PloS Comput. Biol. 7 (10), e1002195. doi: 10.1371/journal.pcbi.1002195
Feng Q., Tiedje K. E., Ruybal-Pesántez S., Tonkin-Hill G., Duffy M. F., Day K. P., et al. (2022). An accurate method for identifying recent recombinants from unaligned sequences. Bioinformatics 38 (7), 1823–1829. doi: 10.1093/bioinformatics/btac012
Frazer K. A., Pachter L., Poliakov A., Rubin E. M., Dubchak I. (2004). VISTA: computational tools for comparative genomics. Nucleic Acids Res. 32 (suppl_2), W273–W279. doi: 10.1093/nar/gkh458
Freitas-Junior L. H., Bottius E., Pirrit L. A., Deitsch K. W., Scheidig C., Guinet F., et al. (2000). Frequent ectopic recombination of virulence factor genes in telomeric chromosome clusters of P. falciparum. Nature 407 (6807), 1018–1022. doi: 10.1038/35039531
Gardner M. J., Hall N., Fung E., White O., Berriman M., Hyman R. W., et al. (2002). Genome sequence of the human malaria parasite Plasmodium falciparum. Nature 419 (6906), 498–511. doi: 10.1038/nature01097
Gerlovina I., Gerlovin B., Rodríguez-Barraquer I., Greenhouse B. (2022). Dcifer: an IBD-based method to calculate genetic distance between polyclonal infections. Genetics, 222 (2), iyac126. doi: 10.1093/genetics/iyac126
He Q., Pascual M. (2021). An antigenic diversification threshold for falciparum malaria transmission at high endemicity. PloS Comput. Biol. 17 (2), e1008729. doi: 10.1371/journal.pcbi.1008729
He Q., Pilosof S., Tiedje K. E., Day K. P., Pascual M. (2021). Frequency-dependent competition between strains imparts persistence to perturbations in a model of Plasmodium falciparum malaria transmission. Front. Ecol. Evol. 9. doi: 10.3389/fevo.2021.633263
Kraemer S. M., Kyes S. A., Aggarwal G., Springer A. L., Nelson S. O., Christodoulou Z., et al. (2007). Patterns of gene recombination shape var gene repertoires in Plasmodium falciparum: comparisons of geographically diverse isolates. BMC Genomics 8 (1), 45. doi: 10.1186/1471-2164-8-45
Kraemer S. M., Smith J. D. (2006). A family affair: var genes, PfEMP1 binding, and malaria disease. Curr. Opin. Microbiol. 9 (4), 374–380. doi: 10.1016/j.mib.2006.06.006
Labbé F., He Q., Zhan Q., Tiedje K. E., Argyropoulos D. C., Tan M. H., et al. (2023). Neutral vs. non-neutral genetic footprints of Plasmodium falciparum multiclonal infections. PLOS Comput. Biol. [Internet] 19 (1), e1010816. doi: 10.1371/journal.pcbi.1010816
LaVerriere E., Schwabl P., Carrasquilla M., Taylor A. R., Johnson Z. M., Shieh M., et al. (2022). Design and implementation of multiplexed amplicon sequencing panels to serve genomic epidemiology of infectious disease: A malaria case study. Mol. Ecol. Resour. 22 (6), 2285–2303. doi: 10.1111/1755-0998.13622
Lavstsen T., Salanti A., Jensen A. T. R., Arnot D. E., Theander T. G. (2003). Sub-grouping of Plasmodium falciparum 3D7 var genes based on sequence analysis of coding and non-coding regions. Malaria J. 2 (1), 27. doi: 10.1186/1475-2875-2-27
Lennartz F., Adams Y., Bengtsson A., Olsen R. W., Turner L., Ndam N. T., et al. (2017). Structure-guided identification of a family of dual receptor-binding PfEMP1 that is associated with cerebral malaria. Cell Host Microbe [Internet]. 21 (3), 403–414. doi: 10.1016/j.chom.2017.02.009
Mackenzie G., Jensen R. W., Lavstsen T., Otto T. D. (2022). varia: a tool for prediction, analysis and visualisation of variable genes. BMC Bioinf. [Internet]. 23 (1), 52. doi: 10.1186/s12859-022-04573-6
Magallón-Tejada A., Machevo S., Cisteró P., Lavstsen T., Aide P., Rubio M., et al. (2016). Cytoadhesion to gC1qR through Plasmodium falciparum erythrocyte membrane protein 1 in severe malaria. PloS Pathog. 12 (11), e1006011. doi: 10.1371/journal.ppat.1006011
MalariaGen, Ahouidi A., Ali M., Almagro-Garcia J., Amambua-Ngwa A., Amaratunga C., et al. (2021). An open dataset of Plasmodium falciparum genome variation in 7,000 worldwide samples [version 2; peer review: 2 approved]. Wellcome. Open Res. 6, 42. doi: 10.12688/wellcomeopenres.16168.1
Newbold C., Craig A., Kyes S., Rowe A., Fernandez-Reyes D., Fagan T. (1999). Cytoadherence, pathogenesis and the infected red cell surface in Plasmodium falciparum. Int. J. Parasitol. 29 (6), 927–937. doi: 10.1016/S0020-7519(99)00049-1
Nicholson K. G., Wood J. M., Zambon M. (2003). Influenza. Lancet 362 (9397), 1733–1745. doi: 10.1016/S0140-6736(03)14854-4
Oksanen J., Blanchet F. G., Kindt R., Legendre P., Minchin P. R., O’hara R. B., et al. (2022). vegan: Community Ecology Package. R package version 2.6-4. Available online at: https://CRAN.R-project.org/package=vegan.
Otto T. D., Assefa S. A., Böhme U., Sanders M. J., Kwiatkowski D. P., Null N., et al. (2019). Evolutionary analysis of the most polymorphic gene family in falciparum malaria [version 1; peer review: 1 approved, 2 approved with reservations]. Wellcome. Open Res. 4 (193). doi: 10.12688/wellcomeopenres.15590.1
Otto T. D., Böhme U., Sanders M. J., Reid A. J., Bruske E. I., Duffy C. W., et al. (2018). Long read assemblies of geographically dispersed Plasmodium falciparum isolates reveal highly structured subtelomeres [version 1; peer review: 3 approved]. Wellcome. Open Res. 3 (52). doi: 10.12688/wellcomeopenres.14571.1
Pilosof S., He Q., Tiedje K. E., Ruybal-Pesántez S., Day K. P., Pascual M. (2019). Competition for hosts modulates vast antigenic diversity to generate persistent strain structure in Plasmodium falciparum. PloS Biol. 17 (6), e3000336. doi: 10.1371/journal.pbio.3000336
Rask T. S., Hansen D. A., Theander T. G., Gorm Pedersen A., Lavstsen T. (2010). Plasmodium falciparum erythrocyte membrane protein 1 diversity in seven genomes – divide and conquer. PloS Comput. Biol. 6 (9), e1000933. doi: 10.1371/journal.pcbi.1000933
Rognes T., Flouri T., Nichols B., Quince C., Mahé F. (2016). VSEARCH: a versatile open source tool for metagenomics. PeerJ 4, e2584. doi: 10.7717/peerj.2584
Rougeron V., Tiedje K. E., Chen D. S., Rask T. S., Gamboa D., Maestre A., et al. (2017). Evolutionary structure of Plasmodium falciparum major variant surface antigen genes in south America: Implications for epidemic transmission and surveillance. Ecol. Evol. 7 (22), 9376–9390. doi: 10.1002/ece3.3425
Ruybal-Pesántez S., Tiedje K. E., Pilosof S., Tonkin-Hill G., He Q., Rask T. S., et al. (2022). Age-specific patterns of DBLα var diversity can explain why residents of high malaria transmission areas remain susceptible to Plasmodium falciparum blood stage infection throughout life. Int. J. Parasitol 52 (11), 721–731. doi: 10.1016/j.ijpara.2021.12.001
Ruybal-Pesántez S., Tiedje K. E., Tonkin-Hill G., Rask T. S., Kamya M. R., Greenhouse B., et al. (2017). Population genomics of virulence genes of Plasmodium falciparum in clinical isolates from Uganda. Sci. Rep. 7 (1), 11810. doi: 10.1038/s41598-017-11814-9
Service M. W. (1997). Mosquito (Diptera: Culicidae) dispersal–the long and short of it. J. Med. Entomol. 34 (6), 579–588. doi: 10.1093/jmedent/34.6.579
Smith J. D., Chitnis C. E., Craig A. G., Roberts D. J., Hudson-Taylor D. E., Peterson D. S., et al. (1995). Switches in expression of Plasmodium falciparumvar genes correlate with changes in antigenic and cytoadherent phenotypes of infected erythrocytes. Cell 82 (1), 101–110. doi: 10.1016/0092-8674(95)90056-X
Smith J. D., Subramanian G., Gamain B., Baruch D. I., Miller L. H. (2000). Classification of adhesive domains in the Plasmodium falciparum erythrocyte membrane protein 1 family. Mol. Biochem. Parasitol. 110 (2), 293–310. doi: 10.1016/S0166-6851(00)00279-6
South A. (2017). naturalearth: World Map Data from Natural Earth” R Package Version 0.1.0. Available online at: https://cran.r-project.org/web/packages/rnaturalearth/rnaturalearth.pdf.
Su X., Heatwole V. M., Wertheimer S. P., Guinet F., Herrfeldt J. A., Peterson D. S., et al. (1995). The large diverse gene family var encodes proteins involved in cytoadherence and antigenic variation of Plasmodium falciparum-infected erythrocytes. Cell 82 (1), 89–100. doi: 10.1016/0092-8674(95)90055-1
Taylor H. M., Kyes S. A., Harris D., Kriek N., Newbold C. I. (2000). A study of var gene transcription in vitro using universal var gene primers. Mol. Biochem. Parasitol. 105 (1), 13–23. doi: 10.1016/S0166-6851(99)00159-0
Tessema S. K., Hathaway N. J., Teyssier N. B., Murphy M., Chen A., Aydemir O., et al. (2022). Sensitive, highly multiplexed sequencing of microhaplotypes from the Plasmodium falciparum heterozygome. J. Infect. Dis. 225 (7), 1227–1237. doi: 10.1093/infdis/jiaa527
Tessema S. K., Monk S. L., Schultz M. B., Tavul L., Reeder J. C., Siba P. M., et al. (2015). Phylogeography of var gene repertoires reveals fine-scale geospatial clustering of Plasmodium falciparum populations in a highly endemic area. Mol. Ecol. 24 (2), 484–497. doi: 10.1111/mec.13033
Tessema S. K., Nakajima R., Jasinskas A., Monk S. L., Lekieffre L., Lin E., et al. (2019). Protective immunity against severe malaria in children is associated with a limited repertoire of antibodies to conserved PfEMP1 variants. Cell Host Microbe 26 (5), 579–590.e5. doi: 10.1016/j.chom.2019.10.012
Tiedje K. E., Oduro A. R., Agongo G., Anyorigiya T., Azongo D., Awine T., et al. (2017). Seasonal variation in the epidemiology of asymptomatic Plasmodium falciparum infections across two catchment areas in bongo district, Ghana. Am. Soc. Trop. Med. Hyg. 97 (1), 199–212. doi: 10.4269/ajtmh.16-0959
Tiedje K. E., Oduro A. R., Bangre O., Amenga-Etego L., Dadzie S. K., Appawu M. A., et al. (2022). Indoor residual spraying with a non-pyrethroid insecticide reduces the reservoir of Plasmodium falciparum in a high-transmission area in northern Ghana. PloS Glob. Public Heal. 2 (5), e0000285. doi: 10.1371/journal.pgph.0000285
Tonkin-Hill G., Ruybal-Pesántez S., Tiedje K. E., Rougeron V., Duffy M. F., Zakeri S., et al. (2021). Evolutionary analyses of the major variant surface antigen-encoding genes reveal population structure of Plasmodium falciparum within and between continents. PloS Genet. 17 (2), e1009269. doi: 10.1371/journal.pgen.1009269
Tonkin-Hill G. Q., Trianty L., Noviyanti R., Nguyen H. H. T., Sebayang B. F., Lampah D. A., et al. (2018). The Plasmodium falciparum transcriptome in severe malaria reveals altered expression of genes involved in important processes including surface antigen–encoding var genes. PloS Biol. 16 (3), e2004328. doi: 10.1371/journal.pbio.2004328
Turner L., Lavstsen T., Berger S. S., Wang C. W., Petersen J. E. V., Avril M., et al. (2013). Severe malaria is associated with parasite binding to endothelial protein c receptor. Nature 498 (7455), 502–505. doi: 10.1038/nature12216
Wang C. W., Lavstsen T., Bengtsson D. C., Magistrado P. A., Berger S. S., Marquard A. M., et al. (2012). Evidence for in vitro and in vivo expression of the conserved var3 (type 3) Plasmodium falciparum erythrocyte membrane protein 1. Malar. J. 11 (1), 129. doi: 10.1186/1475-2875-11-129
Wang H., Miller J. A., Verghese M., Sibai M., Solis D., Mfuh K. O., et al. (2021). Multiplex SARS-CoV-2 genotyping reverse transcriptase PCR for population-level variant screening and epidemiologic surveillance. J. Clin. Microbiol. 59 (8), e00859–e00821. doi: 10.1128/JCM.00859-21
World Health Organization FluNet: Global influenza programme. Available at: https://www.who.int/tools/flunet.
World Health Organization Tracking SARS-CoV-2 variants. Available at: https://www.who.int/en/activities/tracking-SARS-CoV-2-variants/.
Yalcindag E., Elguero E., Arnathau C., Durand P., Akiana J., Anderson T. J., et al. (2012). Multiple independent introductions of Plasmodium falciparum in south America. Proc. Natl. Acad. Sci. 109 (2), 511–516. doi: 10.1073/pnas.1119058109
Keywords: antigenic variation, DBLα tag, recombination, Africa, Asia, ups, PfEMP1
Citation: Tan MH, Shim H, Chan Y-b and Day KP (2023) Unravelling var complexity: Relationship between DBLα types and var genes in Plasmodium falciparum. Front. Parasitol. 1:1006341. doi: 10.3389/fpara.2022.1006341
Received: 29 July 2022; Accepted: 02 December 2022;
Published: 09 January 2023.
Edited by:
Wang Nguitragool, Mahidol University, ThailandReviewed by:
Ben J. Mans, Agricultural Research Council, South AfricaOlivo Miotto, University of Oxford, United Kingdom
Copyright © 2023 Tan, Shim, Chan and Day. This is an open-access article distributed under the terms of the Creative Commons Attribution License (CC BY). The use, distribution or reproduction in other forums is permitted, provided the original author(s) and the copyright owner(s) are credited and that the original publication in this journal is cited, in accordance with accepted academic practice. No use, distribution or reproduction is permitted which does not comply with these terms.
*Correspondence: Karen P. Day, karen.day@unimelb.edu.au