 Yu Zhang1,2†
 Xiaofei Yue1,2†
 Peng Zhang3Yuying Zhang4
 Linxia Wu1,2Nan Diao1,2
 Guina Ma1,2Yuting Lu1,2
 Ling Ma5
 Kaixiong Tao3
 Qian Li1,2*Ping Han1,2*
- 1Department of Radiology, Union Hospital, Tongji Medical College, Huazhong University of Science and Technology, Wuhan, China
- 2Hubei Province Key Laboratory of Molecular Imaging, Wuhan, China
- 3Department of Gastrointestinal Surgery, Union Hospital, Tongji Medical College, Huazhong University of Science and Technology, Wuhan, China
- 4Department of Radiology, The First Affiliated Hospital of Guangxi Medical University, Nanning, China
- 5He Kang Corporate Management (SH) Co. Ltd., Shanghai, China
Objective: gastrointestinal stromal tumors (GISTs) with KIT exon 11 deletions have more malignant clinical outcomes. A radiomics model was constructed for the preoperative prediction of KIT exon 11 deletion in GISTs.
Methods: Overall, 126 patients with GISTs who underwent preoperative enhanced CT were included. GISTs were manually segmented using ITK-SNAP in the arterial phase (AP) and portal venous phase (PVP) images of enhanced CT. Features were extracted using Anaconda (version 4.2.0) with PyRadiomics. Radiomics models were constructed by LASSO. The clinical-radiomics model (combined model) was constructed by combining the clinical model with the best diagnostic effective radiomics model. ROC curves were used to compare the diagnostic effectiveness of radiomics model, clinical model, and combined model. Diagnostic effectiveness among radiomics model, clinical model and combine model were analyzed in external cohort (n=57). Statistics were carried out using R 3.6.1.
Results: The Radscore showed favorable diagnostic efficacy. Among all radiomics models, the AP-PVP radiomics model exhibited excellent performance in the training cohort, with an AUC of 0.787 (95% CI: 0.687-0.866), which was verified in the test cohort (AUC=0.775, 95% CI: 0.608-0.895). Clinical features were also analyzed. Among the radiomics, clinical and combined models, the combined model showed favorable diagnostic efficacy in the training (AUC=0.863) and test cohorts (AUC=0.851). The combined model yielded the largest AUC of 0.829 (95% CI, 0.621–0.950) for the external validation of the combined model. GIST patients could be divided into high or low risk subgroups of recurrence and mortality by the Radscore.
Conclusion: The radiomics models based on enhanced CT for predicting KIT exon 11 deletion mutations have good diagnostic performance.
1 Introduction
Gastrointestinal stromal tumor (GISTs) is the primary stromal tumor of the gastrointestinal tract (1). Most GISTs were found to contain mutations that constitutively activate the proto-oncogene receptor tyrosine kinase (RTK) KIT (2). Because activating alterations in KIT impair the natural autoinhibitory status of RTKs (3), leading to aberrant RTK, GISTs have become a model for successful molecular targeted treatment (4). Several small molecular compounds that target the KIT protein, such as imatinib (5), sunitinib (6), and regorafenib (7), are effective in treating advanced GISTs and have been approved for the treatment of advanced GISTs. All KIT inhibitors are widely used for patients with advanced GISTs and significantly improve the survival of patients (8, 9). Therefore, it is crucial to make an accurate diagnosis of GISTs so that optimal treatment can be used for patients with GISTs.
As the response to treatment varies substantially depending on the location of the mutation in GIST patients, the gene mutations status of the tumor is extremely important (10). GISTs with KIT exon 11 deletions have more malignant clinical outcomes (11, 12), and these deletions have a negative prognostic impact on recurrence-free survival (13–15). Predicting the progression of GIST is a vital aspect of providing good counseling and treatment to patients. Particularly, accurate prognostication is essential for identifying tumors with significant risk that need appropriate adjuvant systemic treatment. Recent research (16) on patients who had surgery for a localized GIST indicated that the chance of recurrence was exaggerated more than 30% of the time. In contrast to patients who benefited from a correct estimate of recurrence risk, these people got insufficient treatment and had a much greater incidence of relapse (17, 18). The presence of a KIT exon 11 deletion might be an additional factor for more precise patient identification for adjuvant treatment.
Samples from preoperative fine-needle aspiration biopsies are used in the traditional method for measuring KIT exon 11 mutation before surgery or any other treatment. However, the KIT exon 11 mutation evaluation depending on invasive biopsy could not accurately reflect all GISTs and has limited use in the preoperative evaluation of GISTs due to the small size and normal gastric mucosa covering of samples (19). In addition, biopsies of gastric GISTs may cause tumor rupture and dissemination (20) Thus, gastric GISTs are often evaluated by radiology (21, 22).
Radiomics is a non-invasive method for predicting the status of gene by radiomics, particularly for tumor heterogeneity (23). Previous research has demonstrated that radiomics has a high degree of precision in evaluating the entire biological activity of GISTs, particularly their potential for malignancy (24–26) and recurrence (27). In this research, a clinical-radiomics nomogram that intuitively describes the relationship between the variables in the prediction model was established and validated to predict the KIT exon 11 mutation status of GIST patients.
2 Materials and methods
2.1 Participants
A total of 126 patients (75 Males with mean age 53.8 years) with GISTs from February 2015 to September 2018 were retrospectively enrolled to predict the KIT exon 11 mutation status of GIST patients. The inclusion and exclusion criteria were seen in Table 1. The patient screening process is shown in the study flowchart in Figure 1A. This study is a retrospective study based on data from one of our clinical studies, and ethical approval was obtained by the Ethics Committee of Tongji Medical College of Huazhong University of Science and Technology. Written informed consent was obtained from all patients.
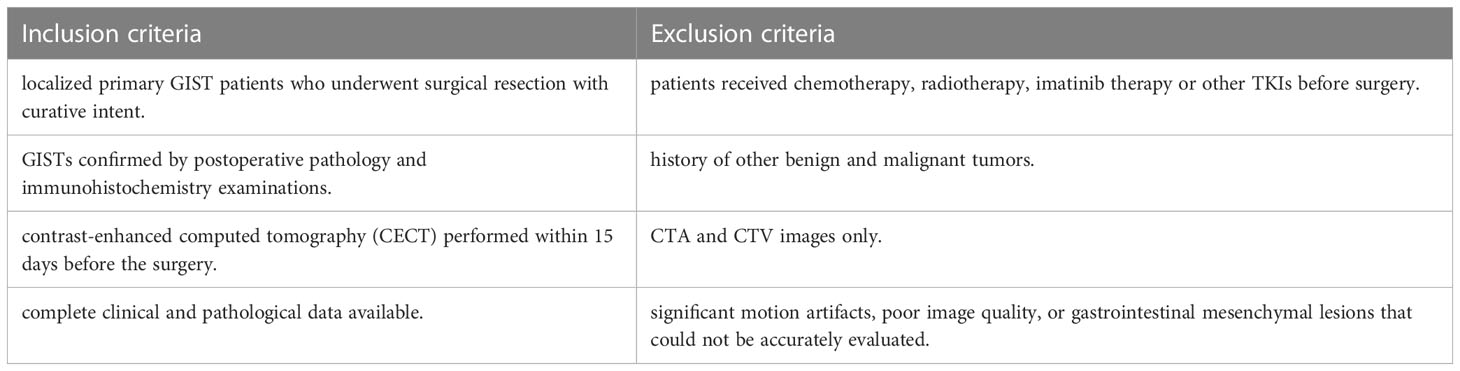
Table 1 Inclusion and exclusion criteria of patients in the training and test cohort.
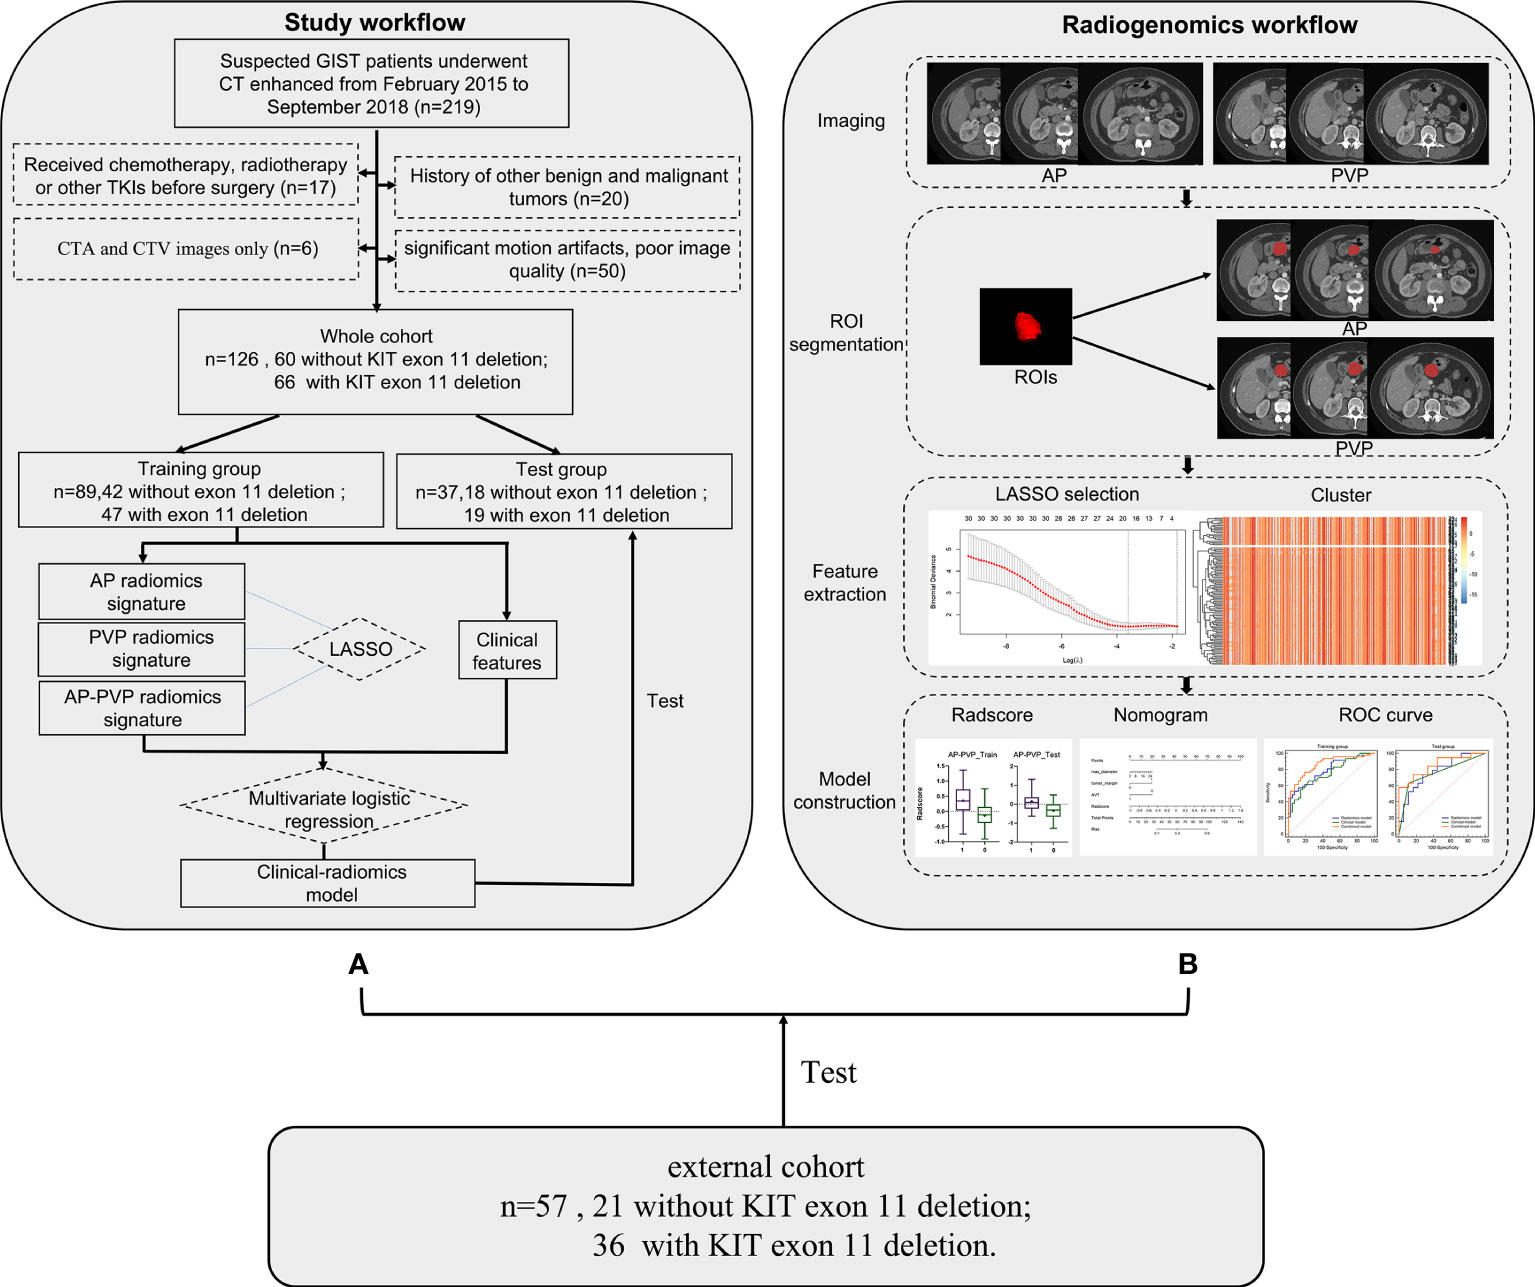
Figure 1 Workflow process for radiomics processing and analysis in this study. (A) Study flowchart. (B) Radiomics workflow. GIST, gastrointestinal stromal tumor; CT, computed tomography; ROI, region of interest; LASSO, least absolute shrinkage and selection operator.
57 patients with GISTs were retrospectively enrolled as an external cohort with the same inclusion criteria. The external cohort patients were enrolled from The First Affiliated Hospital of Guangxi Medical University.
2.2 Image acquisition
All subjects fasted for more than 4 hours before the computed tomography (CT) examination (Scanners: Aquilion ONE, Toshiba Medical Systems, Tokyo, Japan; SOMATOM Definition AS+/Definition, Siemens Healthineers, Erlangen, Germany; Discovery CT750 HD, GE Healthcare, Milwaukee, WI; IQon, Philips Healthcare, Best, the Netherlands). After a non-contrast CT scan with a thickness of 1.25 mm to 2.0 mm was performed, a dynamic contrast-enhanced scan was performed with 90-120 ml of iodine contrast medium (Visipaque, 320 mgI/mL, GE Healthcare Ireland, Shanghai) injected intravenously at a flow rate of 2.0 to 3.0 ml/s. The arterial phase and portal venous phase images were obtained with a delay of 25–30 s and 50–70 s after the injection. The parameters of CT scanning were as follows: tube voltage 100–120 kV; automatic tube current; slice thickness 1.25-2.0 mm; and standard algorithm.
2.3 Genetic testing
All patients were identified by genetic testing for the KIT exon 11 mutation. and the details of genetic testing are provided in Supplementary Text S1.
2.4 Image preprocessing and image quantization
All these images should be pre-processed before radiomics features extracted. All images have been normalized by MATLAB (RRID: SCR_001622). The details of the image preprocessing and image quantization are provided in Supplementary Text S2.
2.5 Region of interest segmentation and feature extraction
The radiomics workflow is shown in Figure 1B. The tumors were selected as the regions of interest (ROIs), which were segmented on arterial phase and venous phase images through the open-source software ITK-SNAP layer by layer (version 3.6.1, www.itksnap.org). The ROIs were delineated manually by 3 radiologists. The segmentations of X.F.Y. with 4 years of diagnostic experience and L.X.W. with 3 years of diagnostic experience were compared for interobserver differences. All images were segmented by another radiologist with 10 years of experience (Y.Z.) who was blinded to the type of GIST, repeated measurements were performed at an interval of 2 weeks, and the segmentations were compared for intraobserver differences. The intraobserver and interobserver differences were assessed by calculating the intraclass correlation coefficient (ICC) and features with consistency values<0.7 were removed. Finally, radiomics features were extracted using the ROI of the first segmentation of the radiologist with 10 years of diagnostic experience. The radiomics features were extracted using Anaconda (version 4.2.0) with the PyRadiomics package (github.com/Radiomics/pyradiomics) according to the feature guidelines of the Image Biomarker Standardization Initiative (IBSI) (28).
2.6 Optimal radiomics signature construction
To improve the diagnostic performance and select the best radiomics model, an optimal radiomics model was constructed in the following two steps: i single-phase radiomics models: arterial phase or portal venous phase; ii combined-phase radiomics models: arterial phase and portal venous phase.
We employed the same strategy of feature selection and model construction above. The datasets were randomly divided into a training cohort and a test cohort with a case number ratio of 7:3. The patients were randomly divided into a training cohort (n = 89) and a test cohort (n = 37). The DeLong test was used to compare the differences of diagnostic performance among three radiomics models.
2.7 Clinical and clinical-radiomics diagnostic model construction
Twenty-one clinical factors and radiographic scores partially referenced from Kim et al. (29) and Cuiping Zhou et al. (30) including sex, age, max diameter, tumor location, growth pattern, ulceration, air density within the mass, surrounding fat space, tumor margin, tumor shape, direct organ invasion, density, calcification, intratumoral hemorrhage, necrosis, enlarged vessels around the tumor, apparent vessels in the tumor (AVT), enhancement pattern, lymphadenopathy, liver metastasis and level of enhancement were evaluated retrospectively by two radiologists independently and blinded to the type of GIST, with disagreements judged by a more senior radiologist. Detailed definitions of the above variables are provided in Supplementary Text S3. Then, clinical and radiographic scores were compared between patients with KIT exon 11 deletions and patients without KIT exon 11 deletions in the training and test cohorts and used to build a clinical model.
The clinical-radiomics model (combined model) was constructed by clinical model and radiomics model.
2.8 Model effectiveness evaluation
The area under the receiver operating characteristic (ROC) curve (AUC) was used to evaluate the diagnostic performance of the models constructed by the training cohort and test cohort, whereby the radiomics score (Radscore) was calculated via the formula built in the training cohort. The accuracy of the radiomics model was evaluated in both the training and test cohorts. The DeLong test was used to compare the diagnostic performance in the clinical model, radiomics model and combined model. The model calibration was assessed using calibration curves and the Hosmer–Lemeshow test. Decision curve analysis (DCA) was performed to estimate the clinical benefits of the models.
2.9 External validation
To ensure high replication of the model, diagnostic performances were evaluated of the radiomics model, clinical model, and combined model in the external cohort.
2.10 Survival risk stratification of GIST patients
The end point of follow-up is the disease-free survival (DFS) and overall survival (OS). DFS time starts from the date of surgery until the date of recurrence is determined. OS refers to the time from the date of surgery to the patient ‘s death or the last follow-up. Survival and recurrence information of patients were obtained through regular follow-up. Kaplan-Meier survival curves were used to assess disease-free survival (DFS) and overall survival (OS), and differences in survival time between groups were compared using the Log rank test. Risk score was calculated for each GIST patient by RadscoreAP-PVP so that to place patients into high or low risk subgroups.
2.11 Statistical analysis
Statistical analysis was mainly performed using R 3.6.1 (www.Rproject.org). Statistical analysis was performed using R 3.6.1 (www.Rproject.org). All the codes used in this research are available on the public website (https://github.com/martin18382076157/Levin-ma). The packages in R used in this study were tidyverse, caret,DMWR, mRMRe, glmnet, pROC, rmda, ggpubr, ModelGood, rms, and DescTOOLs.
The statistical approach in this study mainly involves the construction of radiomics label (Radscore), clinical model (Clinics), combined model (Combine) using Radscore and Clinics, model diagnostic performance evaluation, and external validation. Firstly, patients from our hospital are randomly divided into training and testing groups in a 7:3 ratio based on stratified randomization. Patients from other hospital are used as external validation data. The training group patients are used for radiomics feature dimension reduction, mRMR was used to reduction features redundancy to reduce overfitting. The least absolute shrinkage and selection operator (LASSO) algorithm is used with the minimum penalty coefficient to select the corresponding features for Radscore construction and 10-fold cross-validation was used to external validate the radiomics score.
During the clinical model building, the collinearity among clinical parameters is assessed using the variance inflation factor (VIF), and parameters with VIF< 5 are retained. The differences in demographic and clinical variables between patients with KIT exon 11 deletions and patients without KIT exon 11 deletions are evaluated using chi-square tests or Fisher’s exact tests for categorical data and t-tests (assuming equal variance and normal distribution) or rank-sum tests (if assumptions are not met) for continuous data. Parameters showing statistically significant differences are used to construct the clinical model using multiple logistic regression based the minimum Akaike information criterion (AIC) principle. The combined model, based on the selected clinical variables and the Radscore.
After model construction, model evaluation is performed using ROC analysis, Hosmer-Lemeshow test, and decision curve analysis (DCA).
Among the packages in R, the tidyverse and caret packages were used for data preprocessing and patient grouping, the DMWR package was used for SMOTE data handling, the mRMRe package was used for feature dimension reduction using mRMR analysis, the glmnet package was used for LASSO analysis in Radscore construction, the pROC package was used for ROC analysis, the rmda package was used for DCA analysis, the ggpubr package was used for data visualization, the rms package was used for nomogram plotting, the ModelGood package was used for model diagnostic performance evaluation.
3 Results
3.1 Characteristics and clinical features of the patients
Among the 126 GIST patients, 66 patients with KIT exon 11 deletions and 60 patients without deletions. The demographic and clinical variables of the patients in the training and test cohorts are summarized in Table 2. All the demographic data, including sex, age, and various clinical features, did not show significant differences between the training cohort and test cohort (P > 0.05) (Table 3).

Table 2 Demographic and clinical characteristics of patients in the training and test cohort.
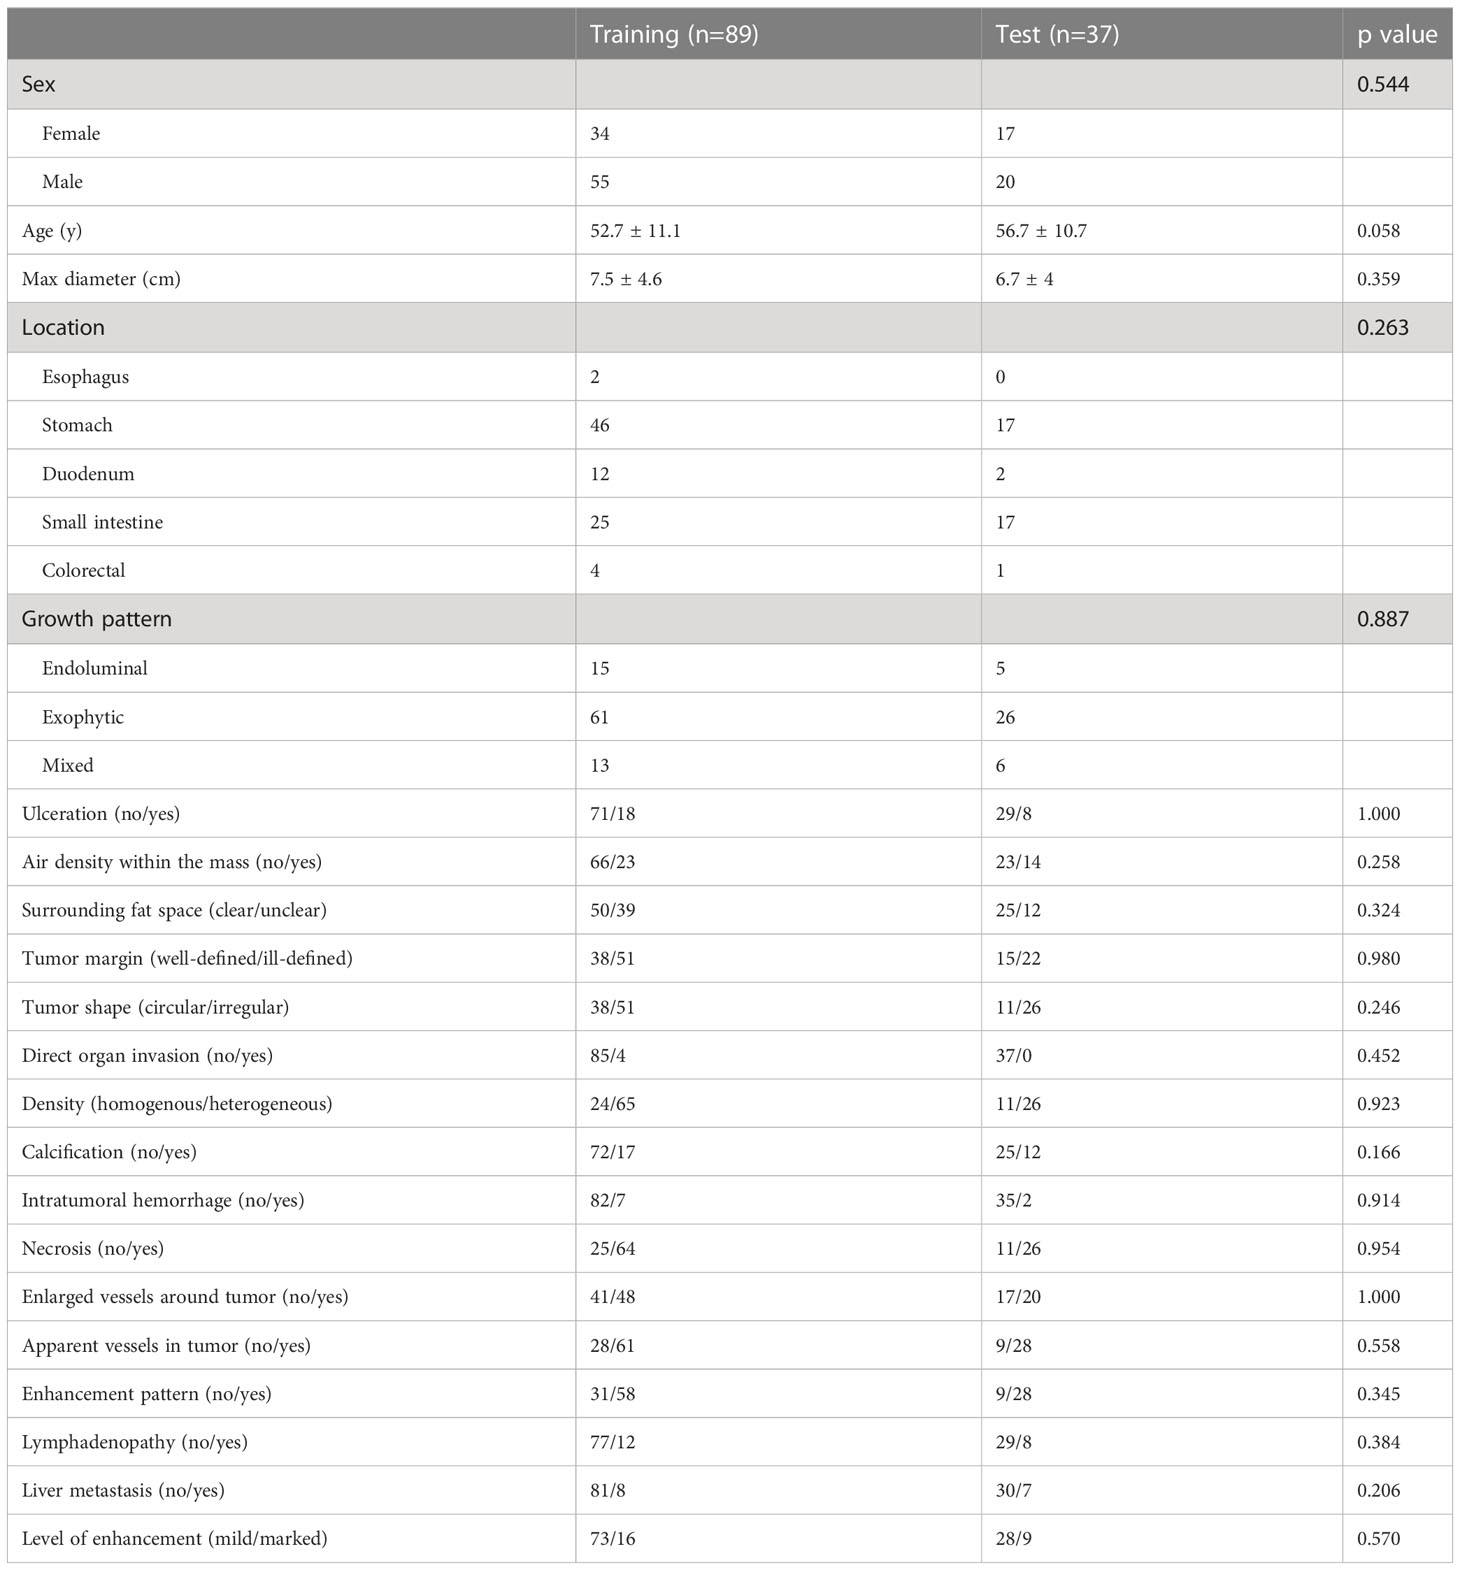
Table 3 Demographic and clinical characteristics of patients between the training and test cohort.
3.2 Feature selection and signature construction
A total of 1218 radiomics features were extracted from both the arterial and portal venous phase images. The intraobserver and interobserver ICCs all indicated favorable feature extraction reproducibility (mean ICC > 0.85). A total of 247 radiomics features with consistency values less than 0.7 were removed, leaving 971 features. More details on the deleted and selected features are presented in the Supplementary Materials (Excel. Feature delete and feature select).
Based on the principles of least penalty coefficient and least binomial deviation, RadscoreAP was constructed with 6 features corresponding to minimum logλ=0.072 in the arterial phase (Figures 2A, B). RadscorePVP was constructed with 6 features corresponding to minimum logλ=0.076 in the portal venous phase (Figures 2C, D). RadscoreAP-PVP was constructed with 10 features in both phases corresponding to minimum logλ=0.069 (Figures 2E, F). The formula is as follows:
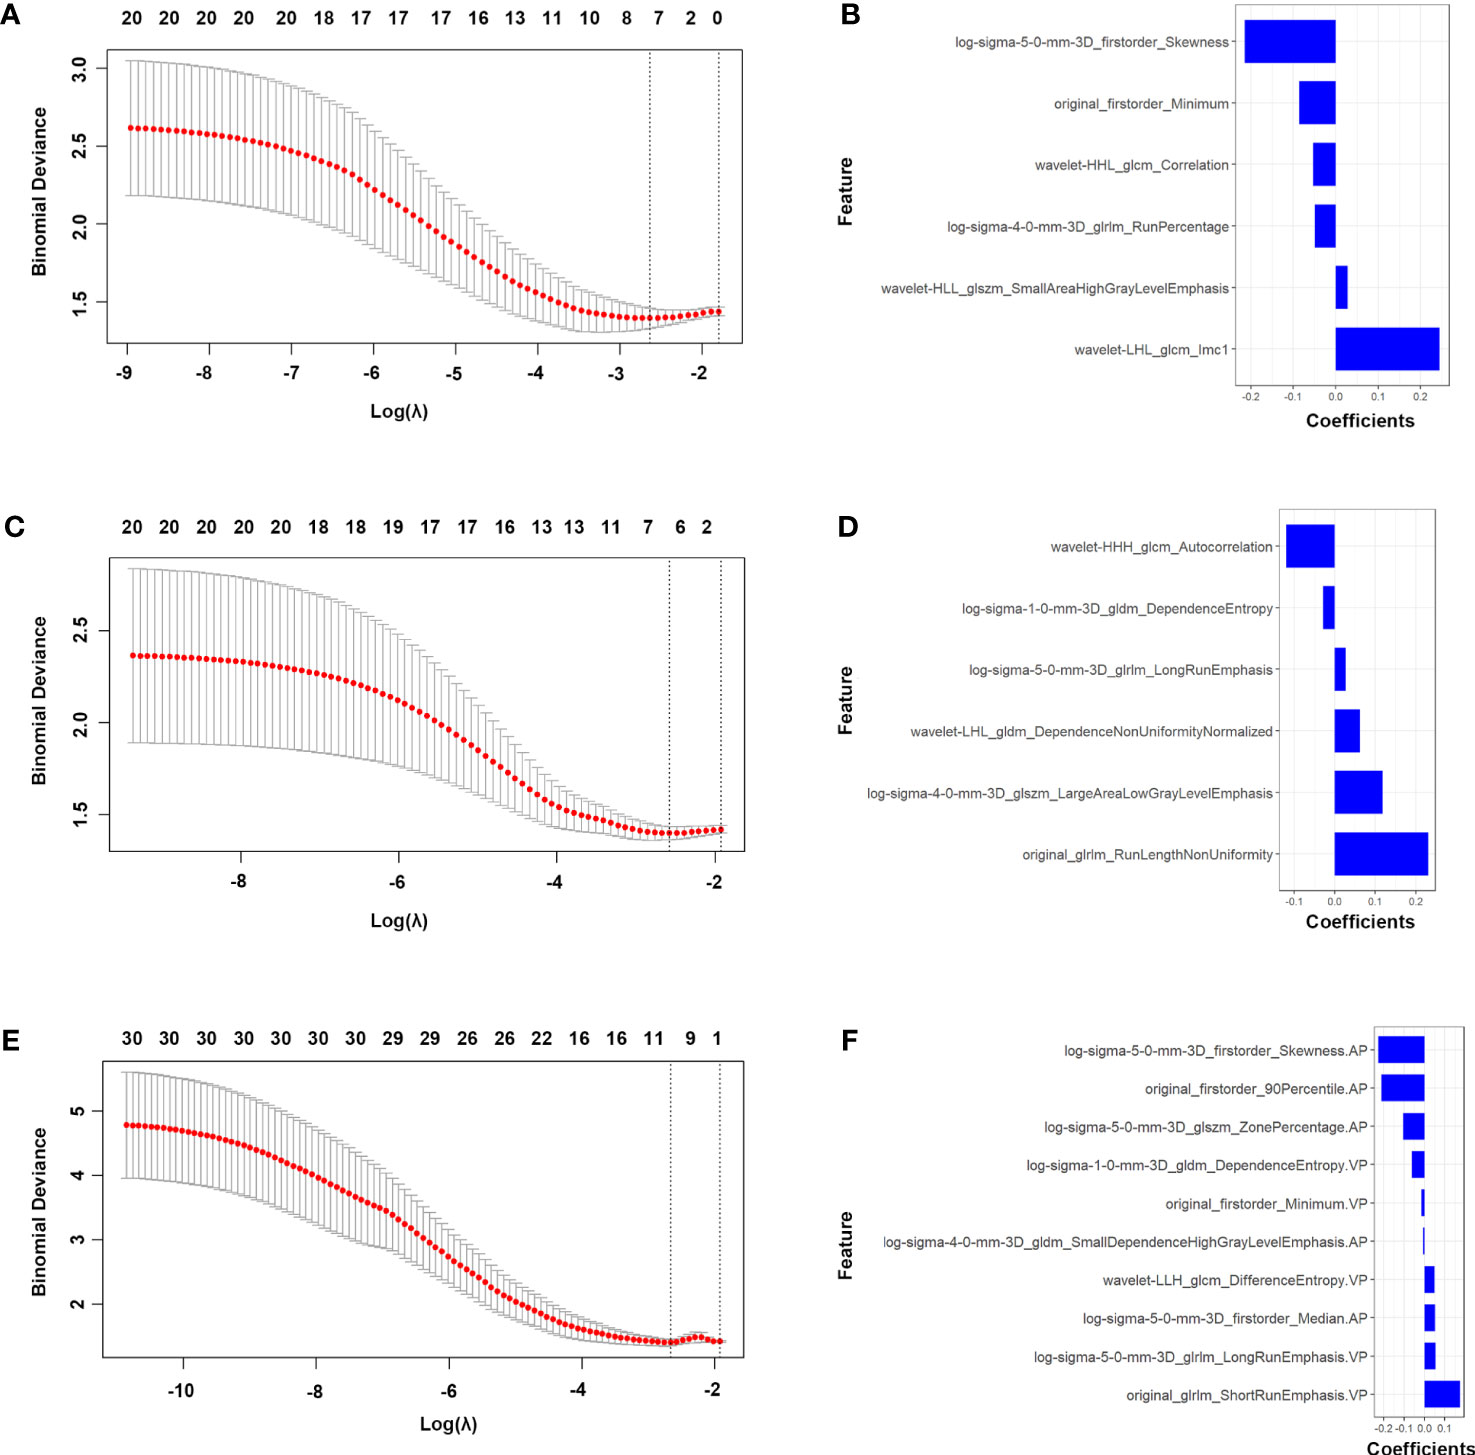
Figure 2 Features selection of the AP, PVP and AP-PVP radiomics model. LASSO [(A) in AP radiomics model, (C) in PVP radiomics model and (E) in AP-PVP radiomics model]. Coefficients of features in RadscoreAP (B), RadscorePVP (D) and RadscoreAP-PVP (F). AP, arterial phase; PVP, portal venous phase.
3.3 Optimized Radscore construction
First, we investigated and compared the arterial phase, portal venous phase, and arterial-portal venous phase separately. All the radiomics score showed significant differences between patients with mutation and without mutation (Figures 3A–F) in the training cohort (PAP<0.001, PPVP<0.001, and PAP-PVP<0.001, respectively) and test cohort (PAP=0.014, PPVP=0.017, and PAP-PVP=0.004, respectively). The AUCs of the Radscore model in the training cohort and in the test cohort were greater than 0.7 (ROC and diagnostic performance of AP, PVP and AP-PVP are shown in Figures 3G, H and Table 4). The arterial-portal venous phase was the optimized model with the highest diagnostic performance in the training cohort and test cohort (AUC = 0.787 vs. 0.775). However, there were no statistically significant differences among the radiomics models in either the training cohort (MAP vs. MPVP, P=0.775; MAP vs. MAP-PVP, P=0.563; MPVP vs. MAP-PVP, P=0.388) or the test cohort (MAP vs. MPVP, P=0.867; MAP vs. MAP-PVP, P=0.725; MPVP vs. MAP-PVP, P=0.596).
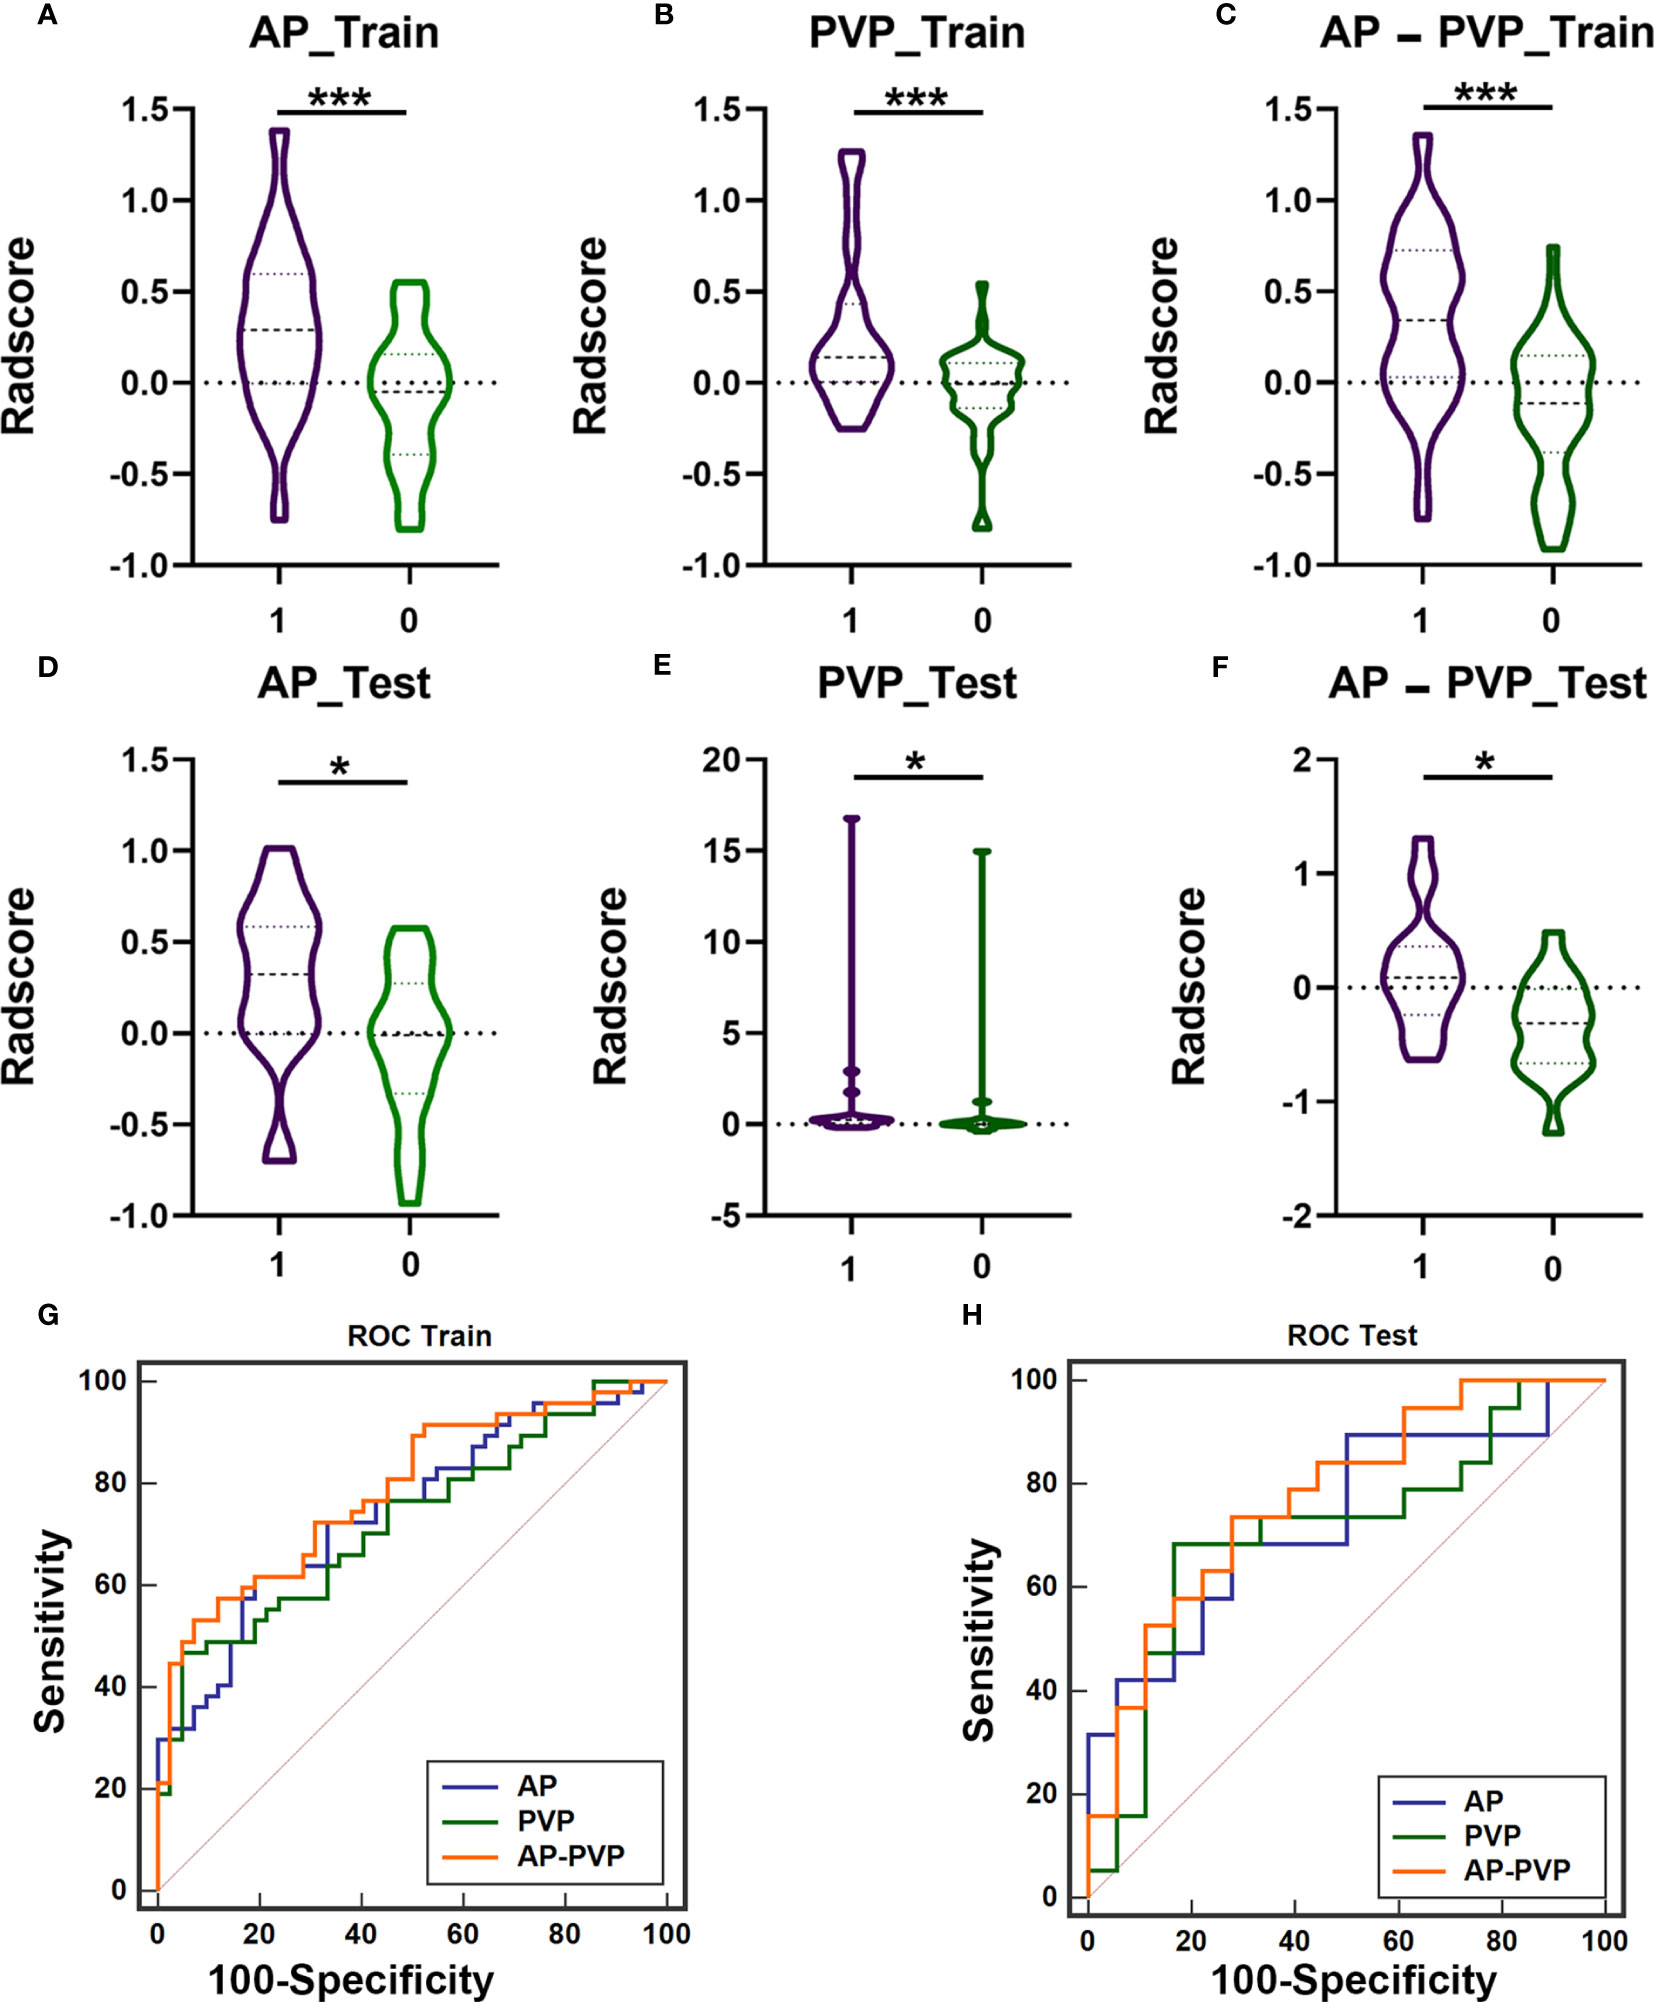
Figure 3 The difference of Radscores between training cohort and test cohort, and diagnostic efficacy of the radiomics models in the training cohort and test cohort. The radiomics score of arterial phases (A, D), portal venous phase (B, E), arterial-portal venous phase (C, F) showed significant differences between patients with KIT exon 11 deletion (1, purple) and without KIT exon 11 deletion (0, green) in the training cohort and test cohort (*** P<0.001, * P<0.05). ROC curve of radiomics model in the training cohort (G, AP-PVP model performed best: AUC = 0.787) and test cohort (H, AP-PVP model performed best: AUC = 0.775). ROC, receiver operating characteristic; AUC, area under the curve; AP, arterial phase; PVP, portal venous phase.
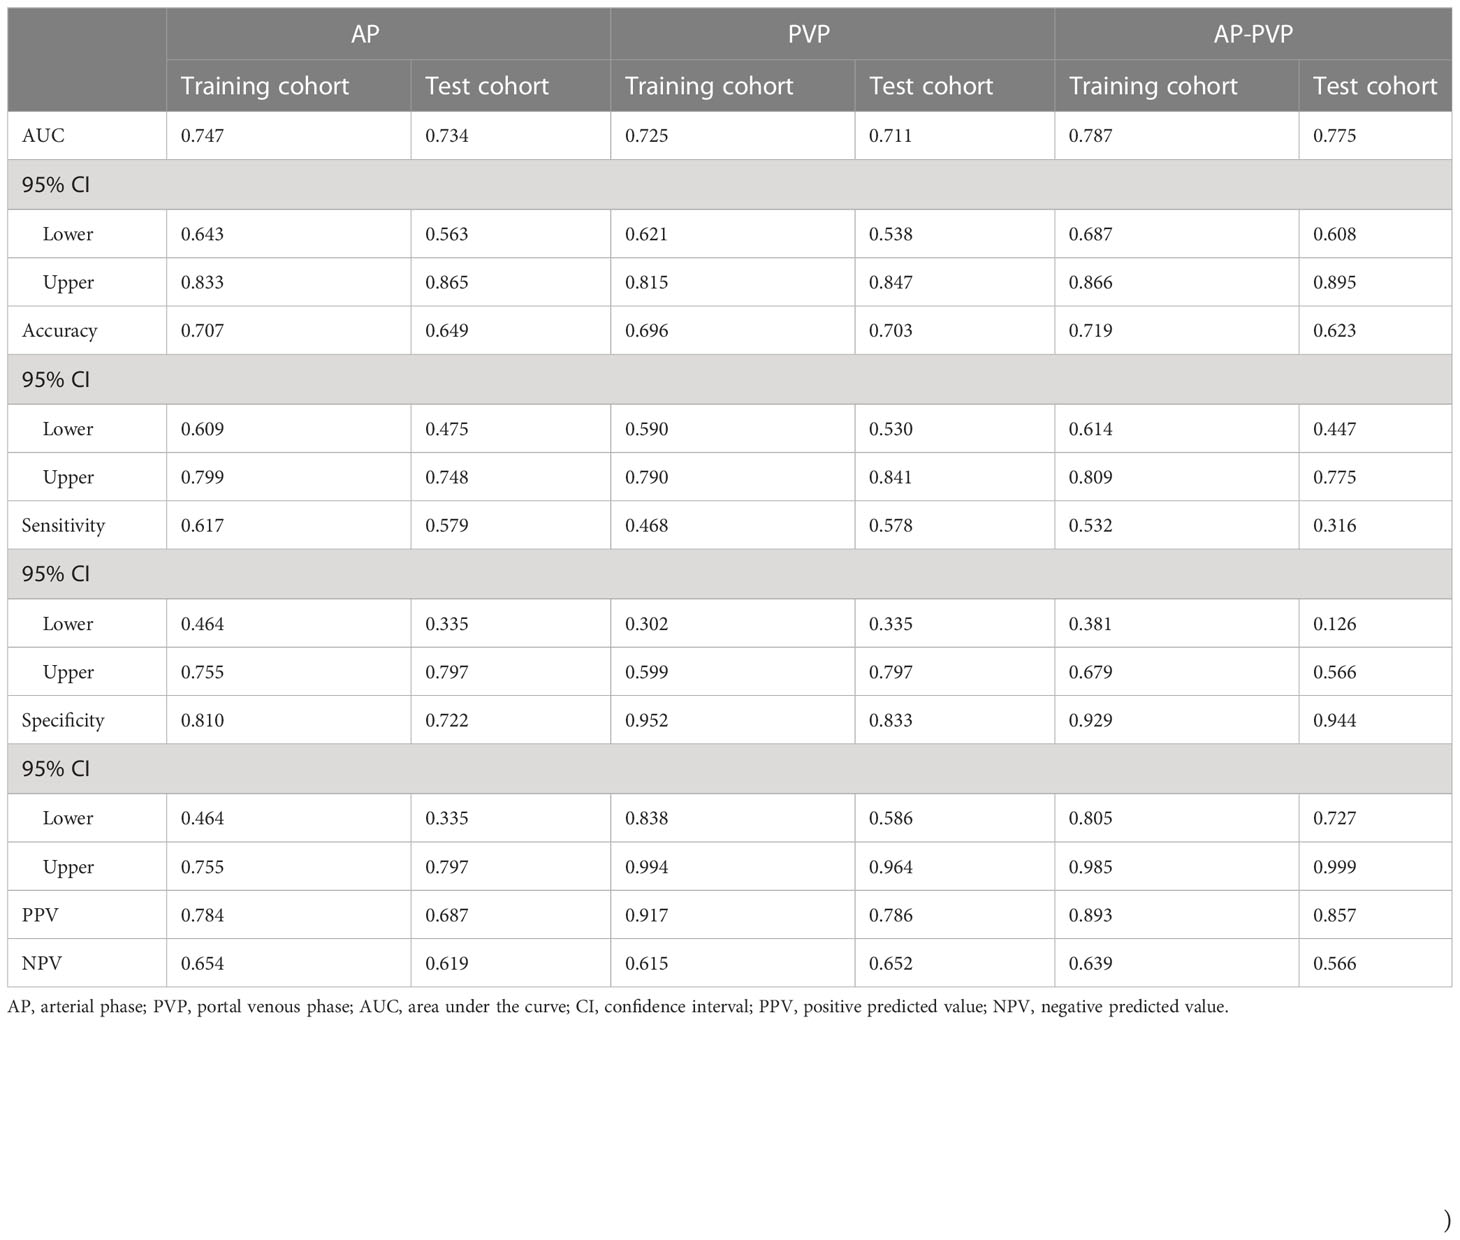
Table 4 Diagnostic performance of radiomics in the arterial phase, portal venous phase, and arterial-portal venous phase separately.
3.4 Clinical model and combined model of the arterial-portal venous phase
Maximum diameter of the tumor, tumor margin, and AVT were identified as independent factors for the clinical prediction model by VIF< 5 based on clinical variables and the minimum AIC principle. The VIFs for the three clinical characteristics were 3.5, 2.7 and 4.3, and the clinical model was developed based on these factors.
The combined model included three clinical parameters (maximum diameter of the tumor, tumor margin, and AVT) and RadscoreAP-PVP, the nomogram of the combined model is shown in Figure 4A, and the formula is as follows:
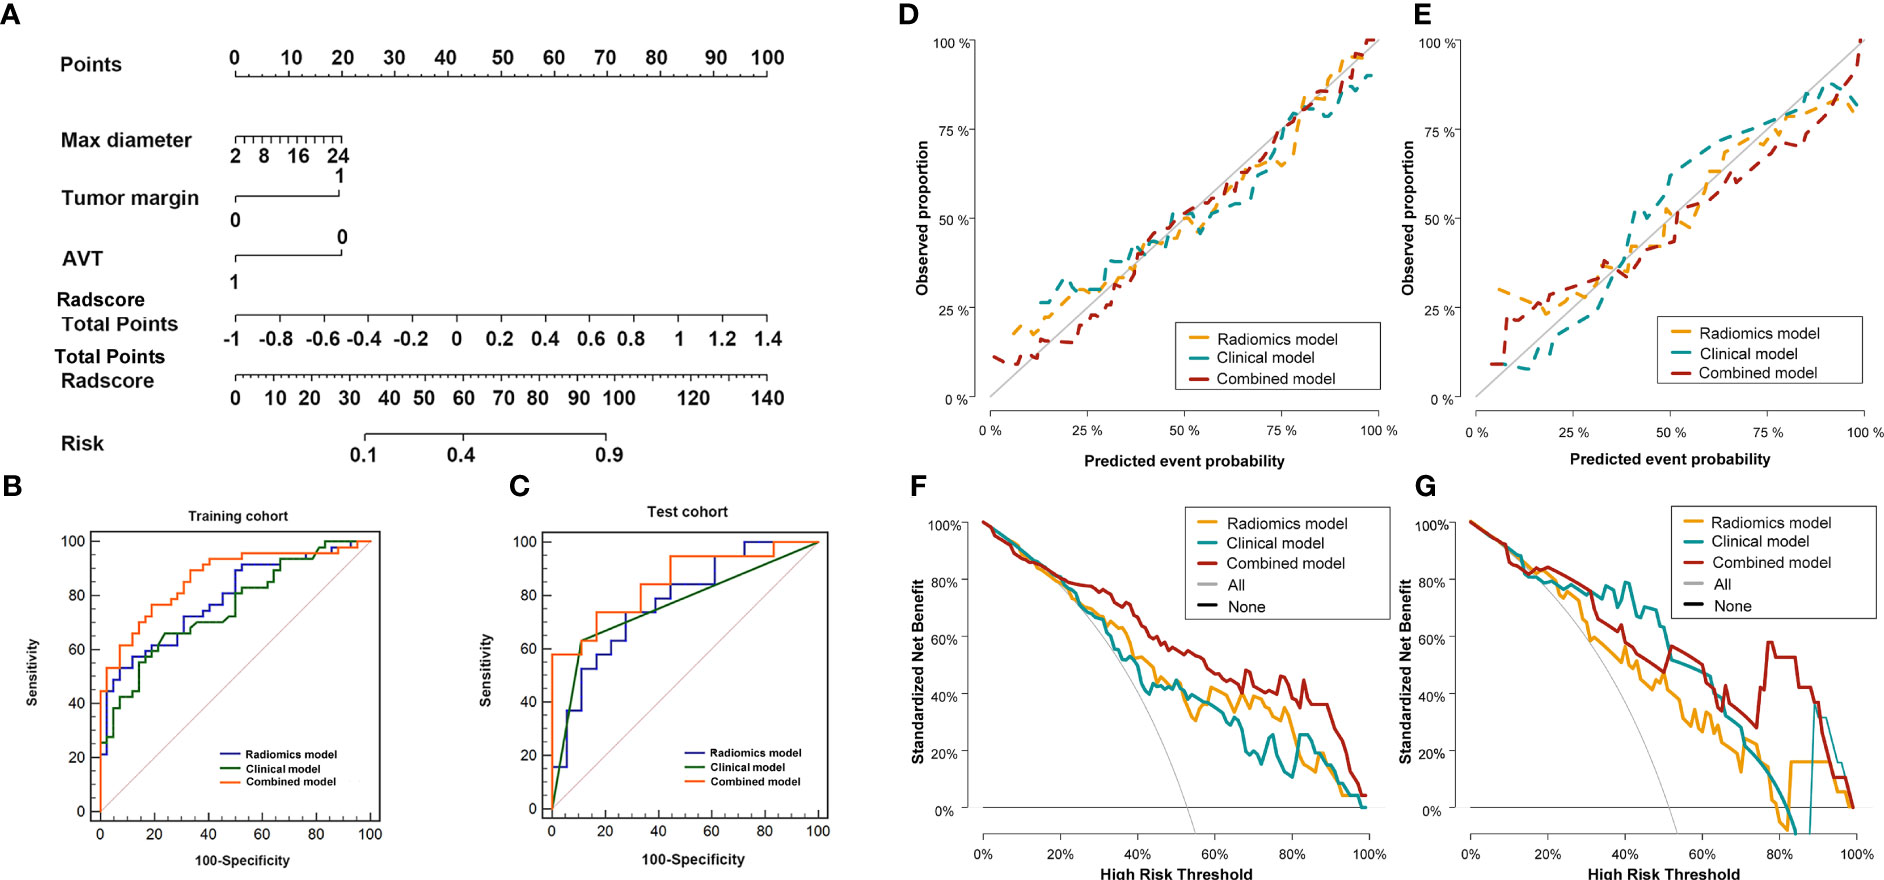
Figure 4 Diagnostic evaluation, calibration curves and decision curve analysis of the radio-genomics, clinical and combined models of AP-PVP. Nomogram based on the combined model (A). ROC curves of the radio-genomics, clinical and combined models in the training cohort (B) and test cohort (C); The combined model performed best (AUC of the training cohort and test cohort, 0.863 vs.0.851). Calibration curves in the training cohort (D, P=0.258) and test cohort (E, P=0.084). DCA of in the training cohort (F) and test cohort (G). Combined model (red line) performs best. The X-axis indicates the threshold probability. The Y-axis shows the model benefit. The red line represents the combined model. The orange line represents the radiomics score (Radscore), and the blue line represents the clinical model.
The cut-off of the formula is 0.217.
3.5 Diagnostic performance of the radiomics model, clinical model and combined model of the arterial -portal venous phase
The discriminatory efficiency of the radiomics model, clinical model and combined model was assessed using ROC analyses (Figures 4B, C, Table 5). In the training cohort, the diagnostic performance of the combined model was significantly higher than that of the radiomics model (P=0.026) and the clinical model (P=0.006). In the test cohort, the combined model showed the highest diagnostic performance (AUCcombined = 0.851, 95% CI = 0.695-0.946), but there was no significant difference in comparison with the radiomics model (P = 0.183) and the clinical model (P = 0.151).
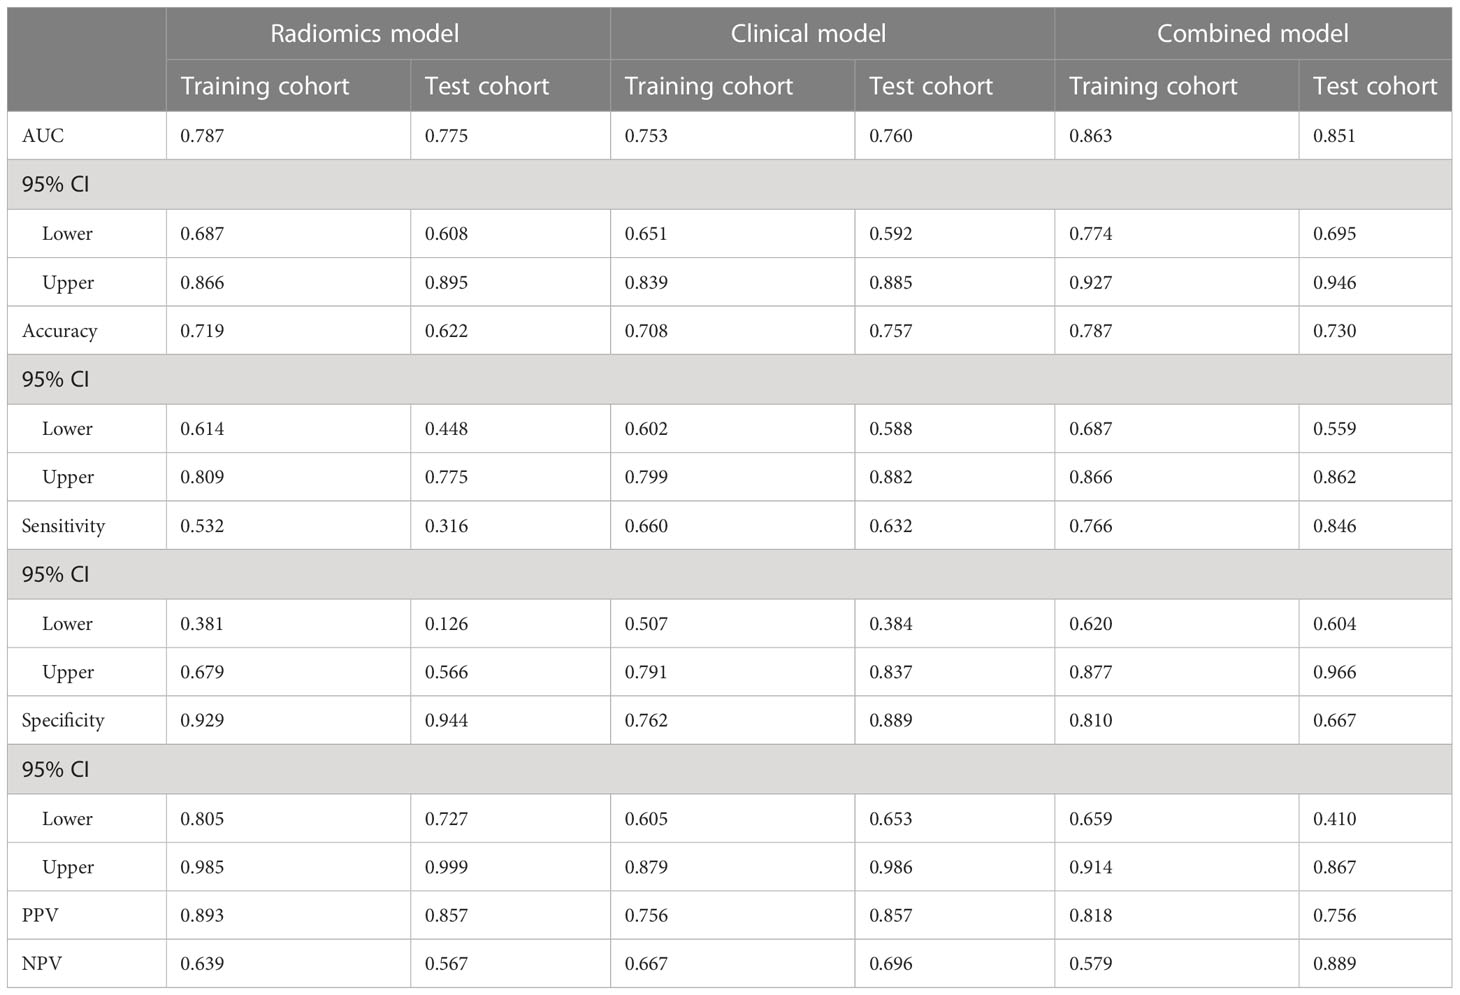
Table 5 Diagnostic performance of radio-genomics, clinical and combined models.
All mutations identified and the results of the models are provided in Supplementary Table S1.
3.6 Evaluation of the radiomics model, clinical model, and combined model
The Hosmer–Lemeshow test for the radiomics model, clinical model, and combined model showed that the combined model fit the data well, with no significant difference between the training cohort (P = 0.258) and the test cohort (P = 0.084) (Figures 4D, E).
The DCAs for the radiomics model, clinical model, and combined model in the training and test cohorts are shown in Figures 4F, G. DCA indicated the threshold probability of patients who under 100% will maximize the benefit. The net benefit for each model at various threshold probabilities are provided in Supplementary Table S2.
3.7 External validation of the combined model
The values of radiomics model (Figure 5A), and combined model (Figure 5C) showed significant differences (P <0.05) between patients with KIT exon 11 deletion and without KIT exon 11 deletion in external valisation. The values of clinical model (Figure 5B, P=0.546) were higher in patients with KIT exon 11 deletion than patients without KIT exon 11 deletion but didn’t show significant differences. The combined model (Figure 5D, Table 6) yielded the largest AUC of 0.828 (95% CI, 0.705–0.915). Demographic and clinical characteristics of patients in the external cohort are provided in Table 7.
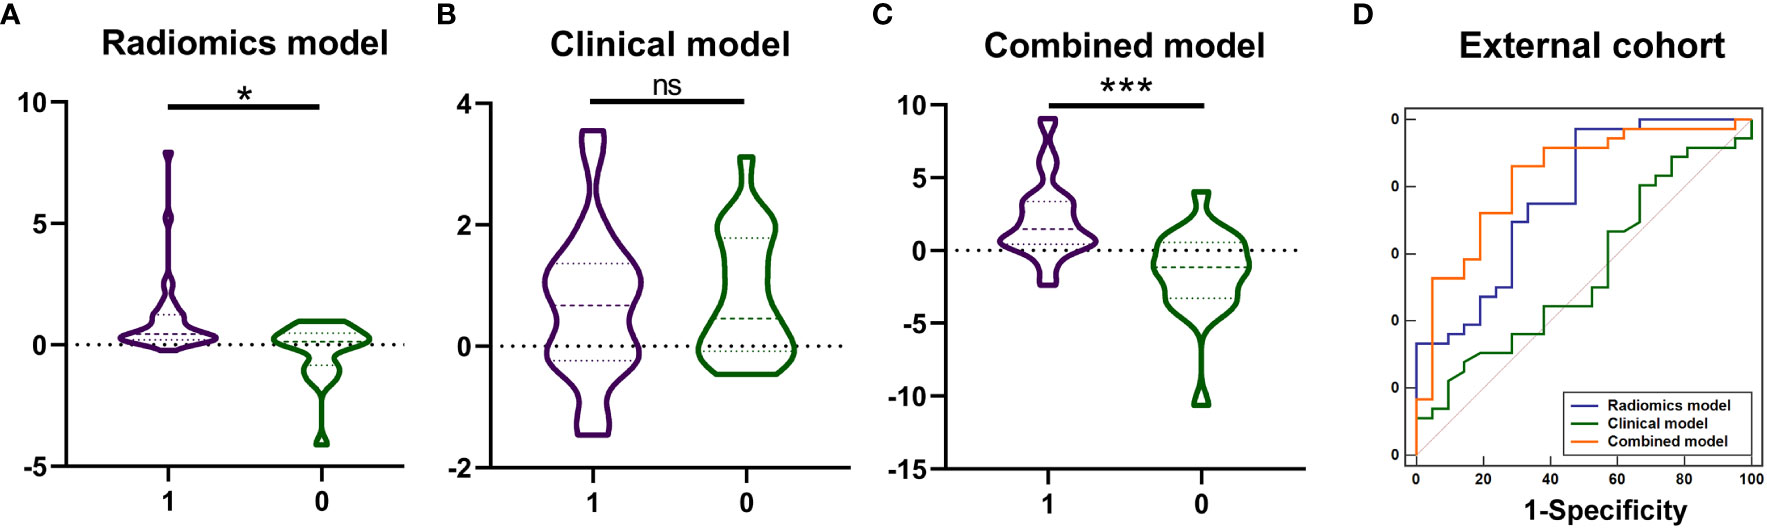
Figure 5 The values of model prediction and diagnostic performance of the radiomics, clinical and combined models in the external cohort. The values of model prediction of radiomics model (A), and combined model (C) showed significant differences (*** P <0.001, * P <0.05, ns means no significance) between patients with KIT exon 11 deletion (1, purple) and without KIT exon 11 deletion (0, green). The values of model prediction of clinical model (B, P=0.546) were higher in patients with KIT exon 11 deletion than patients without KIT exon 11 deletion but didn’t show significant differences. The ROC curve of combined model (D) yielded the largest AUC of 0.828.
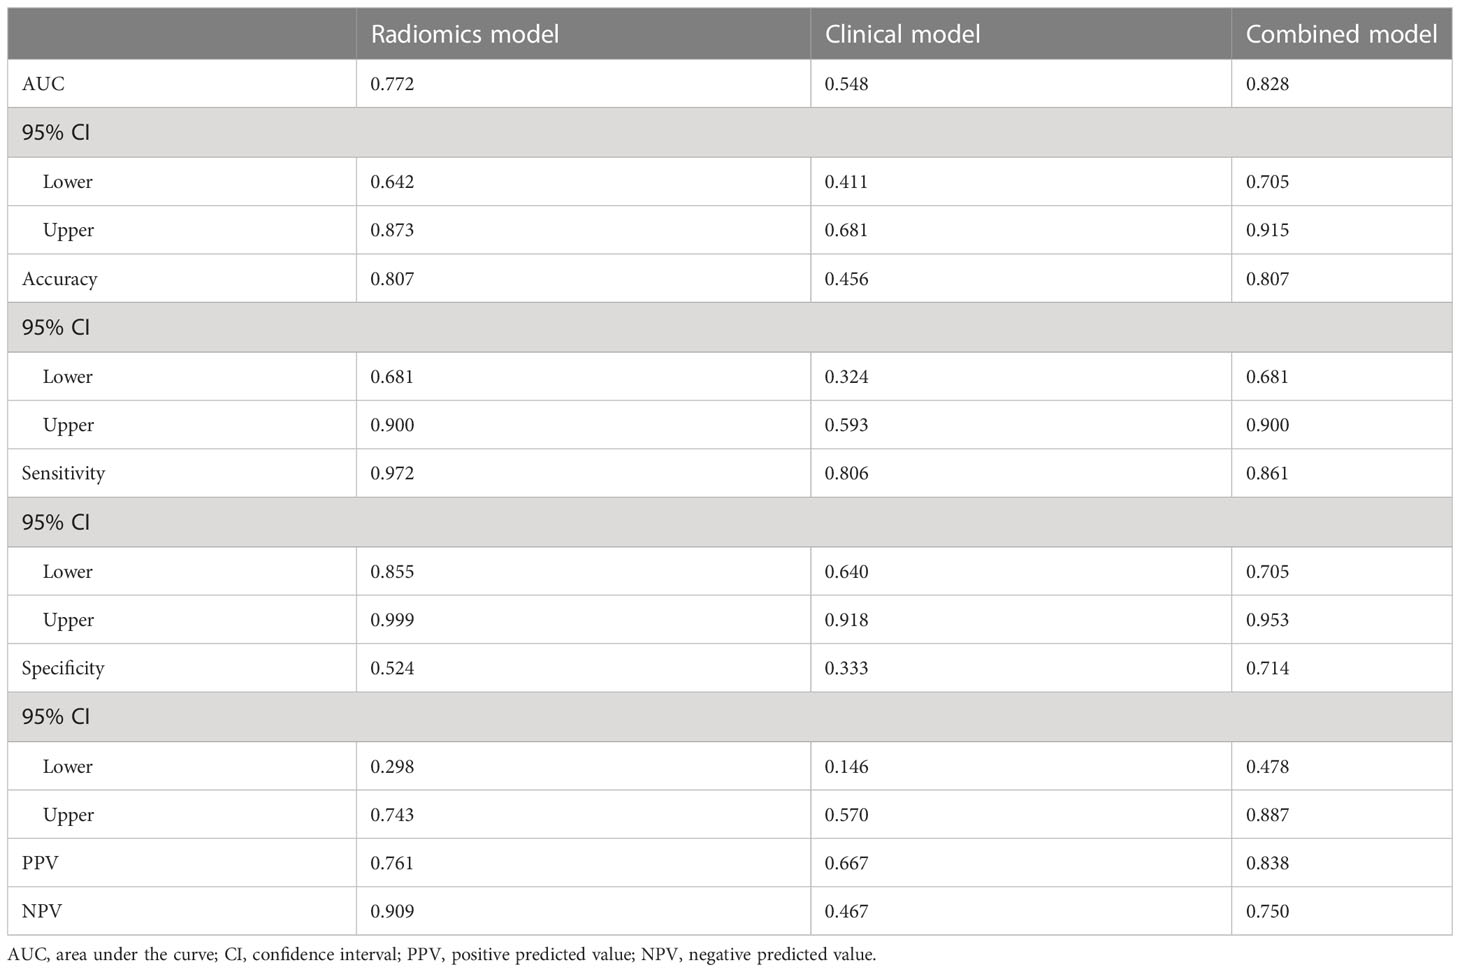
Table 6 Diagnostic performance of the radio-genomics, clinical and combined models in the external cohort.
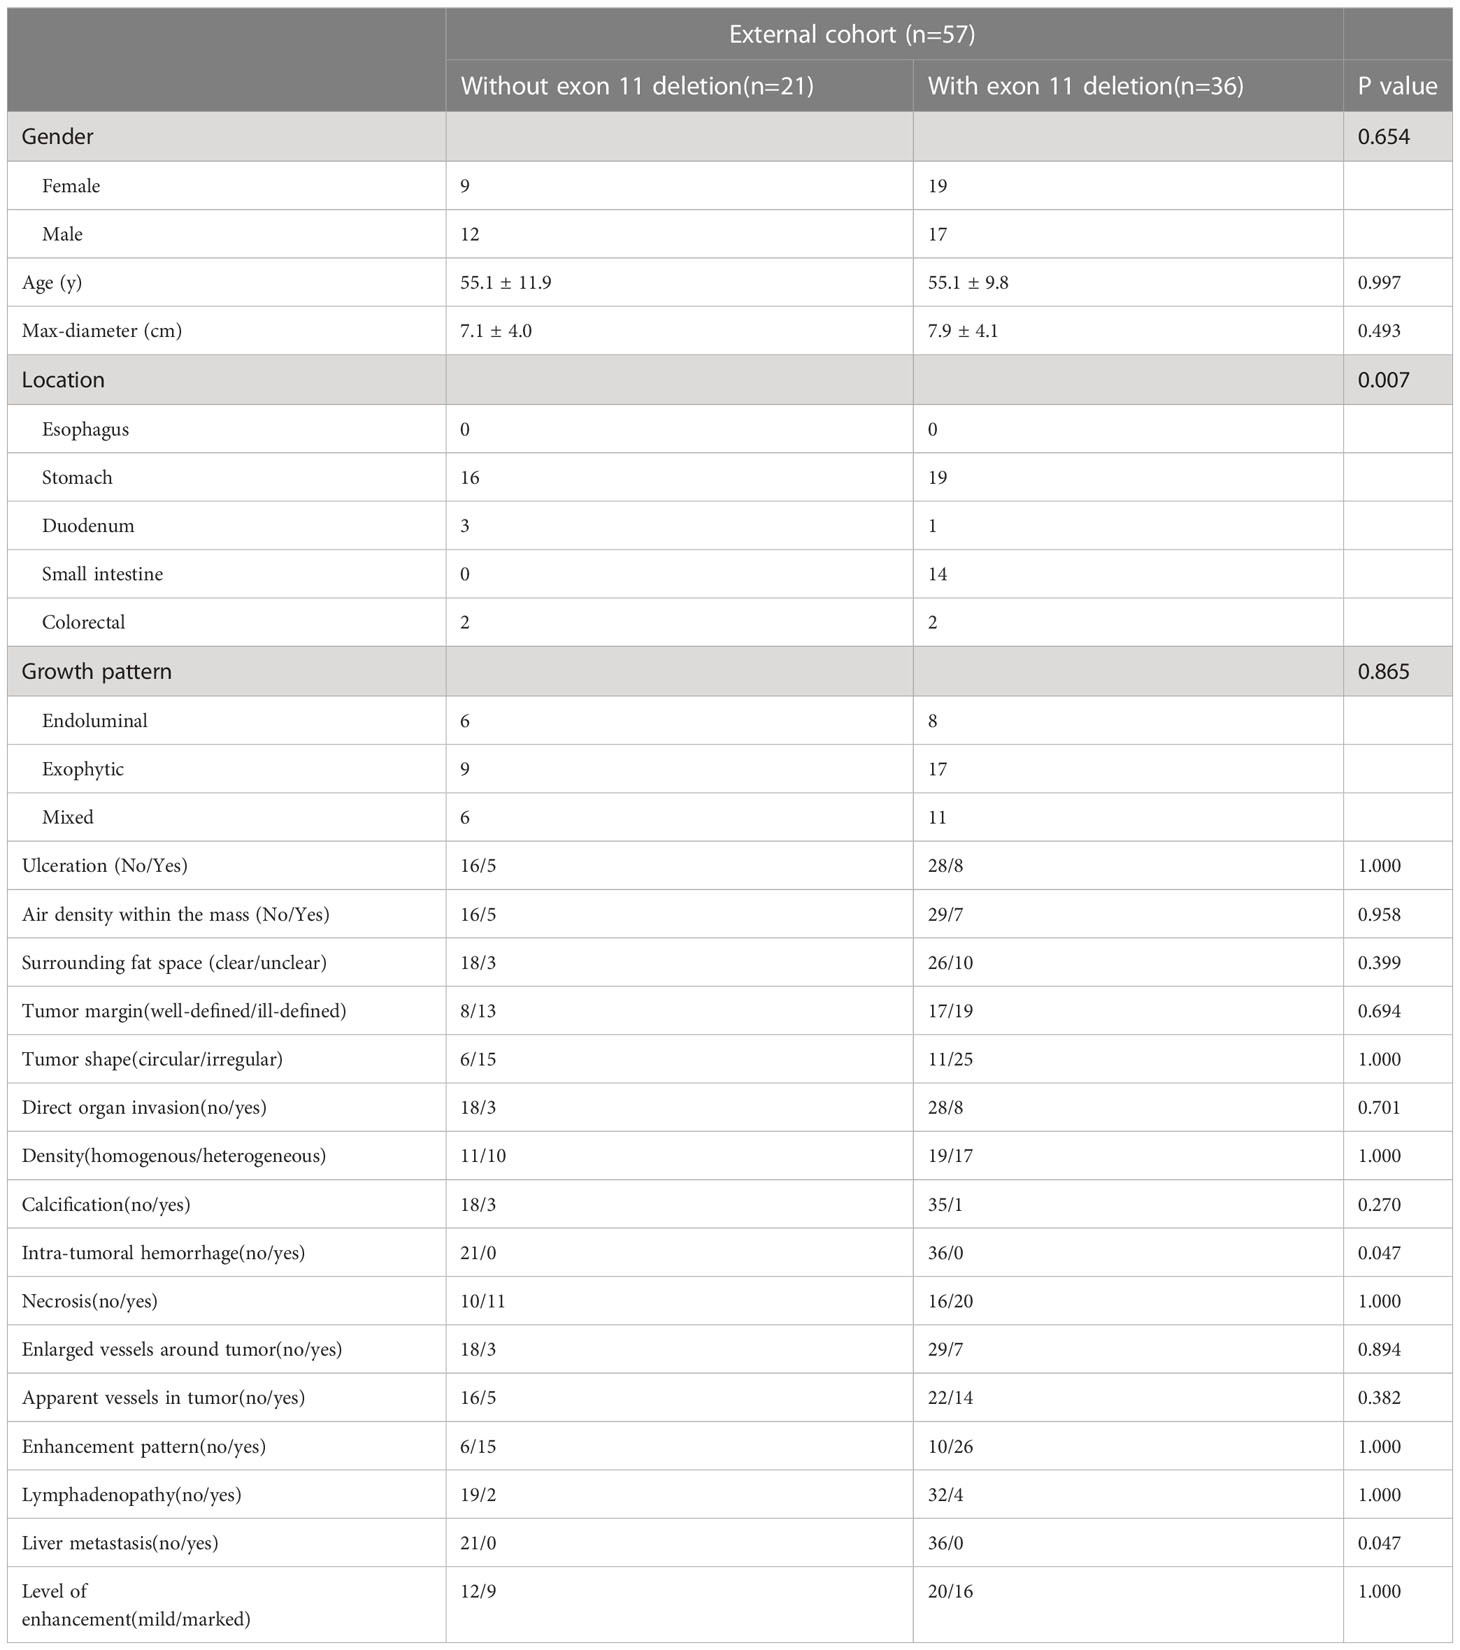
Table 7 Demographic and clinical characteristics of patients in the external cohort.
3.8 Prognostic stratification of GIST patients
As of Jun. 2023, 91.3% (115/126) GIST patients had completed the PFS and OS follow-up. Among them, 29 GIST patients experienced tumor recurrence during the follow-up, and 19 GIST patients died. Patients were divided into low-risk and high-risk subgroups in the training and test cohorts. In training cohort, the median DFS time was 46 months (high risk subgroup) and 62 months (low risk subgroup), the median OS time was 57 months (high risk subgroup) and 70 months (low risk subgroup); In test cohort, the median DFS time was 48 months (high risk subgroup) and 65 months (low risk subgroup), the median OS time was 62 months (high risk subgroup) and 66 months (low risk subgroup). Kaplan-Meier analysis showed that the DFS and OS curves of the low- and high-risk subgroups were significantly different in both the training and test cohorts (log rank test, p< 0.05), respectively (Figure 6).
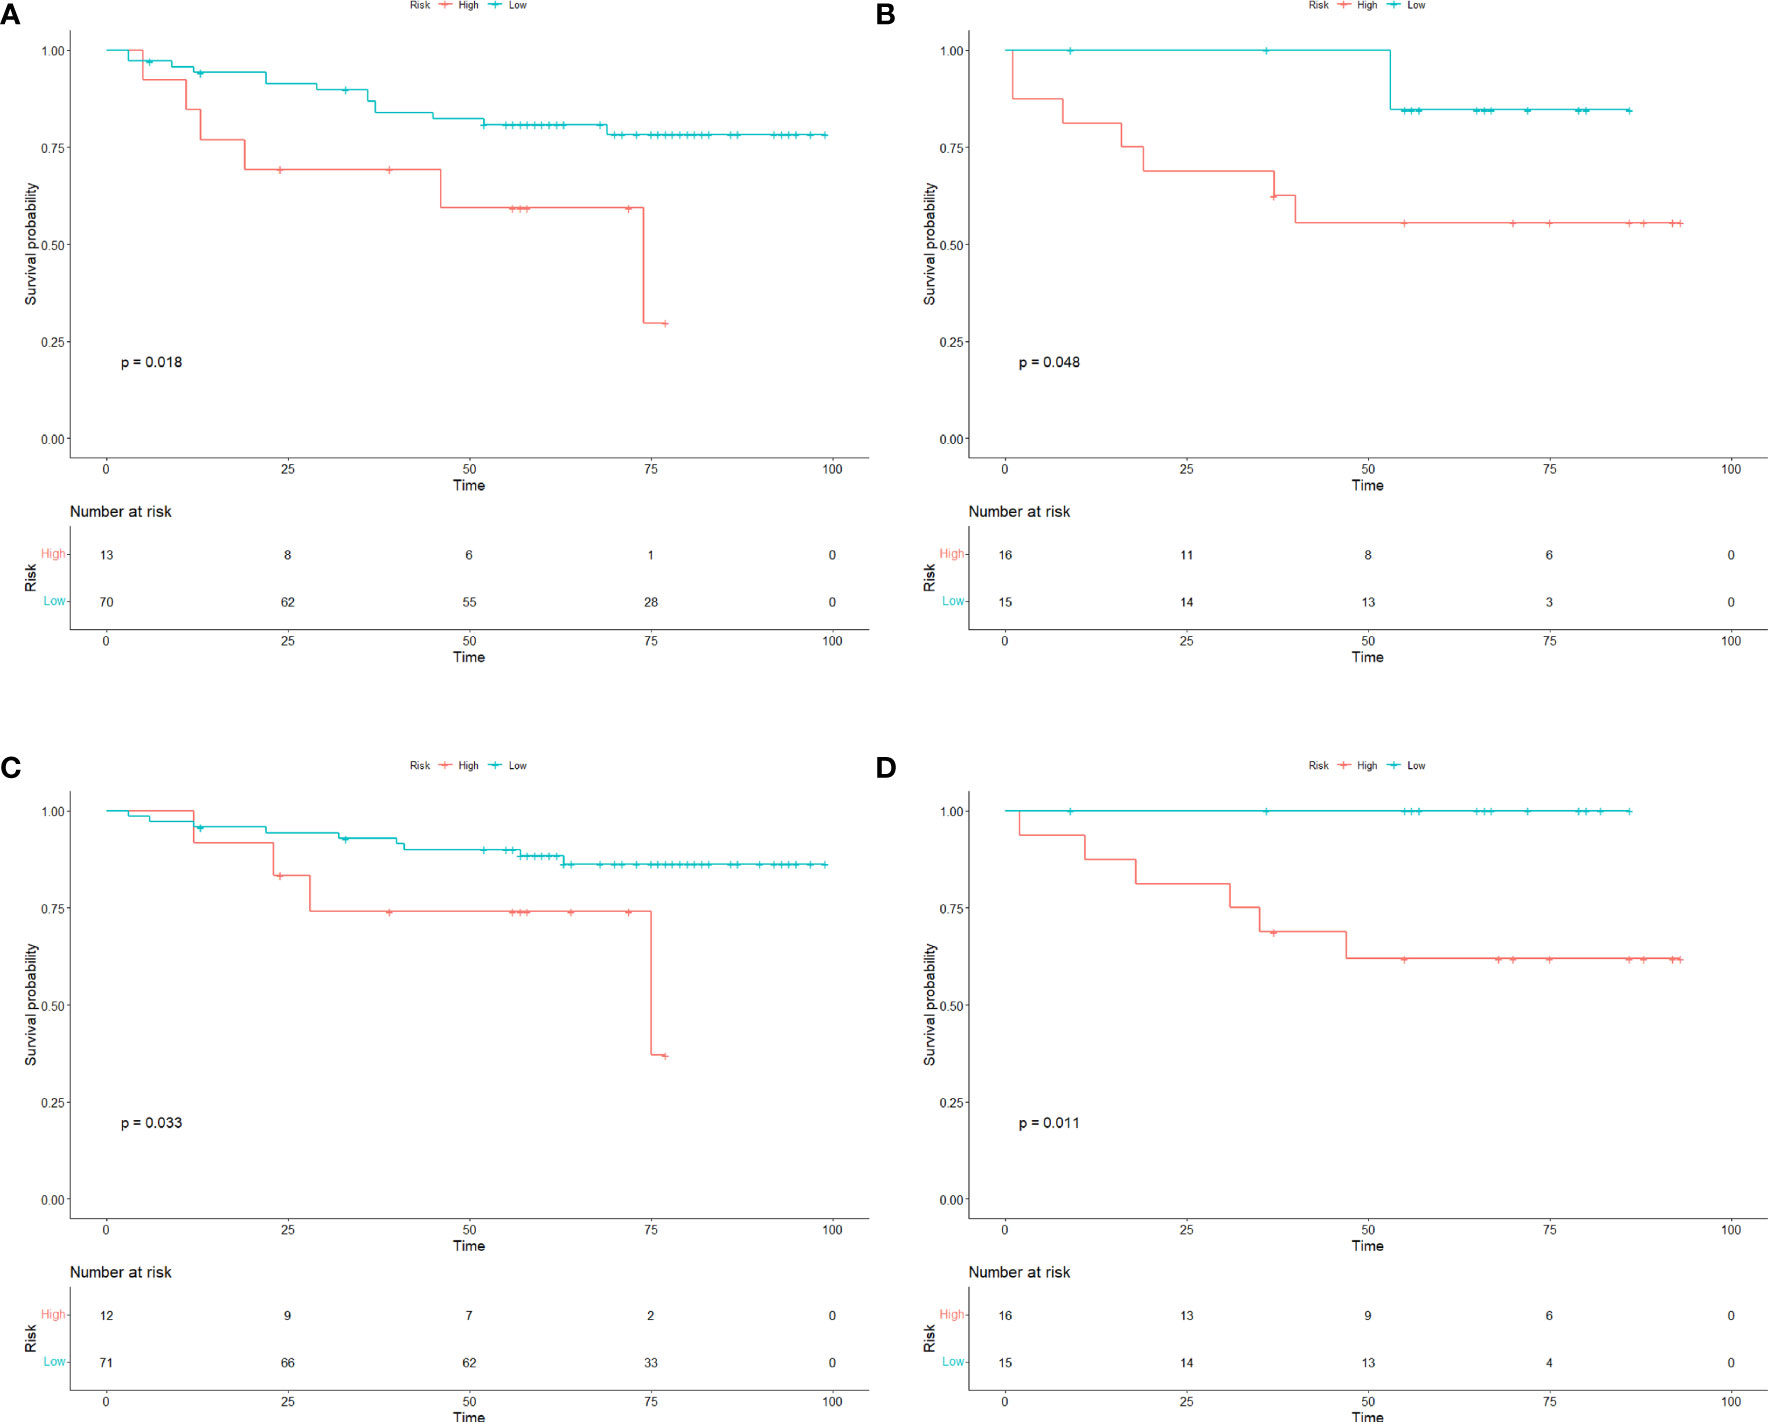
Figure 6 Survival curves of GIST patients. The Kaplan–Meier curves for DFS and OS in GIST patients in the (A, C) training cohorts and (B, D) test cohorts according to the different risk groups of Radscore. There was a significant difference in DFS and OS between the high-risk and low-risk groups in both the training and test cohorts (P<0.05). OS overall survival; DFS disease−free survival; GIST gastrointestinal stromal tumors.
3.9 Case presentation of model application
In our combined model, three clinical variables and the Radscore (AP-PVP) were used to predict the presence of preoperative KIT exon 11 deletion. As an example, a 58-year-old male patient was seen 1 week after the discovery of blood in the stool (Figure 7). The maximum diameter of the lesion was 5 cm, the tumor margin was assigned as 1 (ill-defined), the AVT was assigned as 0, and the Radscore was 0.553. When the above information was taken into the combined model formula, the score was 2.827, which was greater than the cutoff value of 0.217, the nomogram showed that the probability of KIT exon 11 deletion was greater than 90%. The pathological results of the patient showed KIT exon 11 deletion.
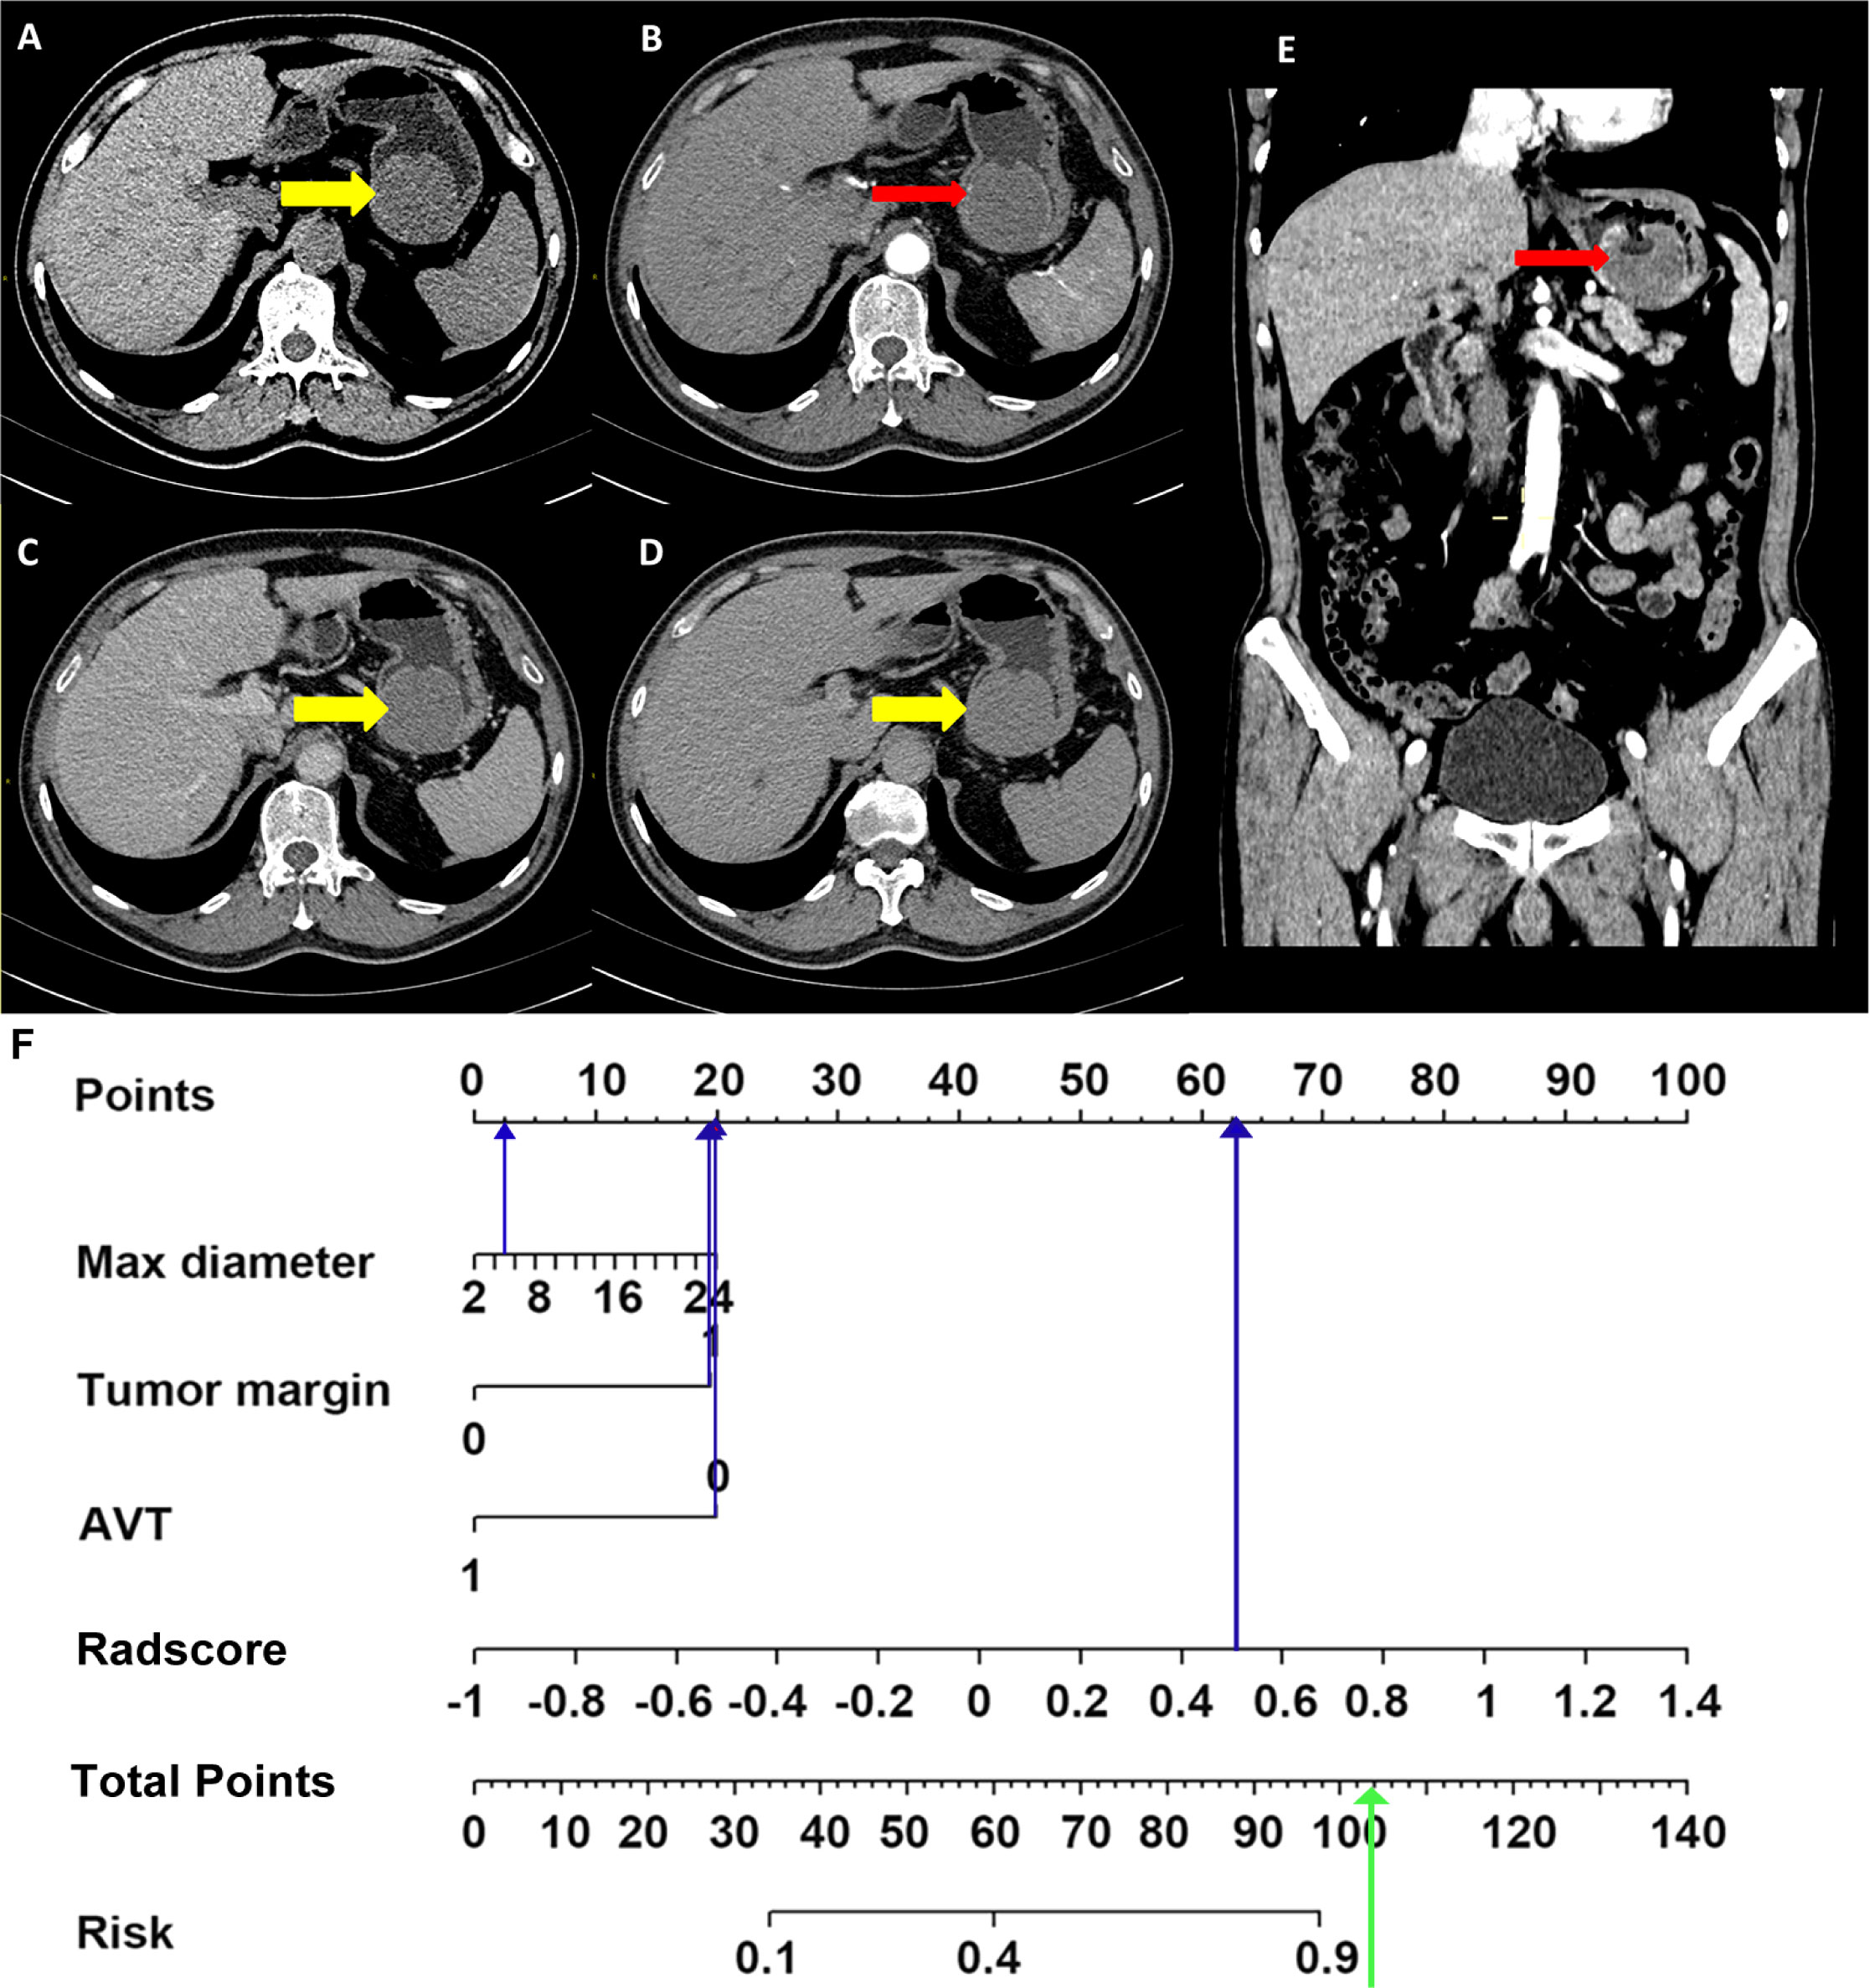
Figure 7 Application of combined model. Non-enhanced CT image (A), arterial phase images (B, transverse section; E, coronal section), portal venous phase image (C), delayed phase image (D), nomogram (F). A 58-year-old male was seen 1 week after the discovery of blood in the stool. Enhanced abdominal CT image shows a soft tissue density mass in the stomach (A, thick yellow arrows in CT images), with 5 cm diameter and unsmooth margin, no obvious enhanced vascular was seen in tumor (B, E, thin red arrows). The max diameter, tumor margin, AVT and Radscore points were substituted into the nomogram (blue arrow in Figure 7F) to obtain the total points. It was found that the probability of predicting KIT exon 11 deletion was greater than 90% (green arrow in Figure 7F). The pathological results of the patient showed KIT exon 11 deletion.
4 Discussion
In this work, we showed radiomics method based on enhanced CT images could predict KIT exon 11 mutation in patients with GIST, and the radiomics integrate AP and PVP images could identify KIT exon 11 deletion GIST with high sensitivity. Furthermore, we developed and validated a combined model that incorporated Radscore and maximum diameter of the tumor, tumor margin, AVT, which exhibited high accuracy for preoperatively predicting KIT exon 11 mutation. Importantly, the conglomerate of the radiomics and clinical risk factors in our combined model provides a straightforward, noninvasive, and mighty approach for personalized prediction of KIT exon 11 mutation before surgery. Precision medical research has successfully used radiomics methods to evaluate image attributes, and to predict tumor genotypes (31–33). This represents the study focused on the clinical-radiomics analysis on enhanced CT imaging for preoperative prediction of KIT exon 11 deletion of GISTs.
Recently, the postoperative indicators including location, size, morphology, immunohistochemistry, and molecular genetics have been examined for the malignant potential of GISTs (34). GIST with KIT exon 11 deletions exhibit higher proliferation rates and shorter disease-free survival times compared with GISTs with other KIT exon 11 mutations (35). Previous study (36) evaluating 1303 patients with GISTs showed that tumor size >5 cm was significantly correlated with the increased rate of tumor recurrence. Tumor size had also been found to be of important diagnostic value in the risk classification of GISTs, irrespective of the NIH standard, AFIP standard, or AJCC staging system. In our study, compared to GISTs without KIT exon 11 deletion, GISTs with KIT exon 11 deletion usually exhibit characteristics such as a larger tumor maximum diameter, an ill-defined tumor margin. Prominent tumor vasculature, and more obvious tumor vessels more likely to occur in the GIST with KIT exon 11 deletions, this is consistent with previous research and suggesting a relationship between the deletion of KIT exon 11 and biological behavior of aggression (37). GISTs with different types of mutations exhibit different therapeutic effects, and prognosis (38). exon 11 mutant GISTs are usually sensitive to imatinib, imatinib therapy for 3 years after surgery significantly improved the prognosis of patients with GISTs with KIT exon 11 deletion (18). Therefore, deletion of KIT exon 11 should be a required assessment to explore a more appropriate treatment strategy for GIST patients.
The arterial-portal venous phase radiomics signature had the greatest performance, and previous research generated equivalent findings (39). The performance of diagnostics of the clinical model was lower to that of the Radscore model. The combined model had better predictive effectiveness and clinical applicability with the validation set than the radiomics nomograms, which indicated that the judgment efficiency of the combined feature analysis was superior to that of the Radscore texture analysis or the clinical feature analysis alone. The radiomics reflected molecular-level pathology better than the clinical factors, which confirmed the enormous potential of the radiomics to distinguish GISTs with the KIT exon 11 deletions.
In the past, radiomics was able to convert images into high-throughput quantitative data that may identify intratumor heterogeneity and correlate with gene expression levels. On enhanced CT images, Xu et al. (40) presented the evidence that CT texture analysis may help distinguish GISTs with KIT exon 11 mutation from those without KIT exon 11 mutation. They discovered that the standard deviation of the textural parameters of tumors lacking the KIT exon 11 mutation is an independent predictor of the absence of the mutation. Liu et al. (41) evaluated the ability of three alternative models (model[CT], model[radiomics + clinical], and model[CT + radiomics + clinical]) to distinguish between GISTs and those without KIT exon 11 mutation. In our work, we focused on the performance of diagnostics of GISTs with and without KIT exon 11 deletion. 1218 features for radio-genomics, followed by more typical CT image features such as morphological and density variables. Patients with GIST who had previously received anticancer treatment (such as TKI treatment or surgery) were excluded from the research. The model’s trustworthiness is enhanced by the incorporation of an external validation cohort (with an AUC of 0.829).
Radiomics model could effectively stratify the risk level of GIST patients, which is consistent with previous studies (42, 43), thus allowing better preoperative prediction of patient recurrence or mortality.
Nevertheless, the current research has a few limitations. The retrospective approach and patient exclusion criteria may introduce a certain selection bias. Due to the small size of sample, we merged GISTs with gene mutations except for without KIT exon 11 deletion. It is vital to distinguish between distinct mutation types. Future research with a large size of sample or a specific design should take this into consideration. Currently, Radscore does have the problem of interpreting the correlation between radiomics features and physiological characteristics of diseases, how to correlate the both of them will be an important research for radiomics, and it is also the subsequent research of this research. Some studies illustrated the correlation of some radiomics features with diseases, such as entropy and energy (44–47), so in the future we will focus on exploring the relevance of more features to disease pathology. And finally, four distinct scanners were used for the CT scans. Nevertheless, the diversity of machines can make the model more repeatable, thereby promoting their widespread use.
5 Conclusions
In conclusion, clinical-radiomics based on enhanced CT imaging provides a good predictive capacity for GISTs with and without KIT exon 11 deletion. Given that CT imaging is frequently used in all phases of GIST diagnosis and treatment and provides a noninvasive opportunity to detect gene mutation types, this method may have a substantial impact.
Data availability statement
The raw data supporting the conclusions of this article will be made available by the authors, without undue reservation.
Ethics statement
The studies involving humans were approved by the Ethics Committee of Tongji Medical College of Huazhong University of Science and Technology. The studies were conducted in accordance with the local legislation and institutional requirements. The participants provided their written informed consent to participate in this study.
Author contributions
Guarantors of integrity of entire study, PH, YZ, QL. Study concepts/study design or data acquisition or data analysis/interpretation, YZ, XY, PZ, YYZ, KT. Manuscript drafting or manuscript revision for important intellectual content, all authors. Manuscript final version approval, all authors. Literature research, ND, GM, YL. Statistical analysis, LW, LM. Manuscript editing, XY, PH, QL. All authors contributed to the article and approved the submitted version.
Acknowledgments
We thank the referring clinicians for their help in this study.
Conflict of interest
Author LM was employed by the company He Kang Corporate Management SH Co. Ltd.
The remaining authors declare that the research was conducted in the absence of any commercial or financial relationships that could be construed as a potential conflict of interest.
Publisher’s note
All claims expressed in this article are solely those of the authors and do not necessarily represent those of their affiliated organizations, or those of the publisher, the editors and the reviewers. Any product that may be evaluated in this article, or claim that may be made by its manufacturer, is not guaranteed or endorsed by the publisher.
Supplementary material
The Supplementary Material for this article can be found online at: https://www.frontiersin.org/articles/10.3389/fonc.2023.1193010/full#supplementary-material
References
1. Kang HC, Menias CO, Gaballah AH, Shroff S, Taggart MW, Garg N, et al. Beyond the GIST: mesenchymal tumors of the stomach. Radiographics (2013) 33:1673–90. doi: 10.1148/rg.336135507
2. Pantuso G, Macaione I, Taverna A, Guercio G, Incorvaia L, Di Piazza M, et al. Surgical treatment of primary gastrointestinal stromal tumors (GISTs): Management and prognostic role of R1 resections. Am J Surg (2020) 220:359–64. doi: 10.1016/j.amjsurg.2019.12.006
3. Heinrich MC, Corless CL, Duensing A, McGreevey L, Chen CJ, Joseph N, et al. PDGFRA activating mutations in gastrointestinal stromal tumors. Science (2003) 299:708–10. doi: 10.1126/science.1079666
4. Wu CE, Tzen CY, Wang SY, Yeh CN. Clinical diagnosis of gastrointestinal stromal tumor (GIST): from the molecular genetic point of view. Cancers (Basel) (2019) 11:679. doi: 10.3390/cancers11050679
5. Demetri GD, von Mehren M, Blanke CD, Van den Abbeele AD, Eisenberg B, Roberts PJ, et al. Efficacy and safety of imatinib mesylate in advanced gastrointestinal stromal tumors. N Engl J Med (2002) 347:472–80. doi: 10.1056/NEJMoa020461
6. Demetri GD, van Oosterom AT, Garrett CR, Blackstein ME, Shah MH, Verweij J, et al. Efficacy and safety of sunitinib in patients with advanced gastrointestinal stromal tumour after failure of imatinib: a randomised controlled trial. Lancet (2006) 368:1329–38. doi: 10.1016/S0140-6736(06)69446-4
7. Demetri GD, Reichardt P, Kang YK, Blay JY, Rutkowski P, Gelderblom H, et al. Efficacy and safety of regorafenib for advanced gastrointestinal stromal tumours after failure of imatinib and sunitinib (GRID): an international, multicentre, randomised, placebo-controlled, phase 3 trial. Lancet (2013) 381:295–302. XXXG.s. investigators. doi: 10.1016/S0140-6736(12)61857-1
8. Chen YY, Yeh CN, Cheng CT, Wu CE, Chiang KC, Chen TW, et al. Fractioned dose regimen of sunitinib for patients with gastrointestinal stromal tumor: a pharmacokinetic and treatment efficacy study. Transl Oncol (2014) 7:620–5. doi: 10.1016/j.tranon.2014.08.004
9. Hsu CC, Wu CE, Chen JS, Tseng JH, Chiang KC, Liu YY, et al. Imatinib escalation or sunitinib treatment after first-line imatinib in metastatic gastrointestinal stromal tumor patients. Anticancer Res (2014) 34:5029–36.
10. Heinrich MC, Corless CL, Demetri GD, Blanke CD, von Mehren M, Joensuu H, et al. Kinase mutations and imatinib response in patients with metastatic gastrointestinal stromal tumor. J Clin Oncol (2003) 21:4342–9. doi: 10.1200/JCO.2003.04.190
11. Miettinen M, Sobin LH, Lasota J. Gastrointestinal stromal tumors of the stomach: a clinicopathologic, immunohistochemical, and molecular genetic study of 1765 cases with long-term follow-up. Am J Surg Pathol (2005) 29:52–68. doi: 10.1097/01.pas.0000146010.92933.de
12. Wang M, Xu J, Zhao W, Tu L, Qiu W, Wang C, et al. Prognostic value of mutational characteristics in gastrointestinal stromal tumors: a single-center experience in 275 cases. Med Oncol (2014) 31:819. doi: 10.1007/s12032-013-0819-x
13. Incorvaia L, Fanale D, Vincenzi B, De Luca I, Bartolotta TV, Cannella R, et al. Type and gene location of KIT mutations predict progression-free survival to first-line imatinib in gastrointestinal stromal tumors: a look into the exon. Cancers (Basel) (2021) 13:993. doi: 10.3390/cancers13050993
14. Quek R, Farid M, Kanjanapan Y, Lim C, Tan IB, Kesavan S, et al. Prognostic significance of KIT exon 11 deletion mutation in intermediate-risk gastrointestinal stromal tumor. Asia Pac J Clin Oncol (2017) 13:115–24. doi: 10.1111/ajco.12603
15. Martin-Broto J, Gutierrez A, Garcia-Del-Muro X, Lopez-Guerrero JA, Martinez-Trufero J, de Sande LM, et al. Prognostic time dependence of deletions affecting codons 557 and/or 558 of KIT gene for relapse-free survival (RFS) in localized GIST: a Spanish Group for Sarcoma Research (GEIS) Study. Ann Oncol (2010) 21:1552–7. doi: 10.1093/annonc/mdq047
16. Guerin A, Sasane M, Keir CH, Gauthier G, Macalalad AR, Wu EQ, et al. Physician underestimation of the risk of gastrointestinal stromal tumor recurrence after resection. JAMA Oncol (2015) 1:797–805. doi: 10.1001/jamaoncol.2015.2407
17. Joensuu H. Adjuvant treatment of GIST: patient selection and treatment strategies. Nat Rev Clin Oncol (2012) 9:351–8. doi: 10.1038/nrclinonc.2012.74
18. Joensuu H, Wardelmann E, Sihto H, Eriksson M, Sundby Hall K, Reichardt A, et al. Effect of KIT and PDGFRA mutations on survival in patients with gastrointestinal stromal tumors treated with adjuvant imatinib: an exploratory analysis of a randomized clinical trial. JAMA Oncol (2017) 3:602–9. doi: 10.1001/jamaoncol.2016.5751
19. El Chafic AH, Loren D, Siddiqui A, Mounzer R, Cosgrove N, Kowalski T. Comparison of FNA and fine-needle biopsy for EUS-guided sampling of suspected GI stromal tumors. Gastrointest Endosc (2017) 86:510–5. doi: 10.1016/j.gie.2017.01.010
20. Demetri GD, von Mehren M, Antonescu CR, DeMatteo RP, Ganjoo KN, Maki RG, et al. NCCN Task Force report: update on the management of patients with gastrointestinal stromal tumors. J Natl Compr Canc Netw (2010) 8 Suppl 2:S1–41. doi: 10.6004/jnccn.2010.0116
21. Amano M, Okuda T, Amano Y, Tajiri T, Kumazaki T. Magnetic resonance imaging of gastrointestinal stromal tumor in the abdomen and pelvis. Clin Imaging (2006) 30:127–31. doi: 10.1016/j.clinimag.2005.09.025
22. Lee MW, Kim SH, Kim YJ, Lee JM, Lee JY, Park EA, et al. Gastrointestinal stromal tumor of the stomach: preliminary results of preoperative evaluation with CT gastrography. Abdom Imaging (2008) 33:255–61. doi: 10.1007/s00261-007-9253-x
23. Lambin P, Leijenaar RTH, Deist TM, Peerlings J, De Jong EEC, Van Timmeren J, et al. Radiomics: the bridge between medical imaging and personalized medicine. Nat Rev Clin Oncol (2017) 14:749–62. doi: 10.1038/nrclinonc.2017.141
24. Song Y, Li J, Wang H, Liu B, Yuan C, Liu H, et al. Radiomics nomogram based on contrast-enhanced CT to predict the malignant potential of gastrointestinal stromal tumor: A two-center study. Acad Radiol (2022) 29:806–16. doi: 10.1016/j.acra.2021.05.005
25. Chu H, Pang P, He J, Zhang D, Zhang M, Qiu Y, et al. Value of radiomics model based on enhanced computed tomography in risk grade prediction of gastrointestinal stromal tumors. Sci Rep (2021) 11:12009. doi: 10.1038/s41598-021-91508-5
26. Wang C, Li H, Jiaerken Y, Huang P, Sun L, Dong F, et al. Building CT radiomics-based models for preoperatively predicting malignant potential and mitotic count of gastrointestinal stromal tumors. Transl Oncol (2019) 12:1229–36. doi: 10.1016/j.tranon.2019.06.005
27. Chen T, Liu S, Li Y, Feng X, Xiong W, Zhao X, et al. Developed and validated a prognostic nomogram for recurrence-free survival after complete surgical resection of local primary gastrointestinal stromal tumors based on deep learning. EBioMedicine (2019) 39:272–9. doi: 10.1016/j.ebiom.2018.12.028
28. van Griethuysen JJM, Fedorov A, Parmar C, Hosny A, Aucoin N, Narayan V, et al. Computational radiomics system to decode the radiographic phenotype. Cancer Res (2017) 77:e104–7. doi: 10.1158/0008-5472.CAN-17-0339
29. Kim HC, Lee JM, Kim KW, Park SH, Kim SH, Lee JY, et al. Gastrointestinal stromal tumors of the stomach: CT findings and prediction of Malignancy. AJR Am J Roentgenol (2004) 183:893–8. doi: 10.2214/ajr.183.4.1830893
30. Zhou C, Duan X, Zhang X, Hu H, Wang D, Shen J. Predictive features of CT for risk stratifications in patients with primary gastrointestinal stromal tumour. Eur Radiol (2016) 26:3086–93. doi: 10.1007/s00330-015-4172-7
31. Ekert K, Hinterleitner C, Horger M. Prognosis assessment in metastatic gastrointestinal stromal tumors treated with tyrosine kinase inhibitors based on CT-texture analysis. Eur J Radiol (2019) 116:98–105. doi: 10.1016/j.ejrad.2019.04.018
32. Zhang QW, Gao YJ, Zhang RY, Zhou XX, Chen SL, Zhang Y, et al. Personalized CT-based radiomics nomogram preoperative predicting Ki-67 expression in gastrointestinal stromal tumors: a multicenter development and validation cohort. Clin Transl Med (2020) 9:12. doi: 10.1186/s40169-020-0263-4
33. Heinrich MC, Maki RG, Corless CL, Antonescu CR, Harlow A, Griffith D, et al. Primary and secondary kinase genotypes correlate with the biological and clinical activity of sunitinib in imatinib-resistant gastrointestinal stromal tumor. J Clin Oncol (2008) 26:5352–9. doi: 10.1200/JCO.2007.15.7461
34. Mazzei MA, Cioffi Squitieri N, Vindigni C, Guerrini S, Gentili F, Sadotti G, et al. Gastrointestinal stromal tumors (GIST): a proposal of a "CT-based predictive model of Miettinen index" in predicting the risk of Malignancy. Abdom Radiol (NY) (2020) 45:2989–96. doi: 10.1007/s00261-019-02209-7
35. Ohshima K, Nagashima T, Fujiya K, Hatakeyama K, Watanabe Y, Morimoto K, et al. Whole-genome and epigenomic landscapes of malignant gastrointestinal stromal tumors harboring KIT exon 11 557-558 deletion mutations. Cancer Res Commun (2023) 3:684–96. doi: 10.1158/2767-9764.CRC-22-0364
36. Chen T, Ye LY, Feng XY, Qiu HB, Zhang P, Luo YX, et al. Performance of risk stratification systems for gastrointestinal stromal tumors: A multicenter study. World J Gastroenterol (2019) 25:1238–47. doi: 10.3748/wjg.v25.i10.1238
37. Martin J, Poveda A, Llombart-Bosch A, Ramos R, Lopez-Guerrero JA, Del Muro JG, et al. and Spanish Group for Sarcoma Research, Deletions affecting codons 557-558 of the c-KIT gene indicate a poor prognosis in patients with completely resected gastrointestinal stromal tumors: a study by the Spanish group for sarcoma research (GEIS). J Clin Oncol (2005) 23:6190–8. doi: 10.1200/JCO.2005.19.554
38. Martin J, Poveda A, Llombart-Bosch A, Ramos R, Lopez-Guerrero JA, Garcia del Muro J, et al. Deletions affecting codons 557-558 of the c-KIT gene indicate a poor prognosis in patients with completely resected gastrointestinal stromal tumors: a study by the Spanish Group for Sarcoma Research (GEIS). J Clin Oncol (2005) 23:6190–8. doi: 10.1200/JCO.2005.19.554
39. Liu B, Liu H, Zhang L, Song Y, Yang S, Zheng Z, et al. Value of contrast-enhanced CT based radiomic machine learning algorithm in differentiating gastrointestinal stromal tumors with KIT exon 11 mutation: a two-center study. Diagn. Interv. Radiol (2022) 28:29–38. doi: 10.5152/dir.2021.21600
40. Xu F, Ma X, Wang Y, Tian Y, Tang W, Wang M, et al. CT texture analysis can be a potential tool to differentiate gastrointestinal stromal tumors without KIT exon 11 mutation. Eur J Radiol (2018) 107:90–7. doi: 10.1016/j.ejrad.2018.07.025
41. Liu X, Yin Y, Wang X, Yang C, Wan S, Yin X, et al. Gastrointestinal stromal tumors: associations between contrast-enhanced CT images and KIT exon 11 gene mutation. Ann Transl Med (2021) 9:1496. doi: 10.21037/atm-21-3811
42. Andersson J, Bumming P, Meis-Kindblom JM, Sihto H, Nupponen N, Joensuu H, et al. Gastrointestinal stromal tumors with KIT exon 11 deletions are associated with poor prognosis. Gastroenterology (2006) 130:1573–81. doi: 10.1053/j.gastro.2006.01.043
43. Shen YY, Ma XL, Wang M, Zhuang C, Ni B, Tu L, et al. Exon 11 homozygous mutations and intron 10/exon 11 junction deletions in the KIT gene are associated with poor prognosis of patients with gastrointestinal stromal tumors. Cancer Med (2020) 9:6485–96. doi: 10.1002/cam4.3212
44. Gao Y, Cheng S, Zhu L, Wang Q, Deng W, Sun Z, et al. A systematic review of prognosis predictive role of radiomics in pancreatic cancer: heterogeneity markers or statistical tricks? Eur Radiol (2022) 32:8443–52. doi: 10.1007/s00330-022-08922-0
45. Milara E, Gomez-Grande A, Tomas-Soler S, Seiffert AP, Alonso R, Gomez EJ, et al. Bone marrow segmentation and radiomics analysis of [(18)F]FDG PET/CT images for measurable residual disease assessment in multiple myeloma. Comput Methods Programs BioMed (2022) 225:107083. doi: 10.1016/j.cmpb.2022.107083
46. Samei E, Hoye J, Zheng Y, Solomon JB, Marin D. Design and fabrication of heterogeneous lung nodule phantoms for assessing the accuracy and variability of measured texture radiomics features in CT. J Med Imaging (Bellingham) (2019) 6:021606. doi: 10.1117/1.JMI.6.2.021606
Keywords: radiomics, CT, gastrointestinal stromal tumor, KIT exon 11, nomogram
Citation: Zhang Y, Yue X, Zhang P, Zhang Y, Wu L, Diao N, Ma G, Lu Y, Ma L, Tao K, Li Q and Han P (2023) Clinical-radiomics-based treatment decision support for KIT Exon 11 deletion in gastrointestinal stromal tumors: a multi-institutional retrospective study. Front. Oncol. 13:1193010. doi: 10.3389/fonc.2023.1193010
Received: 28 March 2023; Accepted: 26 July 2023;
Published: 14 August 2023.
Edited by:
Milena Urbini, Scientific Institute of Romagna for the Study and Treatment of Tumors (IRCCS), ItalyReviewed by:
Emina Talakic, Medical University of Graz, AustriaLinsha Yang, First Hospital of Qinhuangdao, China
Copyright © 2023 Zhang, Yue, Zhang, Zhang, Wu, Diao, Ma, Lu, Ma, Tao, Li and Han. This is an open-access article distributed under the terms of the Creative Commons Attribution License (CC BY). The use, distribution or reproduction in other forums is permitted, provided the original author(s) and the copyright owner(s) are credited and that the original publication in this journal is cited, in accordance with accepted academic practice. No use, distribution or reproduction is permitted which does not comply with these terms.
*Correspondence: Ping Han, hanping_uh@hust.edu.cn; Qian Li, lipb37@163.com
†These authors have contributed equally to this work and share first authorship