 Jingjuan Zhu1,2†
 Xiao Xu
 Man Jiang
 Fangfang Yang
 Yingying Mei
- 1Cancer Precision Medical Center, The Affiliated Hospital of Qingdao University, Qingdao University, Qingdao, China
- 2Qingdao Medical College, Qingdao University, Qingdao, China
Background: Ferroptosis is a type of regulatory cell death (RCD) mode that depends on iron-mediated oxidative damage. It has the potential to improve the efficacy of tumor immunotherapy by modulating the tumor microenvironment (TME). Currently, immunotherapy has significantly improved the overall treatment strategy for advanced hepatocellular carcinoma (HCC), but the distinct immune microenvironment and high tolerance to the immune make massive differences in the immunotherapy effect of HCC patients. As a result, it is imperative to classify HCC patients who may benefit from immune checkpoint therapy. Simultaneously, the predictive value of ferroptosis in HCC and its potential role in TME immune cell infiltration also need to be further clarified.
Methods: Three ferroptosis molecular models were built on the basis of mRNA expression profiles of ferroptosis-related genes (FRGs), with notable variations in immunocyte infiltration, biological function, and survival prediction. In order to further investigate the predictive impact of immunotherapy response in HCC patients, the ferroptosis score was constructed using the principal component analysis (PCA) algorithm to quantify the ferroptosis molecular models of individual tumors.
Results: In HCC, there were three totally different ferroptosis molecular models. The ferroptosis score can be used to assess genetic variation, immunotherapy response, TME characteristics, and prognosis. Notably, tumors with low ferroptosis scores have extensive tumor mutations and immune exhaustion, which are associated with a poor prognosis and enhanced immunotherapy response.
Conclusions: Our study indicates that ferroptosis plays an indispensable role in the regulation of the tumor immune microenvironment. For HCC, the ferroptosis score is an independent prognostic indicator. Assessing the molecular model of ferroptosis in individual tumors will assist us in better understanding the characteristics of TME, predicting the effect of immunotherapy in HCC patients, and thus guiding a more reasonable immunotherapy program.
1 Introduction
Hepatic cancer, especially hepatocellular carcinoma (HCC), which accounts for more than 90% of primary hepatic tumors, is the third leading cause of tumor-related deaths worldwide (1). In recent years, immunotherapy such as immune checkpoint inhibitors (ICIs) has completely replaced systematic chemotherapy as the first-line treatment method for advanced HCC (2, 3). The adoption of the Atezolizumab-Bevacizumab protocol as standard treatment, in particular, heralds the beginning of a revolutionary age (4). However, the complex pathophysiology, distinctive heterogeneity, and high immunological tolerance of HCC contribute significantly to variation in the therapeutic impact of immunotherapy in patients (5, 6). Numerous mechanisms, including immune evasion, dysfunction of effector T lymphocytes, immunosuppression, and poor tumor antigen expression, are present in the microenvironment of HCC (6). Any of these potential processes could be a formidable impediment to immunotherapy. The occurrence and development of HCC are thought to be a multi-step process, and the precise molecular processes leading to the formation of HCC have traditionally been the focus of HCC research. In the past, many researchers have discussed it from different perspectives. For instance, the cholangiocarcinoma-like (CCL) signature (7), the hepatoblastoma 16 gene (HB16) signature (8), the NCI proliferation (NCIP) signature (9), the hepatic stem cells (HS) signature (10), the 65 genes recurrence risk score (RS65 score) (11), the Seoul National University recurrence (SNUR) signature (12), the Hippo pathway signature (13), and the Hoshida signature (14). These molecular typing based on multi-omic data elaborated the genetic and immunological characteristics of HCC patients from different perspectives, which is the cornerstone for directing accurate treatment. Therefore, it is essential to perform molecular classification of HCC patients who may benefit from immune checkpoint therapy.
Ferroptosis is distinct from cell necrosis, apoptosis, and autophagy (15, 16). Iron metabolism disruption and reactive oxygen species (ROS) buildup resulting in lipid peroxidation are the main factors contributing to ferroptosis (17). Induction of ferroptosis has emerged as a promising cancer treatment option in recent years, especially for refractory malignant tumors (18, 19). Ferroptosis-related lipid peroxides encourage dendritic cells to identify, phagocytose, and handle tumor antigens before presenting them to CD8+T lymphocytes as a recognition signal. CD8+T cells release IFN-γ, which inhibits the cystine absorption of tumor cells and activates cytotoxic T lymphocytes, hence enhancing tumor immunotherapy (20–22). These findings suggest that ferroptosis has a profound impact on TME and immunotherapy. Ferroptosis provides an innovative idea for the development of new candidate drugs for the treatment of refractory cancers. After acquired resistance to EGFR-TKIs, EGFR-mutated lung cancer cells showed increased sensitivity to ferroptosis inducers (23). Jiang et al. reported that TYRO3 can promote the development of the tumor microenvironment by reducing the ratio of M1/M2 macrophages while inhibiting TYRO3 can promote tumor ferroptosis and make drug-resistant tumors sensitive to PD-1 therapy (24). A recent study found that the small molecule MMRi62 can induce ferroptosis in pancreatic ductal adenocarcinoma (PDAC) cells carrying KRAS and/or p53 gene mutations, thus inhibiting tumor growth and preventing metastasis (25). These recent studies indicate that the induction of ferroptosis may overcome the drug resistance of targeting and immunotherapy. When transforming ferroptosis into clinical application, it will be particularly important to develop specific therapies that can induce ferroptosis in cancer cells while avoiding systemic adverse reactions. In this regard, nanoparticle ferroptosis inducers provide unique advantages (26). In 2021, the scientific research team led by Jianlin Shi proposed a non-ferrous ferroptosis-like strategy based on a hybrid CoMoO4-phosphomolybdic acid nanosheet (CPMNS). The ferroptosis-like cell death process is triggered by increasing ROS, depleting GSH (glutathione), and regulating GPX4 activity. Both in vitro and in vivo results have proved significant anticancer efficacy, indicating that this ferroptosis-like death strategy supported by CPMNS extends the applicability of the concept of ferroptosis to the process of ferroptosis-like death induced by non-ferrous metals, which will contribute to future progress in the field of cancer treatment programs (27). Last but not least, we currently lack biomarkers to mark ferroptosis in the body. The exploration of suitable biomarkers will facilitate the development of further in vivo research and clinical surveillance (28, 29).
The inflammatory state of TME has been proven to be essential for the occurrence, development, invasion, and metastasis of almost all solid tumors (30). In most cases, HCC is the result of chronic liver inflammation that leads to the formation of a complex TME composed of immune cells and stromal cells. TME involves the development of metastasis and drug resistance. This has become a challenge in the treatment of HCC patients because it influences the response to targeted and immunotherapy (31). In the past decade, immunotherapy has developed rapidly and has been recognized as a key strategy for controlling the progression of malignant tumors. PD-1/PD-L1 inhibitors have been approved for many solid tumors and hematological malignancies, including non-small cell lung cancer, melanoma, urothelial carcinoma, esophageal carcinoma, renal cell carcinoma, and Hodgkin’s lymphoma (32). According to the results of the IMbrave150 study, Atezolizumab combined with bevacizumab has been approved for the first-line treatment of unresectable locally advanced or metastatic hepatocellular carcinoma (33). Another promising immune checkpoint inhibitor treatment strategy is the combination of Durvalumab (PD-L1 inhibitor) and Tremelimumab (CTLA-4 inhibitor). PD-L1 and CTLA-4 are both inhibitory molecules expressed in T cells. Treatment with these two antibodies recently showed promising results in the phase III HIMALAYA clinical trial (NCT03298451). Their effectiveness in improving the survival of HCC patients highlights the role of T cells in the treatment of HCC (34). Chimeric antigen receptor T cell (CAR-T) therapy is an innovative type of tumor immunotherapy. Through genetic engineering technology, T cells can specifically recognize tumor-related antigens, thus exerting anti-tumor effects (35). To date, five CAR-T cell therapies have been approved for hematological malignancies. Several CAR-T therapies are currently undergoing clinical trials for HCC targeting a variety of surface and intracellular antigens (36). It is noteworthy that the characteristics of hypoxia and nutrient deprivation of TME have seriously weakened the adaptability and efficacy of CAR-T cells, emphasizing the need for more complex engineering strategies (36). Another new option for HCC immunotherapy is adaptive T cell transfer of gamma-delta T cells ( γδ T cells). Low infiltration of γδ T cells in peritumoral liver tissue is associated with a higher recurrence rate of HCC and predicts postoperative recurrence (37). Adoptive transfer of allogeneic-γδ T cells in combination with local interventional therapy has an encouraging clinical effect against HCC and intrahepatic cholangiocarcinoma (ICC) (38). At present, many drugs targeting the tumor microenvironment are under development, including synthetic drugs, biotherapeutics, and vaccines. Personalized treatment regimens will be needed to achieve maximum clinical benefits for patients.
Epithelial-mesenchymal transformation (EMT) in TME was originally thought to primarily be associated with invasive metastasis of cancer cells, but new research has revealed that EMT is an important mechanism of tumor treatment resistance (39–41). Previous research has demonstrated that tumor microenvironment (such as hypoxia), numerous growth factors, and carcinogenic-associated signaling pathways (such as TGF-β, Notch, MAPK, and KRAS signaling pathways), can activate the EMT process (42–44). Mariathasan et al. gathered a set of EMT marker genes, including EMT1 (breast cancer) (45), EMT2 (urothelial carcinoma) (46), EMT3 (metastatic melanoma) (47), angiogenesis indicators (48), and WNT targets (49). They studied a large number of patients with urothelial carcinoma who were taking an anti-PD-L1 medication and discovered that a favorable immune response was connected to CD8+T effector cell phenotype and tumor mutation burden (TMB) (50). Schreiber et al. found that inhibition of glutathione peroxidase 4 (GPX4) induced ferroptosis in mesenchymal resistant cancer cells (51). Similar to GPX4-dependent mesenchymal resistant cancer cells, persistently drug-resistant cancer cells are also highly sensitive to ferroptosis (52). As a result, further understanding the role of ferroptosis in the tumor microenvironment and EMT regulation would aid in the investigation of tumor drug resistance mechanisms.
In this study, we screened three hub genes and performed pan-cancer analysis. The expression verification and survival analysis were carried out in the validation queue of our hospital. We structured three ferroptosis molecular patterns and found that their prognosis and TME characteristics were significantly different. Then we identified the ferroptosis scoring system, which can accurately predict the effect of immunotherapy, suggesting that ferroptosis has a significant impact on the treatment of advanced HCC.
2 Material and methods
2.1 Data collection
This study analyzed mRNA expression data and clinical information of 371 members in the TCGA-LIHC cohort available in The Cancer Genome Atlas (TCGA, https://portal.gdc.cancer.gov/repository) database. Additionally, 167 samples from the GSE76427 cohort were obtained from the Gene Expression Omnibus (GEO) database (https://www.ncbi.nlm.nih.gov/geo). To further validate the results, we analyzed the mRNA expression data of 240 samples from the International Cancer Genome Consortium (ICGC, https://dcc.icgc.org/) database.
The TCGA-LIHC copy number variation (CNV) information is derived from the UCSC Xena database (https://xena.ucsc.edu/). The TCGA-LIHC clinical information is derived from the UCSC Xena database and research published by the TCGA team in Cell (53). Afterward, FRGs were obtained from FerrDb, which consists of a database of ferroptosis regulators, markers, and associations between ferroptosis and various diseases (54). After removing duplicate genes, in all, 258 FRGs were available for analysis (Supplementary Table 1). In addition, the data contained in TCGA, GEO, ICGC, and FerrDb is publicly available. TCGA, GEO, and ICGC policies and guidelines for data acquisition and publication were strictly followed in the conduct of this study.
2.2 FRGs screening and protein-protein interaction network construction
The RNA high-throughput sequencing data in FPKM form was converted to TPM using the “TCGAbiolinks” (version, 2.26.0) R package (55). The “limma” (version, 3.54.0) package was used to analyze 373 HCC samples and 49 paracancerous tissues from the TCGA-LIHC cohort (56). Thus, differentially expressed FRGs were identified (FDR<0.01, |logFC|>1). Univariate Cox regression analysis was performed among FRGs, and p<0.01 was used as a screening condition to identify potential prognostic genes affecting overall survival (OS). Based on these FRGs, the PPI between proteins were generated by the STRING database. Following this, hub genes were identified via Cytoscape (version, 3.9.0). The confidence score was set as a score<0.4.
2.3 Pan-cancer analysis
To analyze the differential expression and survival prediction of hub genes in 33 cancers, we collected gene expression information and relevant clinical data from the TCGA database for 33 tumor types.
2.4 Immunohistochemical analysis of clinical validation cohort
We obtained 69 surgical specimens of hepatocellular carcinoma and 41 matched paracancerous tissues from the Affiliated Hospital of Qingdao University (hereinafter referred to as our hospital), as well as the corresponding clinical information. To assess the expression levels of hub genes (HRAS, SLC7A11, and SLC2A1), immunohistochemistry (IHC) was accomplished by GTVisionTM III Detection Systems (Genetech, Shanghai, China) and antibodies (18295-1-AP, ab115730, ab37185) according to the manufacturer’s instructions. The immunohistochemical staining was assessed by two pathologists who were uninformed of the clinical information. When their assessments differ, the third pathologist will undertake an independent examination. For each pathological section, we observed ten optical fields under a high-power lens (× 400). We took the IHC staining score as the final staining judged criteria. IHC staining score = staining area score × staining intensity score. The staining area score was estimated on a scale of 0-4 (0, ≤10%; 1, 11-25%; 2, 26-50%; 3, 51-75%; 4, ≥75%); the staining intensity score was classified as 0 (negative), 1 (weak), 2 (moderate), or 3 (strong). We grouped the IHC staining score to demonstrate the relationship between hub gene expression and patient survival. The IHC staining score below six was defined as low expression group, while the score over six was defined as high expression group. Moreover, the differences in IHC staining scores of hub genes between tumors and adjacent normal tissues were performed using the Wilcoxon rank sum test.
2.5 Identification of the ferroptosis molecular patterns
We recognized the ferroptosis molecular patterns on the basis of FRGs mRNA expression profiles by using the “ConsensuClusterPlus” package (57). The patients from the TCGA-LIHC and GSE 76427 were then classified for further investigation. The consensus clustering algorithm calculated the number and stability of clusters.
2.6 Enrichment of functional properties and TME immune infiltration in ferroptosis
In order to search for potential biological behaviors between ferroptosis molecular patterns, the GO and KEGG functional analyses were performed by “clusterProfiler” (version, 4.6.0) package (FDR<0.05).
From the MSigDB database, we obtained the gene set “c2.cp.kegg.v7.4.symbols” for our GSVA analysis by “GSVA” (version, 1.46.0) packages (FDR<0.05). In general, GSVA is an unsupervised, nonparametric approach for estimating the levels of variation within biological pathways and processes in expression datasets.
The mechanism of TME features generation was then investigated using a Single Sample Gene Set Enrichment Analysis (ssGSEA) (58). According to the expression of a set of tumor-infiltrating immune cells (TIICs) and immune function marker genes obtained from Bindea et al., the TIICs enrichment score and immune function of each HCC sample were quantitatively assessed. Mariathasan et al. identified and characterized a series of gene sets that relate to the following biological processes: antigen processing machinery; epithelial-mesenchymal transition (EMT) markers consisting of EMT1, EMT2, and EMT3; angiogenesis signature; Pan-fibroblast TGF-β response signature (Pan-FTBRS); WNT targets; FGFR3 related genes (Supplementary Table 2) (50). We retrieved associated gene sets from the MSigDB database, to further illuminate the processes by which ferroptosis influences the tumor immune microenvironment including the following: TGF-EMT down-regulation signal pathways; TGF-EMT up-regulation signal pathways; MAPK signal pathways; NOTCH signal pathways; KRAS up-regulation signal pathways; KRAS down-regulation signal pathways; hallmark-hypoxia; HIF-1 signal pathways to increase oxygen delivery; HIF-1 signal pathways to decrease oxygen consumption.
2.7 The ferroptosis score
We identified differentially expressed genes (DEGs) associated with the ferroptosis pattern through the “limma” package and screened prognostic genes using Univariate Cox regression models (p<0.05). We used principal component analysis (PCA) to quantify the ferroptosis molecular models of individual tumors and constructed a scoring system, which was termed the ferroptosis score. We defined the ferroptosis score as follows: Ferroptosis score =∑ (PC1i + PC2i), where i denotes the expression of prognostic DEGs associated with ferroptosis molecular models (59, 60). Patients were divided into low and high ferroptosis score groups in accordance with the threshold of -23.27889 established by “Survminer”.
The independent prognostic value of the ferroptosis score was determined with Univariate and Multivariate Cox analysis. Next, a prediction model was constructed by integrating the ferroptosis score and other independent clinical risk factors according to the prognostic multivariate profile. A nomogram plot was used to visualize the relationship between the variables in the prediction model by following a certain scale in the same plane. A prognostic calibration plot was used for fit analysis of the model to the actual situation and to determine predictive efficacy.
2.8 Assessment of tumor mutation burden and immunotherapy response
Based on the MAF files, somatic mutation data was visualized using the “maftools” (version, 2.14.0) package (61). We calculated the TMB of each patient as follows: TMB= (total count of variants)/(total length of exons).
In addition, Jiang et al. proposed TIDE method in order to simulate immune escape mechanisms in cancer, including T cell dysfunction and T cell rejection (62). In this study, TIDE was used to assess response to immunotherapy. A higher TIDE score not only indicates that the tumor has an immune avoidance phenotype, but also predicts a poor response to ICIs in cancer patients.
2.9 Chemotherapeutic drug sensitivity prediction
The sensitivity of ferroptosis to chemotherapeutic agents was assessed by the Genomics of Drug Sensitivity in Cancer (GDSC; https://www.cancerrxgene.org/) database (63). The half maximum inhibitory concentration (IC50) was calculated by the “pRRophetic” (64).
2.10 Statistical analysis
We used Wilcoxon rank-sum tests for comparing the two groups and Kruskal-Wallis tests for assessing multiple comparisons. Based on the output from the “survminer” package, a dividing point was determined for each subgroup. In order to analyze the survival times of different subgroups, Kaplan-Meier curves and log-rank tests were used.
3 Results
3.1 The landscape of genetic variation of FRGs in hepatic cancer
A total of 258 ferroptosis-related genes (FRGs) were included in the analysis. We found that in the TCGA-LIHC cohort, 30.6% of FRGs (79/258), was differentially expressed in HCC tissues and non-tumor para-cancer tissues (FDR<0.01, |logFC|>1; Supplementary Table 3). As a result of a subsequent Univariate Cox regression analysis, 58 FRGs were correlated with overall survival (OS) (p<0.01; Supplementary Table 4). By cross-overlapping 79 differentially expressed FRGs and prognostic related genes, we obtained 32 differentially expressed prognostic related FRGs (Figure 1A). The forest map displayed the Hazard ratios of the 32 FRGs in the single-factor Cox regression analysis (Figure 1B). The heat map showed that the expression levels of 32 FRGs were significantly different between tumor tissues and normal tissues. FRGs were significantly enriched in tumor tissues (Figure 1C). We also examined the incidence of somatic mutations and copy number variations (CNVs) for FRGs. According to the position of the 32 FRGs on the chromosome, the CNV changes are shown in Figure 1D. As a result of the CNV variation frequency analysis, CNV variation was very common in FRGs, most of which focused on copy number amplification (Figure 1E). We found that CDKN2A had the highest frequency of mutation in HCC samples, followed by NARS (Figure 1F). The above analysis presented that the expression of FRGs in normal liver tissue and HCC tissue was highly heterogeneous, suggesting that the modifications in the expression of FRGs may contribute significantly to the occurrence and development of hepatocellular carcinoma.
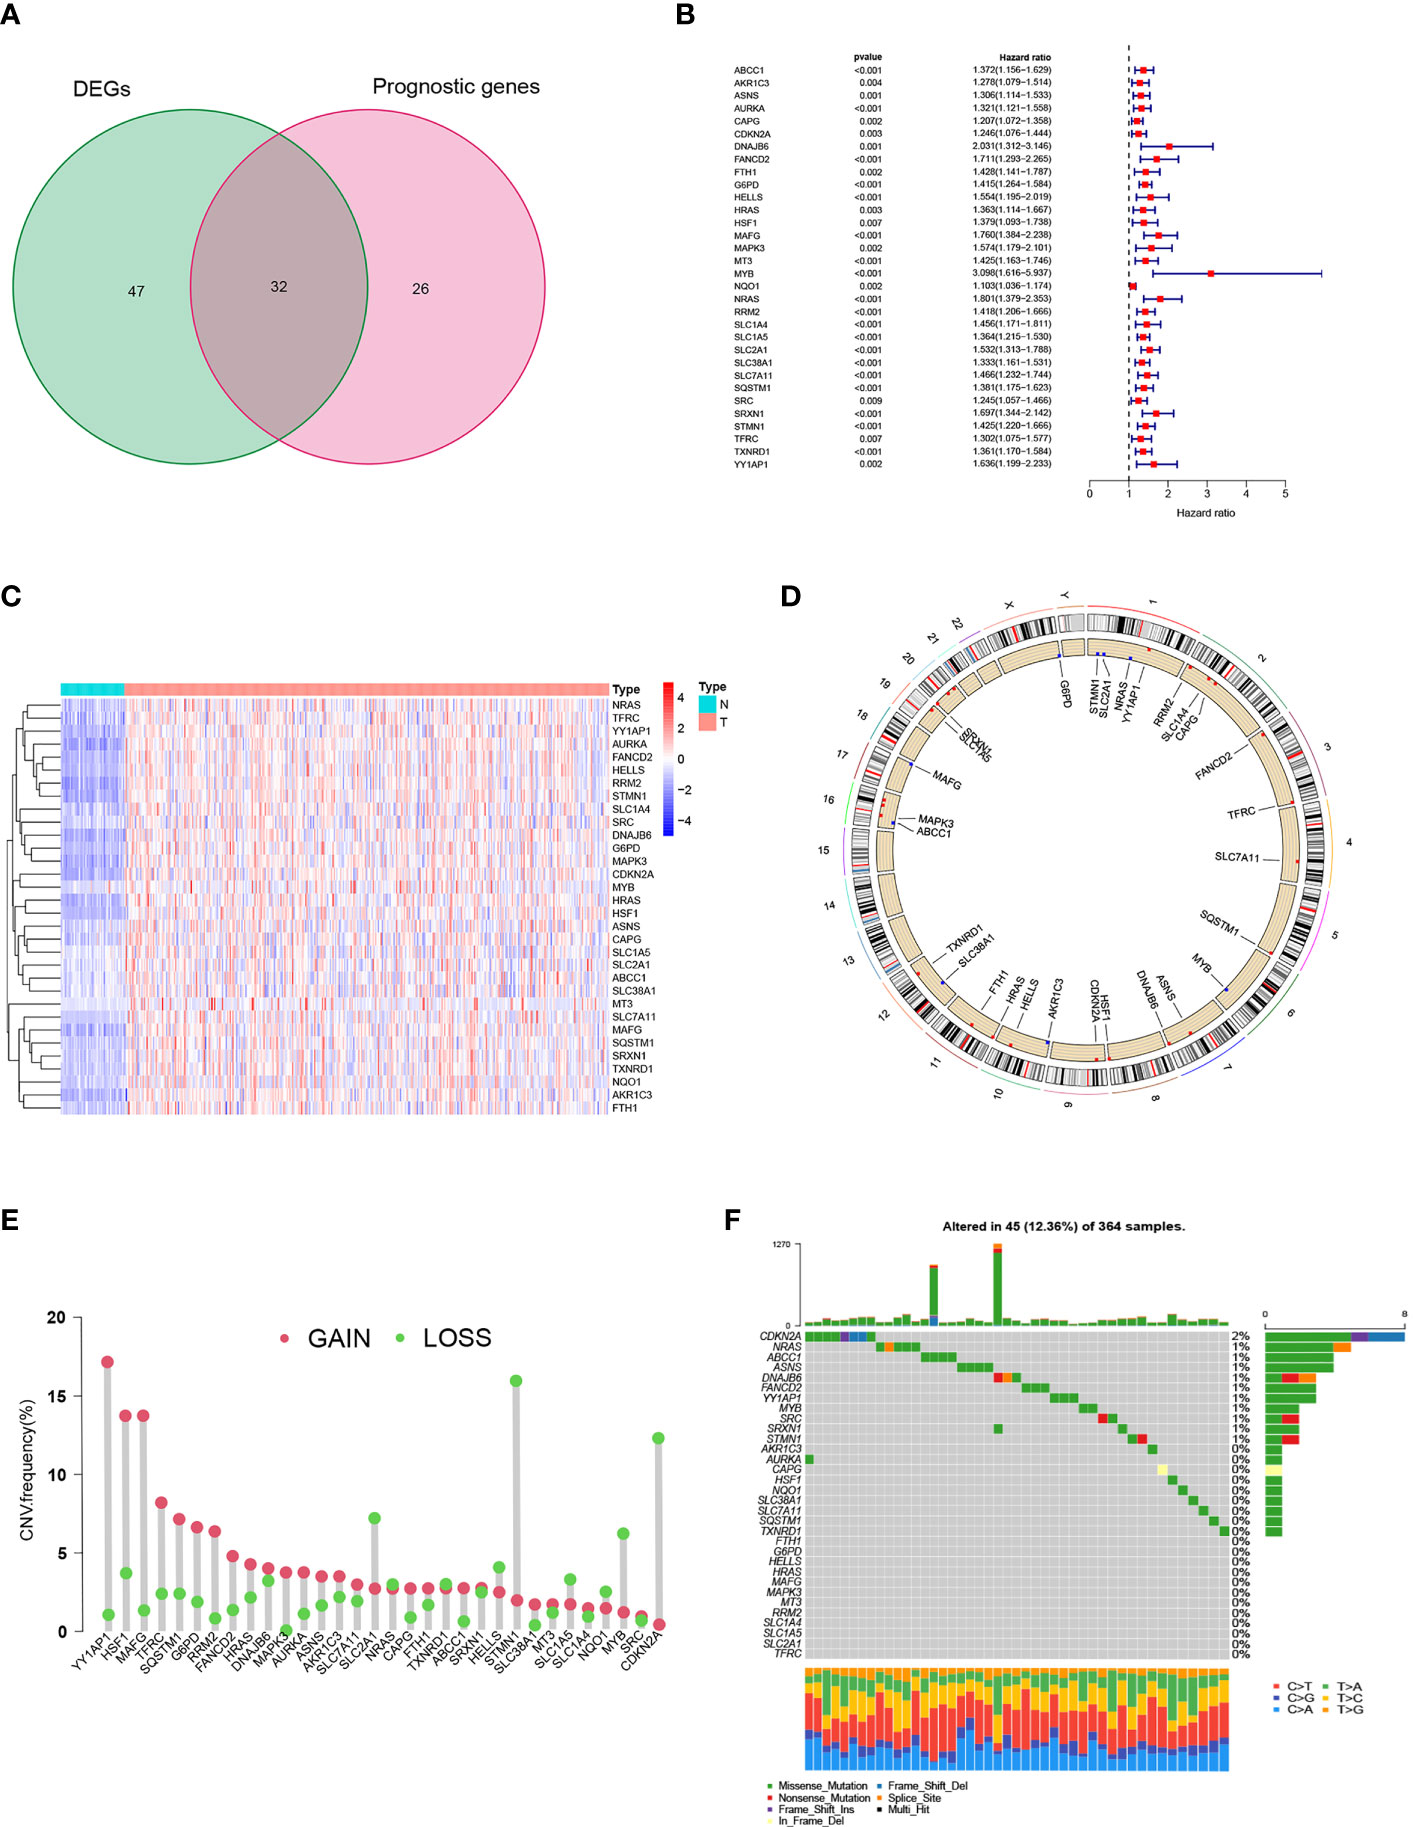
Figure 1 Prognostic ferroptosis-related gene (FRGs) differentially expressed in TCGA. (A) Venn graph showing the intersection of prognostic genes and differentially expressed genes. (B) Forest plots illustrating the Univariate Cox regression analysis of overlapping genes. (C) Expression of overlapping genes in tumor tissue. (D) CNV alteration locations for 32 FRGs. (E) The frequency of CNV variation of 32 FRGs. Alteration frequency was represented by the height of the column. Green dots indicating deletions; red dots indicating amplifications. (F) The mutation frequency of 32 FRGs in 364 patients with HCC. One patient was represented by each column. The upper bar plot indicated the extent of tumor mutations. Numbers on the right indicated the frequency of mutations in each gene. The right bar plot showed the proportions of the different types of variants. Stacked bar plot of each sample was able to show the fraction of conversions.
3.2 Hub gene screening and Pan-cancer analysis
We generated a protein-protein interaction network (PPI) for FRGs and identified three hub genes via Cytoscape, including HARS, SLC7A11, and SLC2A1 (Figure 2A, Supplementary Figure 1A). These three FRGs showed significant differential expression in matched samples of cancer and Normal paracancerous tissue in TCGA-LIHC cohort (Figure 2B). Pan-cancer analysis demonstrated that these three FRGs were significant differential expression in most cancers (Figures 2C–E). The survival analysis of these three genes also showed their potential role in survival prediction (Figures 2F–H).
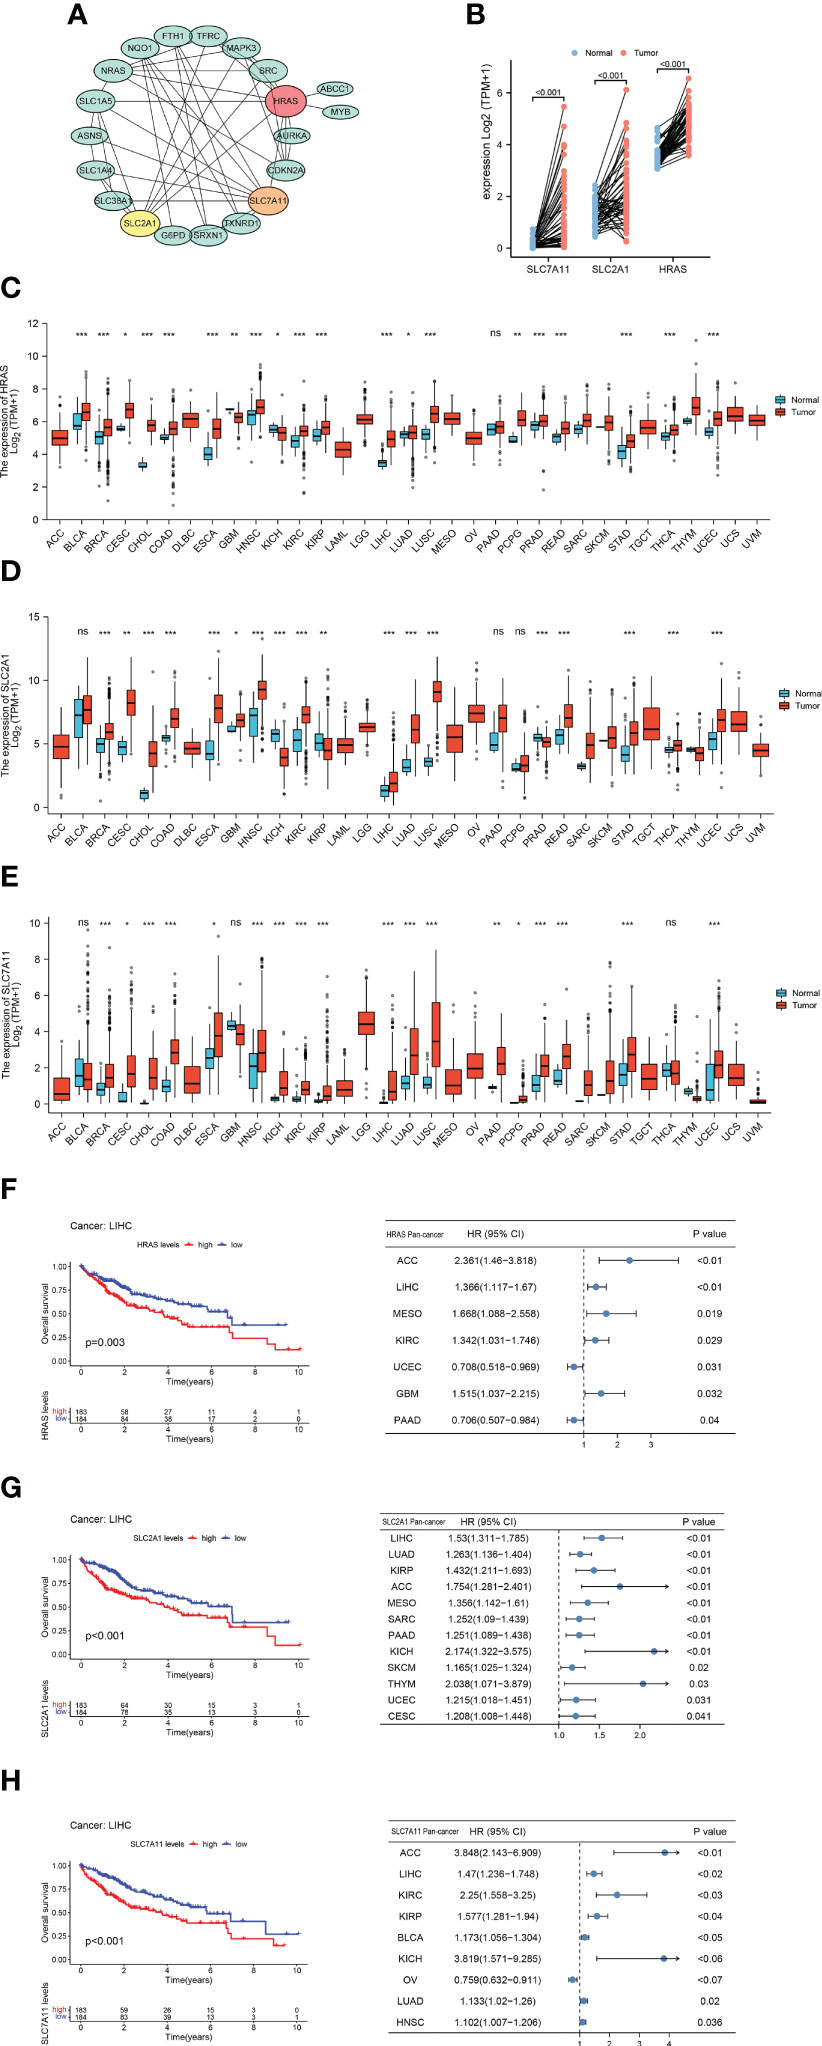
Figure 2 Hub Gene Screening and Pan-carcinoma Analysis. (A) Identified PPI hub genes. (B) Differential expression of HRAS, SLC2A1, and SLC7A11 in HCC paired samples. (C) Differential expression of HRAS in 33 cancers. ns, not significant; *p<0.05; **p<0.01; ***p<0.001. (D) Differential expression of SLC2A1 in 33 cancers. ns: not significant; *p<0.05; **p<0.01; ***p<0.001. (E) Differential expression of SLC7A11 in 33 cancers. ns: not significant; *p<0.05; **p<0.01; ***p<0.001. (F) Kaplan-Meier survival curve of HRAS and pan-carcinoma Univariate Cox regression analysis. (G) Kaplan-Meier survival curve of SLC2A1 and pan-carcinoma Univariate Cox regression analysis. (H) Kaplan-Meier survival curve of SLC7A11 and pan-carcinoma Univariate Cox regression analysis.
3.3 Clinical cohort verification
In order to evaluate the expression level of hub genes (HRAS, SLC7A11 and SLC2A1) in hepatocellular carcinoma, we conducted immunohistochemical (IHC) analysis. The expression of HRAS, SLC2A1, and SLC7A11 was positive in the majority of specimens from the validation cohort in our hospital. Among them, SLC7A11 has strongly stained in 38 (55.1%) specimens, HRAS was strongly stained in 41 (59.4%) specimens, and SLC2A1 was strongly stained in 32 (46.4%) specimens (Figure 3A; Supplementary Table 5). Finally, the Kaplan-Meier curve showed that patients with high gene expression had a shorter survival than patients with low gene expression (Figure 3B).
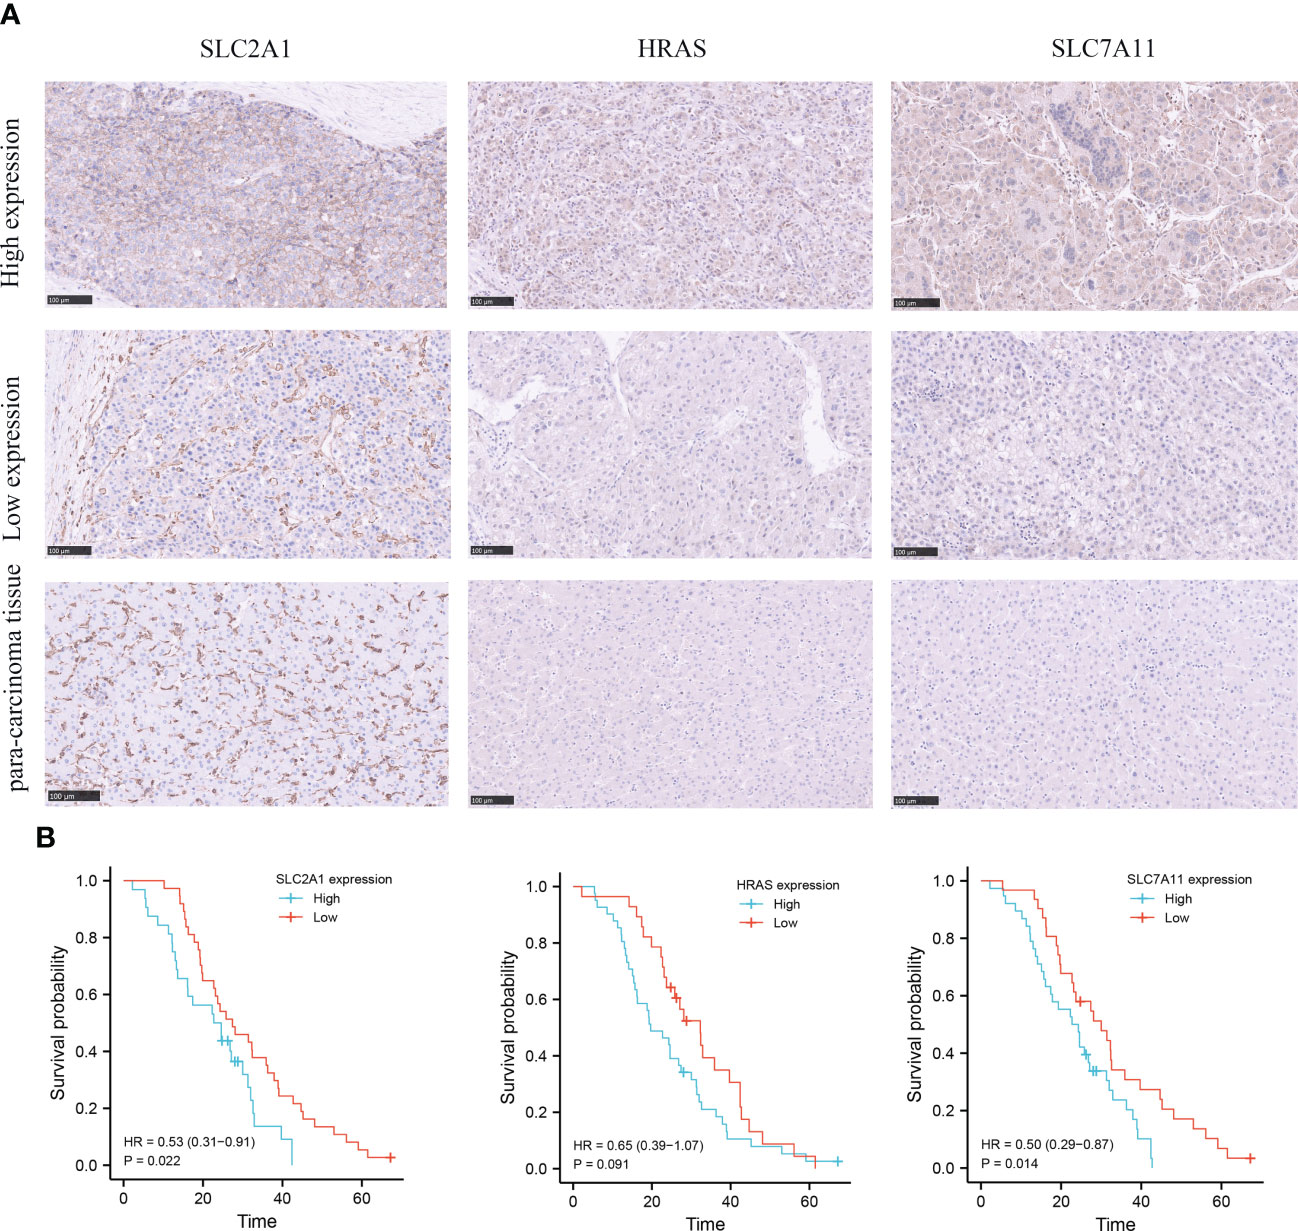
Figure 3 Immunohistochemical (IHC) analysis of clinical validation cohort. (A) Comparison of SLC2A1, HRAS, and SLC7A11 expression in HCC tissues and adjacent tissues. (B) Survival curves of HCC patients with high and low SLC2A1, HRAS, and SLC7A11 expression.
3.4 Ferroptosis molecular patterns with different TME features and function
According to the expression of the three FRGs in the TCGA-LIHC and GSE76427 cohorts, HCC patients were subdivided into three molecular patterns by unsupervised cluster analysis, termed ferroptosis clusters A, B, and C (A: n=194, B: n=107, C: n=236; Supplementary Figure 1B). It was demonstrated by the principal component analysis (PCA) that the three subtypes were entirely separate (Figure 4A). Among the three molecular patterns, the three FRGs were significantly highly expressed in cluster B, and appreciably low expressed in cluster A (Figure 4B). Prognostic analysis revealed an exceedingly favorable outcome in ferroptosis cluster A, whereas cluster B had the most detrimental prognosis (p<0.001; Figure 4C).
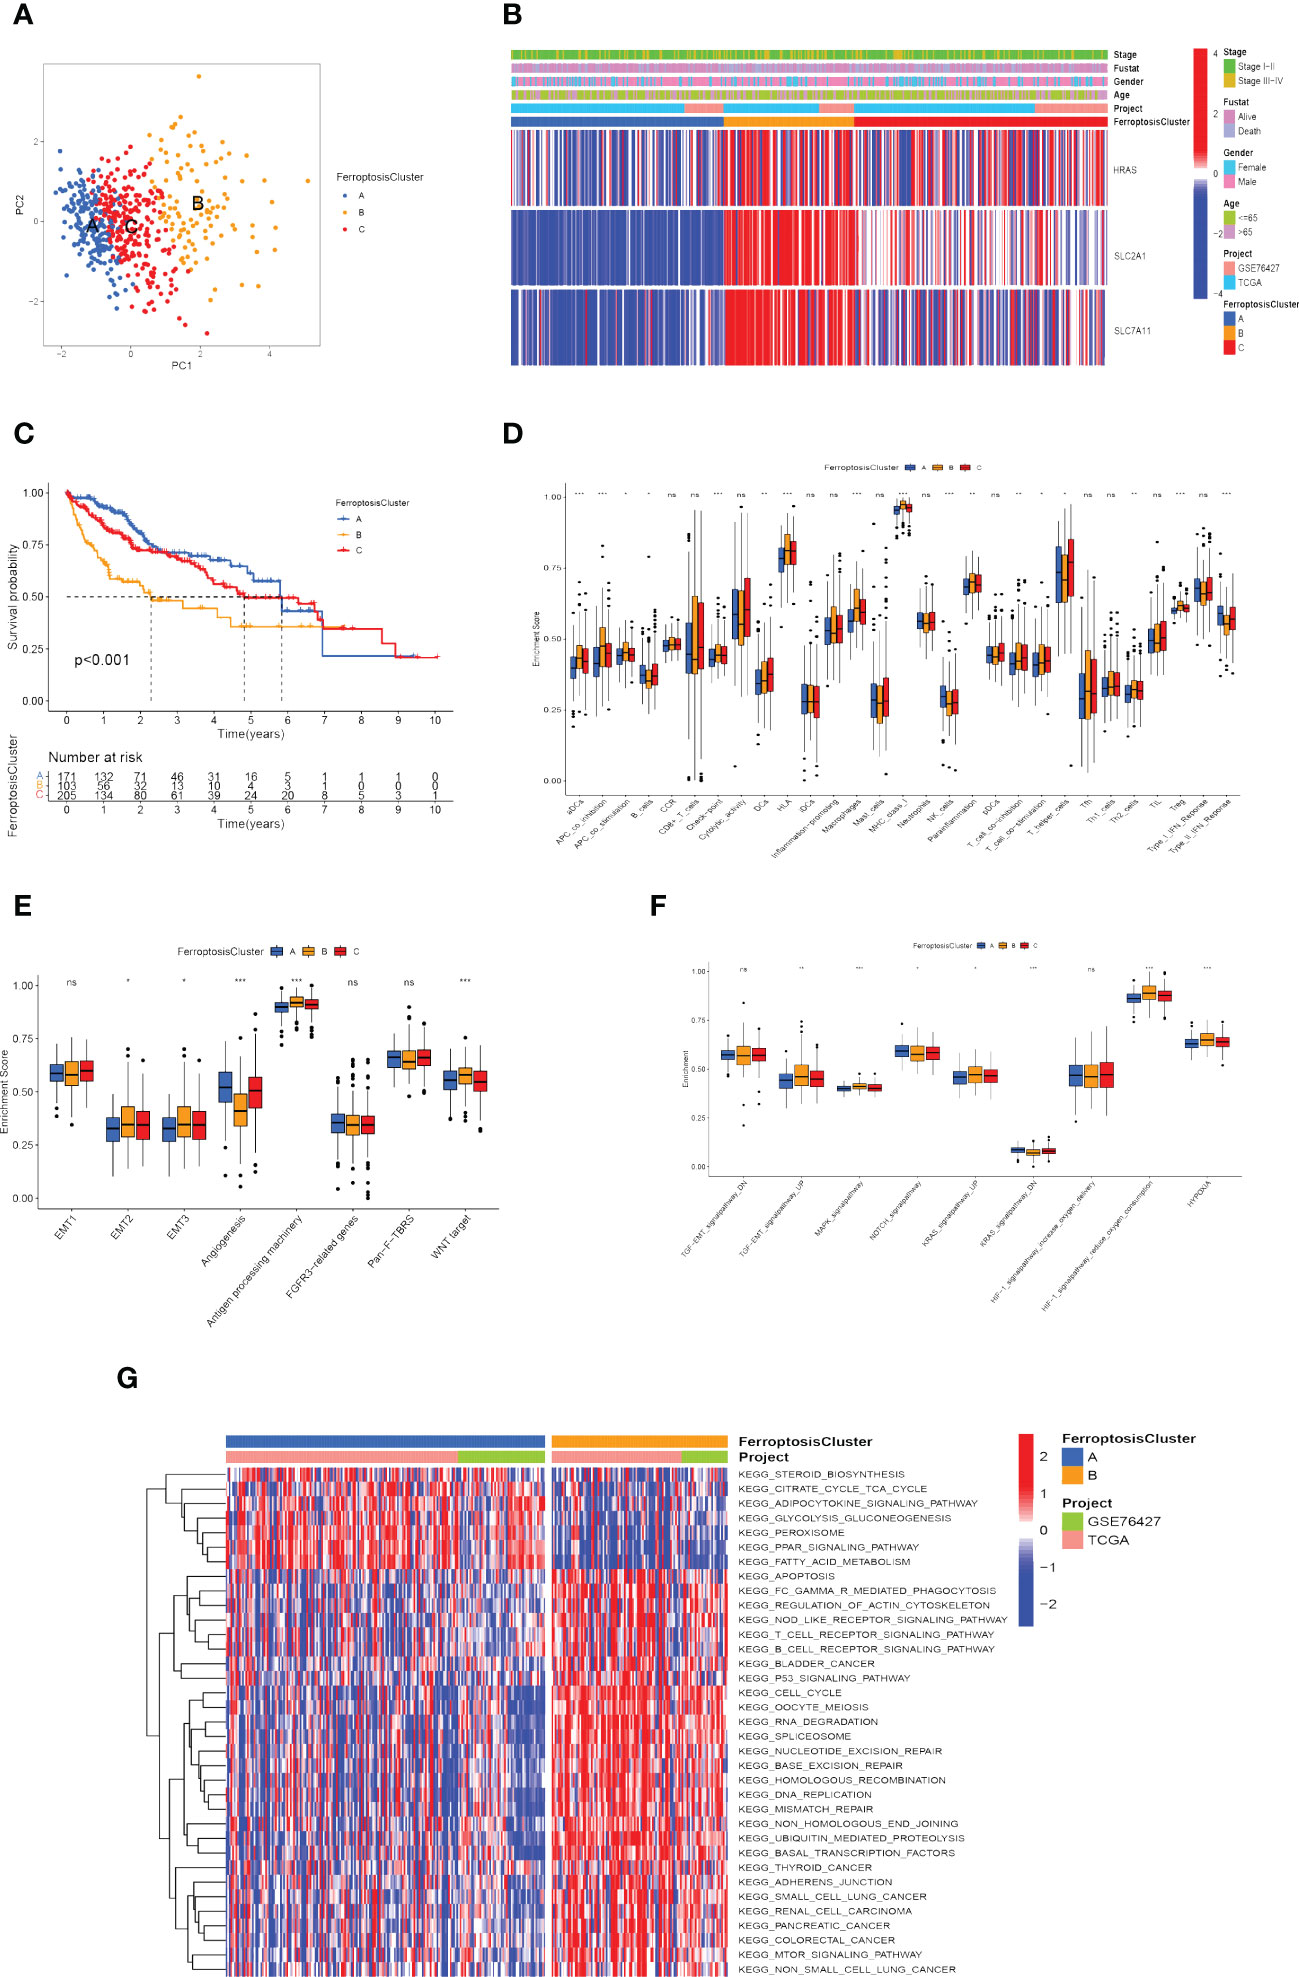
Figure 4 Recognition of ferroptosis molecular patterns with specific TME features and functional enrichment analysis. (A) Principal component analysis of hub gene expression profiles distinguished three ferroptosis clusters, A (blue), B (yellow), and C (red). (B) Heat map displaying the correlation between the hub genes expression and ferroptosis clusters. (C) Kaplan-Meier curves for the three molecular patterns of HCC patients. (D) Box plots displayed the levels of immune infiltration in the three patterns. ns, not significant; *p<0.05; **p<0.01; ***p<0.001. (E, F) Differences in stromal activation pathway (E) and carcinogenesis-related pathways (F) in the three ferroptosis clusters. ns, not significant; *p<0.05; **p<0.01; ***p<0.001. (G) GSVA analysis revealed distinct activations of biological pathways in ferroptosis clusters. Blue represented the inhibition pathway and red represented the activation pathway.
Afterward, we evaluated the correlation among these patterns and TME features. Immune cell infiltration varied greatly between the three molecular patterns, especially for ferroptosis cluster A, which was remarkably rich in NK cells and type-II IFN (IFN-γ) response. Ferroptosis cluster B was abounding in activated dendritic cells (aDCs), antigen-presenting cells (APCs), check-point, human leukocyte antigen (HLA), macrophages, regulatory T cells (Tregs), major histocompatibility complex (MHC) class I (Figure 4D). We also explored the relationship between ferroptosis clusters and various biological processes. The results manifested that EMT2, EMT3, antigen processing machinery, and WNT targets scored the highest in ferroptosis cluster B, as well as angiogenesis signature, which was significantly enriched in ferroptosis cluster A (Figure 4E). In particular, ferroptosis cluster B was found to be significantly enriched in hypoxia-related signaling pathways and EMT-related signaling pathways (such as TGF-β, MAPK, and KRAS signaling pathway) (Figure 4F). We further assessed the hypoxia status of the three ferroptosis molecular patterns using the Buffa Hypoxia Score and found equally significant differences (Supplementary Figure 1C) (65). Hypoxia and EMT are two important tumor microenvironmental biological processes that significantly affect the prognosis of HCC patients, which makes it necessary to pay attention to their relationship with ferroptosis. Their interaction may be an important clue to observing the effect of ferroptosis on immunotherapy and the prognosis of hepatocellular carcinoma.
Subsequently, we explored the differences in ferroptosis molecular patterns in biological signaling pathways. As shown in Figure 4G, ferroptosis cluster A was markedly enriched in fatty acid metabolism, adipocytokine signaling pathway, glycolysis and gluconeogenesis, and PPAR signaling pathways. The ferroptosis cluster B presented enrichment pathways prominently related to the p53 signaling pathway, T cell receptor signaling pathway, adherens junction, mTOR signaling pathway, Oocyte meiosis, ubiquitin-mediated proteolysis, cell cycle, and DNA damage repair. Therefore, it is reasonable to speculate that cluster B may be associated with invasive HCC, while cluster A may be associated with metabolic disorders.
3.5 Generation of ferroptosis-related genomic patterns
As a means of further detecting potential biological processes among the ferroptosis molecular patterns, we determined 1139 DEGs related to ferroptosis molecular patterns, then performed GO and KEGG enrichment analysis (Figures 5A, B). As expected, DEGs were enriched in a number of molecular functions related to cell-substrate junction, focal adhesion, ficolin-1-rich granule, regulation of telomerase RNA localization to Cajal body, Fc epsilon RI signaling pathway, Cholesterol metabolism, which confirmed again that ferroptosis molecular patterns played an effective role in tumor immune activation, invasion and proliferation, and metabolic disorder.
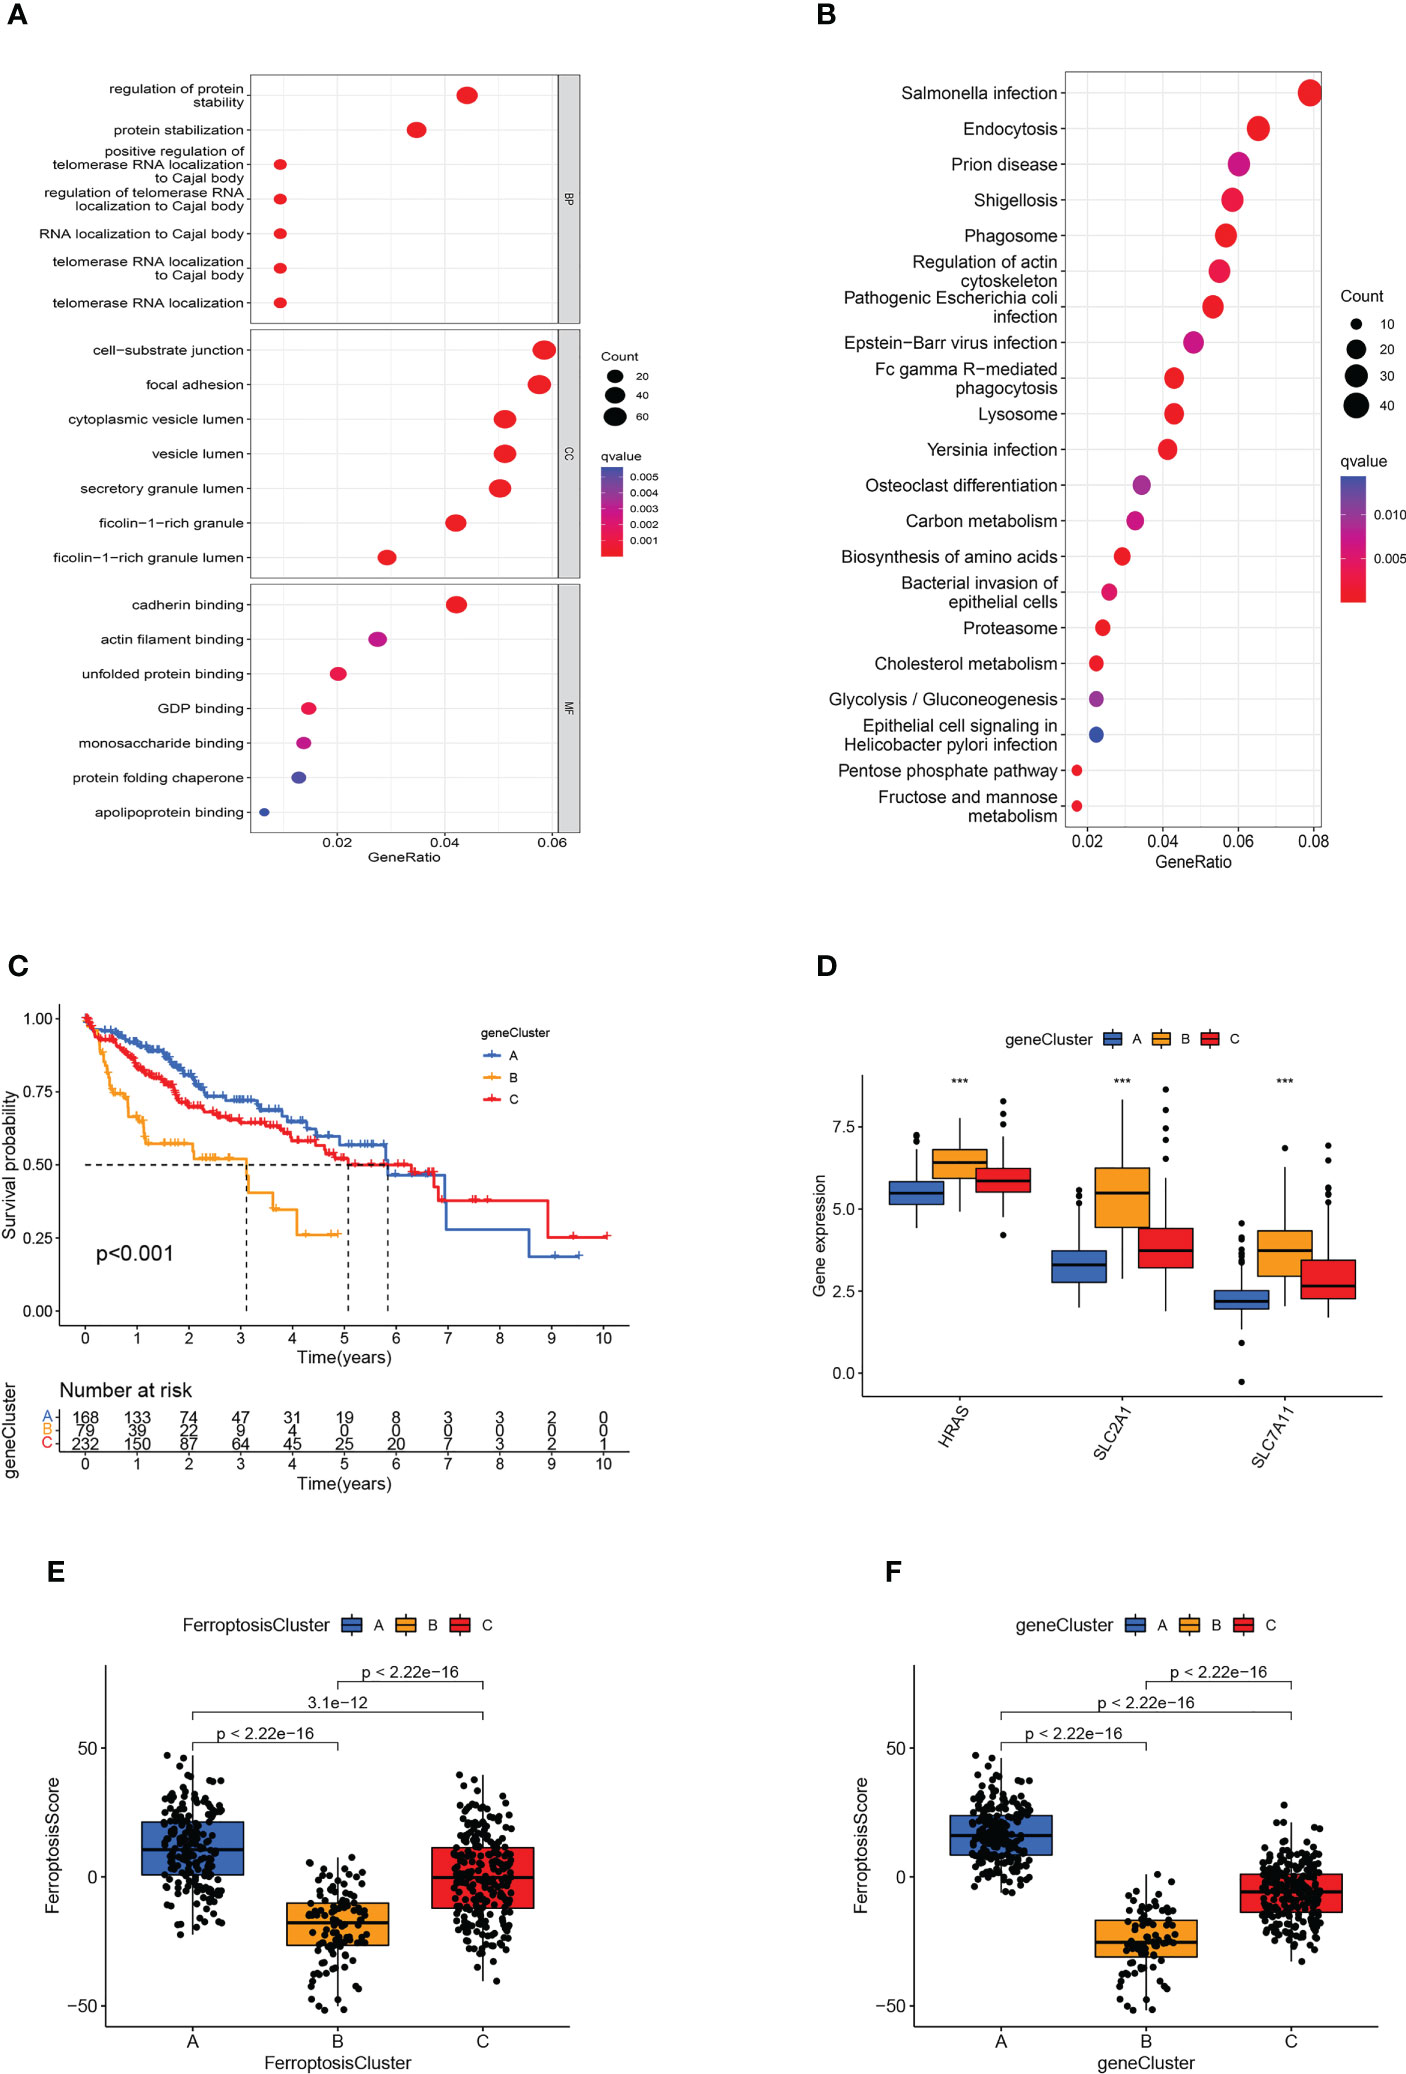
Figure 5 Generation of ferroptosis-related genomic patterns and the ferroptosis score. (A, B) GO (A) and KEGG (B) analysis based on differentially expressed genes. (C) Kaplan-Meier curves for the three gene clusters of HCC patients. (D) Box plots showed hub gene expression in the three gene clusters. ***p<0.001. (E, F) Box plots displayed the differences in ferroptosis scores among the three ferroptosis clusters (E) and the three gene clusters (F).
In order to further verify the regulatory mechanism, the Univariate Cox analysis was conducted on these DEGs and screened out 794 prognostic DEGs (p<0.05). On the basis of these prognostic DEGs, we conducted an unsupervised cluster analysis, the TCGA-LIHC and GSE76427 patients were classified into three ferroptosis genomic patterns and we named them gene clusters A, B, and C (A: n=214, B: n=84, and C: n=239; Supplementary Figure 1D). Further investigation was carried out on the prognostic implications of ferroptosis gene clusters. In general, it was found that subjects in gene cluster A recorded a longer OS, whereas those in gene cluster B exhibited a more pessimistic outlook (p<0.001; Figure 5C). The expression of HRAS, SLC2A1, and SLC7A11 differed significantly between the three gene clusters, which also matched the expected outcomes of the ferroptosis molecular patterns (Figure 5D). The heatmap showed that ferroptosis-related genomic patterns were almost identical to the ferroptosis molecular patterns (Supplementary Figure 1E).
3.6 Construction of ferroptosis scoring system
However, our previous studies were based on patient populations. Considering individual heterogeneity and the complex mechanisms of HCC, we developed a PCA-based scoring algorithm to quantify the ferroptosis molecular pattern in individual patients, which we call the ferroptosis score. The ferroptosis scores in the ferroptosis clusters, as well as the gene clusters, were substantially different (p<0.01; Figures 5E, F). Ferroptosis cluster B patients had the poorest prognosis and the lowest ferroptosis score, as predicted, whereas cluster A patients had the opposite features (Figure 5E). The gene cluster produced the expected result in the ferroptosis score (Figure 5F).
3.7 Development of an independent prognostic model for HCC based on ferroptosis
We investigated the significance of the ferroptosis score in forecasting survival. Afterward, they were categorized into two groups: high ferroptosis and low ferroptosis (high group: n=423, low group: n=61). Consistent with our previous research, TCGA and GEO samples with low ferroptosis scores implied a more adverse prognosis than those with high ferroptosis scores (p<0.001; Figure 6A). We also used the ICGC cohort for validation and obtained consistent results (p<0.001; Figure 6B). Ferroptosis score also showed good predictive power in other indicators of clinical benefit, for example, disease special survival (DSS), disease-free survival (DFS), and progression-free survival (PFS) (p<0.001; Figures 6C–H). In the univariate and multivariate cox regression analysis, the ferroptosis score showed significantly superior survival prediction ability compared with other molecular classifications in previous studies (Supplementary Figure 1F).
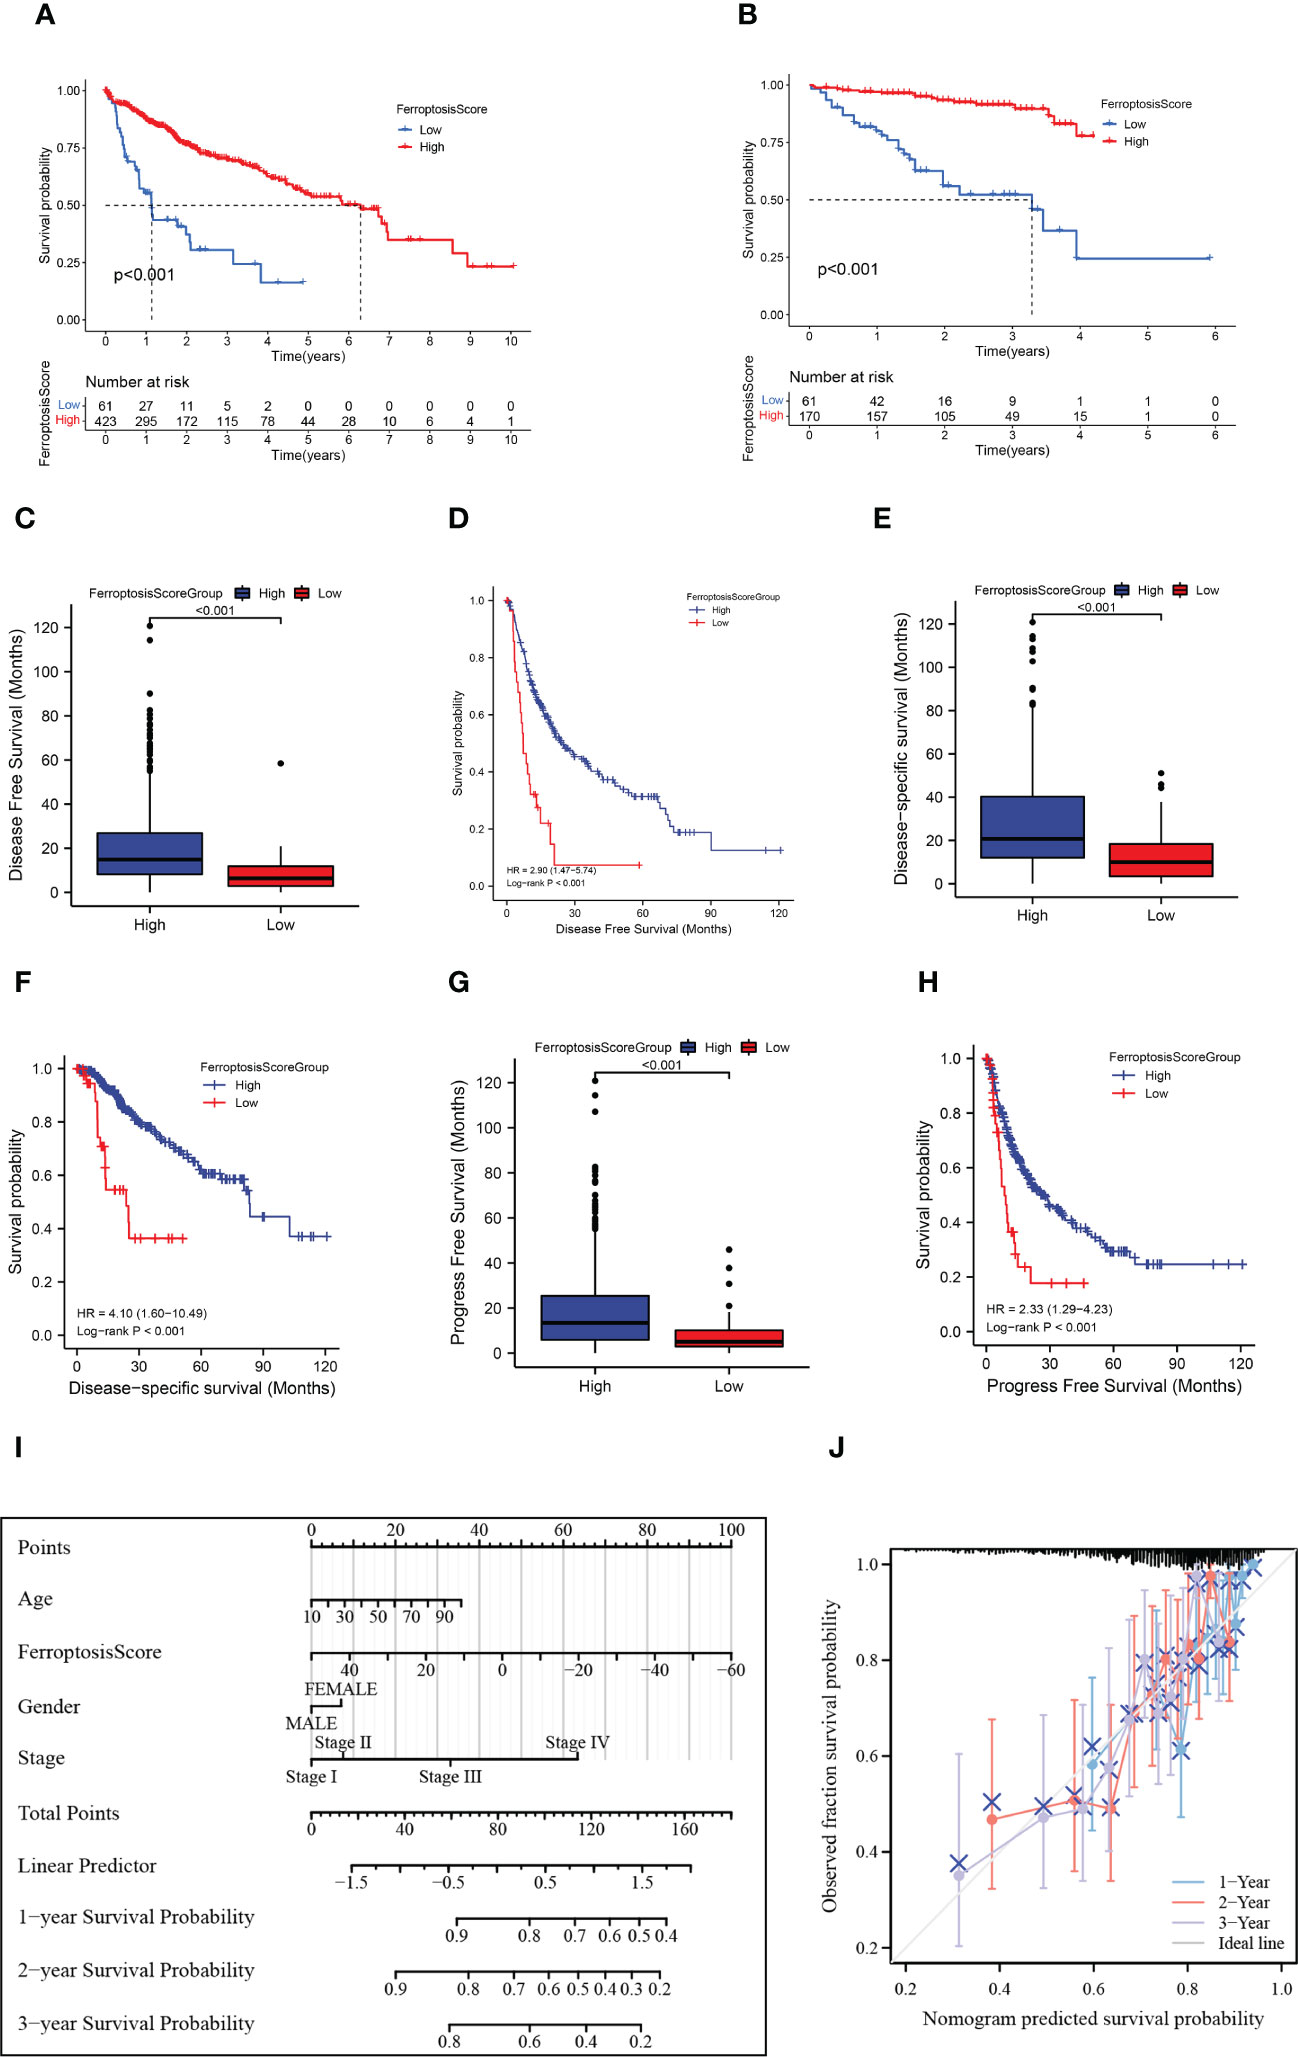
Figure 6 HCC prognosis based on the ferroptosis score. (A, B) Kaplan-Meier survival curves for the ferroptosis score groups in TCGA+GEO (A) and ICGC (B). (C) Box plots showed the differences in disease-free survival (DFS) between ferroptosis score groups. (D) Kaplan-Meier curves for the ferroptosis score groups in disease-free survival (DFS). (E) Box plots showed the differences in disease special survival (DSS) between ferroptosis score groups. (F) Kaplan-Meier curves for the ferroptosis score groups in disease special survival (DSS). (G) Box plots showed the differences in progression-free survival (PFS) between ferroptosis score groups. (H) Kaplan-Meier curves for the ferroptosis score groups in progression-free survival (PFS). (I) Nomogram plot of prognostic multivariate regression model. (J) Prognostic Calibration plot evaluating the fit analysis of the model to the actual situation.
We further established a nomogram plot to verify the accuracy of the prediction of the ferroptosis score in HCC (Figure 6I). We assigned a risk score to each clinical risk variable, including stage, age, gender, and ferroptosis score. Compared with other clinical features, the highest number of risk points was contributed by the ferroptosis score (from -60 to 50). The calibration curve of 1-, 2-, and 3-year OS was illustrated in Figure 6J. When compared to the actual situation, the predicted 1-year survival rate, 3-year survival rate, and 5-year survival rate of the model are close to the diagonal, indicating that the ferroptosis scoring model has a strong fitting effect.
3.8 Correlation between ferroptosis score and clinical features
We explored the relationship between clinical characteristics, molecular characteristics in previous studies and ferroptosis score group (Supplementary Table 6). Patients in the high score group have clinical features related to good prognosis (such as relatively low Child-Pugh classification, Stage, Grade, AFP). The median BMI of patients in the low ferroptosis score group was 22.80, while that in the high ferroptosis score group was 24.98. The Wilcoxon rank sum test showed statistically significant differences between the two groups (p=0.011).
We discovered that low score group patients had significant aggressive features and embryonic stem cell-like expression traits (ES signature), including CCL subtype (CCL feature), HB16 cluster 2, SOH subtype (HIPPO), HS subtype (NCIHS), high RS65 score, and NCIP cluster A (Supplementary Table 6). This indirectly confirmed that the ferroptosis molecular patterns may represent different developmental stages of HCC origin cells or different transformation mechanisms.
3.9 TMB characteristic of ferroptosis score
The waterfall plots showed the 20 genes with the highest mutation frequency in the somatic mutation data of patients in the TCGA-LIHC cohort. We compared the differences in mutation landscape between the two ferroptosis score groups. Figures 7A, B demonstrated that patients with low ferroptosis scores suffered from a greater tumor mutation burden than patients with high ferroptosis scores. It should be noted that the mutation frequency of TP53 in the low ferroptosis score group was significantly increased, and the ferroptosis score of TP53 mutant samples was also significantly lower than that of wild-type samples (p<0.01; Figure 7C). The association of TP53 mutations with poor prognosis is well known in many cancer types. In order to more accurately evaluate p53 functional status, the TCGA team developed a p53 signature (53). HCC patients with low p53 expression displayed a significantly reduced OS relative to their high p53 signature counterparts. We found that higher ferroptosis scores also had significantly elevated p53 signatures (Figure 7D).
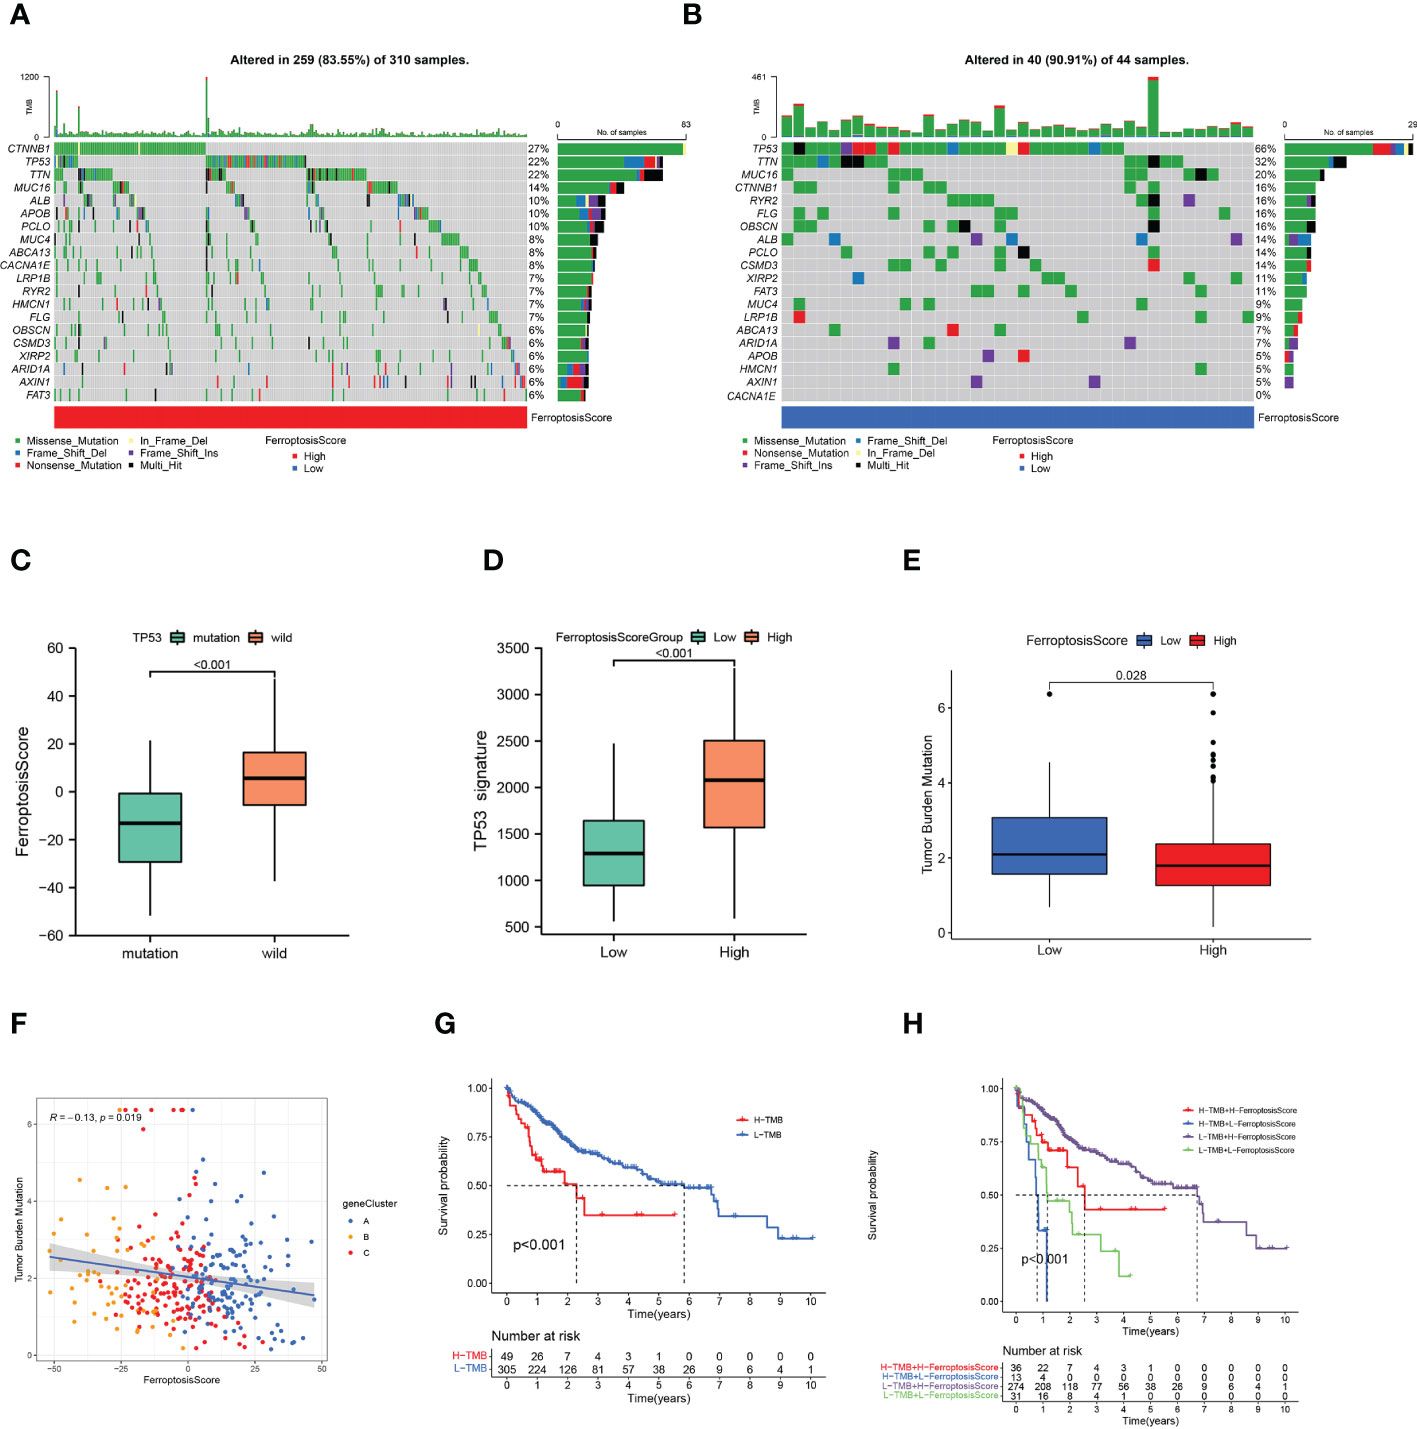
Figure 7 Ferroptosis score and tumor mutation burden. (A, B) Tumor somatic mutation waterfall plots established for those with high ferroptosis scores (A) and low ferroptosis scores (B). (C) Box plot illustrated the difference of ferroptosis score between the TP53 mutation status. (D) Box plot illustrated the difference of p53 signature between the ferroptosis score groups. (E) Box plot illustrated the differences between the ferroptosis score groups in tumor mutation burden. (F) Relationships among ferroptosis score, tumor mutation burden, and gene clusters. (G) Kaplan-Meier curves of high and low tumor mutation burden patients. (H) Kaplan-Meier curves based on both the ferroptosis score and tumor mutation burden.
The quantification analysis of TMB confirmed that low ferroptosis tumors had higher TMB levels (p=0.028; Figure 7E). The ferroptosis score and TMB were negatively correlated (p=0.019; Figure 7F). Further evidence showed that poor prognosis was strongly associated with high TMB and low ferroptosis scores (p<0.001; Figure 7G). Considering the synergistic effect of TMB and ferroptosis scores on the prognosis, we conducted a hierarchical prognostic analysis. We found that patients with high ferroptosis score and low TMB had a great survival advantage (p<0.001; Figure 7H). These data indicate that ferroptosis score combined with TMB can further improve the prognosis of patients.
3.10 Ferroptosis score, TME features, and response to immunotherapy
The single sample Gene Set Enrichment Analysis (ssGSEA) results showed that the ferroptosis score was significantly correlated with hypoxia, NOTCH, KRAS, and TGF-EMT signaling pathways (Figure 8A). An immune correlation analysis conducted in Figure 8B revealed a significant positive relationship between ferroptosis score and NK cells, T helper cells, type-I, and type-II IFN responses, and negatively correlated with immunosuppressive cell Tregs. Based on these findings, it was again confirmed that ferroptosis could affect tumor growth and progression by regulating the tumor microenvironment.
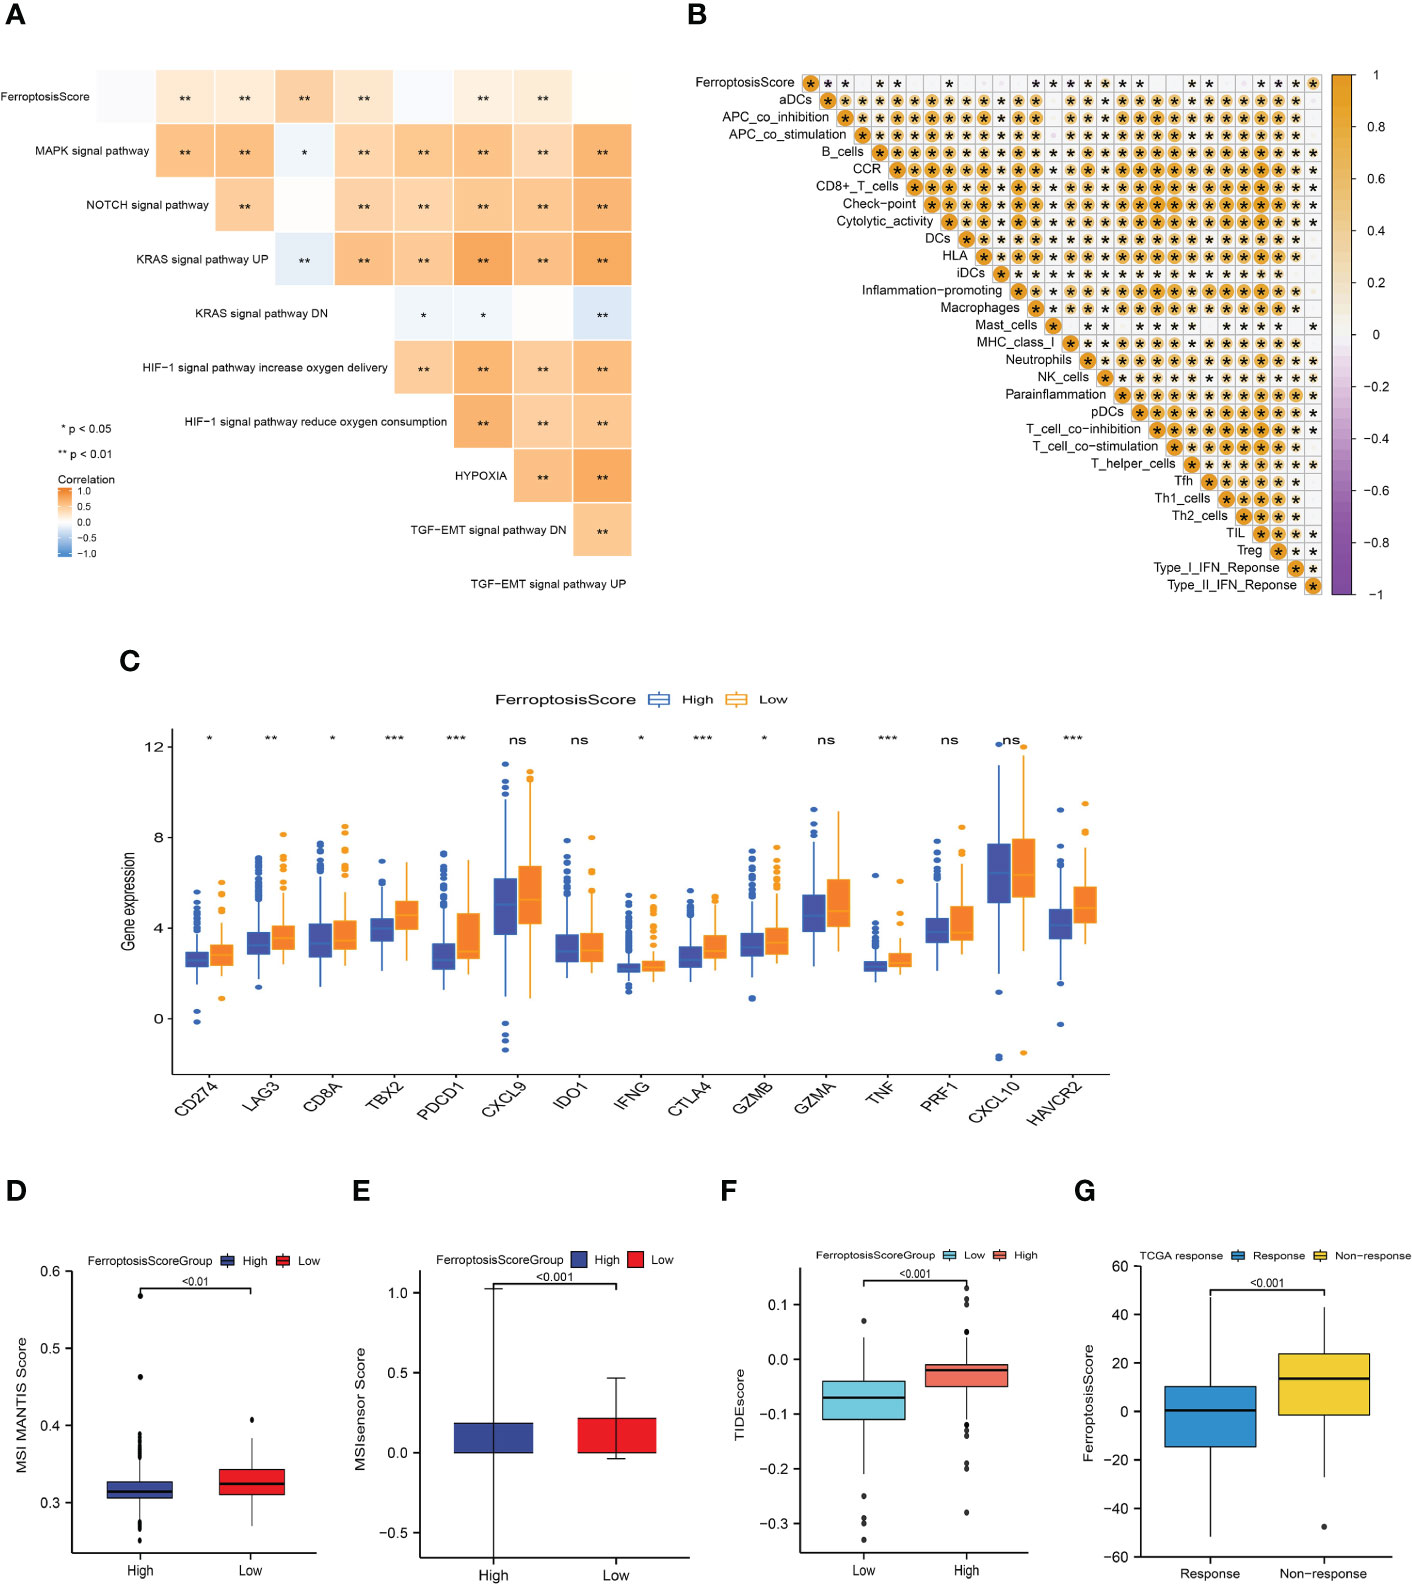
Figure 8 Ferroptosis score correlated with immunotherapy efficacy and response to immunotherapy. (A, B) Heat maps of the correlation between ferroptosis score and carcinogenic related signaling pathways (A) and immune cell infiltration (B). *p<0.05; **p<0.01; ***p<0.001. (C) Box plot depicting the differences between the ferroptosis score groups in the relative expression of checkpoints. ns: not significant; *p<0.05; **p<0.01; ***p<0.001. (D, E) Differences between ferroptosis score groups and MSI MANTIS score (D) and MSIsensor score (E). (F) Box plot depicting the differences between the ferroptosis score groups in the TIDE score. (G) Box plot depicting the differences of ferroptosis score between the immunotherapy response groups.
Basic research and clinical trials to exploring the predictive efficacy of immunotherapy biomarkers remain limited. To analyze the immunological response and tolerance to immunotherapy in HCC patients, we chose CD274, CTLA4, LAG3, HAVCR2, IDO1, and PDCD1 as immune checkpoint-related signatures and CD8A, CXCL10, GZMA, CXCL9, GZMB, GZMA, IFNG, PRF1, TBX2, and TNF as immunological activity-related signatures. The majority of immunological checkpoints and immunoreactive-related markers were found to be significantly overexpressed in the group with poor ferroptosis scores (Figure 8C).
In the process of DNA replication, the base mismatch loses its repair function and causes accumulation, which causes microsatellite instability (MSI), thus increasing the risk of tumor occurrence. Pabolizumab has been approved for use in MSI-H/dMMR solid tumors. This is also the first drug approved by the Food and Drug Administration (FDA) based on molecular markers rather than tumor tissue sources. Therefore, the changes in MSI-H/dMMR status and related molecules in tumor patients have important implications. We evaluated the MSI MANTIS score and microsatellite instability sensor (MSIsensor) score among the ferroptosis scoring groups (p<0.01; Figures 8D, E). The MSI MANTIS score has a positive correlation with the probability of MSI-H status (66, 67), and MSIsensor is an effective tool to obtain MSI status from standard tumor normal paired sequence data (68). Not surprisingly, both MSI scores were e higher in the low ferroptosis score group.
The Tumor Immune Dysfunction and Exclusion (TIDE) algorithm was used to evaluate the TCGA-LIHC cohort. The TIDE score of the high ferroptosis group was significantly higher than that of the low ferroptosis group, and the ferroptosis score of the ICIs-response group was significantly lower than that of the non-response group (p<0.01; Figures 8F, G). Together, this evidence strongly supports the effect of ferroptosis scores in predicting immunotherapy outcomes.
3.11 Differences in chemotherapy drug sensitivity between ferroptosis score groups
We examined the relationship between the ferroptosis score and the half-maximum inhibitory concentration (IC50) of chemotherapy drugs. Many drugs, including 5-fluorouracil, Dasatinib, Gemcitabine, and a variety of receptor tyrosine kinases (RTK), were significantly associated with the ferroptosis score. Compared with the low ferroptosis score group, the high ferroptosis score group has a higher estimated value of IC50 (Figure 9). The relationship between ferroptosis score and the semi-maximum inhibitory concentration (IC50) of other chemotherapy drugs were shown in the Supplementary Figure 2. In conclusion, the high ferroptosis score indicates that HCC patients were more sensitive to these therapeutic drugs.
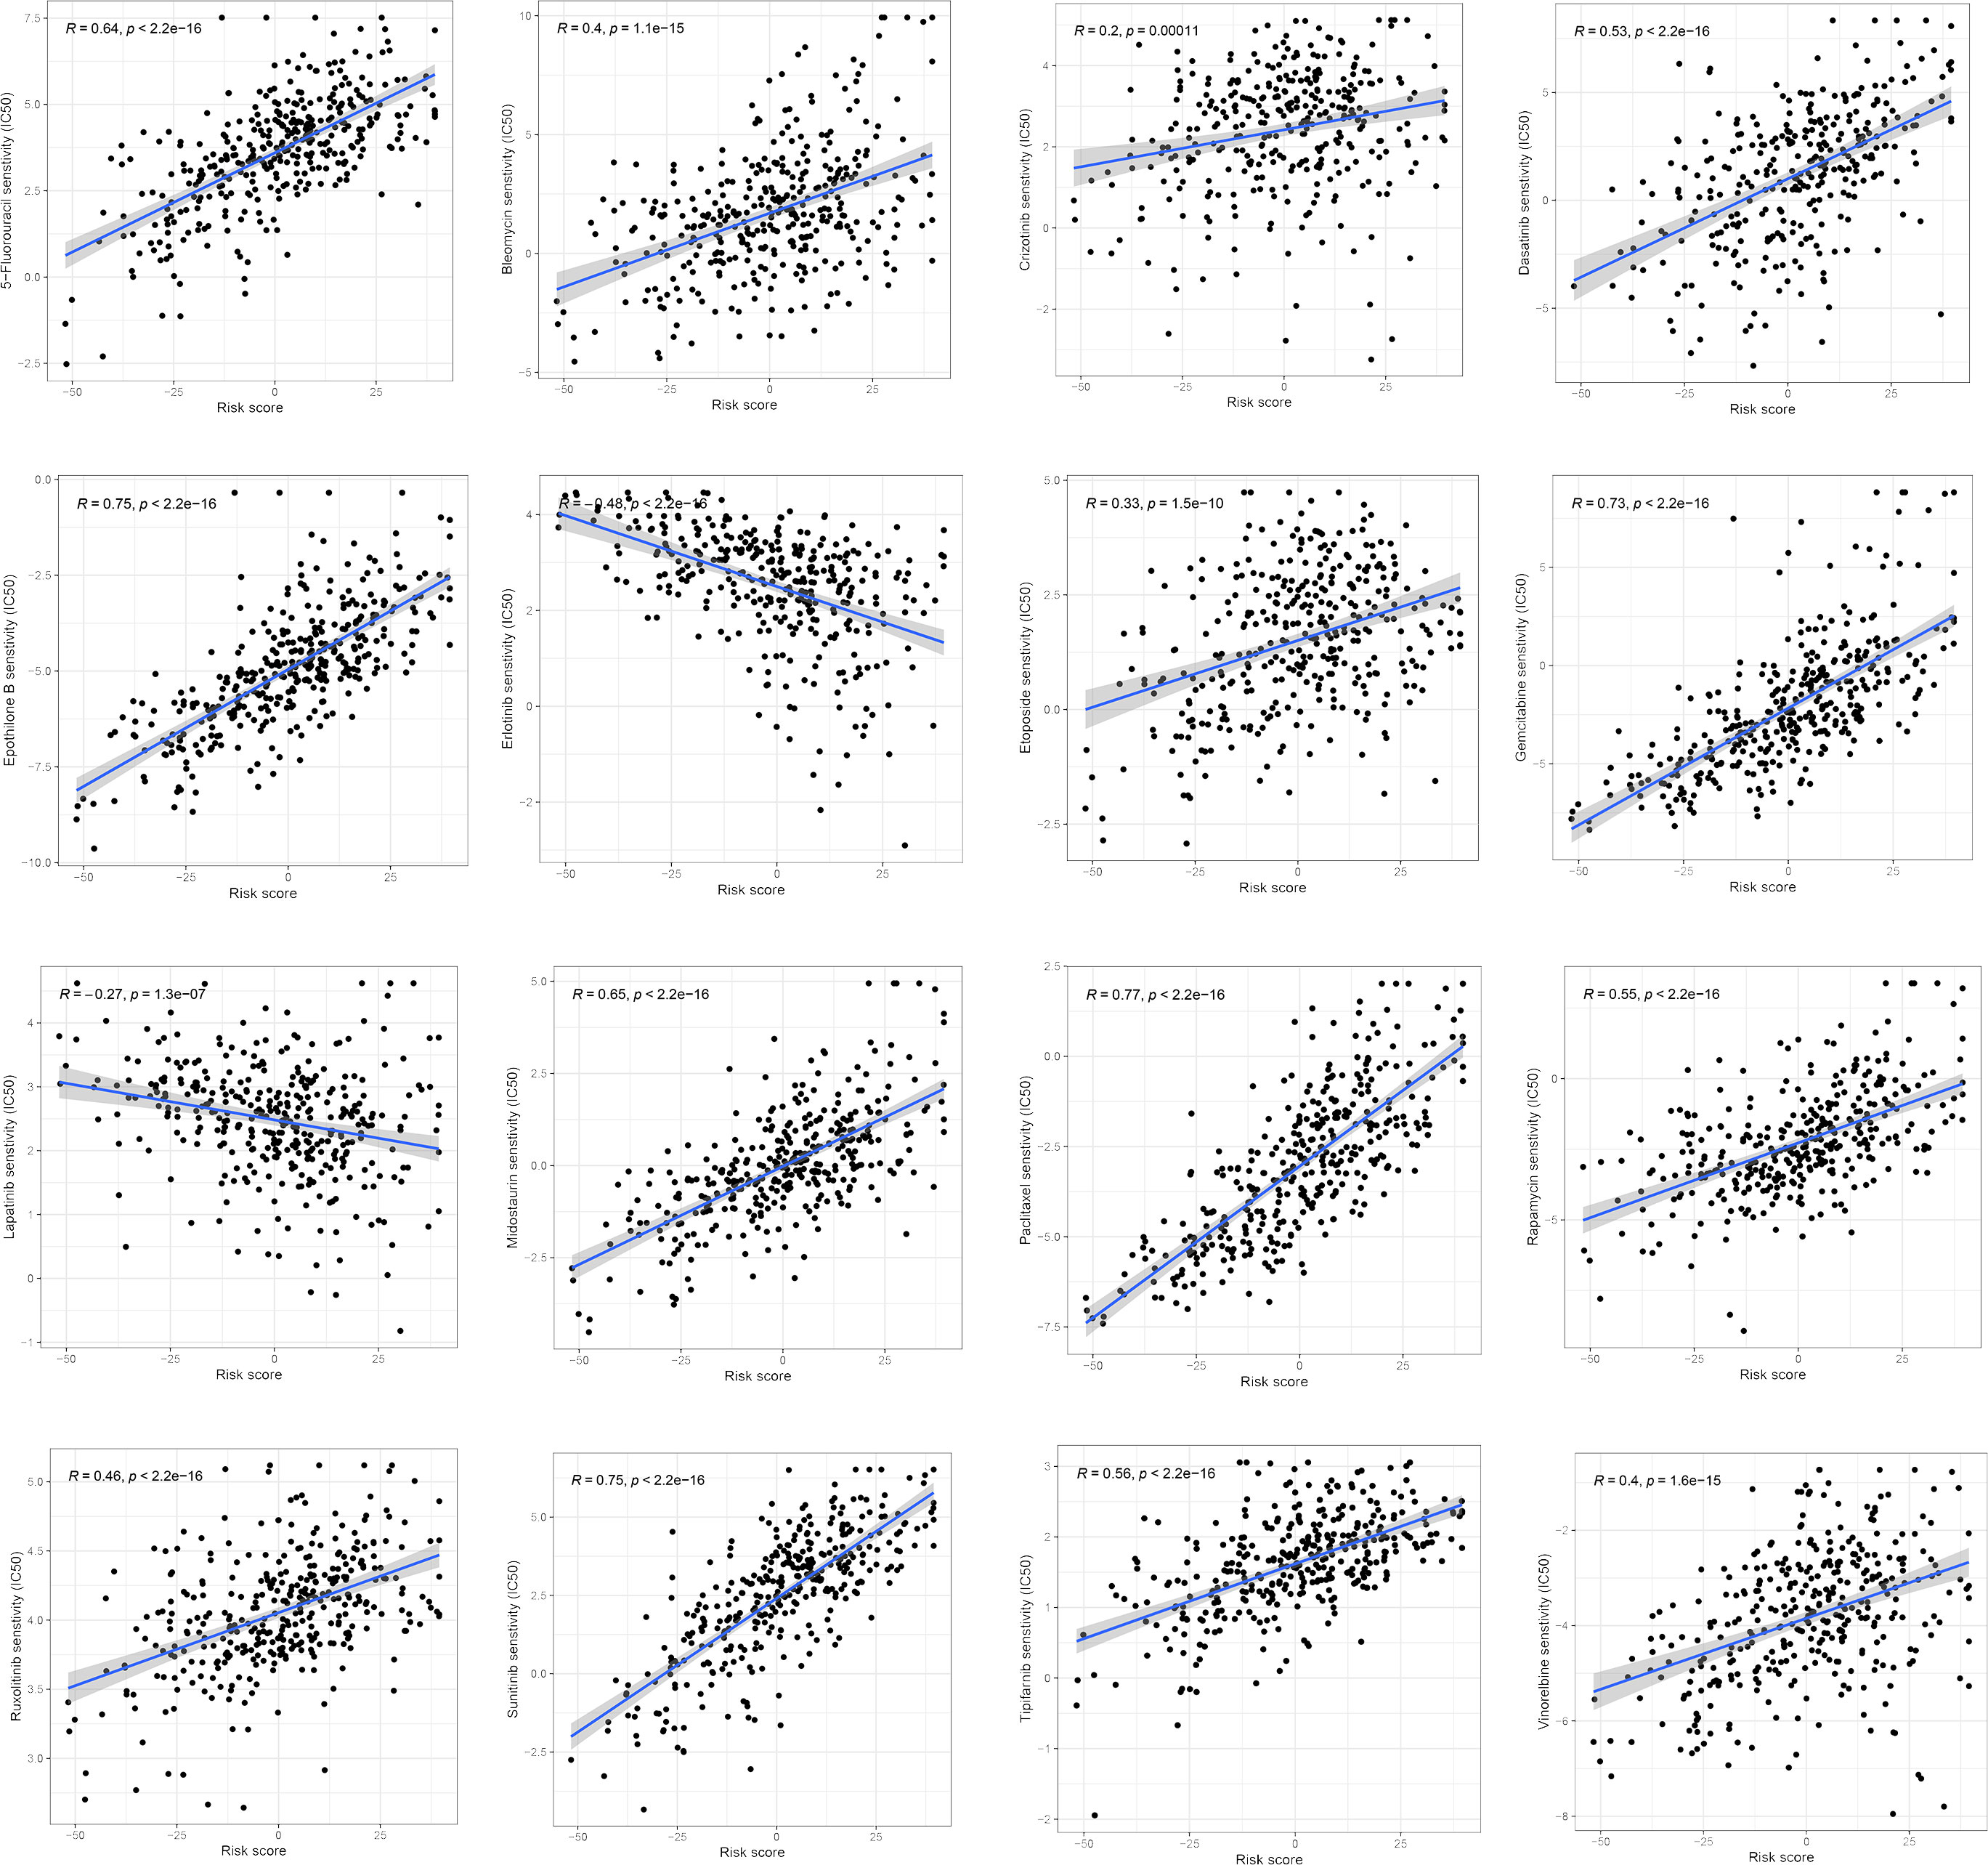
Figure 9 Correlation of ferroptosis scores with chemotherapeutic drug sensitivity.
4 Discussion
In recent years, with the tremendous advancement of ICIs monotherapy in the treatment of solid tumors, clinical researchers have conducted extensive research into hepatocellular carcinoma. In 2017, Nivolumab was approved by the FDA to treat Sorafenib treated HCC patients, and became the first immunotherapy drug approved for advanced HCC (2). But the subsequent Checkmate-459 did not meet the primary endpoint, implying that PD-1 inhibitors are effective in hepatocellular carcinoma, but the single-agent efficacy of PD-1 inhibitors still does not fulfill therapeutic needs (69). Subsequently, the combination of PD-L1 inhibitor (Atelizumab) and Bevacizumab (“T+A” scheme for short) in the phase III clinical trial (IMbrave150) for the treatment of advanced hepatocellular carcinoma significantly improved the survival period and quality of life of patients (4, 70, 71). Consequently, with the diversification of systematic treatment schemes for advanced hepatocellular carcinoma, how to accurately select multi-target inhibitors and appropriate immunotherapy schemes has emerged as a hot research topic. Therefore, the key to the treatment of advanced liver cancer in the future is to subdivide patients and find personalized, highly effective, and minimally invasive whole-course treatment strategies to improve long-term survival. Exploring the biomarkers of immunotherapy and molecular targeted therapy based on molecular typing can accurately screen patients who will benefit from immunotherapy and predict the efficacy and prognosis of drugs.
In this study, we identified 32 FRGs that displayed differential expression and a significant correlation with survival in HCC tissues and nearby non-tumor tissues. These FRGs play a vital role in the occurrence, proliferation, metastasis, and even drug resistance of malignant tumors. Then we screened three hub genes (HRAS, SLC7A11, and SLC2A1). We discovered that the high expression of the three hub genes predicted a poor prognosis for patients with liver cancer through the survival analysis of the TCGA cohort, GEO cohort, and the validation cohort of the Affiliated Hospital of Qingdao University. And consistent conclusions were obtained in pan-cancer analysis. Consequently, we identified three molecular subtypes of ferroptosis based on the mRNA expression profiles of FRGs. These three subtypes differ significantly in terms of prognosis, molecular function, immune infiltration microenvironment, and response to immunotherapy. The findings demonstrated a considerable enrichment of NK cell and type II interferon (IFN-γ) response, as well as a particularly pronounced survival advantage for ferroptosis cluster A. It has been proved that NK cells directly kill tumor cells through cytolytic granules and act synergistically with other immune cells through proinflammatory cytokines and chemokines, which is closely related to the prognosis of cancer patients (72–74). At the same time, ferroptosis cluster B was considerably abundant in Tregs and other immunosuppressive cells. Several hypoxia-related and EMT-related signaling pathways (including the TGF-β, MAPK, and KRAS signaling pathways) were also substantially expressed in ferroptosis cluster B. These mechanisms are thought to inhibit T lymphocytes.
The transcriptome differentially expressed genes (DEGs) among different ferroptosis molecular subtypes were particularly enriched for biological processes related to energy metabolism, proliferation, DNA repair, and immune activation. Based on these DEGs, which are considered the characteristic genes related to ferroptosis subtypes, we identified three gene clusters. We found that the ferroptosis-associated genomic patterns almost overlap with the ferroptosis molecular patterns. This implied that there were specific molecular patterns of ferroptosis in HCC. Therefore, a comprehensive assessment of the molecular patterns of ferroptosis is essential to gain insight into HCC. Considering the heterogeneity of HCC, we evaluated each patient ferroptosis molecular patterns by PCA, established ferroptosis scores, and divided HCC patients into groups with high and low ferroptosis scores. Ferroptosis cluster B and gene cluster B had the lowest survival rate and the lowest ferroptosis score, suggesting that a low ferroptosis score may predict unfavorable survival. By combining ferroptosis scores with other independent clinical risk variables, we constructed prognostic multivariate regression models. When compared to other clinical traits, the ferroptosis score contributes the greatest risk factors and has a good prediction efficiency for the outcome of HCC patients. Further investigation into the association between ferroptosis score and clinical characteristics of hepatocellular carcinoma revealed that low ferroptosis score group was significantly related to the features of patients with poor prognosis (such as increased AFP, advanced stage, and poor differentiation). As a result, it was proven that the ferroptosis score was a reliable index for evaluating patient survival.
The prevalence of obesity has reached epidemic proportions and has increased dramatically in recent decades. In addition to causing metabolic and cardiovascular diseases, obesity is also an established risk factor for several gastrointestinal cancers and is strongly associated with pancreatic and liver cancers in particular (75). Therefore, the hepatic molecular mechanisms involving obesity and NAFLD induced hepatocarcinogenesis and potential early markers of HCC are being extensively studied (76). Body mass index (BMI) is a commonly used international standard to measure the degree of obesity and health (77). We investigated the difference in BMI between ferroptosis score groups in patients with hepatocellular carcinoma. The results showed that there was a positive correlation between ferroptosis score and BMI. It has been found that obesity is closely related to the disturbance of iron metabolism, mainly characterized by high ferritin levels (78). Ferroptosis caused by iron accumulation is accompanied by elevated ROS, decreased GSH and inflammatory reactions, insulin resistance and mitochondrial dysfunction, leading to metabolic disorders and the development of obesity (79–81). In terms of immunity, obesity may lead to ferroptosis in Tregs and B1 cells by reducing the levels of NRF2, GPX4 and GCH1 (80, 82). In our previous study, biological processes such as fatty acid and glucose metabolism were also enriched in ferroptosis cluster A. Therefore, it is reasonable to speculate that the occurrence or development mechanism of this subset of HCC patients is related to metabolism.
Several studies have shown that HCC subtypes with poor prognosis may arise from hepatic progenitor cells. The diverse cell origins of HCC may play an important role in the heterogeneous course of HCC. Therefore, we also explored the link between ferroptosis scoring systems and previously developed molecular models. These molecular models focus on the exploration of the tissue origin of HCC and the mechanism between molecular and clinical pathology and clinical behavior. We discovered that the low ferroptosis score group was closely connected to hepatic stem cell origin subtype (CCL subtype, HB16 cluster 2, SOH subtype, HS subtype, and NCIP cluster A) and early recurrence subtype (RS65, SNUR). These subtypes are characterized by a high degree of malignancy, an abundance of hepatic progenitor cell markers (such as cytokeratin 19 and Ep-CAM), a low level of differentiation, increased vascular invasion, and satellite lesions (known risk factors for early recurrence).
Jiang et al. discovered that p53 may inhibit Cys absorption and trigger ferroptosis by preventing SLC7A11 gene expression, thereby inhibiting the growth of tumor cells (83). Woo et al. constructed the p53 signature to evaluate the expression functional status of p53 and found that it was significantly associated with reduced OS. Tumors with low p53 expression were significantly associated with increased copy number instability, increased pathological grading, decreased expression of marker genes in mature hepatocytes, increased risk of tumor recurrence (53, 84, 85). All of these results confirm that the formation of cancers with invasive characteristics is significantly influenced by TP53. In our study, TP53 mutations and p53 signatures were evaluated to determine the functional status and activity of p53. We found that p53 signatures were significantly reduced in the low ferroptosis score group, consistent with the conclusions of Woo et al.
As the main components of tumor microenvironment, immune cells and stromal cells play a crucial role in the regulation of tumor genesis and development. Additionally, immune cell phenotypic and function will be directly impacted by ferroptosis. Our study found that the immune exhaustion subtypes characterized by low ferroptosis score have significant tumor promoting signals (such as activated stroma, T cell exhaustion and immunosuppressive components). Immune dysfunction may be caused by immunosuppressive cells (such as Tregs). The overexpression of immune checkpoint molecules (PD-1, PD-L1, CTLA4, LAG3, and TIM3) in the low ferroptosis score group also indicated T cell exhaustion.
At present, there is no recognized biomarker to accurately predict the efficacy of immunotherapy for HCC. PD-L1 expression, TMB, MSI are the most commonly used indicators to predict the efficacy of ICIs, but their predictive value in HCC lacks the support of high-level clinical evidence (6). The pan-cancer study by Yarchoan et al. demonstrated that patients with high PD-L1 expression and TMB at the same time had the best ICIs efficacy (86). If the PD-L1 level reflects the degree of immune escape from the tumor, TMB represents the immunogenicity of the tumor itself. These are two different dimensions of whether immunotherapy is working. TMB has been found to be inversely associated with survival outcomes in HCC patients, but patients with higher TMB are more likely to respond to checkpoint therapy (87). In contrast to patients with microsatellite instability-low (MSI-L) cancers, those with MSI-high (MSI-H) tumors had a higher response rate to ICIs (88). Therefore, we comprehensively evaluated the immune checkpoint expression, TMB and MSI in HCC patients. We found that there were significant statistical differences among the three indicators in different ferroptosis score groups. Low ferroptosis score was associated with better immunotherapeutic response in all three indicators. Our study also showed that the ferroptosis score combined with TMB could further improve the survival prediction of patients. Additionally, the TIDE score was applied to the TCGA cohort to forecast immunotherapy, which again verified the predictive value of the ferroptosis score for immunotherapy response. According to our analysis of drug sensitivity, the half maximal inhibitory concentration (IC50) of several drugs, including 5-fluorouracil, Dasatinib, Gemcitabine, and a variety of receptor tyrosine kinases (RTK), showed a significant positive correlation with the ferroptosis score. The ferroptosis scoring system can stratify patients, screen sensitive patients, and find new methods to overcome the problems related to chemotherapy resistance. These drug sensitivity analyses provide a potential direction for future treatment work.
Overall, our study has a comprehensive exploration of predictive efficacy, clinical characteristics linkage, immune microenvironment, and immunotherapy. We believe that rigorous multifaceted validation analysis will help improve our understanding of this field. However, due to limited time and experimental conditions, there are some unavoidable flaws in our research that cannot be avoided. The specific molecular and biological regulation mechanism of ferroptosis affecting the prognosis of hepatocellular carcinoma has not been verified by experiments. It is hoped that in future studies, we will be able to determine the role of ferroptosis and its related pathways in the development and progression of hepatocellular carcinoma and clarify its signaling mechanisms, which will ultimately help clinicians evaluate the prognosis of hepatocellular carcinoma in order to guide patients to better receive individualized treatment and select appropriate drugs. We hope these studies can provide some valuable clues for future scientific research and clinical practice.
5 Conclusions
In this study, we systematically evaluated the ferroptosis molecular patterns in HCC. In order to quantify the ferroptosis status of each patient, we also developed an ferroptosis score. The results showed that ferroptosis score plays a non-negligible role in evaluating the origin of tumor tissue, TME landscape, survival prognosis and predicting the effect of immunotherapy. These results suggested that ferroptosis score might serve as a basis for molecular classification of HCC in order to develop effective targeted therapies and scientifically designed clinical trials.
Data availability statement
The original contributions presented in the study are included in the article/Supplementary material. Further inquiries can be directed to the corresponding author.
Ethics statement
The studies involving human participants were reviewed and approved by Institutional Review Board of The Affiliated Hospital of Qingdao University. The patients/participants provided their written informed consent to participate in this study.
Author contributions
Administrative support (JZ), study conception and design (XX), provision of study materials and patients (FY), data collection and assembly (YM), data analysis and interpretation, manuscript writing, final approval of the manuscript (XX, JZ, MJ, XZ). All authors contributed to the article and approved the submitted version.
Funding
Funding for this research was provided by the Qingdao Key Discipline Foundation; Shandong Health Science and technology development foundation (202102040497).
Conflict of interest
The authors declare that the research was conducted in the absence of any commercial or financial relationships that could be construed as a potential conflict of interest.
Publisher’s note
All claims expressed in this article are solely those of the authors and do not necessarily represent those of their affiliated organizations, or those of the publisher, the editors and the reviewers. Any product that may be evaluated in this article, or claim that may be made by its manufacturer, is not guaranteed or endorsed by the publisher.
Supplementary material
The Supplementary Material for this article can be found online at: https://www.frontiersin.org/articles/10.3389/fonc.2023.1145380/full#supplementary-material
References
1. Sung H, Ferlay J, Siegel RL, Laversanne M, Soerjomataram I, Jemal A, et al. Global cancer statistics 2020: Globocan estimates of incidence and mortality worldwide for 36 cancers in 185 countries. CA Cancer J Clin (2021) 71(3):209–49. doi: 10.3322/caac.21660
2. El-Khoueiry AB, Sangro B, Yau T, Crocenzi TS, Kudo M, Hsu C, et al. Nivolumab in patients with advanced hepatocellular carcinoma (Checkmate 040): An open-label, non-comparative, phase 1/2 dose escalation and expansion trial. Lancet (2017) 389(10088):2492–502. doi: 10.1016/s0140-6736(17)31046-2
3. Sharma P, Siddiqui BA, Anandhan S, Yadav SS, Subudhi SK, Gao J, et al. The next decade of immune checkpoint therapy. Cancer Discovery (2021) 11(4):838–57. doi: 10.1158/2159-8290.Cd-20-1680
4. Finn RS, Qin S, Ikeda M, Galle PR, Ducreux M, Kim TY, et al. Atezolizumab plus bevacizumab in unresectable hepatocellular carcinoma. N Engl J Med (2020) 382(20):1894–905. doi: 10.1056/NEJMoa1915745
5. Nishida N, Kudo M. Immune checkpoint blockade for the treatment of human hepatocellular carcinoma. Hepatol Res (2018) 48(8):622–34. doi: 10.1111/hepr.13191
6. Cheng AL, Hsu C, Chan SL, Choo SP, Kudo M. Challenges of combination therapy with immune checkpoint inhibitors for hepatocellular carcinoma. J Hepatol (2020) 72(2):307–19. doi: 10.1016/j.jhep.2019.09.025
7. Woo HG, Lee JH, Yoon JH, Kim CY, Lee HS, Jang JJ, et al. Identification of a cholangiocarcinoma-like gene expression trait in hepatocellular carcinoma. Cancer Res (2010) 70(8):3034–41. doi: 10.1158/0008-5472.Can-09-2823
8. Cairo S, Armengol C, De Reyniès A, Wei Y, Thomas E, Renard CA, et al. Hepatic stem-like phenotype and interplay of Wnt/Beta-catenin and myc signaling in aggressive childhood liver cancer. Cancer Cell (2008) 14(6):471–84. doi: 10.1016/j.ccr.2008.11.002
9. Lee JS, Chu IS, Heo J, Calvisi DF, Sun Z, Roskams T, et al. Classification and prediction of survival in hepatocellular carcinoma by gene expression profiling. Hepatology (2004) 40(3):667–76. doi: 10.1002/hep.20375
10. Lee JS, Heo J, Libbrecht L, Chu IS, Kaposi-Novak P, Calvisi DF, et al. A novel prognostic subtype of human hepatocellular carcinoma derived from hepatic progenitor cells. Nat Med (2006) 12(4):410–6. doi: 10.1038/nm1377
11. Borger DR, Tanabe KK, Fan KC, Lopez HU, Fantin VR, Straley KS, et al. Frequent mutation of isocitrate dehydrogenase (Idh)1 and Idh2 in cholangiocarcinoma identified through broad-based tumor genotyping. Oncologist (2012) 17(1):72–9. doi: 10.1634/theoncologist.2011-0386
12. Woo HG, Park ES, Cheon JH, Kim JH, Lee JS, Park BJ, et al. Gene expression-based recurrence prediction of hepatitis b virus-related human hepatocellular carcinoma. Clin Cancer Res (2008) 14(7):2056–64. doi: 10.1158/1078-0432.Ccr-07-1473
13. Sohn BH, Shim JJ, Kim SB, Jang KY, Kim SM, Kim JH, et al. Inactivation of hippo pathway is significantly associated with poor prognosis in hepatocellular carcinoma. Clin Cancer Res (2016) 22(5):1256–64. doi: 10.1158/1078-0432.Ccr-15-1447
14. Hoshida Y, Nijman SM, Kobayashi M, Chan JA, Brunet JP, Chiang DY, et al. Integrative transcriptome analysis reveals common molecular subclasses of human hepatocellular carcinoma. Cancer Res (2009) 69(18):7385–92. doi: 10.1158/0008-5472.Can-09-1089
15. Chen X, Li J, Kang R, Klionsky DJ, Tang D. Ferroptosis: Machinery and regulation. Autophagy (2021) 17(9):2054–81. doi: 10.1080/15548627.2020.1810918
16. Jiang X, Stockwell B, Conrad M. Ferroptosis: Mechanisms, biology and role in disease. Nat Rev Mol Cell Biol (2021) 22(4):266–82. doi: 10.1038/s41580-020-00324-8
17. Stockwell B, Friedmann Angeli J, Bayir H, Bush A, Conrad M, Dixon S, et al. Ferroptosis: A regulated cell death nexus linking metabolism, redox biology, and disease. Cell (2017) 171(2):273–85. doi: 10.1016/j.cell.2017.09.021
18. Hassannia B, Vandenabeele P, Vanden Berghe T. Targeting ferroptosis to iron out cancer. Cancer Cell (2019) 35(6):830–49. doi: 10.1016/j.ccell.2019.04.002
19. Guo J, Xu B, Han Q, Zhou H, Xia Y, Gong C, et al. Ferroptosis: A novel anti-tumor action for cisplatin. Cancer Res Treat (2018) 50(2):445–60. doi: 10.4143/crt.2016.572
20. Lang X, Green MD, Wang W, Yu J, Choi JE, Jiang L, et al. Radiotherapy and immunotherapy promote tumoral lipid oxidation and ferroptosis Via synergistic repression of Slc7a11. Cancer Discovery (2019) 9(12):1673–85. doi: 10.1158/2159-8290.Cd-19-0338
21. Wang W, Green M, Choi JE, Gijón M, Kennedy PD, Johnson JK, et al. Cd8(+) T cells regulate tumour ferroptosis during cancer immunotherapy. Nature (2019) 569(7755):270–4. doi: 10.1038/s41586-019-1170-y
22. Zitvogel L, Kroemer G. Interferon-Γ induces cancer cell ferroptosis. Cell Res (2019) 29(9):692–3. doi: 10.1038/s41422-019-0186-z
23. Zhang T, Sun B, Zhong C, Xu K, Wang Z, Hofman P, et al. Targeting histone deacetylase enhances the therapeutic effect of erastin-induced ferroptosis in egfr-activating mutant lung adenocarcinoma. Transl Lung Cancer Res (2021) 10(4):1857–72. doi: 10.21037/tlcr-21-303
24. Jiang Z, Lim SO, Yan M, Hsu JL, Yao J, Wei Y, et al. Tyro3 induces anti-Pd-1/Pd-L1 therapy resistance by limiting innate immunity and tumoral ferroptosis. J Clin Invest (2021) 131(8). doi: 10.1172/jci139434
25. Li J, Lama R, Galster SL, Inigo JR, Wu J, Chandra D, et al. Small-molecule Mmri62 induces ferroptosis and inhibits metastasis in pancreatic cancer Via degradation of ferritin heavy chain and mutant P53. Mol Cancer Ther (2022) 21(4):535–45. doi: 10.1158/1535-7163.Mct-21-0728
26. Liang C, Zhang X, Yang M, Dong X. Recent progress in ferroptosis inducers for cancer therapy. Adv Mater (2019) 31(51):e1904197. doi: 10.1002/adma.201904197
27. Wu C, Liu Z, Chen Z, Xu D, Chen L, Lin H, et al. A nonferrous ferroptosis-like strategy for antioxidant inhibition-synergized nanocatalytic tumor therapeutics. Sci Adv (2021) 7(39):eabj8833. doi: 10.1126/sciadv.abj8833
28. Stockwell BR. Ferroptosis turns 10: Emerging mechanisms, physiological functions, and therapeutic applications. Cell (2022) 185(14):2401–21. doi: 10.1016/j.cell.2022.06.003
29. Zhang C, Liu X, Jin S, Chen Y, Guo R. Ferroptosis in cancer therapy: A novel approach to reversing drug resistance. Mol Cancer (2022) 21(1):47. doi: 10.1186/s12943-022-01530-y
30. Zhang Y, Zhang Z. The history and advances in cancer immunotherapy: Understanding the characteristics of tumor-infiltrating immune cells and their therapeutic implications. Cell Mol Immunol (2020) 17(8):807–21. doi: 10.1038/s41423-020-0488-6
31. Sas Z, Cendrowicz E, Weinhäuser I, Rygiel TP. Tumor microenvironment of hepatocellular carcinoma: Challenges and opportunities for new treatment options. Int J Mol Sci (2022) 23(7). doi: 10.3390/ijms23073778
32. Chen Y, Pei Y, Luo J, Huang Z, Yu J, Meng X. Looking for the optimal pd-1/Pd-L1 inhibitor in cancer treatment: A comparison in basic structure, function, and clinical practice. Front Immunol (2020) 11:1088. doi: 10.3389/fimmu.2020.01088
33. Casak SJ, Donoghue M, Fashoyin-Aje L, Jiang X, Rodriguez L, Shen YL, et al. Fda approval summary: Atezolizumab plus bevacizumab for the treatment of patients with advanced unresectable or metastatic hepatocellular carcinoma. Clin Cancer Res (2021) 27(7):1836–41. doi: 10.1158/1078-0432.Ccr-20-3407
34. Qin S, Xu L, Yi M, Yu S, Wu K, Luo S. Novel immune checkpoint targets: Moving beyond pd-1 and ctla-4. Mol Cancer (2019) 18(1):155. doi: 10.1186/s12943-019-1091-2
35. Brudno JN, Kochenderfer JN. Recent advances in car T-cell toxicity: Mechanisms, manifestations and management. Blood Rev (2019) 34:45–55. doi: 10.1016/j.blre.2018.11.002
36. Guo J, Tang Q. Recent updates on chimeric antigen receptor T cell therapy for hepatocellular carcinoma. Cancer Gene Ther (2021) 28(10-11):1075–87. doi: 10.1038/s41417-020-00259-4
37. Cai XY, Wang JX, Yi Y, He HW, Ni XC, Zhou J, et al. Low counts of Γδ T cells in peritumoral liver tissue are related to more frequent recurrence in patients with hepatocellular carcinoma after curative resection. Asian Pac J Cancer Prev (2014) 15(2):775–80. doi: 10.7314/apjcp.2014.15.2.775
38. Zhang T, Chen J, Niu L, Liu Y, Ye G, Jiang M, et al. Clinical safety and efficacy of locoregional therapy combined with adoptive transfer of allogeneic Γδ T cells for advanced hepatocellular carcinoma and intrahepatic cholangiocarcinoma. J Vasc Interv Radiol (2022) 33(1):19–27.e3. doi: 10.1016/j.jvir.2021.09.012
39. Fuchs BC, Fujii T, Dorfman JD, Goodwin JM, Zhu AX, Lanuti M, et al. Epithelial-to-Mesenchymal transition and integrin-linked kinase mediate sensitivity to epidermal growth factor receptor inhibition in human hepatoma cells. Cancer Res (2008) 68(7):2391–9. doi: 10.1158/0008-5472.Can-07-2460
40. McConkey DJ, Choi W, Marquis L, Martin F, Williams MB, Shah J, et al. Role of epithelial-to-Mesenchymal transition (Emt) in drug sensitivity and metastasis in bladder cancer. Cancer Metastasis Rev (2009) 28(3-4):335–44. doi: 10.1007/s10555-009-9194-7
41. Saxena M, Stephens MA, Pathak H, Rangarajan A. Transcription factors that mediate epithelial-mesenchymal transition lead to multidrug resistance by upregulating abc transporters. Cell Death Dis (2011) 2(7):e179. doi: 10.1038/cddis.2011.61
42. Foroutan M, Cursons J, Hediyeh-Zadeh S, Thompson EW, Davis MJ. A. Transcriptional program for detecting tgfβ-induced emt in cancer. Mol Cancer Res (2017) 15(5):619–31. doi: 10.1158/1541-7786.Mcr-16-0313
43. Xu Z, Feng J, Li Y, Guan D, Chen H, Zhai X, et al. The vicious cycle between ferritinophagy and ros production triggered emt inhibition of gastric cancer cells was through P53/Akt/Mtor pathway. Chem Biol Interact (2020) 328:109196. doi: 10.1016/j.cbi.2020.109196
44. Yuan X, Wu H, Han N, Xu H, Chu Q, Yu S, et al. Notch signaling and emt in non-small cell lung cancer: Biological significance and therapeutic application. J Hematol Oncol (2014) 7:87. doi: 10.1186/s13045-014-0087-z
45. Damrauer JS, Hoadley KA, Chism DD, Fan C, Tiganelli CJ, Wobker SE, et al. Intrinsic subtypes of high-grade bladder cancer reflect the hallmarks of breast cancer biology. Proc Natl Acad Sci U.S.A. (2014) 111(8):3110–5. doi: 10.1073/pnas.1318376111
46. Hedegaard J, Lamy P, Nordentoft I, Algaba F, Høyer S, Ulhøi BP, et al. Comprehensive transcriptional analysis of early-stage urothelial carcinoma. Cancer Cell (2016) 30(1):27–42. doi: 10.1016/j.ccell.2016.05.004
47. Hugo W, Zaretsky JM, Sun L, Song C, Moreno BH, Hu-Lieskovan S, et al. Genomic and transcriptomic features of response to anti-Pd-1 therapy in metastatic melanoma. Cell (2016) 165(1):35–44. doi: 10.1016/j.cell.2016.02.065
48. Sjödahl G, Lauss M, Lövgren K, Chebil G, Gudjonsson S, Veerla S, et al. A molecular taxonomy for urothelial carcinoma. Clin Cancer Res (2012) 18(12):3377–86. doi: 10.1158/1078-0432.Ccr-12-0077-t
49. Spranger S, Bao R, Gajewski TF. Melanoma-intrinsic B-catenin signalling prevents anti-tumour immunity. Nature (2015) 523(7559):231–5. doi: 10.1038/nature14404
50. Mariathasan S, Turley SJ, Nickles D, Castiglioni A, Yuen K, Wang Y, et al. Tgfβ attenuates tumour response to pd-L1 blockade by contributing to exclusion of T cells. Nature (2018) 554(7693):544–8. doi: 10.1038/nature25501
51. Viswanathan VS, Ryan MJ, Dhruv HD, Gill S, Eichhoff OM, Seashore-Ludlow B, et al. Dependency of a therapy-resistant state of cancer cells on a lipid peroxidase pathway. Nature (2017) 547(7664):453–7. doi: 10.1038/nature23007
52. Lei G, Zhuang L, Gan B. Targeting ferroptosis as a vulnerability in cancer. Nat Rev Cancer (2022) 22(7):381–96. doi: 10.1038/s41568-022-00459-0
53. Cancer Genome Atlas Research Network. Comprehensive and integrative genomic characterization of hepatocellular carcinoma. Cell (2017) 169(7):1327–41.e23. doi: 10.1016/j.cell.2017.05.046
54. Zhou N, Bao J. Ferrdb: A manually curated resource for regulators and markers of ferroptosis and ferroptosis-disease associations. Database (Oxford) (2020) 2020:baaa021. doi: 10.1093/database/baaa021
55. Colaprico A, Silva TC, Olsen C, Garofano L, Cava C, Garolini D, et al. Tcgabiolinks: An R/Bioconductor package for integrative analysis of tcga data. Nucleic Acids Res (2016) 44(8):e71. doi: 10.1093/nar/gkv1507
56. Ritchie ME, Phipson B, Wu D, Hu Y, Law CW, Shi W, et al. Limma powers differential expression analyses for rna-sequencing and microarray studies. Nucleic Acids Res (2015) 43(7):e47. doi: 10.1093/nar/gkv007
57. Wilkerson MD, Hayes DN. Consensusclusterplus: A class discovery tool with confidence assessments and item tracking. Bioinformatics (2010) 26(12):1572–3. doi: 10.1093/bioinformatics/btq170
58. Bindea G, Mlecnik B, Tosolini M, Kirilovsky A, Waldner M, Obenauf AC, et al. Spatiotemporal dynamics of intratumoral immune cells reveal the immune landscape in human cancer. Immunity (2013) 39(4):782–95. doi: 10.1016/j.immuni.2013.10.003
59. Sotiriou C, Wirapati P, Loi S, Harris A, Fox S, Smeds J, et al. Gene expression profiling in breast cancer: Understanding the molecular basis of histologic grade to improve prognosis. J Natl Cancer Inst (2006) 98(4):262–72. doi: 10.1093/jnci/djj052
60. Zhang X, Shi M, Chen T, Zhang B. Characterization of the immune cell infiltration landscape in head and neck squamous cell carcinoma to aid immunotherapy. Mol Ther Nucleic Acids (2020) 22:298–309. doi: 10.1016/j.omtn.2020.08.030
61. Mayakonda A, Lin DC, Assenov Y, Plass C, Koeffler HP. Maftools: Efficient and comprehensive analysis of somatic variants in cancer. Genome Res (2018) 28(11):1747–56. doi: 10.1101/gr.239244.118
62. Kim ST, Cristescu R, Bass AJ, Kim KM, Odegaard JI, Kim K, et al. Comprehensive molecular characterization of clinical responses to pd-1 inhibition in metastatic gastric cancer. Nat Med (2018) 24(9):1449–58. doi: 10.1038/s41591-018-0101-z
63. Yang W, Soares J, Greninger P, Edelman EJ, Lightfoot H, Forbes S, et al. Genomics of drug sensitivity in cancer (Gdsc): A resource for therapeutic biomarker discovery in cancer cells. Nucleic Acids Res (2013) 41(Database issue):D955–61. doi: 10.1093/nar/gks1111
64. Geeleher P, Cox N, Huang RS. Prrophetic: An r package for prediction of clinical chemotherapeutic response from tumor gene expression levels. PloS One (2014) 9(9):e107468. doi: 10.1371/journal.pone.0107468
65. Buffa FM, Harris AL, West CM, Miller CJ. Large Meta-analysis of multiple cancers reveals a common, compact and highly prognostic hypoxia metagene. Br J Cancer (2010) 102(2):428–35. doi: 10.1038/sj.bjc.6605450
66. Bonneville R, Krook MA, Kautto EA, Miya J, Wing MR, Chen HZ, et al. Landscape of microsatellite instability across 39 cancer types. JCO Precis Oncol (2017) 2017:PO.17.00073. doi: 10.1200/po.17.00073
67. Lu M, Zhao B, Liu M, Wu L, Li Y, Zhai Y, et al. Pan-cancer analysis of Setd2 mutation and its association with the efficacy of immunotherapy. NPJ Precis Oncol (2021) 5(1):51. doi: 10.1038/s41698-021-00193-0
68. Niu B, Ye K, Zhang Q, Lu C, Xie M, McLellan MD, et al. Msisensor: Microsatellite instability detection using paired tumor-normal sequence data. Bioinformatics (2014) 30(7):1015–6. doi: 10.1093/bioinformatics/btt755
69. Yau T, Park JW, Finn RS, Cheng AL, Mathurin P, Edeline J, et al. Nivolumab versus sorafenib in advanced hepatocellular carcinoma (Checkmate 459): A randomised, multicentre, open-label, phase 3 trial. Lancet Oncol (2022) 23(1):77–90. doi: 10.1016/s1470-2045(21)00604-5
70. Galle PR, Finn RS, Qin S, Ikeda M, Zhu AX, Kim TY, et al. Patient-reported outcomes with atezolizumab plus bevacizumab versus sorafenib in patients with unresectable hepatocellular carcinoma (Imbrave150): An open-label, randomised, phase 3 trial. Lancet Oncol (2021) 22(7):991–1001. doi: 10.1016/s1470-2045(21)00151-0
71. Cheng AL, Qin S, Ikeda M, Galle PR, Ducreux M, Kim TY, et al. Updated efficacy and safety data from Imbrave150: Atezolizumab plus bevacizumab vs. sorafenib for unresectable hepatocellular carcinoma. J Hepatol (2022) 76(4):862–73. doi: 10.1016/j.jhep.2021.11.030
72. Pang YL, Zhang HG, Peng JR, Pang XW, Yu S, Xing Q, et al. The immunosuppressive tumor microenvironment in hepatocellular carcinoma. Cancer Immunol Immunother (2009) 58(6):877–86. doi: 10.1007/s00262-008-0603-5
73. Chew V, Chen J, Lee D, Loh E, Lee J, Lim KH, et al. Chemokine-driven lymphocyte infiltration: An early intratumoural event determining long-term survival in resectable hepatocellular carcinoma. Gut (2012) 61(3):427–38. doi: 10.1136/gutjnl-2011-300509
74. Wada Y, Nakashima O, Kutami R, Yamamoto O, Kojiro M. Clinicopathological study on hepatocellular carcinoma with lymphocytic infiltration. Hepatology (1998) 27(2):407–14. doi: 10.1002/hep.510270214
75. Calle EE, Rodriguez C, Walker-Thurmond K, Thun MJ. Overweight, obesity, and mortality from cancer in a prospectively studied cohort of U.S. adults. N Engl J Med (2003) 348(17):1625–38. doi: 10.1056/NEJMoa021423
76. Marengo A, Rosso C, Bugianesi E. Liver cancer: Connections with obesity, fatty liver, and cirrhosis. Annu Rev Med (2016) 67:103–17. doi: 10.1146/annurev-med-090514-013832
77. Chooi YC, Ding C, Magkos F. The epidemiology of obesity. Metabolism (2019) 92:6–10. doi: 10.1016/j.metabol.2018.09.005
78. González-Domínguez Á, Visiedo-García FM, Domínguez-Riscart J, González-Domínguez R, Mateos RM, Lechuga-Sancho AM. Iron metabolism in obesity and metabolic syndrome. Int J Mol Sci (2020) 21(15). doi: 10.3390/ijms21155529
79. Zhang S, Sun Z, Jiang X, Lu Z, Ding L, Li C, et al. Ferroptosis Increases Obesity: Crosstalk between Adipocytes and the Neuroimmune System. Front Immunol (2022) 13:1049936. doi: 10.3389/fimmu.2022.1049936
80. Hoy AJ, Nagarajan SR, Butler LM. Tumour fatty acid metabolism in the context of therapy resistance and obesity. Nat Rev Cancer (2021) 21(12):753–66. doi: 10.1038/s41568-021-00388-4
81. Zhu J, Thompson CB. Metabolic regulation of cell growth and proliferation. Nat Rev Mol Cell Biol (2019) 20(7):436–50. doi: 10.1038/s41580-019-0123-5
82. Zhang S, Sun Z, Jiang X, Lu Z, Ding L, Li C, et al. Ferroptosis increases obesity: Crosstalk between adipocytes and the neuroimmune system. Front Immunol (2022) 13:1049936. doi: 10.3389/fimmu.2022.1049936
83. Jiang L, Kon N, Li T, Wang SJ, Su T, Hibshoosh H, et al. Ferroptosis as a P53-mediated activity during tumour suppression. Nature (2015) 520(7545):57–62. doi: 10.1038/nature14344
84. Rashid A, Wang JS, Qian GS, Lu BX, Hamilton SR, Groopman JD. Genetic alterations in hepatocellular carcinomas: Association between loss of chromosome 4q and P53 gene mutations. Br J Cancer (1999) 80(1-2):59–66. doi: 10.1038/sj.bjc.6690321
85. Donehower LA, Soussi T, Korkut A, Liu Y, Schultz A, Cardenas M, et al. Integrated analysis of Tp53 gene and pathway alterations in the cancer genome atlas. Cell Rep (2019) 28(11):3010. doi: 10.1016/j.celrep.2019.08.061
86. Yarchoan M, Albacker LA, Hopkins AC, Montesion M, Murugesan K, Vithayathil TT, et al. Pd-L1 expression and tumor mutational burden are independent biomarkers in most cancers. JCI Insight (2019) 4(6). doi: 10.1172/jci.insight.126908
87. Gok Yavuz B, Hasanov E, Lee SS, Mohamed YI, Curran MA, Koay EJ, et al. Current Landscape and Future Directions of Biomarkers for Immunotherapy in Hepatocellular Carcinoma. J Hepatocell Carcinoma (2021) 8:1195-207. doi: 10.2147/jhc.S322289
Keywords: hepatocellular carcinoma, ferroptosis, molecular typing, prognosis, tumor microenvironment, immunotherapy
Citation: Zhu J, Xu X, Jiang M, Yang F, Mei Y and Zhang X (2023) Comprehensive characterization of ferroptosis in hepatocellular carcinoma revealing the association with prognosis and tumor immune microenvironment. Front. Oncol. 13:1145380. doi: 10.3389/fonc.2023.1145380
Received: 16 January 2023; Accepted: 15 March 2023;
Published: 27 March 2023.
Edited by:
Lujun Shen, Sun Yat-sen University Cancer Center (SYSUCC), ChinaReviewed by:
Qiao Zhou, Sichuan Academy of Medical Sciences and Sichuan Provincial People’s Hospital, ChinaWeijie Sun, Anhui Medical University, China
Copyright © 2023 Zhu, Xu, Jiang, Yang, Mei and Zhang. This is an open-access article distributed under the terms of the Creative Commons Attribution License (CC BY). The use, distribution or reproduction in other forums is permitted, provided the original author(s) and the copyright owner(s) are credited and that the original publication in this journal is cited, in accordance with accepted academic practice. No use, distribution or reproduction is permitted which does not comply with these terms.
*Correspondence: Xiaochun Zhang, zxc9670@qdu.edu.cn
†These authors contributed equally to this work and share first authorship