 Gang Wang1†
 Huanhuan Huang
 Chao Ni
- 1Department of Surgical Oncology, The First Affiliated Hospital of Bengbu Medical College, Bengbu, Anhui, China
- 2Department of Breast Surgery, Second Affiliated Hospital, Zhejiang University, Hangzhou, Zhejiang, China
- 3Key Laboratory of Tumor Microenvironment and Immune Therapy of Zhejiang Province, Second Affiliated Hospital, Zhejiang University, Hangzhou, Zhejiang, China
- 4Cancer Center, Zhejiang University, Hangzhou, China
- 5Department of Breast Surgery, Affiliated Hangzhou First People’s Hospital, Zhejiang University, Hangzhou, Zhejiang, China
Triple-negative breast cancer (TNBC) is one of the most aggressive breast cancer subtypes and is characterized by abundant infiltrating immune cells within the microenvironment. As standard care, chemotherapy remains the fundamental neoadjuvant treatment in TNBC, and there is increasing evidence that supplementation with immune checkpoint inhibitors may potentiate the therapeutic efficiency of neoadjuvant chemotherapy (NAC). However, 20-60% of TNBC patients still have residual tumor burden after NAC and require additional chemotherapy; therefore, it is critical to understand the dynamic change in the tumor microenvironment (TME) during treatment to help improve the rate of complete pathological response and long-term prognosis. Traditional methods, including immunohistochemistry, bulk tumor sequencing, and flow cytometry, have been applied to elucidate the TME of breast cancer, but the low resolution and throughput may overlook key information. With the development of diverse high-throughput technologies, recent reports have provided new insights into TME alterations during NAC in four fields, including tissue imaging, cytometry, next-generation sequencing, and spatial omics. In this review, we discuss the traditional methods and the latest advances in high-throughput techniques to decipher the TME of TNBC and the prospect of translating these techniques to clinical practice.
Introduction
Triple-negative breast cancer (TNBC), defined by the absence of estrogen receptor (ER), progesterone receptor (PR), and human epidermal growth factor receptor 2 (HER2), accounts for approximately 25-30% of all breast cancers and exhibits poor prognosis and strong invasiveness (1) As the standard treatment strategy for early-stage TNBC, neoadjuvant chemotherapy (NAC) not only provides opportunities for breast conservation and sparing axillary lymph node dissection but also identifies patients with residual disease at high risk of relapse (2). Although approximately 30% of TNBC patients who receive NAC achieve a complete pathological response (pCR) (3), the remaining patients with residual disease require supplemental adjuvant chemotherapy or targeted regimens. Given that tumor-infiltrating lymphocytes (TILs) have been found to be more extensive in TNBC than in other breast cancer subtypes, randomized clinical trials have been conducted to investigate the strategy of combining immune checkpoint inhibitors (such as anti-PD-1 and anti-PD-L1) with traditional chemotherapy in NAC. However, the discrepancy in the results among relevant clinical studies suggests that the dynamic changes in the tumor immune microenvironment (TME) need to be elucidated under different treatments (4–7). Traditional methods, including immunohistochemistry, bulk tumor sequencing, and flow cytometry, may not comprehensively elucidate the TME of breast cancer, and the function of some subsets of cells present in relatively low proportions may also be underestimated (8–10). In addition, the dynamic TME landscape of pre- and post-NAC breast cancer is still poorly studied with these methods (11–13). With the development of diverse high-throughput technologies and bioinformatics analysis methods, recent reports have opened a new horizon of NAC-induced alterations in tissue imaging, cytometry, next-generation sequencing, and spatial omics at the single-cell level in breast cancer (Figure 1). In this review, we discuss the latest updates on immune infiltrate alterations in the multiomics layer and present a structured review of traditional pathological and emerging bioinformatics approaches in terms of the TME in TNBC patients receiving neoadjuvant treatments, which may help to improve the understanding of how NAC remodels the TME in TNBC.
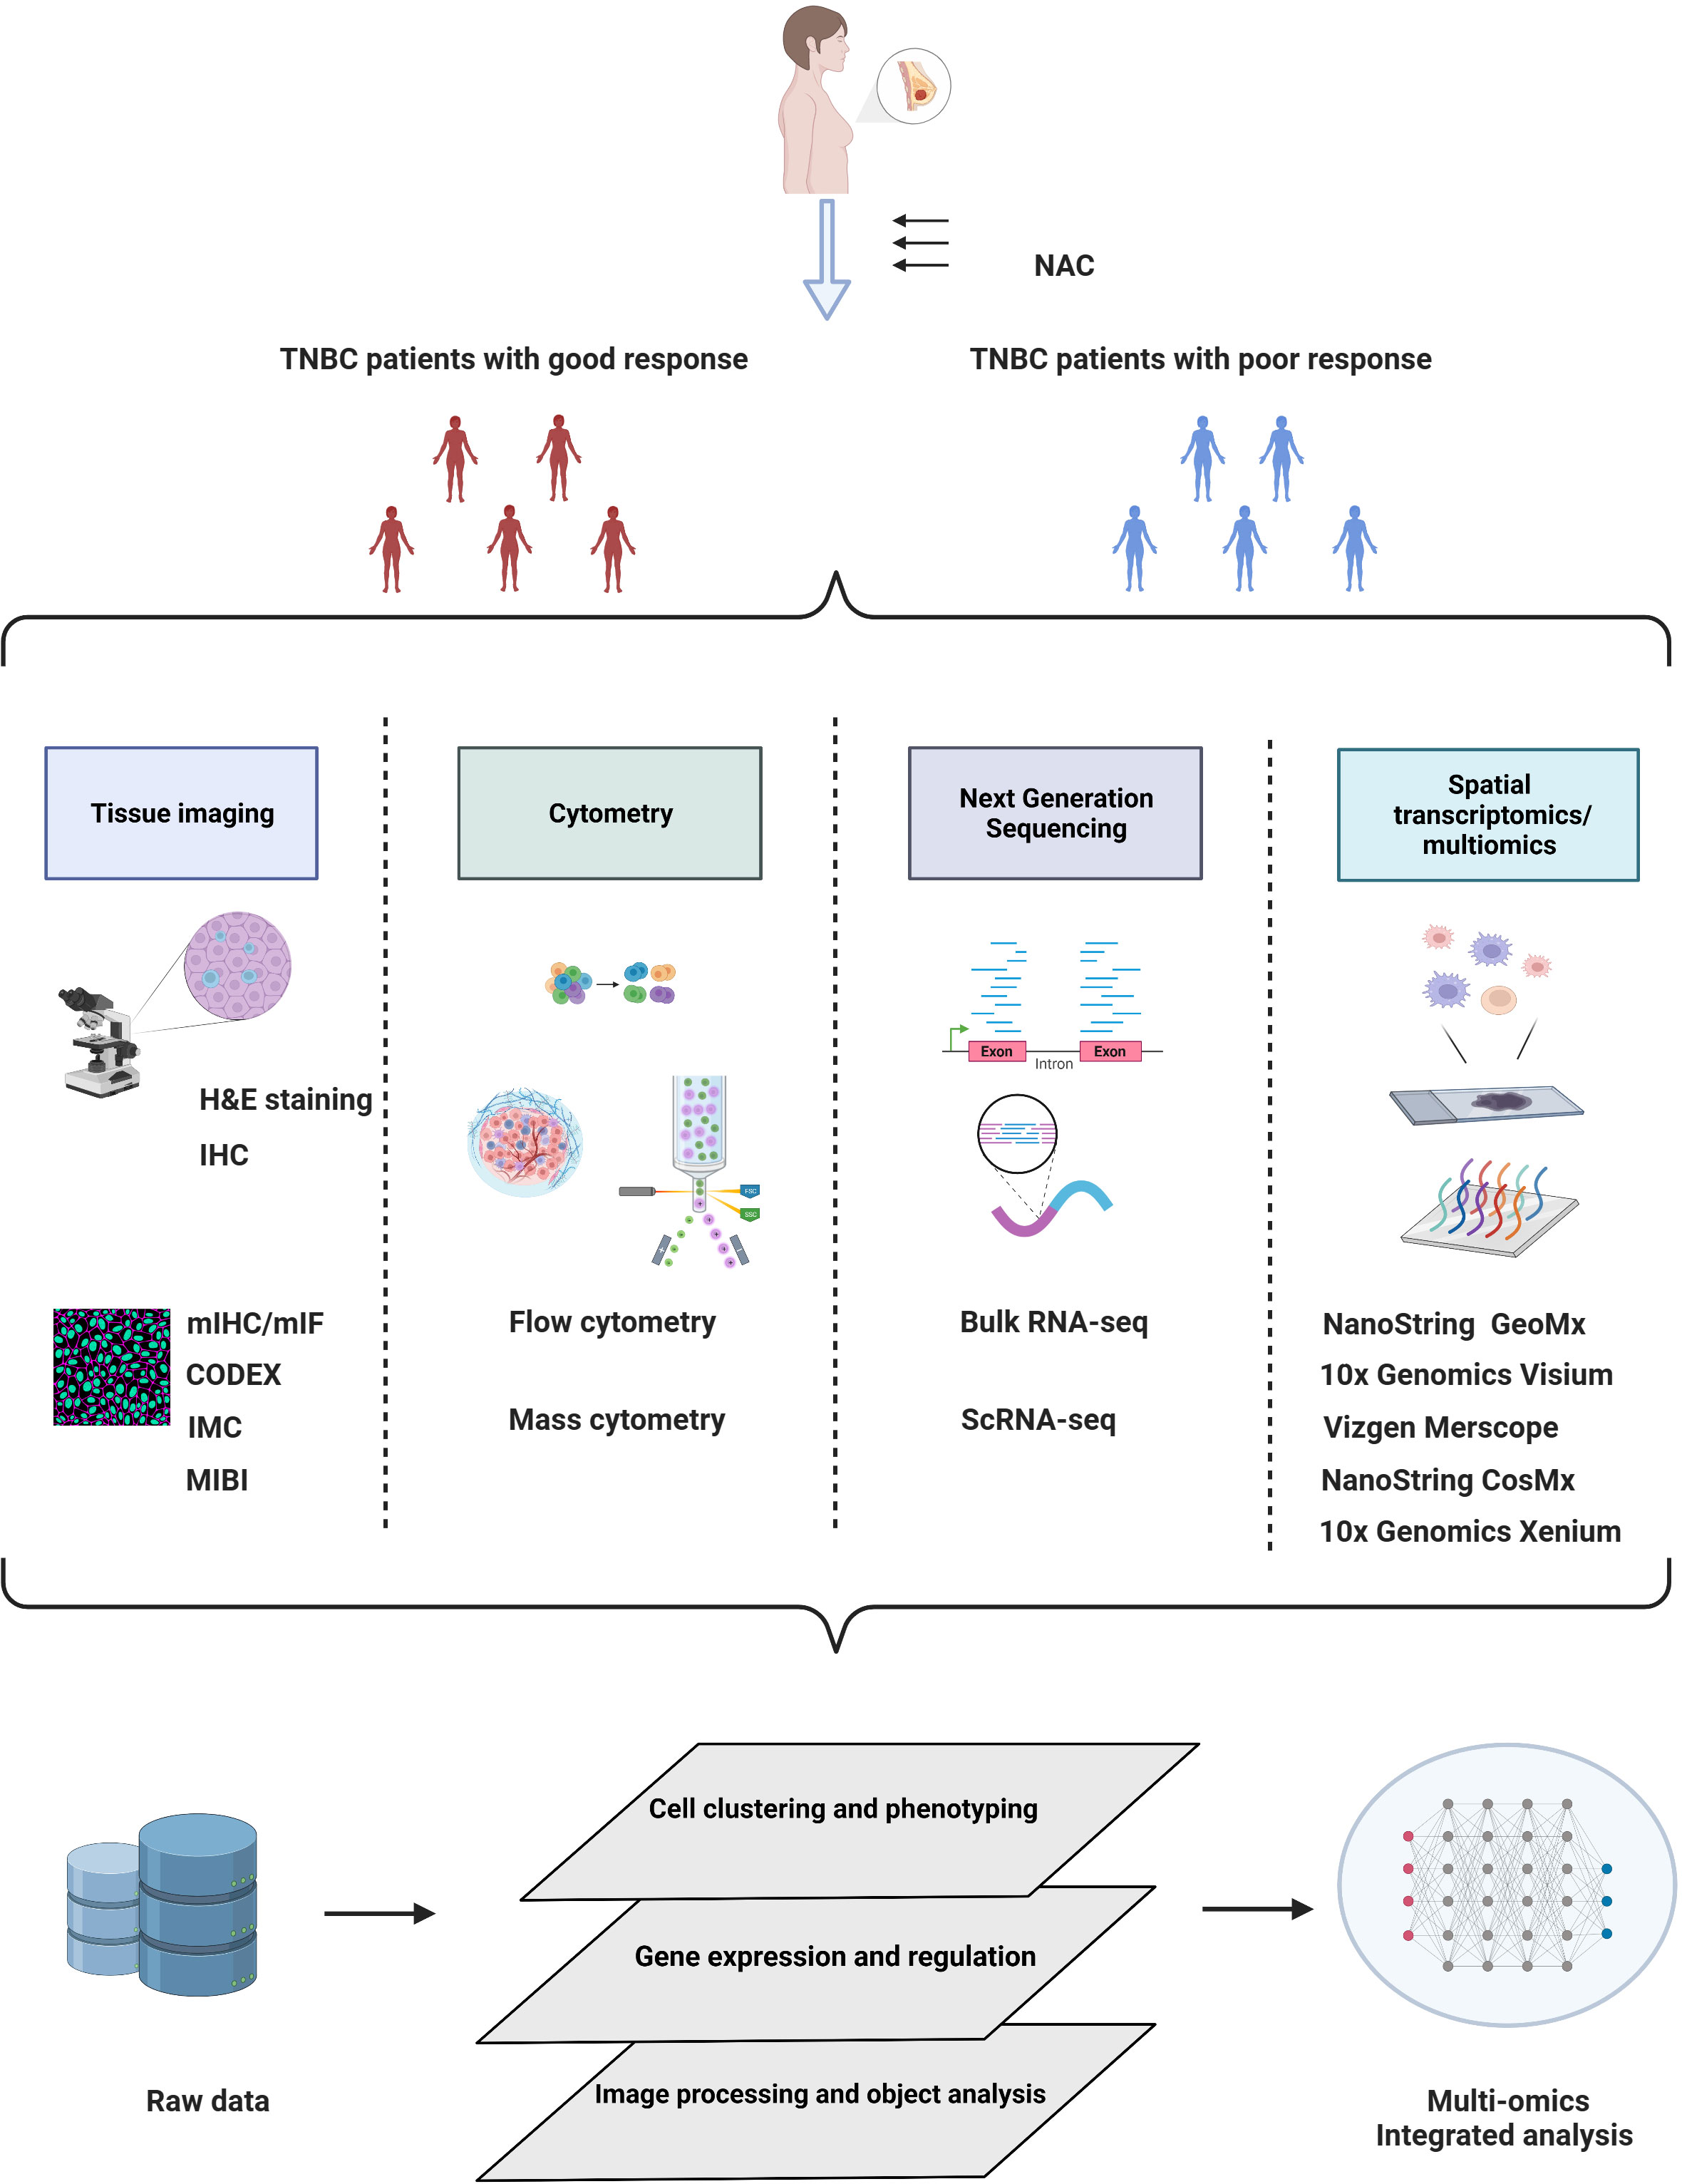
Figure 1 Schematic overview of multiomics approaches in TNBC studies under neoadjuvant chemotherapy. Elucidation of the TME by multiomics tumor profiling may enhance the development of novel biomarkers and therapeutic targets for NAC treatment. Created with BioRender.com.
Tissue imaging
Hematoxylin and eosin staining
To date, morphological identification of TILs in breast cancer with hematoxylin and eosin (H&E) staining remains the most traditional and widely applied method. In 1990, Crescitelli et al. first reported that lymphocyte infiltrates were an independent critical predictor of breast cancer, particularly in rapidly proliferating, axillary lymph node-negative tumors, compared to slowly proliferating or axillary lymph node-positive tumors (14, 15). In a retrospective study that collected 1058 samples from two NAC clinical trials with H&E-stained sections, the presence of tumor-associated lymphocytes in breast cancer was first reported as an independent predictor of response to anthracycline/taxane-based neoadjuvant chemotherapy (15). In addition, intraepithelial lymphocytes inside tumor cell nests or in direct contact with tumor cells were defined as intratumoral TILs, whereas lymphocytes in the tumor stroma without direct contact with tumor cells were defined as stromal TILs; both types were confirmed to have predictive value for pCR. With evidence accumulating for a strong correlation between TILs and NAC response in breast cancer, the specialist consensus on the standardized method to evaluate TILs based on H&E-stained tissue sections was published by the International TILs Working Group in 2014 (16). In this consensus, the area selected for TIL evaluation and assessment methodology was described in detail; however, the interobserver variability remains substantial in the assessment of stromal TILs (17) or intratumoral TILs (18). To overcome the heterogeneity among pathologists and among guidelines, TIL evaluation assisted by machine-learning technology for TIL scoring is under development (19–21), mainly aiming to improve analytical standardization and reproducibility. In two interlaboratory comparison trials using identical samples, the intraclass correlation coefficient (ICC) for TIL evaluation among 32 pathologists in Ring Study 1 was 0.7, whereas in Ring Study 2, a software-guided image evaluation system enhanced the ICC to 0.89 (22). Computer-assisted TIL assessment holds promise for complementarity to the present pathological examination of breast tumors. Manual TIL counting fails to count all cells and measure the precise stromal area in the entire sample. Recently, Eva et al. presented a fully automated digital image analysis pipeline and demonstrated that their H&E-based pipeline provides a quantitative and interpretable score comparable with manually derived TIL status (19).
Although computational assistance technology has greatly improved the efficiency and reproducibility of TIL counting, the analyses are still based on the gross morphology of the lymphocyte entirety on H&E slides. Quantitative assessment of polymorphonuclear leukocytes, granulocytes, and other mononuclear cells, such as dendritic cells and macrophages, is typically not mentioned (16). In addition, increasing evidence suggests that the changes in the proportion and phenotype of various immune subpopulations are inconsistent during NAC (23, 24). Therefore, a more thorough assessment is required to decipher the relative proportion of specific immune subpopulations and spatial structural features, including tertiary lymphoid structures (25).
Conventional immunohistochemistry
Conventional immunohistochemistry (IHC) is one of the most common methods for investigating the immune content of a tissue by detecting characteristic markers using specific antibodies. Compared to H&E staining, IHC allows labeling of different immune cell compositions to determine their association with treatment response or tumor prognosis, including TNBC. In a retrospective study based on double-staining immunohistochemistry, Miyashita et al. first reported that high CD8+ TILs and a high CD8/FOXP3 ratio in residual tumors following NAC exhibit strong prognostic significance in TNBC patients (26). IHC for PD-L1 has been performed on paraffin-embedded tumor samples from core needle biopsies from 94 breast cancer patients before NAC, identifying PD-L1 expression as a predictor of pCR and a prognostic factor of disease-free survival (DFS) in breast cancer patients (27). In addition, Gomez-Macias et al. assessed the TIL profile in TNBC before NAC by IHC on core needle biopsies, and they identified a more accurate association of the high expression levels of the CD3, CD4, CD8, CD45, and CD20 genes with partial and complete pathological responses to NAC in patients with TNBC (28).
With the advantages of rapid and feasible processing and low cost, IHC is still widely used in studies despite a variety of emerging technologies that have been developed. However, traditional IHC is a semiquantitative and observer-dependent technique. In terms of the IHC assessment of PD-L1 expression, the definition of a PD-L1+ sample has not been completely established to date. Some researchers solely detect PD-L1 on tumor cells or immune cells, whereas others evaluate PD-L1 expression regardless of cell type (29), which may affect the consistency of PD-L1 evaluation among different research platforms. In addition, similar to TIL counting based on H&E staining, the inevitably high interobserver variability of biomarker assessment by IHC is another impediment. In a study assessing interobserver variation of PD-L1 IHC (SP142 antibody) in breast cancer, 38% of cases did not reach total agreement among all eight pathologists (30). PD-L1 expression in immune cells (0.172-0.229) evaluated by pathologists has also shown poor consistency (ICC, 0.832-0.882) (31). In addition, it has been reported that multiple variables, such as tissue processing, antibodies, staining design, and scoring systems, may also affect IHC results (32, 33). For the analysis of small and precious tumor samples, such as core needle biopsy or unconventional proteins, the application of IHC may be restricted due to the uncertainty of antibody concentration. However, a major limitation of conventional IHC is that it only identifies a single or at most two markers per tissue section, while some cell subsets require multiple markers to be defined. Therefore, conventional IHC fails to meet the needs of researchers, and the multiplex fluorescent IHC approach has been utilized as a solution.
Multiplex immunohistochemistry/immunofluorescence
Multiplex immunohistochemistry/immunofluorescence (mIHC/IF) offers an upgraded strategy over standard chromogenic IHC due to multiplex staining and standardized quantitative analysis (34). Using a multispectral IF (mIF) platform, the quantification of six to eight markers in a single FFEP tissue section can be achieved (35). The mIF image analyzed by inForm image software correlates the spectral signals to biomarkers and histomorphology information, achieving cell type identification and standardization of quantitative analysis. A quantitative immunofluorescence (QIF) assay was first developed by Brown et al. in 2014 for measuring CD3, CD8, and CD20 expression on a single slide, which confirmed the predictive value of different lymphocyte subsets in breast cancer following NAC (36). Of note, mIHC/IF depicts the spatial biology of the TME and achieves both quantification and localization of immune marker expression. Mani et al. used PerkinElmer Vectra multiplexed QIF to analyze the location and heterogeneity of TILs by quantifying cytokeratin, CD3, CD8, and CD20 expression in tissue sections from different breast cancer subtypes (37). Furthermore, mIF is available to assess treatment-related effects on specific cell lineages in both the stromal and tumor compartments. Applying Akoya Bioscience OPAL 7-plex mIHC to the first cycle of NACT in the WSG-ADAPT-TN trial (n=66 TNBC patients), the increase in PD-1-+ CD4 and PD-1+ CD8 infiltration in both the tumor and in the stroma were significantly correlated with higher pCR (38). In another neoadjuvant PAMELA phase II trial, 231 regions of interest (ROIs) from 129 HER2+ breast cancer patients were stained with six markers, including cytokeratin, Ki67, and four immune-related T-cell lineage markers (CD3, CD4, CD8, and Foxp3). Using the Discovery Ultra Autostainer (Ventana Medical Systems, Tucson AZ), the researchers found that the distance between CD3+/CD8+ T cells and cancer cells was shortened under anti-HER2-based neoadjuvant treatment, indicating the strong predictive value of the spatial relationships of specific immune cell subsets and tumor cells (39).
The main advantage of mIHC/IF is the simultaneous detection of multiple markers on a single tissue section. Detecting various markers on a single section is crucial due to the low availability of NAC tissue samples. In addition, the objectivity, accuracy, and sensitivity of QIF have been confirmed in comparison with IHC (40). Previous research has suggested that PD-L1 expression assessed by IHC is not sufficiently sensitive to predict the response to anti-PD-1/PD-L1 treatment (41, 42). By reviewing tumor specimens from 8135 patients with over 10 solid tumor types, Taube et al. found that mIHC/IF showed a higher accuracy in predicting the clinical response to anti-PD-1/PD-L1 therapy than PD-L1 IHC, and the former involved the analysis of PD-1 to PD-L1 proximity and intratumoral/peritumoral CD8+ cell density (43). Additionally, mIF combined with hierarchical linear modeling allows for a more precise estimation of TILs and PD-L1 expression increases by lessening the impact of intratumoral heterogeneity on cell counting (44).
Although mIHC/IF has achieved great advances, applying the technology in routine clinical practices still faces obstacles due to the complex staining procedure, longer turnaround time than traditional IHC, and requirements of antibody optimization, panel optimization, experienced pathologists, and sophisticated software. Therefore, several commercial kits, such as TSA-Opal automation IHC kits and commercial multispectral mIF platforms from Akoya Biosciences, have been developed to evaluate immuno-oncology targets in FFPE tumor tissue, making the process more feasible, efficient, and reproducible. Moreover, a reported mIHC/IF staining protocol applied to the commonly used clinical diagnostic autostainer, namely, the Leica Bond Max, enhances the translation to clinical routine (45). A previous study using an Opal 7-color automated IHC detection kit on a Leica Bond Rx autostainer has reported that it requires approximately 12-13 h to complete a six-plex assay on 30 slides concurrently, and high reproducibility in measuring immune cell density and PD-L1 coexpression has been demonstrated among six laboratories (46). Similarly, a commercial mIF assay, known as InSituPlex, can be performed on an existing fluorescence microscope, simplifying the staining procedure (47). For example, Rimm et al. retrospectively analyzed pretreatment core needle biopsies obtained from 69 TNBC patients with an Ultivue DNA-based Ultimapper kit. The authors suggested that, in patients who achieved pCR under NAC, PD-L1 expression was significantly higher in tumor cells, CD68+ cells, and stroma than in nonpCR patients. In contrast, the number of total CD68+ cells in the tumor or stromal compartments was similar between pCR and nonpCR cases (48).
Spatial proteomics
Traditional imaging technology fails to depict the TME in detail due to low plex. For an in-depth understanding of the TME, it is crucial to capture the spatial proteome, including subcellular protein localization and the dynamic relationship between subcellular protein localization and protein function. Accumulating spatial proteomics technologies, including GeoMx Digital Spatial Profiler (DSP) and cyclic immunofluorescence-based CODEX and Multi-Omy as well as mass spectrometry (MS)-based imaging mass spectrometry (IMS) and multiplex ion-beam imaging (MIBI), are available for deconvoluting the spatial constitution of the TME at the single-cell level or close to the single-cell level, and the distinctive features of these technologies have been comprehensively discussed previously (49). Here, we mainly review these novel findings in breast cancer, particularly in TNBC, based on these high-throughput multiplex staining methods. A representative spatial proteomics technology based on fluorescence imaging is the codetection by indexing (CODEX) single-cell proteomics analysis platform developed by Akoya (50). With the application of CODEX to quantify immune infiltration inside quiescent cancer cells (QCCs) in a TNBC mouse model, Baldominos et al. confirmed markedly reduced immune infiltration within the QCC niche, and they also identified DCs with lower MHCII and exhausted T cells within the QCC niche (51). Imaging mass cytometry (IMC) and multiplexed ion beam imaging (MIBI) are typical mass spectrometry-based spatial proteomics techniques. IMC allows simultaneous multiplexed imaging of up to 40 proteins with subcellular spatial resolution (52, 53). Simultaneous multiplexed detection of mRNA, proteins, and protein phosphorylation through imaging mass cytometry has been achieved in a cohort of 70 breast cancer samples, revealing the significant spatial interactions among CXCL10high cells (macrophages, fibroblasts, T cells, and epithelial cells) with each other (54). Another mass cytometry imaging approach is MIBI (55), which uses the secondary ionization mass spectrometry principle, whereas IMC utilizes laser ablation. Keren et al. performed the first study capturing features and the spatial orientation of immune cells within the TME via MIBI from 41 TNBC patients (56); they divided tumors into cold, mixed, and compartmentalized subtypes by assessing the spatial proximity of cell types, and highly ordered structures with PD-L1 and IDO along the tumor-immune border served as a dominant feature of tumor compartmentalization and were associated with favorable survival.
Cytometry
Flow cytometry
Compared to H&E staining or IHC, flow cytometry (FCM) is a relatively high-throughput technology extensively used in studies on cancer immunity that enables the rapid quantification of multiple parameters of immune cell populations or particles. Based on single-cell suspensions, including dissociated solid tissue and various body fluids, FCM can measure cell size, granularity, and the expression level of cell surface and intracellular molecules (57, 58). Compared to IHC, the advantage of FCM is that it incorporates quantitative and functional evaluation of tissues and circulating immune cell repertoires, whereas IHC is limited to the tissue level. However, tissue biopsy during NAC is challenging, and circulating immune cells have been extensively evaluated during NAC. Previous studies have indicated that these circulating cells may also be informative and capable of serving as promising biomarkers to predict treatment response (59–61). A study quantifying myeloid-derived suppressor cells (MDSCs) and Tregs by flow cytometry in blood samples from 34 pre-NAC TNBC patients has revealed a negative correlation between early MDSC (eMDSC) levels and NAC response (61). In contrast, the peripheral blood level of granulocytic MDSCs (G-MDSCs) is also increased during chemotherapy with doxorubicin and cyclophosphamide but has no relation to pCR (10). By detecting the expression of surface receptors on CD8+ T cells before and four months after NAC, it has been found that an increase in P2X7 expression and a decrease in A2A receptor expression indicate a better response (62). In addition, FCM is also capable of detecting the expression of intracellular proteins, which allows researchers to determine the functional state of immune cells (57). For example, granzyme B/perforin levels in circulating NK cells have been reported to be reduced during NAC, which is the most significant decrease that appears in advanced breast cancer patients with poor response (63). In another study that collected a series of blood samples from 56 TNBC patients under NAC and extensively evaluated circulating immune cells, B cells, NK cells, and CD4+ T lymphocytes were greatly decreased, whereas the frequency of CD8+ T cells was less affected (64). In addition, functional property analysis has revealed that the expression of the Tim3 exhaustion marker is markedly upregulated in CD8+ T cells, whereas cytotoxic molecules, including perforin and CD3ζ, are lost in NK cells (64).
FCM is a powerful technique for analyzing a single cell; the latest FCM system allows the detection of up to 40 fluorescent parameters. However, the accuracy of the results may be easily affected by the spectral overlap of the fluorescent dyes, especially for cell subsets with low proportions (65, 66). Moreover, the lack of fluorescently labeled antibodies used for certain proteins also limits the application of this method. By analysis of the phenotype or function of cell subpopulations in tissues using flow cytometry, the morphological parameters of the cells are altered when the tissue is enzymatically treated or mechanically dissociated, and the information regarding the spatial location of cells within the whole tissue is lost (67) Therefore, a variety of techniques need to be combined to study the characteristics of the TME at the cellular and spatial levels.
Automated FCM analysis and CyTOF
With significant developments in both lasers and fluorophore reagents, the number of parameters of FCM has been extended from 17 (65) to 40 (68). However, the analysis of traditional FCM data is still dependent on manual gating strategies, which may create interpersonal bias, particularly for multicolor labeling strategies (69). Thus, the improved multiparameter capabilities of FCM require computational flow cytometry to visualize high-dimensional cytometry data to improve accuracy and reproducibility (70). A computational pipeline known as FlowGM, with automated identification of 24 cell types, has been demonstrated to better discriminate monocyte and dendritic cell subpopulations than the traditional gating strategy (71). Other automated cell identification tools, including PhenoGraph (72), SPADE3 (73), FlowSOM (74), SWIFT (75), t-SNE (76), and UMAP (77), distinguish cell populations from cytometry data in both unsupervised and supervised manners (78, 79).
An emerging fusion technology known as mass cytometry or cytometry by time-of-flight (CyTOF) avoids spectral overlap by replacing the fluorophores of probes with isotopically purified metals, which are then detected and quantified by inductively coupled plasma time-of-flight mass spectrometry (ICP-TOF-MS) (80, 81). With the capacity to monitor 34 parameters simultaneously in individual cells, CyTOF enhances the sensitivity of identifying rare cell subpopulations (81, 82).
However, the throughput of mass spectrometry is required to collect millions of cells from an individual sample (80), which is not practical for small tumor and needle biopsy specimens. Thus, to bypass the scarcity of some immune cells, using mass cytometry in the field of peripheral blood samples from breast cancer patients is a promising strategy (83). In a phase 1/2 clinical trial of the nitric oxide synthase inhibitor, L-NMMA, and taxane in TNBC, by analyzing PBMCs using CyTOF (Fluidigm) from two responders and two nonresponders, CD8 effector memory T cells and CD4+ T cells have been found to be increased in responders, whereas nonresponders show a more classical monocyte immunotype (84). Because CyTOF is applied only to cell suspensions, spatial information and cell−cell interactions are lost (85, 86). Preservation of spatial information requires the combination of IHC and CyTOF. With the application of immunohistochemistry, immunocytochemistry, and CyTOF (Fluidigm) in breast cancer FFPE, Giesen et al. achieved higher multiplexed applications at subcellular resolution to depict substantial tumor microenvironment heterogeneity (53).
Next generation sequencing
Bulk tumor RNA sequencing
Deep insight into NAC-induced alterations at the transcriptomic level has been provided through unbiased RNA-seq of paired biopsy specimens collected at a series of time points (Table 1). Bulk tumor RNA sequencing is one of the most valuable and widely used methods for analyzing differential gene expression among various samples (80). Potential cancer biomarkers are continuously being discovered with RNA sequencing (96). For example, by analyzing the expression of 750 immune-related genes from 60 paired pre- and posttreatment breast cancer samples, a set of immune parameters adversely correlated with pCR has been identified, suggesting that regimens targeting mast cell metagenes as well as VEGFB, IL-6 antagonists, and anti-VEGF antibodies may enhance the sensitivity of the tumor to NAC (88). The strongly negative prognostic gene, CDH1, and the positively prognostic gene, CD70, have been identified in the TNBC cohort by analysis of immune gene expression during NAC with the Pan-Cancer Immunology 770 genes panel(NanoString) (89). In post-NAT residual tumors from 62 patients treated with immune gene expression during NAC and anti-EGFR antibodies, 784 genes have been processed( NanoString nCounter), identifying SOX2 and CXCR4 as potential recurrence predictors (91). In addition, by evaluating Affymetrix microarray transcriptomic data from more than 2000 TNBC patients, immune signatures, including IDO1, CXCL9, CXCL10, HLA-DRA, HLA-E, STAT1, and GZMB, have been found to be associated with a favorable prognosis in TNBC patients (97). However, a prospective study with sufficient cohorts is required to validate and confirm the utility of biomarkers.
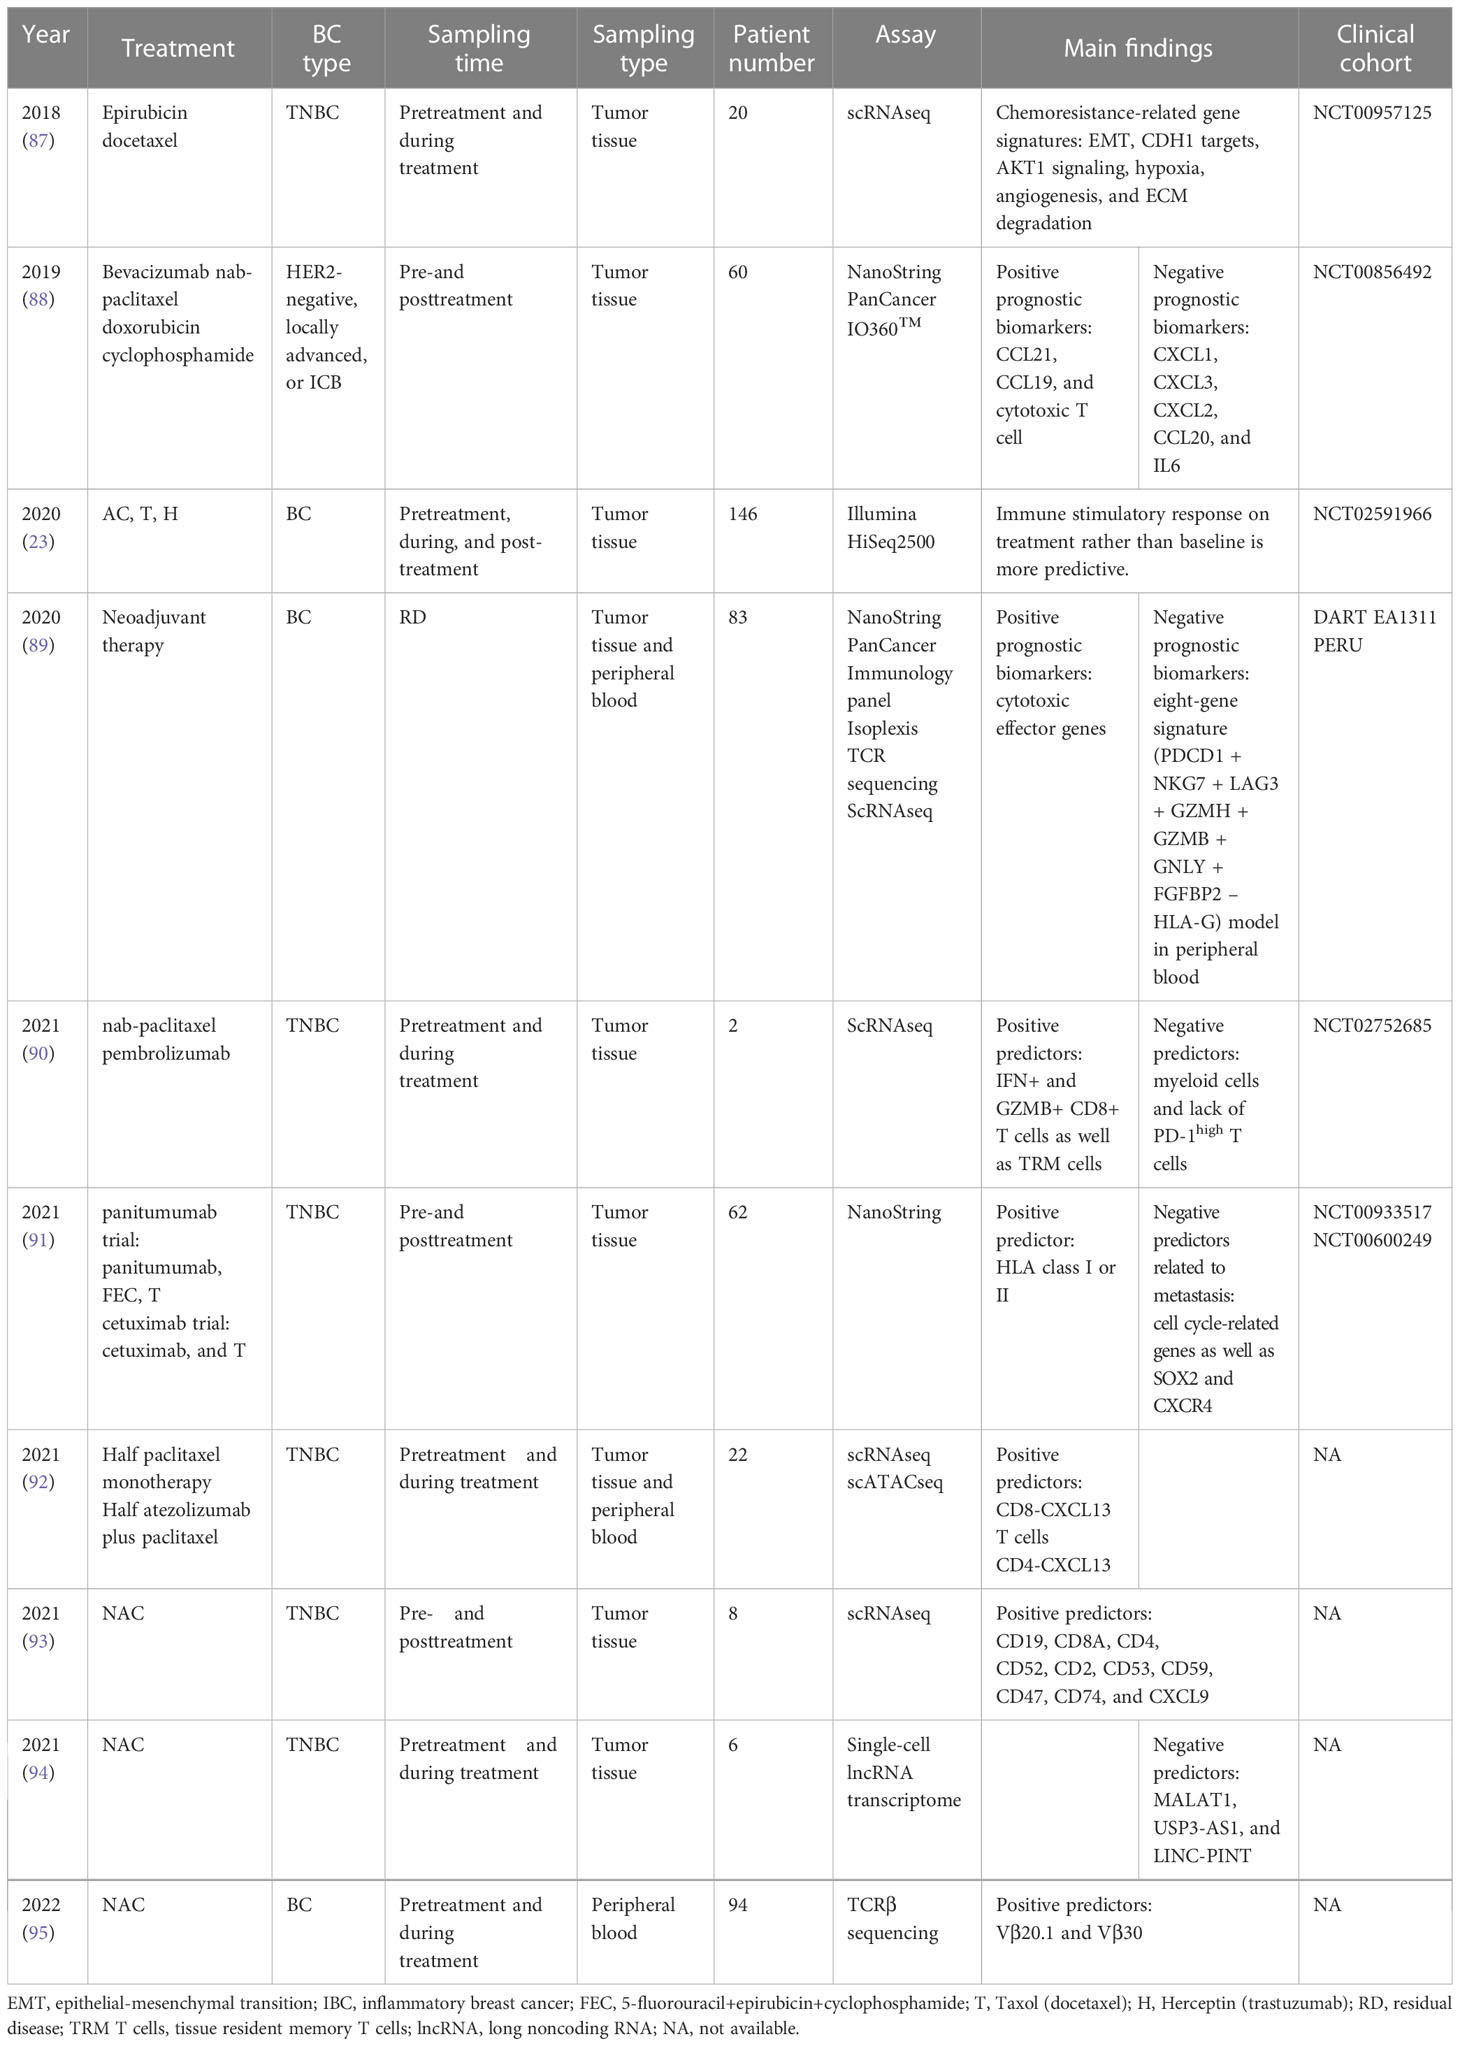
Table 1 NAC studies with transcriptome analysis (characteristics, prognosis, and prediction).
By utilizing approaches based on marker gene expression values (including MCP-counter and xCell) or deconvolution algorithms (including TIMER, CIBERSORT, quanTIseq, and EPIC), it is practicable to reflect the content and subpopulations of tumor-infiltrating immune cells (98–100). Among these methods, EPIC and quanTIseq are the only methods providing an absolute score; MCP-counter and CIBERSORT are recommended in some cases requiring relative scores, and xCell is suggested when focused on a specific cell type (101, 102). For example, regulatory CD4+ T cell (Treg) abundance has been calculated by the xCell algorithm from bulk tumor gene expression data of 5177 breast cancer patients from five independent cohorts, showing the potential of Treg abundance as a biomarker for predicting the response to NAC in TNBC (103). Another RNA-seq profiling analysis that included 110 pairs of serial tumor biopsies collected before NAC, after the first treatment cycle, and at the time of surgery used CIBERSORT to reveal the relative fractions of ten immune cell types among tumor-infiltrating leukocytes, showing an increased abundance of CD4+ and CD8+ T cells induced by the first cycle of NAC (23).
In addition to bulk tumor sequencing, T cell receptor (TCR) sequencing has also been applied to assess the changes in T cell diversity and function induced by NAC in TNBC. TCR is a vital T cell response mediator that acts through antigen recognition (104). TCR sequencing identifies T cell clone TCRs and assesses their response to tumor antigens, offering an accurate perspective of T cells (105). In a cohort of eight formalin-fixed paraffin-embedded (FFPE) samples from TNBC, T cell receptor (TCR) β chain sequencing and clonality quantification have demonstrated a downward trend in T cell clonality but recruitment of novel clones during the NAC period (89). Another TCR sequencing study of peripheral blood samples from 94 breast cancer patients has shown that the diversity of the circulating TCRβ repertoire gradually decreases during NAC and is positively correlated with a better response (95). This effect is consistent with several findings that newly recruited tumor-specific T cells from outside the tumor play a crucial role in robust antitumor responses induced by PD-1 blockade (60, 106, 107).
With the advancement of systems biology methods, data derived from high-quality RNA-seq are much more convenient and cost-effective than multiplex immunohistochemistry/immunofluorescence (mIHC/IF) for interrogating a tumor transcriptome and its microenvironment. However, limitations still exist: (i) the quality of RNA extraction is easily affected by the sample storage time and temperature, resulting in high degradation, particularly when stored as FFPE tissue (108, 109); (ii) the average gene expression profile from bulk RNA-Seq may conceal the accurate signals induced by rare cell populations or cell types; and (iii) bulk RNA-seq is unable to provide spatial information regarding the TME (110).
Single-cell RNA sequencing
Due to the complexity and heterogeneity of the TME, bioinformatics analysis based on bulk tumor gene expression profiles still cannot wholly fulfill the need for understanding the diversity of both stromal and tumor cells in the TME, particularly for undefined cell subpopulations, which prompts the emergence of single-cell technology. Single-cell RNA sequencing (scRNAseq) was first described and performed in studies by Tang et al. in 2009, in which scRNAseq on a single blastomere detected 5270 more genes than microarrays employing hundreds of blastomeres (111). In recent years, several scRNAseq methods with increasing sensitivity have been rapidly developed and intensively applied in various research fields (112, 113). Several studies have investigated the cell subclonal constitution in tumor specimens or circulation using single-cell analysis. For example, a clustering analysis of more than 5000 single cells from four responders and four nonresponders pre- and post-NAC treatment has identified CD45+EPCAM- clusters, which signify immune cell activation before NAC, as a hallmark of tumor extinction (93). Deng et al. (90) evaluated the difference in tumor-infiltrating immune cells at baseline and during treatment at the single-cell level (10x Genomics) in two metastatic TNBC patients treated with the combination of nab-paclitaxel and pembrolizumab; the enrichment of IFN+ and GZMB+ CD8+ T cells was well as TRMs was found in responders at baseline, whereas significant myeloid infiltrates accompanied by the absence of PD-1-high T cells at baseline were features of nonresponders, thereby indicating the potential prognostic value of these cell subsets as predictors for immunochemotherapy. Zhang et al. performed 10x Genomics single-cell RNA sequencing and transposase-accessible chromatin (ATAC) sequencing of tissue samples from 22 patients with advanced TNBC who had received paclitaxel chemotherapy alone or in conjunction with the anti-PD-L1 antibody atezolizumab (92); they focused on the orchestrated immune response between B cells and CXCL13-CD4 T cells, and their research results suggested a strategy of dampening antitumor CXCL13+ T cells and recruiting immunosuppressive macrophages induced by nab-paclitaxel to overcome immunochemotherapy resistance. In addition to looking for predictive cell subsets within the TME, the transcriptional changes in peripheral immune cells during NAC have also been evaluated in breast cancer patients. By performing scRNAseq (10x Genomics) on PBMCs collected during NAC, the downregulation of IFNα and IFNγ signaling pathways and the occurrence of immune exhaustion on immune cells induced by NAC have been observed (114). scRNAseq (10x Genomics) of peripheral CD8+ PD-1hi T cells from TNBC patients post-NAC has identified an eight-gene score significantly associated with ongoing disease (89).
In addition to the increasing reports on how NAC remodels the TME, the evolution of malignant cells during NAC in TNBC has also been assessed utilizing scRNAseq. Using Nanogrid Single-Nucleus RNA Sequencing (WaferGen BioSystems) to analyze longitudinal samples from eight TNBC patients, Kim et al. reported that the resistant genotypes are preexisting and enriched by NAC, whereas resistance transcriptional profiles are mainly acquired during chemotherapy in TNBC patients (87). In addition, the effects of NAC on noncoding RNAs have also been explored in TNBC at the single-cell level. Shaath et al. identified the lncRNA transcriptional landscape by employing 1758 single cells from TNBC patients, and they found that the long lncRNA MALAT1 is upregulated during NAC and contributes to chemoresistance (94). With an exponential increase in the number of cells and genes, the fine resolution of single-cell transcriptomes has facilitated a deeper understanding of distinct immune subpopulation changes and cancer cell evolution under selective pressure from chemotherapy.
While scRNAseq has significantly advanced the understanding of the variability and diversity of cell subpopulations, there are still some challenges to applying scRNAseq in immuno-oncology. The accuracy is hindered by technological noise and batch effects (115). Because reanalyses of raw sequencing data in different studies are inaccessible, uploading data in public repositories should be promoted. Furthermore, due to a lack of information on posttranscriptional and posttranslational modifications, scRNAseq analysis does not always accurately reflect protein expression levels, causing conflicting evidence for the same event (116).
Spatial transcriptomics
In addition to the transcriptional level and the constitution of cells within the TME, increasing evidence has revealed that the spatial location of cells also determines the efficacy of NAC and that NAC remodels the spatial relationship between stromal cells (117). In addition, understanding intricate spatial arrangements helps to understand how tumor cells interact, evade immune surveillance, and evolve drug resistance. The platform from 10x Genomics and the DSP from NanoString Technologies are the two commercially available spatial RNAseq technologies. A recent study has analyzed the spatial expression of 286 pharmacogenetics in 6 breast cancer tissues using the Visium spatial transcriptomics platform, which demonstrated that the expression of genes associated with reactive oxygen species (ROS) handling and detoxification mechanisms is highly heterogeneous within tumors relative to surrounding nontumor regions, particularly GPX4, GSTP1, MGST3, SOD1, CYP4Z1, CYB5R3, GSTK1, and NAT1 (118). To reveal a more comprehensive characterization of molecular diversity in mediating the chemotherapeutic response of TNBC, Kulasinghe et al. applied DSP in 24 TNBC tissue samples to quantify and analyze the differential expression of 68 targets in the tumor and TME compartments between responsive and nonresponsive tumors; elevated ER-alpha expression as well as reduced 4-1BB and MART1 expression within the stromal compartment are implicated in the adjuvant chemotherapy response, whereas increased GZMA, STING, and fibronectin levels as well as decreased CD80 levels are associated with the response within the tumor compartment (119). Similarly, DSP with a panel of 39 markers has also been applied to evaluate the expression of immune-related proteins, including MHCII, in the tumor epithelium of TNBC compared to their expression levels in the stromal compartment; higher HLA-DR levels are present in the tumor epithelial cells of patients with long-term disease-free survival and are also associated with high CD4 and ICOS levels in the stromal compartment (120).
Compared to sequencing-based techniques, such as 10x Visium and DSP, microscopic imaging-based techniques offer higher resolution but capture fewer genes. In addition, the microscopy-based approach not only achieves spatial transcript analysis of hundreds to thousands of target genes but is also compatible with immunofluorescence or DNA-coupled antibody protein reads for FFPE and fresh frozen tissues. The representative commercialization of microscopic imaging-based techniques include 10x Genomics Xenium, NanoString CosMx spatial molecular imager, and Vizgen Merscope (121, 122). Although the principles of the three technologies are based on the same in situ hybridization (ISH) method, each has different characteristics. The initial commercial Xenium kits achieve up to 400 gene plex, while CosMx SMI supports high plex imaging of more than 1000 RNAs (123). The Vizgen MERSCOPE Platform is the first commercial solution for MERFISH technology with imaging resolutions down to 100 nm. With the strategy of expansion-assisted iterative fluorescence ISH (EASI-FISH), the specialty of NanoString CosMX is the ability to offer a 3D resolution of gene expression in tissue and enable 50 nm subcellular resolution in the XY plane (123). These spatially resolved single-cell multiomics provide high-resolution maps of cellular subpopulations in tissue, promoting greater understanding of cell−cell interactions, cellular processes, and biomarker discovery.
The available spatial omics provide a new perspective into the spatial landscape of the tumor TME. However, the major stumbling blocks of spatial transcriptomics and proteomics technologies involve high costs, limitations due to the vast landscape of TME, and time-consuming processes (49). In addition, spatial heterogeneity, such as three types of cell distributions with heterogeneous HER2 status, cannot be disregarded (124). Thus, it is necessary to scan diverse areas, including the invasive front, core, and perimeter, which consumes more precious tissue samples. Furthermore, integrating spatial and other omics data requires developing advanced approaches with higher analytical capabilities (125). With efforts to overcome these issues, spatial omics technologies will become a vital research tool for uncovering spatially heterogeneous features that explain the resistance mechanism of NAC and the scenario of immunotherapy in breast cancer.
Discussion
Collectively, emerging high-throughput technologies and optimized bioinformatics algorithms promise the discovery of novel and more accurate biomarkers to predict the neoadjuvant therapy response and prognosis in breast cancer. In addition, series samples during NAC of TNBC also provide deep insights into how chemotherapy orchestrates immune populations in the TME and peripheral circulation, enabling the search for the dominant cell subsets or factors causing chemoresistance. However, the various techniques have advantages and disadvantages (Figure 2). The cost-effectiveness and practicality of these high-throughput technologies remain a major concern; additionally, analyzing large quantities of data is still time-consuming. Therefore, traditional methods, including IHC, FCM, and bulk-tumor RNA sequencing, are still predominant in clinical practice and the cancer research field. Recently, Shao et al. developed a novel IHC-based TNBC classification corresponding to the classification of TNBC based on RNA-seq (126). Multiomics analysis has also indicated that TNBC patients with higher plasma trimethylamine N-oxide (TMAO) levels achieve better responses to immunotherapy (127). These results demonstrate the robust potential of transferring multiomics research into clinical practice. Therefore, it is hopeful that prospective clinical trials will verify the key information extracted from massive high-throughput multiomics data to distinguish TNBC patients who benefit from certain treatment strategies.
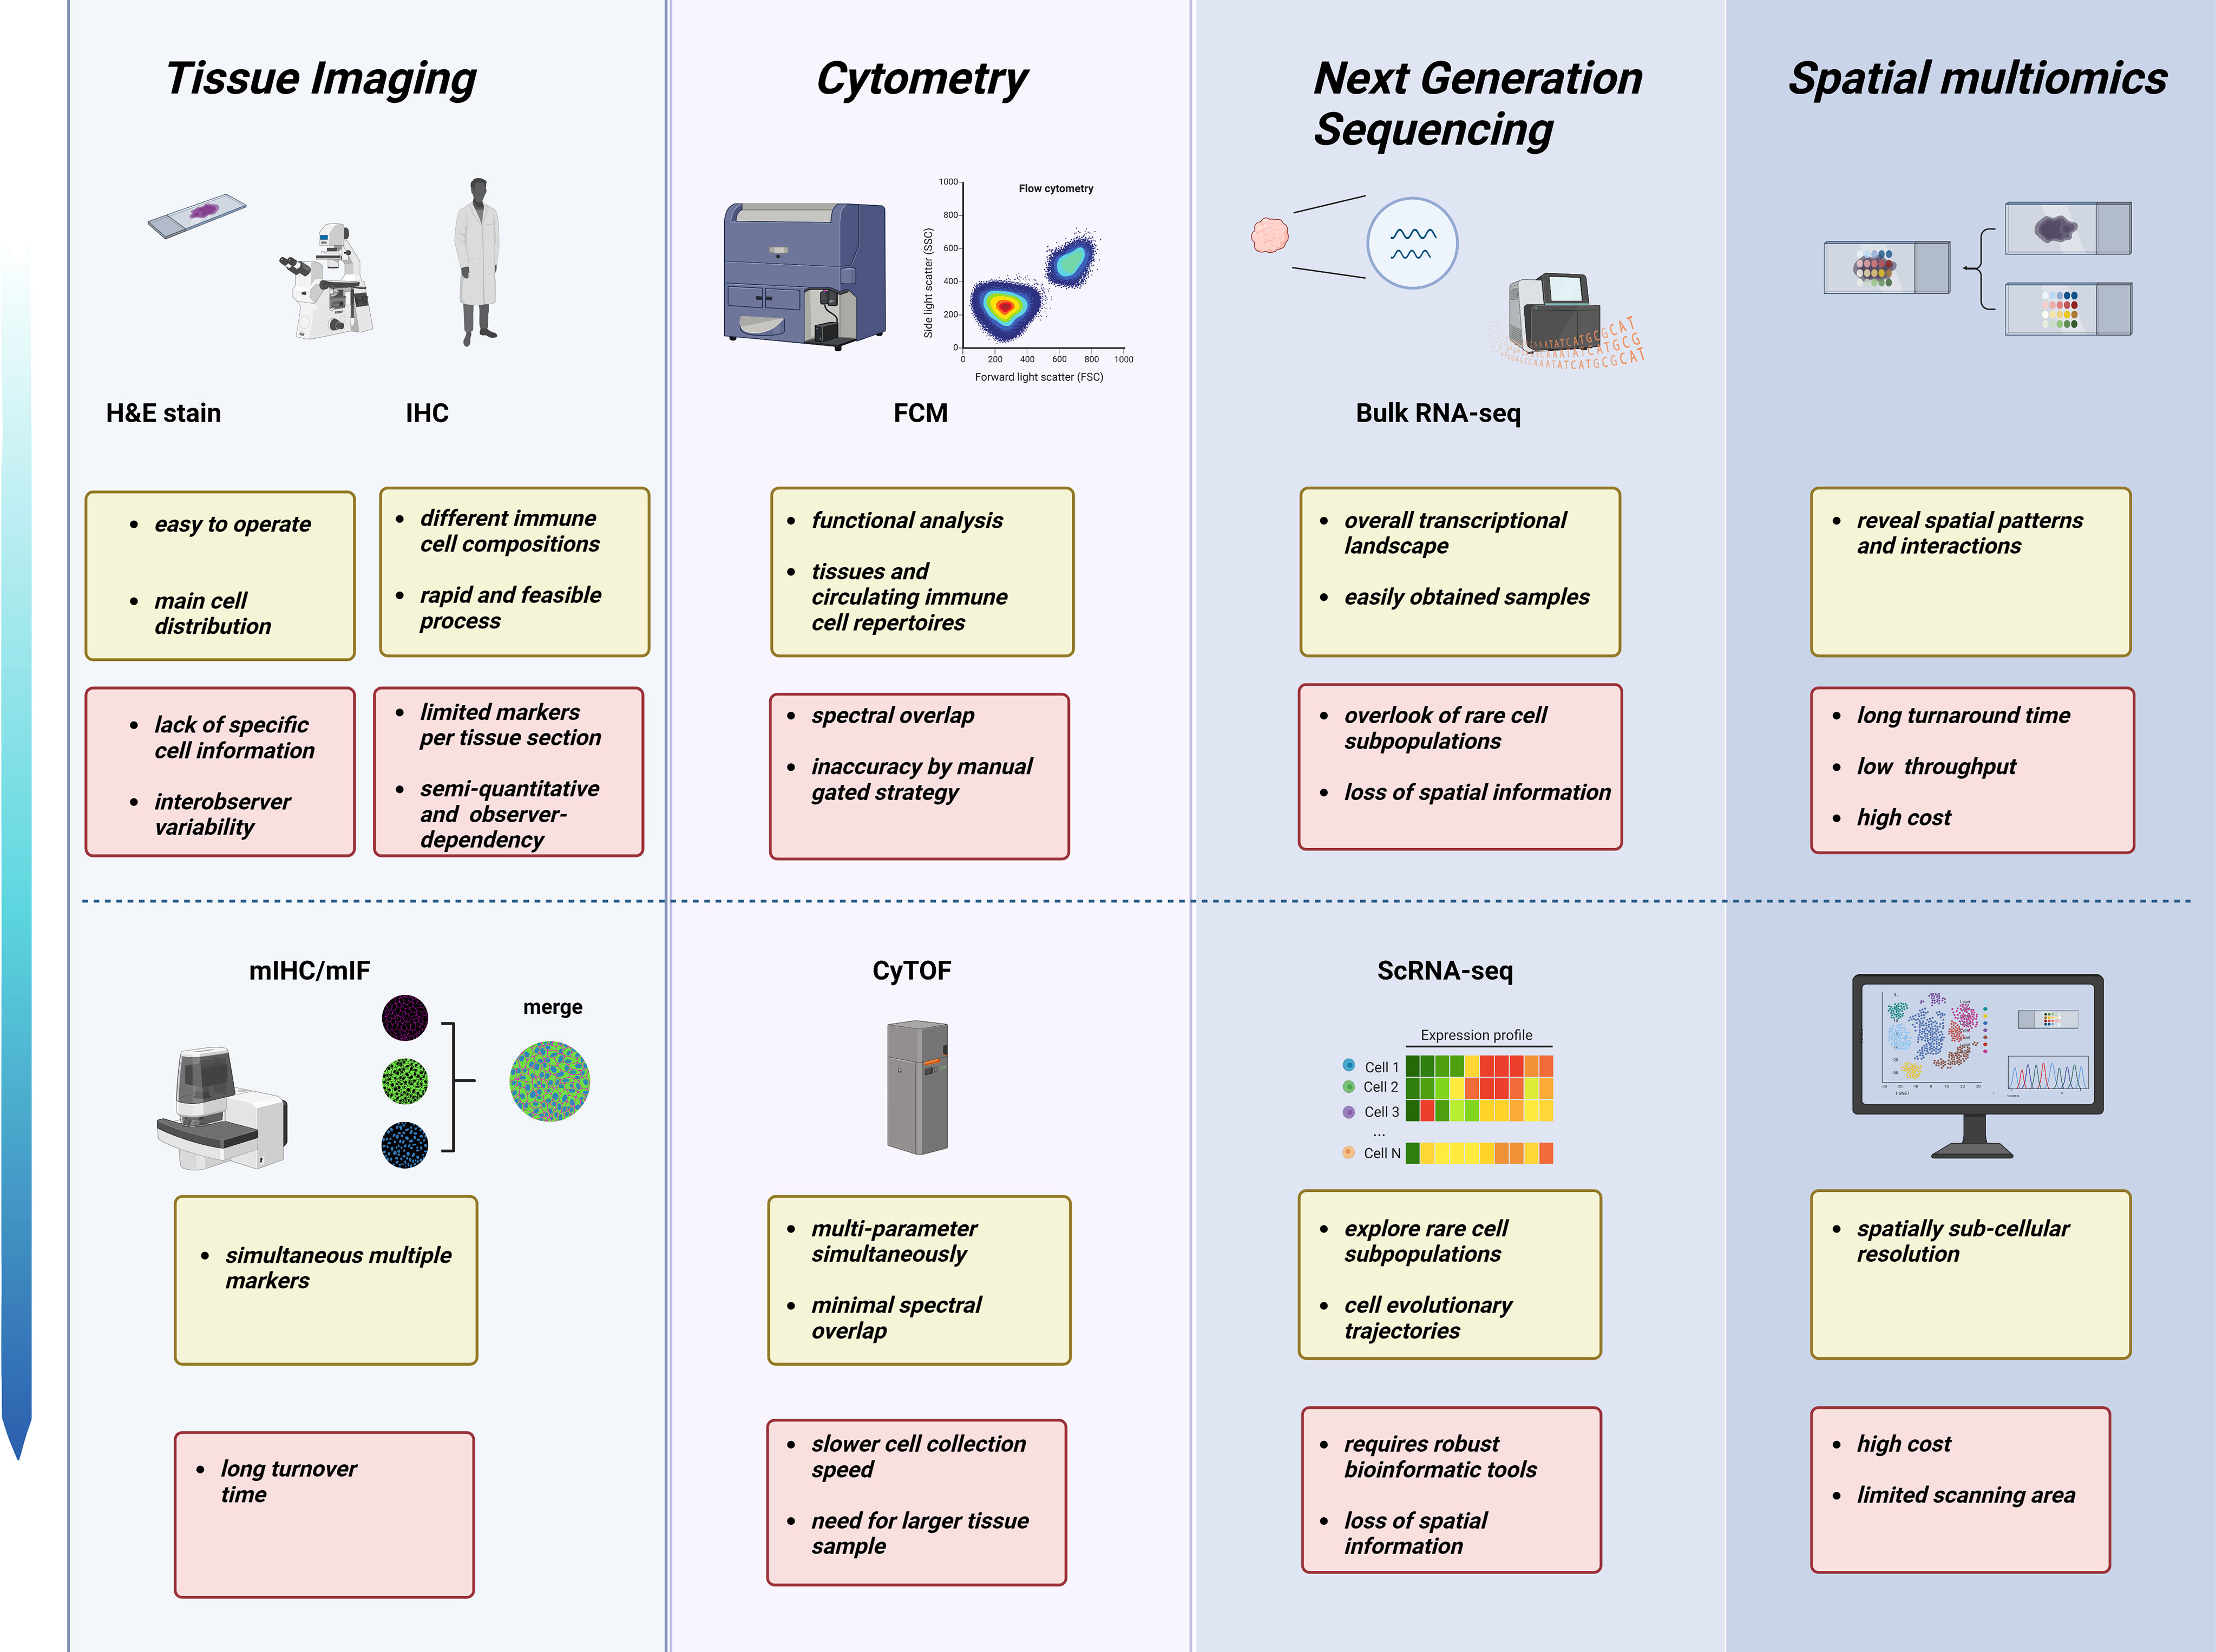
Figure 2 Characteristics and limitations of various technologies across different omics layers in NAC studies. From tissue pathomorphology to high-throughput sequencing, different technologies have advantages (yellow) and challenges (red). Created with BioRender.com.
Author contributions
GW wrote the original draft of the manuscript. YY supplemented the related literature and provided significant guidance. HH and JZ critically reviewed this manuscript. CN was responsible for the conception of this review and provided funding acquisition. All authors contributed to the article and approved the submitted version.
Funding
This work was supported by the Natural Science Foundation of Zhejiang Province (Grant Nos. LR19H160001 and LY21H100004);Natural Science Foundation of China (Grant Nos. 82073151, 82273275 and 82173089); and Leading Innovative and Entrepreneur Team Introduction Program of Zhejiang (Grant No. 2019R01007).
Acknowledgments
The author thanks Jingxin Jiang for providing the availability of the BioRender.com painting platform.
Conflict of interest
The authors declare that the research was conducted in the absence of any commercial or financial relationships that could be construed as a potential conflict of interest.
Publisher’s note
All claims expressed in this article are solely those of the authors and do not necessarily represent those of their affiliated organizations, or those of the publisher, the editors and the reviewers. Any product that may be evaluated in this article, or claim that may be made by its manufacturer, is not guaranteed or endorsed by the publisher.
Abbreviations
TNBC, triple-negative breast cancer; NAC, neoadjuvant chemotherapy TME, tumor microenvironment; ER, estrogen receptors PR, progesterone receptors; HER2, human epidermal growth factor receptor 2; pCR, pathological response; TILs, tumor-infiltrating lymphocytes; H&E, hematoxylin and eosin; ICC, intraclass correlation coefficient; IHC, immunohistochemistry; mIHC/IF, multiplex immunohistochemistry/immunofluorescence; FFEP, formalin-fixed paraffin-embedded; QIF, quantitative immunofluorescence; ROIs, regions of interest; FCM, flow cytometry; MDSCs, myeloid-derived suppressor cells; eMDSC, early MDSC; G-MDSCs, granulocytic MDSCs; CyTOF, cytometry by time-of-flight; ICPMS, inductively coupled plasma−mass spectrometry; EMT, epithelial-mesenchymal transition; IBC, inflammatory breast cancer; FEC, 5-fluorouracil+epirubicin+cyclophosphamide; T, Taxol (docetaxel) H, Herceptin (Trastuzumab); RD, residual disease; TRM T cells, tissue resident memory T cells; LncRNA, long noncoding RNAs; TCR, T cell receptor; scRNAseq, single-cell RNA sequencing; ATAC, assay for transposase accessible chromatin; DSP, digital spatial profiler; MS, mass spectrometry; IMS, imaging mass spectrometry MIBI, multiplex ion-beam imaging; ROS, reactive oxygen species; QCCs, quiescent cancer cells; ISH, in situ hybridization; ISS, in situ sequencing; TMAO, trimethylamine N-oxide.
References
1. Foulkes WD, Smith IE, Reis-Filho JS. Triple-negative breast cancer. N Engl J Med (2010) 363(20):1938–48. doi: 10.1056/NEJMra1001389
2. Marczyk M, Mrukwa A, Yau C, Wolf D, Chen YY, Balassanian R, et al. Treatment efficacy score-continuous residual cancer burden-based metric to compare neoadjuvant chemotherapy efficacy between randomized trial arms in breast cancer trials. Ann Oncol (2022) 33(8):814–23. doi: 10.1016/j.annonc.2022.04.072
3. Liedtke C, Mazouni C, Hess KR, André F, Tordai A, Mejia JA, et al. Response to neoadjuvant therapy and long-term survival in patients with triple-negative breast cancer. J Clin Oncol (2008) 26(8):1275–81. doi: 10.1200/JCO.2007.14.4147
4. Mittendorf EA, Zhang H, Barrios CH, Saji S, Jung KH, Hegg R, et al. Neoadjuvant atezolizumab in combination with sequential nab-paclitaxel and anthracycline-based chemotherapy versus placebo and chemotherapy in patients with early-stage triple-negative breast cancer (IMpassion031): a randomised, double-blind, phase 3 trial. Lancet (2020) 396(10257):1090–100. doi: 10.1016/S0140-6736(20)31953-X
5. Schmid P, Cortes J, Dent R, Pusztai L, McArthur H, Kümmel S, et al. Event-free survival with pembrolizumab in early triple-negative breast cancer. N Engl J Med (2022) 386(6):556–67. doi: 10.1056/NEJMoa2112651
6. Gianni L, Huang CS, Egle D, Bermejo B, Zamagni C, Thill M, et al. Pathologic complete response (pCR) to neoadjuvant treatment with or without atezolizumab in triple-negative, early high-risk and locally advanced breast cancer: NeoTRIP Michelangelo randomized study. Ann Oncol (2022) 33(5):534–43. doi: 10.1016/j.annonc.2022.02.004
7. Loibl S, Schneeweiss A, Huober J, Braun M, Rey J, Blohmer JU, et al. Neoadjuvant durvalumab improves survival in early triple-negative breast cancer independent of pathological complete response. Ann Oncol (2022) 33(11):1149–58. doi: 10.1016/j.annonc.2022.07.1940
8. Dieci MV, Tsvetkova V, Griguolo G, Miglietta F, Tasca G, Giorgi CA, et al. Integration of tumour infiltrating lymphocytes, programmed cell-death ligand-1, CD8 and FOXP3 in prognostic models for triple-negative breast cancer: analysis of 244 stage I-III patients treated with standard therapy. Eur J Cancer (2020) 136:7–15. doi: 10.1016/j.ejca.2020.05.014
9. Gyanchandani R, Lin Y, Lin HM, Cooper K, Normolle DP, Brufsky A, et al. Intratumor heterogeneity affects gene expression profile test prognostic risk stratification in early breast cancer. Clin Cancer Res (2016) 22(21):5362–9. doi: 10.1158/1078-0432.CCR-15-2889
10. Wesolowski R, Duggan MC, Stiff A, Markowitz J, Trikha P, Levine KM, et al. Circulating myeloid-derived suppressor cells increase in patients undergoing neo-adjuvant chemotherapy for breast cancer. Cancer Immunol Immunother (2017) 66(11):1437–47. doi: 10.1007/s00262-017-2038-3
11. Denkert C, von Minckwitz G, Darb-Esfahani S, Lederer B, Heppner BI, Weber KE, et al. Tumour-infiltrating lymphocytes and prognosis in different subtypes of breast cancer: a pooled analysis of 3771 patients treated with neoadjuvant therapy. Lancet Oncol (2018) 19(1):40–50. doi: 10.1016/S1470-2045(17)30904-X
12. Giacchetti S, Faucheux L, Gardair C, Cuvier C, de Roquancourt A, Campedel L, et al. Negative relationship between post-treatment stromal tumor-infiltrating lymphocyte (TIL) and survival in triple-negative breast cancer patients treated with dose-dense dose-intense NeoAdjuvant chemotherapy. Cancers (Basel) (2022) 14(5):1331. doi: 10.3390/cancers14051331
13. Urueña C, Lasso P, Bernal-Estevez D, Rubio D, Salazar AJ, Olaya M, et al. The breast cancer immune microenvironment is modified by neoadjuvant chemotherapy. Sci Rep (2022) 12(1):7981. doi: 10.1038/s41598-022-12108-5
14. Aaltomaa S, Lipponen P, Eskelinen M, Kosma VM, Marin S, Alhava E, et al. Lymphocyte infiltrates as a prognostic variable in female breast cancer. Eur J Cancer (1992) 28a(4-5):859–64. doi: 10.1016/0959-8049(92)90134-N
15. Denkert C, Loibl S, Noske A, Roller M, Müller BM, Komor M, et al. Tumor-associated lymphocytes as an independent predictor of response to neoadjuvant chemotherapy in breast cancer. J Clin Oncol (2010) 28(1):105–13. doi: 10.1200/JCO.2009.23.7370
16. Salgado R, Denkert C, Demaria S, Sirtaine N, Klauschen F, Pruneri G, et al. The evaluation of tumor-infiltrating lymphocytes (TILs) in breast cancer: recommendations by an international TILs working group 2014. Ann Oncol (2015) 26(2):259–71. doi: 10.1093/annonc/mdu450
17. Van Bockstal MR, François A, Altinay S, Arnould L, Balkenhol M, Broeckx G, et al. Interobserver variability in the assessment of stromal tumor-infiltrating lymphocytes (sTILs) in triple-negative invasive breast carcinoma influences the association with pathological complete response: the IVITA study. Mod Pathol (2021) 34(12):2130–40. doi: 10.1038/s41379-021-00865-z
18. eBuisseret L, Desmedt C, Garaud S, Fornili M, Wang X, Van den Eyden G, et al. Reliability of tumor-infiltrating lymphocyte and tertiary lymphoid structure assessment in human breast cancer. Mod Pathol (2017) 30(9):1204–12. doi: 10.1038/modpathol.2017.43
19. Thagaard J, Stovgaard ES, Vognsen LG, Hauberg S, Dahl A, Ebstrup T, et al. Automated quantification of sTIL density with H&E-based digital image analysis has prognostic potential in triple-negative breast cancers. Cancers (Basel) (2021) 13(12):3050. doi: 10.3390/cancers13123050
20. Zhang X, Zhu X, Tang K, Zhao Y, Lu Z, Feng Q, et al. DDTNet: a dense dual-task network for tumor-infiltrating lymphocyte detection and segmentation in histopathological images of breast cancer. Med Image Anal (2022) 78:102415. doi: 10.1016/j.media.2022.102415
21. Bai Y, Cole K, Martinez-Morilla S, Ahmed FS, Zugazagoitia J, Staaf J, et al. An open-source, automated tumor-infiltrating lymphocyte algorithm for prognosis in triple-negative breast cancer. Clin Cancer Res (2021) 27(20):5557–65. doi: 10.1158/1078-0432.CCR-21-0325
22. Denkert C, Wienert S, Poterie A, Loibl S, Budczies J, Badve S, et al. Standardized evaluation of tumor-infiltrating lymphocytes in breast cancer: results of the ring studies of the international immuno-oncology biomarker working group. Mod Pathol (2016) 29(10):1155–64. doi: 10.1038/modpathol.2016.109
23. Park YH, Lal S, Lee JE, Choi YL, Wen J, Ram S, et al. Chemotherapy induces dynamic immune responses in breast cancers that impact treatment outcome. Nat Commun (2020) 11(1):6175. doi: 10.1038/s41467-020-19933-0
24. Waks AG, Stover DG, Guerriero JL, Dillon D, Barry WT, Gjini E, et al. The immune microenvironment in hormone receptor-positive breast cancer before and after preoperative chemotherapy. Clin Cancer Res (2019) 25(15):4644–55. doi: 10.1158/1078-0432.CCR-19-0173
25. Sofopoulos M, Fortis SP, Vaxevanis CK, Sotiriadou NN, Arnogiannaki N, Ardavanis A, et al. The prognostic significance of peritumoral tertiary lymphoid structures in breast cancer. Cancer Immunol Immunother (2019) 68(11):1733–45. doi: 10.1007/s00262-019-02407-8
26. Miyashita M, Sasano H, Tamaki K, Hirakawa H, Takahashi Y, Nakagawa S, et al. Prognostic significance of tumor-infiltrating CD8+ and FOXP3+ lymphocytes in residual tumors and alterations in these parameters after neoadjuvant chemotherapy in triple-negative breast cancer: a retrospective multicenter study. Breast Cancer Res (2015) 17(1):124. doi: 10.1200/jco.2015.33.15_suppl.510
27. Wu Z, Zhang L, Peng J, Xu S, Zhou L, Lin Y, et al. Predictive and prognostic value of PDL1 protein expression in breast cancer patients in neoadjuvant setting. Cancer Biol Ther (2019) 20(6):941–7. doi: 10.1080/15384047.2019.1583533
28. Gomez-Macias GS, Molinar-Flores G, Lopez-Garcia CA, Santuario-Facio S, Decanini-Arcaute H, Valero-Elizondo J, et al. Immunotyping of tumor-infiltrating lymphocytes in triple-negative breast cancer and genetic characterization. Oncol Lett (2020) 20(5):140. doi: 10.3892/ol.2020.12000
29. Hansen AR, Siu LL. PD-L1 testing in cancer: challenges in companion diagnostic development. JAMA Oncol (2016) 2(1):15–6. doi: 10.1001/jamaoncol.2015.4685
30. Hoda RS, Brogi E, D'Alfonso TM, Grabenstetter A, Giri D, Hanna MG, et al. Interobserver variation of PD-L1 SP142 immunohistochemistry interpretation in breast carcinoma: a study of 79 cases using whole slide imaging. Arch Pathol Lab Med (2021) 145(9):1132–7. doi: 10.5858/arpa.2020-0451-OA
31. Rimm DL, Han G, Taube JM, Yi ES, Bridge JA, Flieder DB, et al. A prospective, multi-institutional, pathologist-based assessment of 4 immunohistochemistry assays for PD-L1 expression in non-small cell lung cancer. JAMA Oncol (2017) 3(8):1051–8. doi: 10.1001/jamaoncol.2017.0013
32. O'Hurley G, Sjöstedt E, Rahman A, Li B, Kampf C, Pontén F, et al. Garbage in, garbage out: a critical evaluation of strategies used for validation of immunohistochemical biomarkers. Mol Oncol (2014) 8(4):783–98. doi: 10.1016/j.molonc.2014.03.008
33. Zerdes I, Karafousia V, Mezheyeuski A, Stogiannitsi M, Kuiper R, Moreno Ruiz P, et al. Discordance of PD-L1 expression at the protein and RNA levels in early breast cancer. Cancers (Basel) (2021) 13(18):4655. doi: 10.3390/cancers13184655
34. Tan WCC, Nerurkar SN, Cai HY, Ng HHM, Wu D, Wee YTF, et al. Overview of multiplex immunohistochemistry/immunofluorescence techniques in the era of cancer immunotherapy. Cancer Commun (Lond) (2020) 40(4):135–53. doi: 10.1002/cac2.12023
35. Hoyt CC. Multiplex immunofluorescence and multispectral imaging: forming the basis of a clinical test platform for immuno-oncology. Front Mol Biosci (2021) 8:674747. doi: 10.3389/fmolb.2021.674747
36. Brown JR, Wimberly H, Lannin DR, Nixon C, Rimm DL, Bossuyt V, et al. Multiplexed quantitative analysis of CD3, CD8, and CD20 predicts response to neoadjuvant chemotherapy in breast cancer. Clin Cancer Res (2014) 20(23):5995–6005. doi: 10.1158/1078-0432.CCR-14-1622
37. Mani NL, Schalper KA, Hatzis C, Saglam O, Tavassoli F, Butler M, et al. Quantitative assessment of the spatial heterogeneity of tumor-infiltrating lymphocytes in breast cancer. Breast Cancer Res (2016) 18(1):78. doi: 10.1186/s13058-016-0737-x
38. Graeser M, Feuerhake F, Gluz O, Volk V, Hauptmann M, Jozwiak K, et al. Immune cell composition and functional marker dynamics from multiplexed immunohistochemistry to predict response to neoadjuvant chemotherapy in the WSG-ADAPT-TN trial. J Immunother Cancer (2021) 9(5):e002198. doi: 10.1136/jitc-2020-002198
39. Griguolo G, Serna G, Pascual T, Fasani R, Guardia X, Chic N, et al. Immune microenvironment characterisation and dynamics during anti-HER2-based neoadjuvant treatment in HER2-positive breast cancer. NPJ Precis Oncol (2021) 5(1):23. doi: 10.1038/s41698-021-00163-6
40. Welsh AW, Moeder CB, Kumar S, Gershkovich P, Alarid ET, Harigopal M, et al. Standardization of estrogen receptor measurement in breast cancer suggests false-negative results are a function of threshold intensity rather than percentage of positive cells. J Clin Oncol (2011) 29(22):2978–84. doi: 10.1200/JCO.2010.32.9706
41. Yi M, Jiao D, Xu H, Liu Q, Zhao W, Han X, et al. Biomarkers for predicting efficacy of PD-1/PD-L1 inhibitors. Mol Cancer (2018) 17(1):129. doi: 10.1186/s12943-018-0864-3
42. Ribas A, Hu-Lieskovan S. What does PD-L1 positive or negative mean? J Exp Med (2016) 213(13):2835–40. doi: 10.1084/jem.20161462
43. Lu S, Stein JE, Rimm DL, Wang DW, Bell JM, Johnson DB, et al. Comparison of biomarker modalities for predicting response to PD-1/PD-L1 checkpoint blockade: a systematic review and meta-analysis. JAMA Oncol (2019) 5(8):1195–204. doi: 10.1001/jamaoncol.2019.1549
44. Sanchez K, Kim I, Chun B, Pucilowska J, Redmond WL, Urba WJ, et al. Multiplex immunofluorescence to measure dynamic changes in tumor-infiltrating lymphocytes and PD-L1 in early-stage breast cancer. Breast Cancer Res (2021) 23(1):2. doi: 10.1186/s13058-020-01378-4
45. Feng Z, Bethmann D, Kappler M, Ballesteros-Merino C, Eckert A, Bell RB, et al. Multiparametric immune profiling in HPV- oral squamous cell cancer. JCI Insight (2017) 2(14):e93652. doi: 10.1172/jci.insight.93652
46. Taube JM, Roman K, Engle EL, Wang C, Ballesteros-Merino C, Jensen SM, et al. Multi-institutional TSA-amplified multiplexed immunofluorescence reproducibility evaluation (MITRE) study. J Immunother Cancer (2021) 9(7):e002197. doi: 10.1136/jitc-2020-002197
47. Manesse M, Patel KK, Bobrow M, Downing SR. The InSituPlex(®) staining method for multiplexed immunofluorescence cell phenotyping and spatial profiling of tumor FFPE samples. Methods Mol Biol (2020) 2055:585–92. doi: 10.1007/978-1-4939-9773-2_26
48. Ahmed FS, Gaule P, McGuire J, Patel K, Blenman K, Pusztai L, et al. PD-L1 protein expression on both tumor cells and macrophages are associated with response to neoadjuvant durvalumab with chemotherapy in triple-negative breast cancer. Clin Cancer Res (2020) 26(20):5456–61. doi: 10.1158/1078-0432.CCR-20-1303
49. Wang N, Li X, Wang R, Ding Z. Spatial transcriptomics and proteomics technologies for deconvoluting the tumor microenvironment. Biotechnol J (2021) 16(9):e2100041. doi: 10.1002/biot.202100041
50. Goltsev Y, Samusik N, Kennedy-Darling J, Bhate S, Hale M, Vazquez G, et al. Deep profiling of mouse splenic architecture with CODEX multiplexed imaging. Cell (2018) 174(4):968–981.e15. doi: 10.1016/j.cell.2018.07.010
51. Baldominos P, Barbera-Mourelle A, Barreiro O, Huang Y, Wight A, Cho JW, et al. Quiescent cancer cells resist T cell attack by forming an immunosuppressive niche. Cell (2022) 185(10):1694–1708.e19. doi: 10.1016/j.cell.2022.03.033
52. Baharlou H, Canete NP, Cunningham AL, Harman AN, Patrick E. Mass cytometry imaging for the study of human diseases-applications and data analysis strategies. Front Immunol (2019) 10:2657. doi: 10.3389/fimmu.2019.02657
53. Giesen C, Wang HA, Schapiro D, Zivanovic N, Jacobs A, Hattendorf B, et al. Highly multiplexed imaging of tumor tissues with subcellular resolution by mass cytometry. Nat Methods (2014) 11(4):417–22. doi: 10.1038/nmeth.2869
54. Schulz D, Zanotelli VRT, Fischer JR, Schapiro D, Engler S, Lun XK, et al. Simultaneous multiplexed imaging of mRNA and proteins with subcellular resolution in breast cancer tissue samples by mass cytometry. Cell Syst (2018) 6(1):25–36.e5. doi: 10.1016/j.cels.2017.12.001
55. Angelo M, Bendall SC, Finck R, Hale MB, Hitzman C, Borowsky AD, et al. Multiplexed ion beam imaging of human breast tumors. Nat Med (2014) 20(4):436–42. doi: 10.1038/nm.3488
56. Keren L, Bosse M, Marquez D, Angoshtari R, Jain S, Varma S, et al. A structured tumor-immune microenvironment in triple negative breast cancer revealed by multiplexed ion beam imaging. Cell (2018) 174(6):1373–1387.e19. doi: 10.1016/j.cell.2018.08.039
57. Freer G, Rindi L. Intracellular cytokine detection by fluorescence-activated flow cytometry: basic principles and recent advances. Methods (2013) 61(1):30–8. doi: 10.1016/j.ymeth.2013.03.035
58. Delmonte OM, Fleisher TA. Flow cytometry: surface markers and beyond. J Allergy Clin Immunol (2019) 143(2):528–37. doi: 10.1016/j.jaci.2018.08.011
59. Wang M, Pang Z, Wang Y, Cui M, Yao L, Li S, et al. An immune model to predict prognosis of breast cancer patients receiving neoadjuvant chemotherapy based on support vector machine. Front Oncol (2021) 11:651809. doi: 10.3389/fonc.2021.651809
60. Spitzer MH, Carmi Y, Reticker-Flynn NE, Kwek SS, Madhireddy D, Martins MM, et al. Systemic immunity is required for effective cancer immunotherapy. Cell (2017) 168(3):487–502.e15. doi: 10.1016/j.cell.2016.12.022
61. Salvador-Coloma C, Santaballa A, Sanmartín E, Calvo D, García A, Hervás D, et al. Immunosuppressive profiles in liquid biopsy at diagnosis predict response to neoadjuvant chemotherapy in triple-negative breast cancer. Eur J Cancer (2020) 139:119–34. doi: 10.1016/j.ejca.2020.08.020
62. Ruiz-Rodríguez VM, Turiján-Espinoza E, Guel-Pañola JA, García-Hernández MH, Zermeño-Nava JJ, López-López N, et al. Chemoresistance in breast cancer patients associated with changes in P2X7 and A2A purinergic receptors in CD8(+) T lymphocytes. Front Pharmacol (2020) 11:576955. doi: 10.3389/fphar.2020.576955
63. Verma C, Kaewkangsadan V, Eremin JM, Cowley GP, Ilyas M, El-Sheemy MA, et al. Natural killer (NK) cell profiles in blood and tumour in women with large and locally advanced breast cancer (LLABC) and their contribution to a pathological complete response (PCR) in the tumour following neoadjuvant chemotherapy (NAC): differential restoration of blood profiles by NAC and surgery. J Transl Med (2015) 13:180. doi: 10.1186/s12967-015-0535-8
64. Massa C, Karn T, Denkert C, Schneeweiss A, Hanusch C, Blohmer JU, et al. Differential effect on different immune subsets of neoadjuvant chemotherapy in patients with TNBC. J Immunother Cancer (2020) 8(2):e001261. doi: 10.1136/jitc-2020-001261
65. Perfetto SP, Chattopadhyay PK, Roederer M. Seventeen-colour flow cytometry: unravelling the immune system. Nat Rev Immunol (2004) 4(8):648–55. doi: 10.1038/nri1416
66. Lim SY, Rizos H. Immune cell profiling in the age of immune checkpoint inhibitors: implications for biomarker discovery and understanding of resistance mechanisms. Mamm Genome (2018) 29(11-12):866–78. doi: 10.1007/s00335-018-9757-4
67. Young YK, Bolt AM, Ahn R, Mann KK. Analyzing the tumor microenvironment by flow cytometry. Methods Mol Biol (2016) 1458:95–110. doi: 10.1007/978-1-4939-3801-8_8
68. Park LM, Lannigan J, Jaimes MC. OMIP-069: forty-color full spectrum flow cytometry panel for deep immunophenotyping of major cell subsets in human peripheral blood. Cytom A (2020) 97(10):1044–51. doi: 10.1002/cyto.a.24213
69. Grant R, Coopman K, Medcalf NSilva S, Campbell J, Kara B, et al. Understanding the contribution of operator measurement variability within flow cytometry data analysis for quality control of cell and gene therapy manufacturing. Methods Mol Biol (2019) 150:106998. doi: 10.1016/j.measurement.2019.106998
70. Saeys Y, Van Gassen S, Lambrecht BN. Computational flow cytometry: helping to make sense of high-dimensional immunology data. Nat Rev Immunol (2016) 16(7):449–62. doi: 10.1038/nri.2016.56
71. Chen X, Hasan M, Libri V, Urrutia A, Beitz B, Rouilly V, et al. Automated flow cytometric analysis across large numbers of samples and cell types. Clin Immunol (2015) 157(2):249–60. doi: 10.1016/j.clim.2014.12.009
72. Levine JH, Simonds EF, Bendall SC, Davis KL, Amir el-AD, Tadmor MD, et al. Data-driven phenotypic dissection of AML reveals progenitor-like cells that correlate with prognosis. Cell (2015) 162(1):184–97. doi: 10.1016/j.cell.2015.05.047
73. Qiu P, Simonds EF, Bendall SC, Gibbs Jr Bruggner KD RV, Linderman MD, et al. Extracting a cellular hierarchy from high-dimensional cytometry data with SPADE. Nat Biotechnol (2011) 29(10):886–91. doi: 10.1038/nbt.1991
74. Van Gassen S, Callebaut B, Van Helden MJ, Lambrecht BN, Demeester P, Dhaene T, et al. FlowSOM: using self-organizing maps for visualization and interpretation of cytometry data. Cytom A (2015) 87(7):636–45. doi: 10.1002/cyto.a.22625
75. Naim I, Datta S, Rebhahn J, Cavenaugh JS, Mosmann TR, Sharma G. SWIFT-scalable clustering for automated identification of rare cell populations in large, high-dimensional flow cytometry datasets, part 1: algorithm design. Cytom A (2014) 85(5):408–21. doi: 10.1002/cyto.a.22446
77. McInnes L, Healy J, Melville J. Umap: uniform manifold approximation and projection for dimension reduction. J Open Source Softw (2018) 3(29):861. doi: 10.21105/joss.00861
78. Cheung M, Campbell JJ, Thomas RJ, Braybrook J, Petzing J. Assessment of automated flow cytometry data analysis tools within cell and gene therapy manufacturing. Int J Mol Sci (2022) 23(6):3224. doi: 10.3390/ijms23063224
79. Cheung M, Campbell JJ, Whitby L, Thomas RJ, Braybrook J, Petzing J. Current trends in flow cytometry automated data analysis software. Cytom A (2021) 99(10):1007–21. doi: 10.1002/cyto.a.24320
80. Spitzer MH, Nolan GP. Mass cytometry: single cells, many features. Cell (2016) 165(4):780–91. doi: 10.1016/j.cell.2016.04.019
81. Bandura DR, Baranov VI, Ornatsky OI, Antonov A, Kinach R, Lou X, et al. Mass cytometry: technique for real time single cell multitarget immunoassay based on inductively coupled plasma time-of-flight mass spectrometry. Anal Chem (2009) 81(16):6813–22. doi: 10.1021/ac901049w
82. Bendall SC, Simonds EF, Qiu P, Amir el-AD, Krutzik PO, Finck R, et al. Single-cell mass cytometry of differential immune and drug responses across a human hematopoietic continuum. Science (2011) 332(6030):687–96. doi: 10.1126/science.1198704
83. Fattori S, Gorvel L, Granjeaud S, Rochigneux P, Rouvière MS, Ben Amara A, et al. Quantification of immune variables from liquid biopsy in breast cancer patients links Vδ2(+) γδ T cell alterations with lymph node invasion. Cancers (Basel) (2021) 13(3):441. doi: 10.3390/cancers13030441
84. Chung AW, Anand K, Anselme AC, Chan AA, Gupta N, Venta LA, et al. A phase 1/2 clinical trial of the nitric oxide synthase inhibitor l-NMMA and taxane for treating chemoresistant triple-negative breast cancer. Sci Transl Med (2021) 13(624):eabj5070. doi: 10.1126/scitranslmed.abj5070
85. Bodenmiller B, Zunder ER, Finck R, Chen TJ, Savig ES, Bruggner RV, et al. Multiplexed mass cytometry profiling of cellular states perturbed by small-molecule regulators. Nat Biotechnol (2012) 30(9):858–67. doi: 10.1038/nbt.2317
86. Marusyk A, Almendro V, Polyak K. Intra-tumour heterogeneity: a looking glass for cancer? Nat Rev Cancer (2012) 12(5):323–34. doi: 10.1038/nrc3261
87. Kim C, Gao R, Sei E, Brandt R, Hartman J, Hatschek T, et al. Chemoresistance evolution in triple-negative breast cancer delineated by single-cell sequencing. Cell (2018) 173(4):879–893.e13. doi: 10.1016/j.cell.2018.03.041
88. Li X, Warren S, Pelekanou V, Wali V, Cesano A, Liu M, et al. Immune profiling of pre- and post-treatment breast cancer tissues from the SWOG S0800 neoadjuvant trial. J Immunother Cancer (2019) 7(1):88. doi: 10.1186/s40425-019-0563-7
89. Axelrod ML, Nixon MJ, Gonzalez-Ericsson PI, Bergman RE, Pilkinton MA, McDonnell WJ, et al. Changes in peripheral and local tumor immunity after neoadjuvant chemotherapy reshape clinical outcomes in patients with breast cancer. Clin Cancer Res (2020) 26(21):5668–81. doi: 10.1158/1078-0432.CCR-19-3685
90. Deng J, Thennavan A, Shah S, Bagdatlioglu E, Klar N, Heguy A, et al. Serial single-cell profiling analysis of metastatic TNBC during nab-paclitaxel and pembrolizumab treatment. Breast Cancer Res Treat (2021) 185(1):85–94. doi: 10.1007/s10549-020-05936-4
91. Radosevic-Robin N, Selenica P, Zhu Y, Won HH, Berger MF, Ferrando L, et al. Recurrence biomarkers of triple negative breast cancer treated with neoadjuvant chemotherapy and anti-EGFR antibodies. NPJ Breast Cancer (2021) 7(1):124. doi: 10.1038/s41523-021-00334-5
92. Zhang Y, Chen H, Mo H, Hu X, Gao R, Zhao Y, et al. Single-cell analyses reveal key immune cell subsets associated with response to PD-L1 blockade in triple-negative breast cancer. Cancer Cell (2021) 39(12):1578–1593.e8. doi: 10.1016/j.ccell.2021.09.010
93. Vishnubalaji R, Alajez NM. Transcriptional landscape associated with TNBC resistance to neoadjuvant chemotherapy revealed by single-cell RNA-seq. Mol Ther Oncol (2021) 23:151–62. doi: 10.1016/j.omto.2021.09.002
94. Shaath H, Vishnubalaji R, Elango R, Khattak S, Alajez NM. Single-cell long noncoding RNA (lncRNA) transcriptome implicates MALAT1 in triple-negative breast cancer (TNBC) resistance to neoadjuvant chemotherapy. Cell Death Discovery (2021) 7(1):23. doi: 10.1038/s41420-020-00383-y
95. Cai G, Guan Z, Jin Y, Su Z, Chen X, Liu Q, et al. Circulating T-cell repertoires correlate with the tumor response in patients with breast cancer receiving neoadjuvant chemotherapy. JCO Precis Oncol (2022) 6:e2100120. doi: 10.1200/PO.21.00120
96. Oshi M, Gandhi S, Huyser MR, Tokumaru Y, Yan L, Yamada A, et al. MELK expression in breast cancer is associated with infiltration of immune cell and pathological compete response (pCR) after neoadjuvant chemotherapy. Am J Cancer Res (2021) 11(9):4421–37.
97. Pérez-Pena J, Tibor Fekete J, Páez R, Baliu-Piqué M, García-Saenz JÁ, García-Barberán V, et al. A transcriptomic immunologic signature predicts favorable outcome in neoadjuvant chemotherapy treated triple negative breast tumors. Front Immunol (2019) 10:2802. doi: 10.3389/fimmu.2019.02802
98. Newman AM, Liu CL, Green MR, Gentles AJ, Feng W, Xu Y, et al. Robust enumeration of cell subsets from tissue expression profiles. Nat Methods (2015) 12(5):453–7. doi: 10.1038/nmeth.3337
99. Chen B, Khodadoust MS, Liu CL, Newman AM, Alizadeh AA. Profiling tumor infiltrating immune cells with CIBERSORT. Methods Mol Biol (2018) 1711:243–59. doi: 10.1007/978-1-4939-7493-1_12
100. Finotello F, Trajanoski Z. Quantifying tumor-infiltrating immune cells from transcriptomics data. Cancer Immunol Immunother (2018) 67(7):1031–40. doi: 10.1007/s00262-018-2150-z
101. Sturm G, Finotello F, Petitprez F, Zhang JD, Baumbach J, Fridman WH, et al. Comprehensive evaluation of transcriptome-based cell-type quantification methods for immuno-oncology. Bioinformatics (2019) 35(14):i436–45. doi: 10.1093/bioinformatics/btz363
102. Jin H, Liu Z. A benchmark for RNA-seq deconvolution analysis under dynamic testing environments. Genome Biol (2021) 22(1):102. doi: 10.1186/s13059-021-02290-6
103. Oshi M, Asaoka M, Tokumaru Y, Angarita FA, Yan L, Matsuyama R, et al. Abundance of regulatory T cell (Treg) as a predictive biomarker for neoadjuvant chemotherapy in triple-negative breast cancer. Cancers (Basel) (2020) 12(10):3038. doi: 10.3390/cancers12103038
104. Davis MM, Bjorkman PJ. T-Cell antigen receptor genes and T-cell recognition. Nature (1988) 334(6181):395–402. doi: 10.1038/334395a0
105. Pauken KE, Lagattuta KA, Lu BY, Lucca LE, Daud AI, Hafler DA, et al. TCR-sequencing in cancer and autoimmunity: barcodes and beyond. Trends Immunol (2022) 43(3):180–94. doi: 10.1016/j.it.2022.01.002
106. Kim I, Sanchez K, McArthur HL, Page D. Immunotherapy in triple-negative breast cancer: present and future. Curr Breast Cancer Rep (2019) 11(4):259–71. doi: 10.1007/s12609-019-00345-z
107. Pauken KE, Torchia JA, Chaudhri A, Sharpe AH, Freeman GJ. Emerging concepts in PD-1 checkpoint biology. Semin Immunol (2021) 52:101480. doi: 10.1016/j.smim.2021.101480
108. Esteve-Codina A, Arpi O, Martinez-García M, Pineda E, Mallo M, Gut M, et al. A comparison of RNA-seq results from paired formalin-fixed paraffin-embedded and fresh-frozen glioblastoma tissue samples. PloS One (2017) 12(1):e0170632. doi: 10.1371/journal.pone.0170632
109. Hedegaard J, Thorsen K, Lund MK, Hein AM, Hamilton-Dutoit SJ, Vang S, et al. Next-generation sequencing of RNA and DNA isolated from paired fresh-frozen and formalin-fixed paraffin-embedded samples of human cancer and normal tissue. PloS One (2014) 9(5):e98187. doi: 10.1371/journal.pone.0098187
110. Crosetto N, Bienko M, van Oudenaarden A. Spatially resolved transcriptomics and beyond. Nat Rev Genet (2015) 16(1):57–66. doi: 10.1038/nrg3832
111. Tang F, Barbacioru C, Wang Y, Nordman E, Lee C, Xu N, et al. mRNA-seq whole-transcriptome analysis of a single cell. Nat Methods (2009) 6(5):377–82. doi: 10.1038/nmeth.1315
112. Tirosh I, Izar B, Prakadan SM, Wadsworth MH 2nd, Treacy D, Trombetta JJ, et al. Dissecting the multicellular ecosystem of metastatic melanoma by single-cell RNA-seq. Science (2016) 352(6282):189–96. doi: 10.1126/science.aad0501
113. Zheng C, Zheng L, Yoo JK, Guo H, Zhang Y, Guo X, et al. Landscape of infiltrating T cells in liver cancer revealed by single-cell sequencing. Cell (2017) 169(7):1342–1356.e16. doi: 10.1016/j.cell.2017.05.035
114. Zhou H, Li G, Yin J, Wang T, Hu H, Li T, et al. Neoadjuvant chemotherapy alters peripheral and tumour-infiltrating immune cells in breast cancer revealed by single-cell RNA sequencing. Clin Transl Med (2021) 11(12):e621. doi: 10.1002/ctm2.621
115. Hwang B, Lee JH, Bang D. Single-cell RNA sequencing technologies and bioinformatics pipelines. Exp Mol Med (2018) 50(8):1–14. doi: 10.1038/s12276-018-0071-8
116. Stoeckius M, Hafemeister C, Stephenson W, Houck-Loomis B, Chattopadhyay PK, Swerdlow H, et al. Simultaneous epitope and transcriptome measurement in single cells. Nat Methods (2017) 14(9):865–8. doi: 10.1038/nmeth.4380
117. Rao A, Barkley D, França GS, Yanai I. Exploring tissue architecture using spatial transcriptomics. Nature (2021) 596(7871):211–20. doi: 10.1038/s41586-021-03634-9
118. Powell NR, Silvola RM, Howard JS, Badve S, Skaar TC, Ipe J. Quantification of spatial pharmacogene expression heterogeneity in breast tumors. Cancer Rep (Hoboken) (2022) 6(1):e1686. doi: 10.1002/cnr2.1686
119. Kulasinghe A, Monkman J, Shah ET, Matigian N, Adams MN, O'Byrne K. Spatial profiling identifies prognostic features of response to adjuvant therapy in triple negative breast cancer (TNBC). Front Oncol (2021) 11:798296. doi: 10.3389/fonc.2021.798296
120. Stewart RL, Matynia AP, Factor RE, Varley KE. Spatially-resolved quantification of proteins in triple negative breast cancers reveals differences in the immune microenvironment associated with prognosis. Sci Rep (2020) 10(1):6598. doi: 10.1038/s41598-020-63539-x
121. Hsieh WC, Budiarto BR, Wang YF, Lin CY, Gwo MC, So DK, et al. Spatial multi-omics analyses of the tumor immune microenvironment. J BioMed Sci (2022) 29(1):96. doi: 10.1186/s12929-022-00879-y
122. Williams CG, Lee HJ, Asatsuma T, Vento-Tormo R, Haque A. An introduction to spatial transcriptomics for biomedical research. Genome Med (2022) 14(1):68. doi: 10.1186/s13073-022-01075-1
123. He S, Bhatt R, Brown C, Brown EA, Buhr DL, Chantranuvatana K, et al. High-plex imaging of RNA and proteins at subcellular resolution in fixed tissue by spatial molecular imaging. Nat Biotechnol (2022) 40(12):1794–806. doi: 10.1038/s41587-022-01483-z
124. Hanna WM, Rüschoff J, Bilous M, Coudry RA, Dowsett M, Osamura RY, et al. HER2 in situ hybridization in breast cancer: clinical implications of polysomy 17 and genetic heterogeneity. Mod Pathol (2014) 27(1):4–18. doi: 10.1038/modpathol.2013.103
125. Fang S, Chen B, Zhang Y, Sun H, Liu L, Liu S, et al. Computational approaches and challenges in spatial transcriptomics. Genomics Proteomics Bioinf (2022) 14:S1672-0229(22)00129-2. doi: 10.1016/j.gpb.2022.10.001
126. Zhao S, Ma D, Xiao Y, Li XM, Ma JL, Zhang H, et al. Molecular subtyping of triple-negative breast cancers by immunohistochemistry: molecular basis and clinical relevance. Oncologist (2020) 25(10):e1481–91. doi: 10.1634/theoncologist.2019-0982
Keywords: neoadjuvant chemotherapy, triple-negative breast cancer, tumor microenvironment, multi-omics, single-cell analysis
Citation: Wang G, Yao Y, Huang H, Zhou J and Ni C (2023) Multiomics technologies for comprehensive tumor microenvironment analysis in triple-negative breast cancer under neoadjuvant chemotherapy. Front. Oncol. 13:1131259. doi: 10.3389/fonc.2023.1131259
Received: 24 December 2022; Accepted: 08 May 2023;
Published: 22 May 2023.
Edited by:
Andrea Nicolini, University of Pisa, ItalyReviewed by:
Elham Sajjadi, University of Milan, ItalyXinzheng Victor Guo, Columbia University, United States
Copyright © 2023 Wang, Yao, Huang, Zhou and Ni. This is an open-access article distributed under the terms of the Creative Commons Attribution License (CC BY). The use, distribution or reproduction in other forums is permitted, provided the original author(s) and the copyright owner(s) are credited and that the original publication in this journal is cited, in accordance with accepted academic practice. No use, distribution or reproduction is permitted which does not comply with these terms.
*Correspondence: Chao Ni, nicaho428@zju.edu.cn
†These authors have contributed equally to this work