 Dingde Ye1
 Qingxiang Xu
- 1Medicine School of Southeast University Nanjing Drum Tower Hospital, Nanjing, China
- 2Nanjing Medical University, Nanjing, China
- 3Nanjing Drum Tower Hospital, The Affiliated Hospital of Nanjing University Medical School, Nanjing, China
Background and Aim: Hepatocellular carcinoma is a common malignant tumor of the digestive system with a poor prognosis. The high recurrence rate and metastasis after surgery reduce the survival time of patients. Therefore, assessing the overall survival of patients with hepatocellular carcinoma after hepatectomy is critical to clinicians’ clinical decision-making. Conventional hepatocellular carcinoma assessment systems (such as tumor lymph node metastasis and Barcelona clinical hepatocellular carcinoma) are obviously insufficient in assessing the overall survival rate of patients. This research is devoted to the development of nomogram assessment tools to assess the overall survival probability of patients undergoing liver resection.
Methods: We collected the clinical and pathological information of 438 hepatocellular carcinoma patients undergoing surgery from The Cancer Genome Atlas (TCGA) database, then excluded 87 patients who did not meet inclusion criteria. Univariate and multivariate analyses were performed on patient characteristics and related pathological factors. Finally, we developed a nomogram model to predict patient’s prognosis.
Results: A retrospective analysis of 438 consecutive samples from the TCGA database of patients with hepatocellular carcinoma who underwent potentially curative liver resections. Six risk factors were included in the final model. In the training set, the discriminative ability of the nomogram was very good (concordance index = 0.944), and the external verification method (concordance index = 0.962) was used for verification. At the same time, the internal and external calibration of the model was verified, showing that the model was well calibrated. The calibration between the evaluation of the nomogram and the actual observations was good. According to the patient’s risk factors, we determined the patient’s Kaplan-Meyer survival analysis curve. Finally, the clinical decision curve was used to compare the benefits of two different models in evaluating patients’ clinical outcomes.
Conclusions: The nomogram can be used to evaluate the post-hepatectomy 1-, 3-, and 5-year survival rates of patients with hepatocellular carcinoma. The Kaplan-Meyer curve can intuitively display the survival differences among patients with various risk factors. The clinical decision curve is a good reference guide for clinical application.
Introduction
Hepatocellular carcinoma (HCC) is the sixth most common malignant tumor in the world, and its mortality rate ranks fourth among malignant tumors (1). Hepatocellular carcinoma (HCC) accounts for 75-85% of primary liver cancer. The most important treatment in the early stage is hepatectomy (2–4). However, the high rate of recurrence and metastasis (60%) seriously affects the prognosis of patients, leading to low long-term survival rates of patients (2–4). In addition, the 5-year recurrence rate of patients is as high as 60-70% (5). Especially for patients with portal hypertension, the 5-year overall survival (OS) is only 37%. Tumor vascular invasion also seriously affects the survival rate of patients. This part of patients accounted for 18% (6).
Reducing postoperative recurrence is one of the most important measures to improve patient survival and prognosis. Therefore, accurate assessment of the prognosis of postoperative patients enables us to make correct clinical decisions in timely manner, thereby improving the prognosis and quality of life of patients. However, due to the complexity and heterogeneity of hepatocellular carcinoma, it is still a major challenge for clinicians to assess patient prognosis.
Due to the heterogeneity of hepatocellular carcinoma, it is difficult to evaluate the patient prognosis. In recent years, a variety of methods have been used to evaluate the prognosis, among which the nomogram has been widely used in clinical evaluation and improves prognosis assessment (7, 8). The nomogram is a graphical description of the predictive statistical model for a single patient (9). Although previous studies have evaluated the prognostic factors of patients with hepatocellular carcinoma (10), such as Barcelona clinical hepatocellular carcinoma (BCLC), tumor lymph node metastasis (TNM) and tumor markers (11), the evaluation is more cumbersome and it cannot calculate the specific survival probability. The nomogram is also an effective way to evaluate the prognosis of patients by integrating various factors (12). Its advantage is that it can refer to multiple factors at the same time and can intuitively display the prognosis of patients, which significantly improves the accuracy of prediction and clinical practicability. This study developed a nomogram combining multiple factors to predict the survival rate of patients after hepatocellular carcinoma surgery, so that clinicians can make better clinical decisions.
Patients and Methods
Patients
The research team retrospectively analyzed the clinical data of hepatocellular carcinoma patients extracted from the TCGA database. The TCGA project was jointly initiated by the National Cancer Institute (NCI) and the National Human Genome Research Institute (NHGRI) in 2006. At present, it has conducted research on a variety of cancer types, with the purpose of enhancing our understanding of the molecular basis of cancer, and further improving our ability to diagnose, treat and prevent cancer. We collected a total of 439 patients’ relevant information. Inclusion criteria: (1) hepatocellular carcinoma patients with surgical resection; (2) Age ≥18 years; (3) Complete clinical data. Exclusion criteria: (1) Age ≤18 years; (2) Incomplete clinical data; (3) lost to follow up. Of these, 87 patients were excluded, including 2 age Less than 18 year, 11 survival time unknow, 7 survival time flag incomplete dates, 22 lost to follow up, and 45 other items are incomplete, so 352 patients were finally included. Among them, 288 people were included in the training set and 184 cases survived; 64 people were included in the verification set and 36 cases survived. The selection and deletion process of patients is shown in Figure 1. Any information that can identify the patient’s identity is deleted. The report of this study is based on the Transparent Reporting of Multivariate Predictive Models for Individual Prognosis or Diagnosis (TRIPOD) reporting guidelines, which are used to establish models for multivariate diagnosis or predict patient prognosis to develop and validate disease diagnosis or prediction models (13). The nomogram predicts that the patient’s prognostic endpoint is the survival status within 1 year, 3 years and 5 years from the date of liver resection. According to the ratio of 9:2, the patients were randomly divided into training group and verification group. The prognosis yielded by the presumptive nomogram is based on prior clinical and pathological parameters related to the prognosis of hepatocellular carcinoma patients, including the degree of inflammation adjacent to the cancer (DFAC), gender, age, albumin (ALB), Child-Pugh score (Child-Pugh), creatinine value (CV), tumor histology grade (NHG), platelet count (PLT), vascular tumor cell type (VASTP), pathological stage (P. STAGE), body mass index (BMI), resection marginal residual tumor (RT), viral hepatitis serology (VHS), first-degree relative hepatocellular carcinoma (CFDR), total bilirubin (TB), AFP, risk factors (THCR), patient tumor status (PTS), postoperative treatment (POT), relative family cancer history (RFCH), TNM and other malignant tumors (OM).
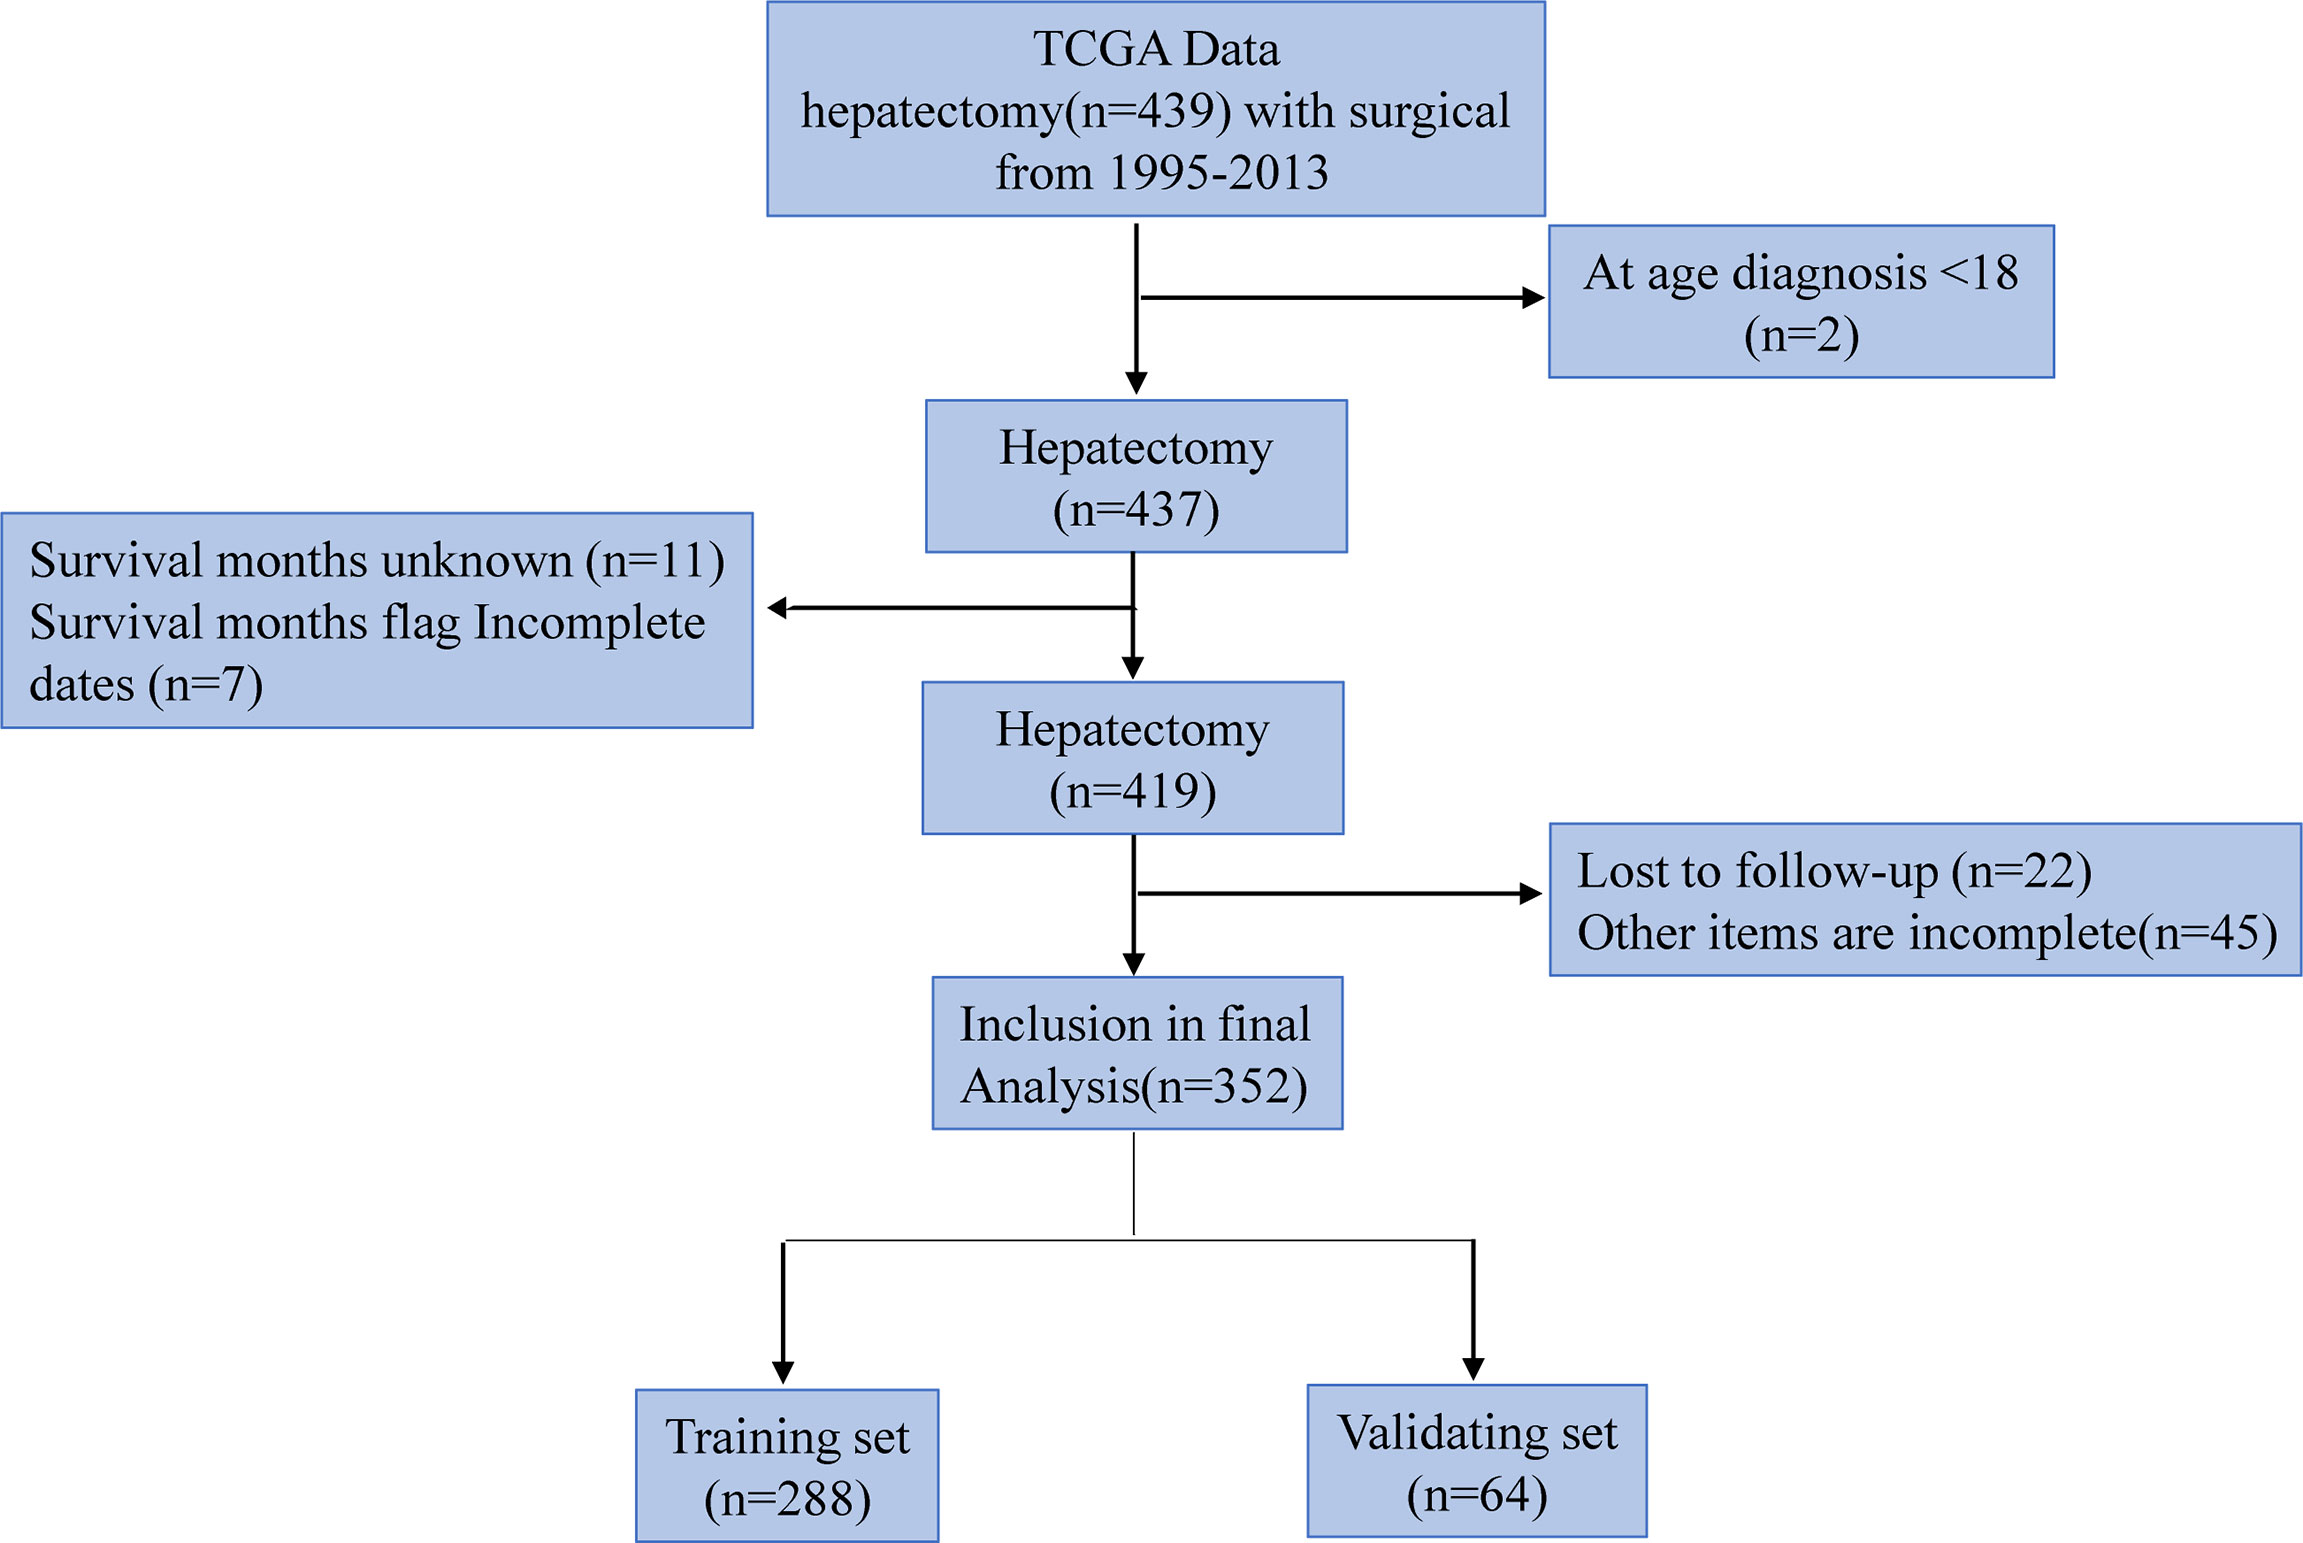
Figure 1 Numbers of patients enrolled and outcomes in the training set and validating set.
Statistical Analysis
In this study, continuous variables are represented by median and range. The categorical and continuous variables of the two groups were compared using the chi-square test and the unpaired Student’s t-test, respectively. Univariate and multivariate Cox regression were used to evaluate the risk factors related to the patient’s disease prognosis, and expressed in odds ratio (OR) and 95% confidence interval (CI). Variables (CV, P-STAGE, AFP, PTS, RT, TNM and VHS) with significant differences in univariate COX regression analysis were included in multivariate COX regression analysis to determine the final independent risk factors (CV, AFP, PTS, RT, TNM and VHS) for the patient’s prognosis. Finally, in order to predict the survival probability of HCC patients, through multivariate COX regression analysis with definite prognostic factors, we used the rms package of R software to draw a nomogram to predict the probability of overall survival at 1, 3, 5 years and median survival time after surgery. In order to verify the prognosis of HCC patients, the ROC curve was drawn using the survival ROC package of R software, and the difference between the model and different clinical indicators to evaluate the prognostic calibration of patients was compared. The overall survival time corresponding to each risk factor of the patient was calculated by the Kaplan-Meier method, and the Kaplan-Meier method was used to draw the survival curve. The performance of the model is evaluated by the calibration chart (to determine the agreement between the observed and estimated survival probabilities) and the verification index (to determine the discriminative ability of the model). Nomograms were constructed on the results of multivariate analysis using R software (US version 4.0.3). The prognostic nomogram was verified by the consistency index (C-index), receiver operating characteristic curve (ROC), decision curve analysis (DCA) and calibration curve. Statistical analysis was performed using IBM SPSS statistics 26.0 (IBM, Armonk, NY, USA) and MedCalc statistical software version 15.2.2 (MedCalc Software bvba, Ostend, Belgium; http://www.medcalc.org; 2015). P values below 0.05 are considered statistically significant.
Results
Patient Characteristics
A total of 439 HCC patients were extracted from the TCGA database. The characteristics of the target population can be seen in Table 1. 352 patients were finally included in the study, of which 288 patients entered the training set, and 64 cases were divided into the validation cohort. There were no significant differences in the characteristics of the two groups.
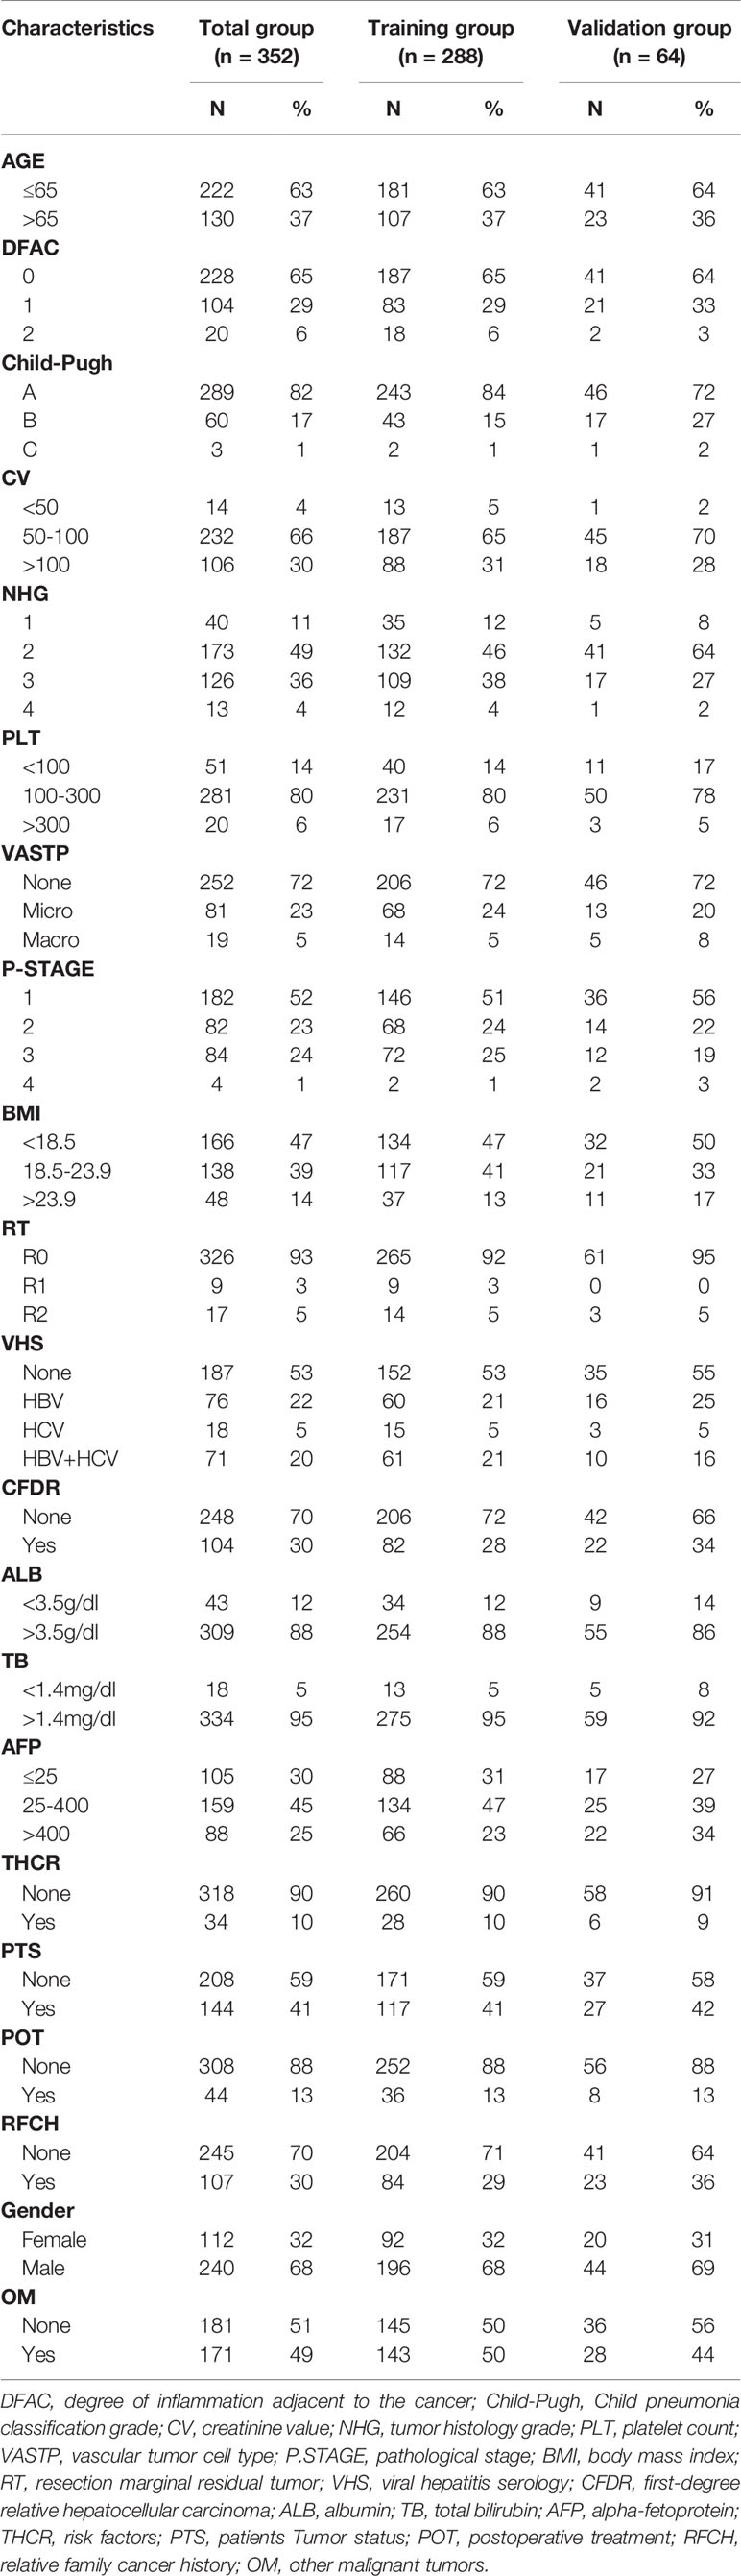
Table 1 Characteristics of patients with HCC in the training and validation group.
Independent Prognostic Factors for OS
Firstly, the univariate Cox regression analysis is used to determine the risk factors related to the patient’s prognosis, and then the univariate analysis risk factors are further incorporated into the multivariate COX regression analysis to determine the final independent risk factors for the patient’s prognosis. As shown in Tables 2, 3, multivariate COX regression analysis shows that OS is significantly correlated with AFP, CV, PTS, RT, TNM and VHS.
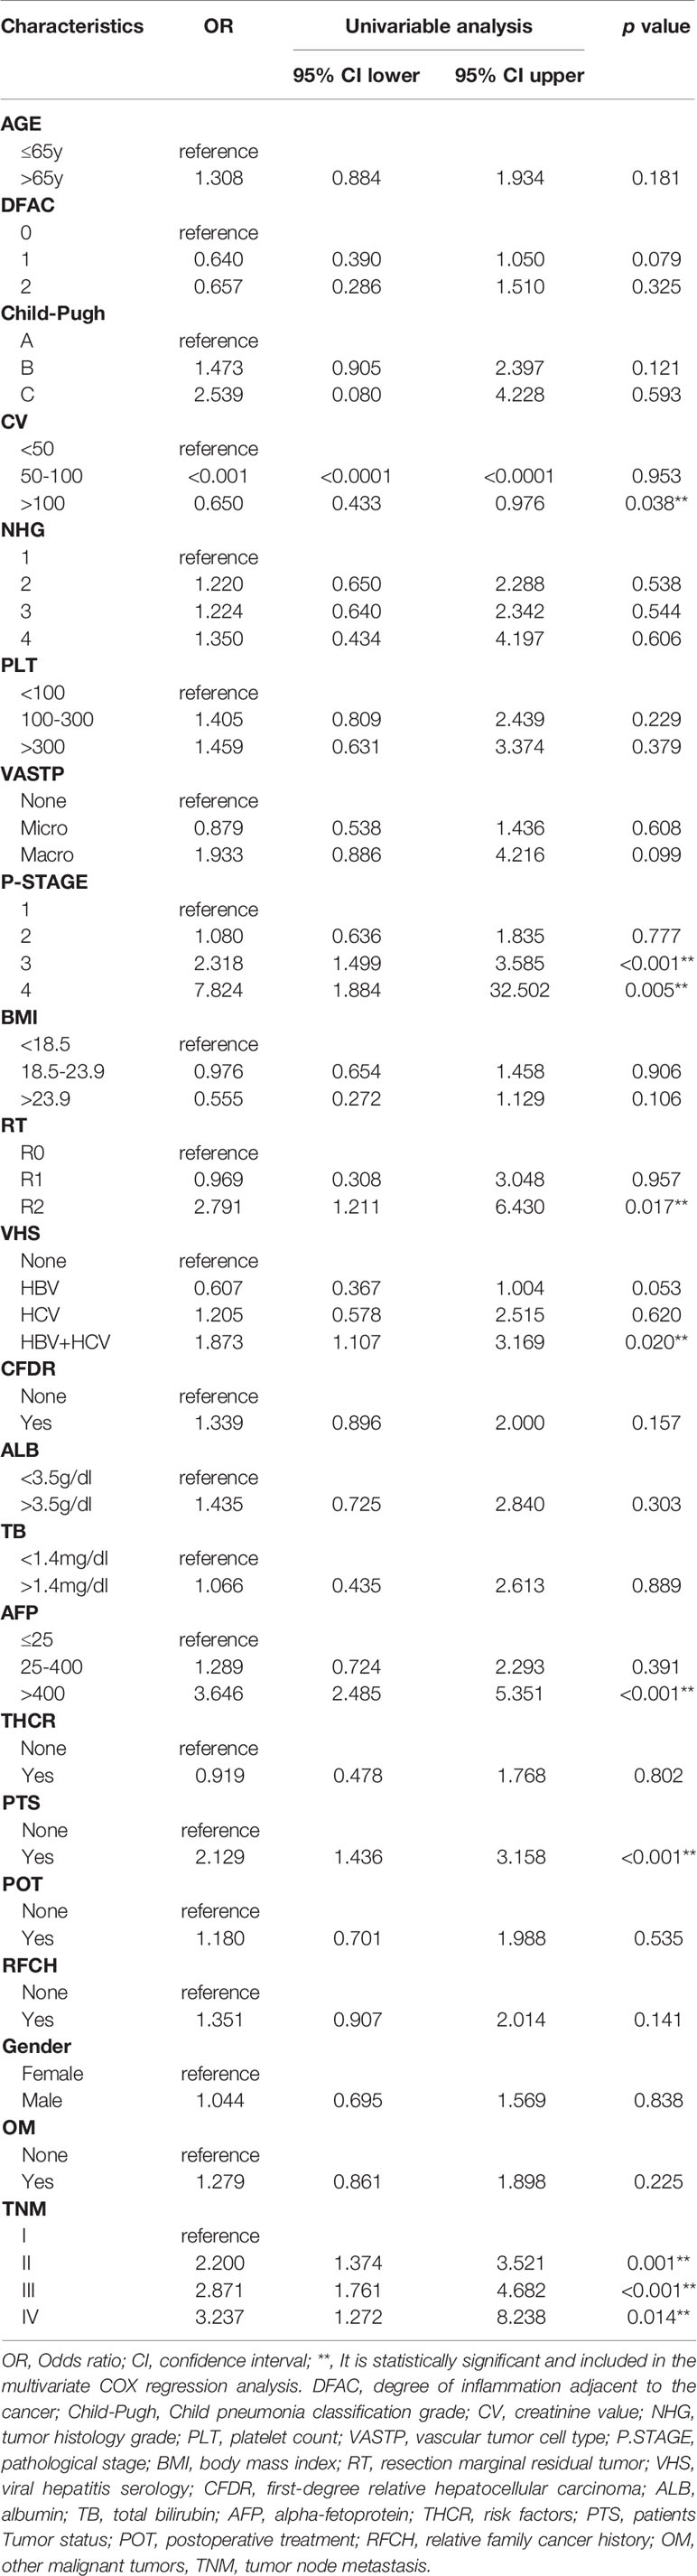
Table 2 Univariable Cox regression model analyses of OS for nomogram.
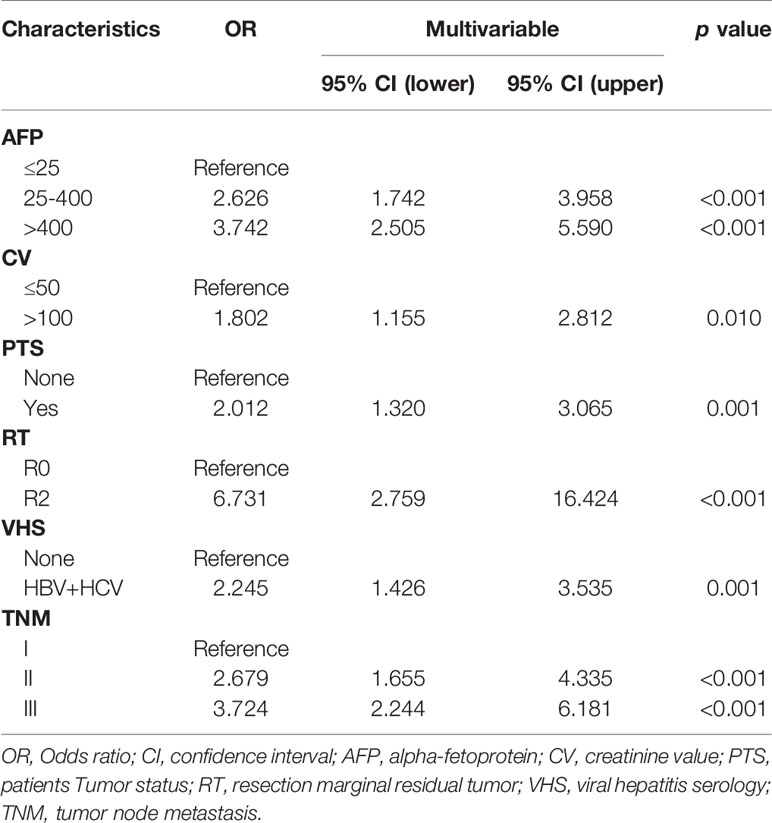
Table 3 Multivariable Cox regression model analyses of OS for nomogram.
Generation of the Prognostic Nomogram
Based on multivariate analysis, we generated a nomogram for six independent risk factors (Figure 2). According to the independent risk factors of the patient, a relevant score is assigned to each independent risk factor, and a total score is finally obtained. The vertical line generated by the total score helps predict the 1-year, 3-year, or 5-year survival rate, and the median survival time can be predicted after the total score is calculated. Determining the total score can enable us to more accurately and easily estimate the survival probability and median survival time of patients, and timely intervene independent risk factors that affect the survival and prognosis of patients. The graph visually shows the relative probability of overall survival for patients with relevant risk factors.
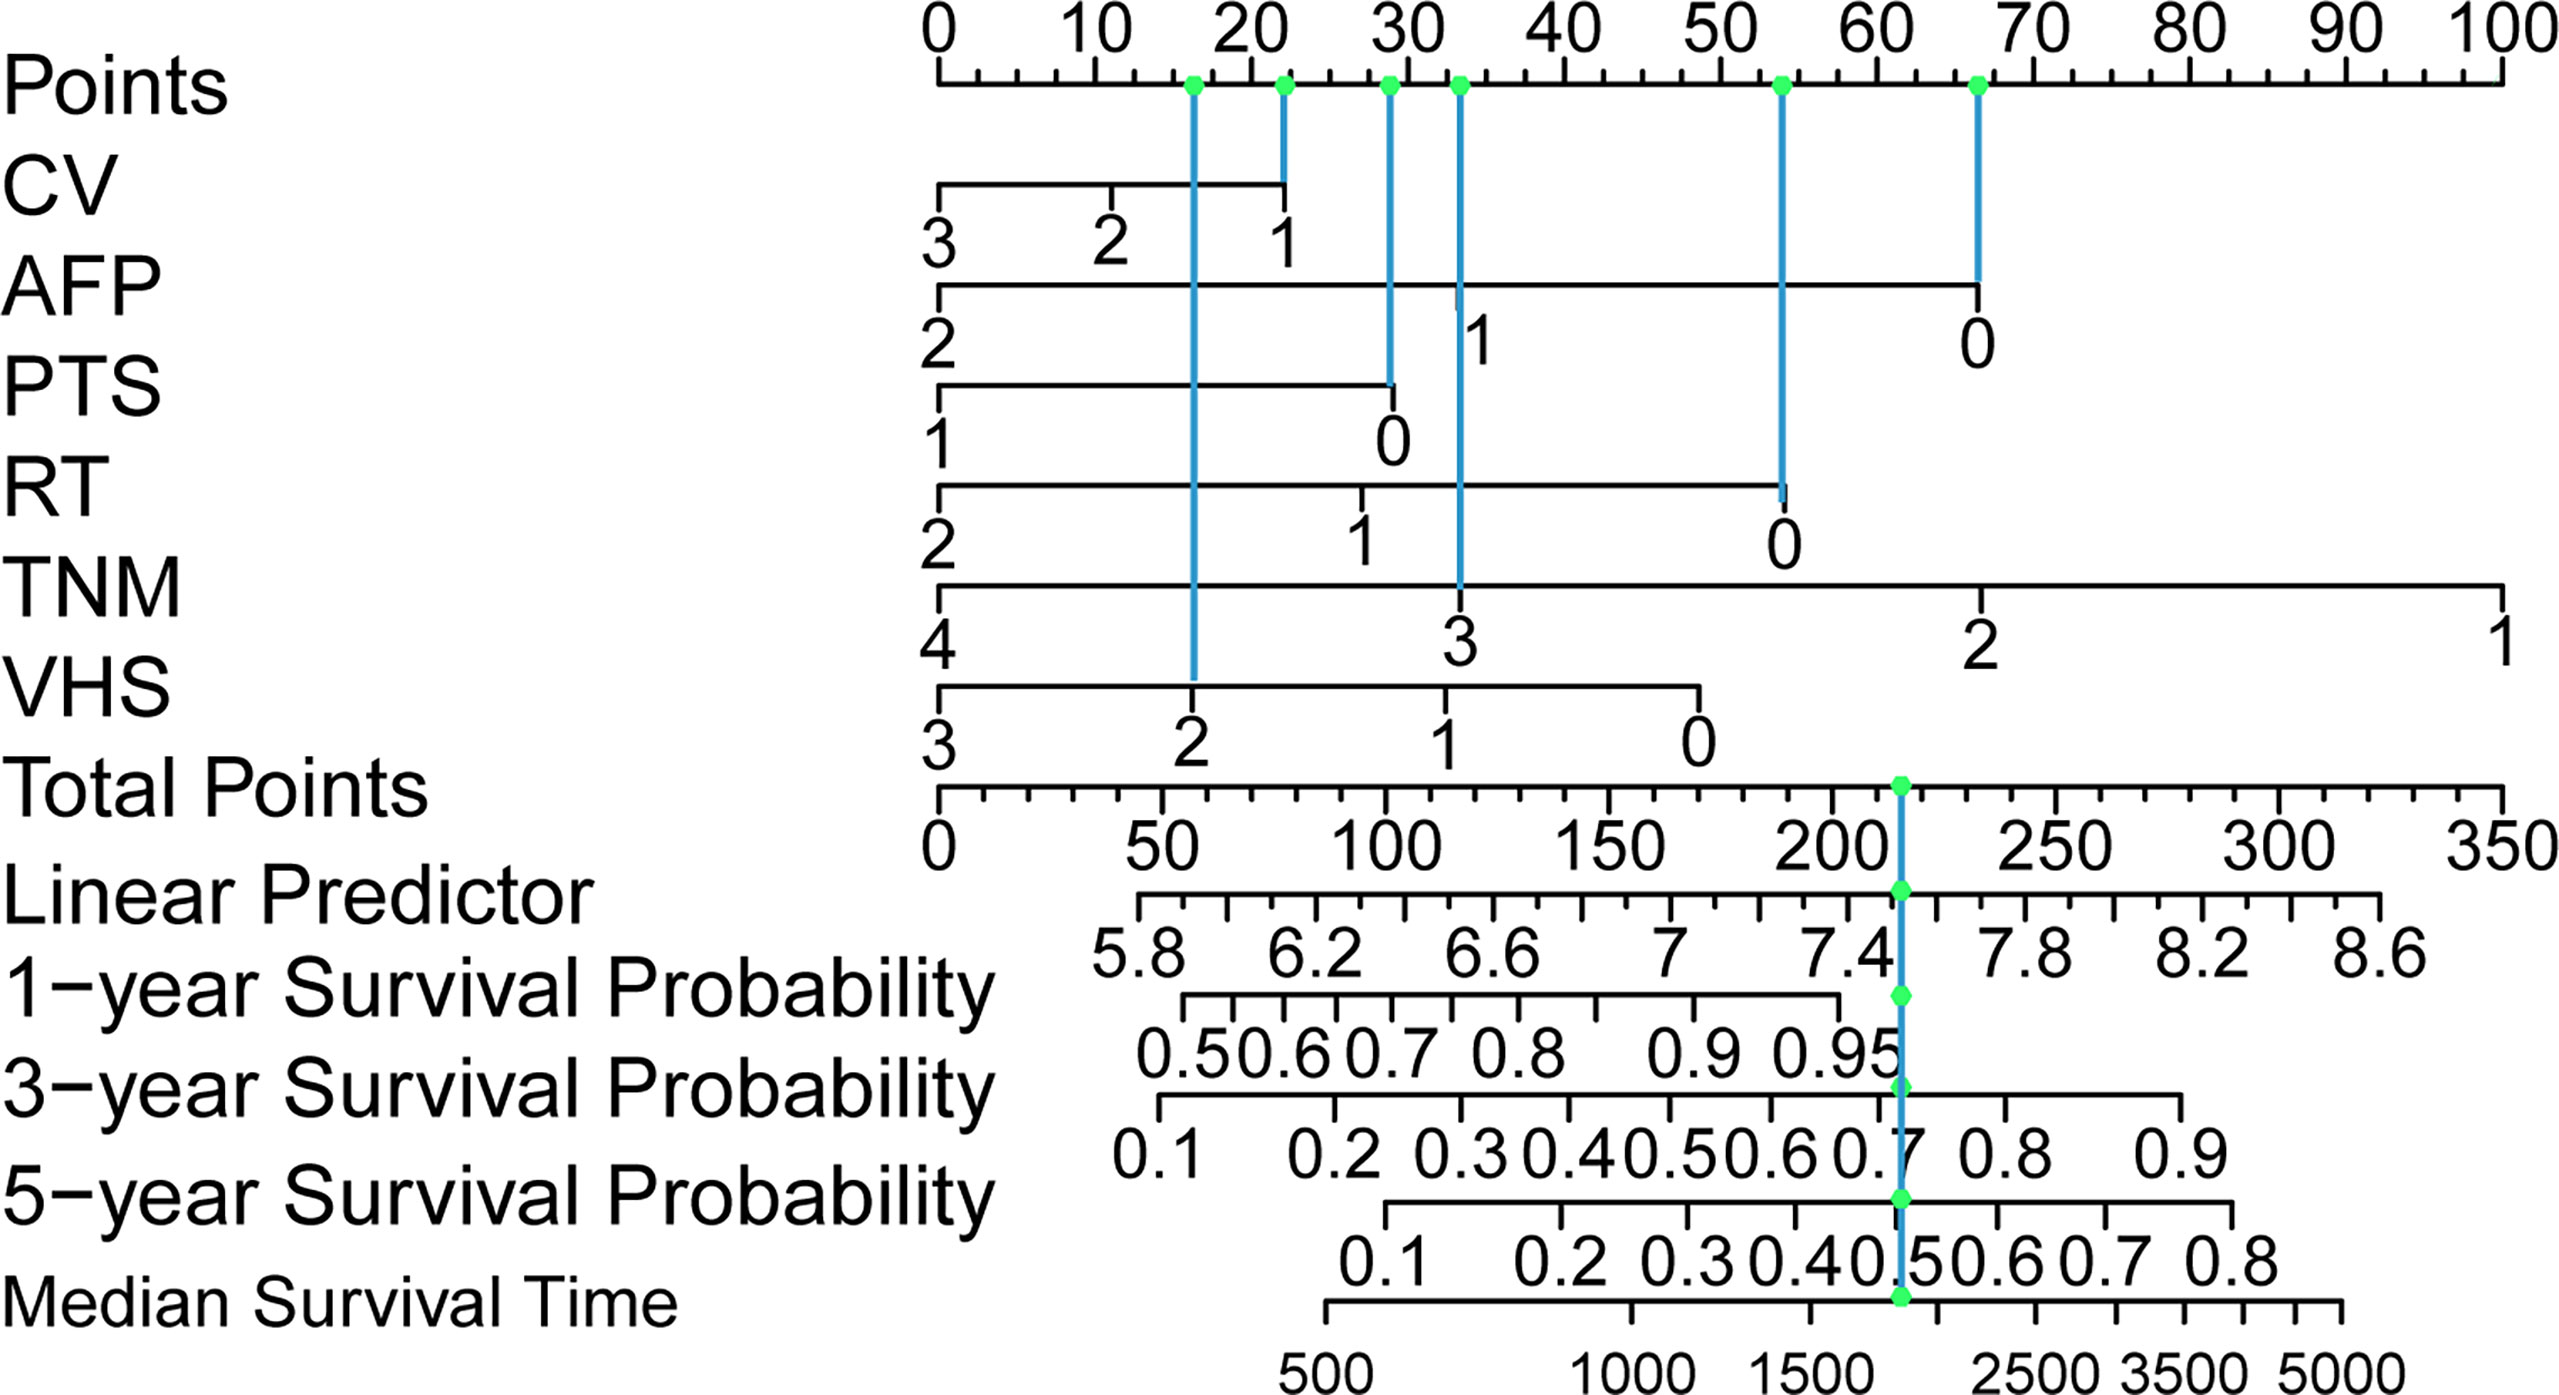
Figure 2 Postoperative hepatocellular carcinoma prognostic nomogram. (To use the nomogram, a patient’s values are located on each variable axis, and a line is drawn upward to determine the number of points received for each variable value. The sum of these numbers is located on the total point axis, and a line is drawn downward to the survival axes to determine the probability of survival at 1, 3 and 5 years and the median survival time.). CV, creatinine value; AFP, alpha-fetoprotein; PTS, patients Tumor status; RT, resection marginal residual tumor; TNM, tumor node metastasis; VHS, viral hepatitis serology.
Predictive Ability of the Nomogram Model
Next, we compare the calibration and the discrimination inside and outside the model. The degree of calibration is better displayed in Figure 3, and the P value of both is greater than 0.05. The degree of discrimination is represented by the area under the receiver operating characteristic curve (AUROC). The larger the area under the curve, the better the degree of discrimination. Generally, AUROC > 0.6 indicates that the model has a good discrimination. The AUROC of the training set was 0.944 (95% CI: 0.917-0.972), the cutoff value was 0.542 (P < 0.0001), and the C index was 0.944. The AUROC of the verification set was 0.962 (95% CI: 0.921-1.000) (P < 0.0001) and the C index was 0.962. The C index of the prediction model in both populations was > 0.75 and showed a good degree of discrimination as shown in Figure 4.
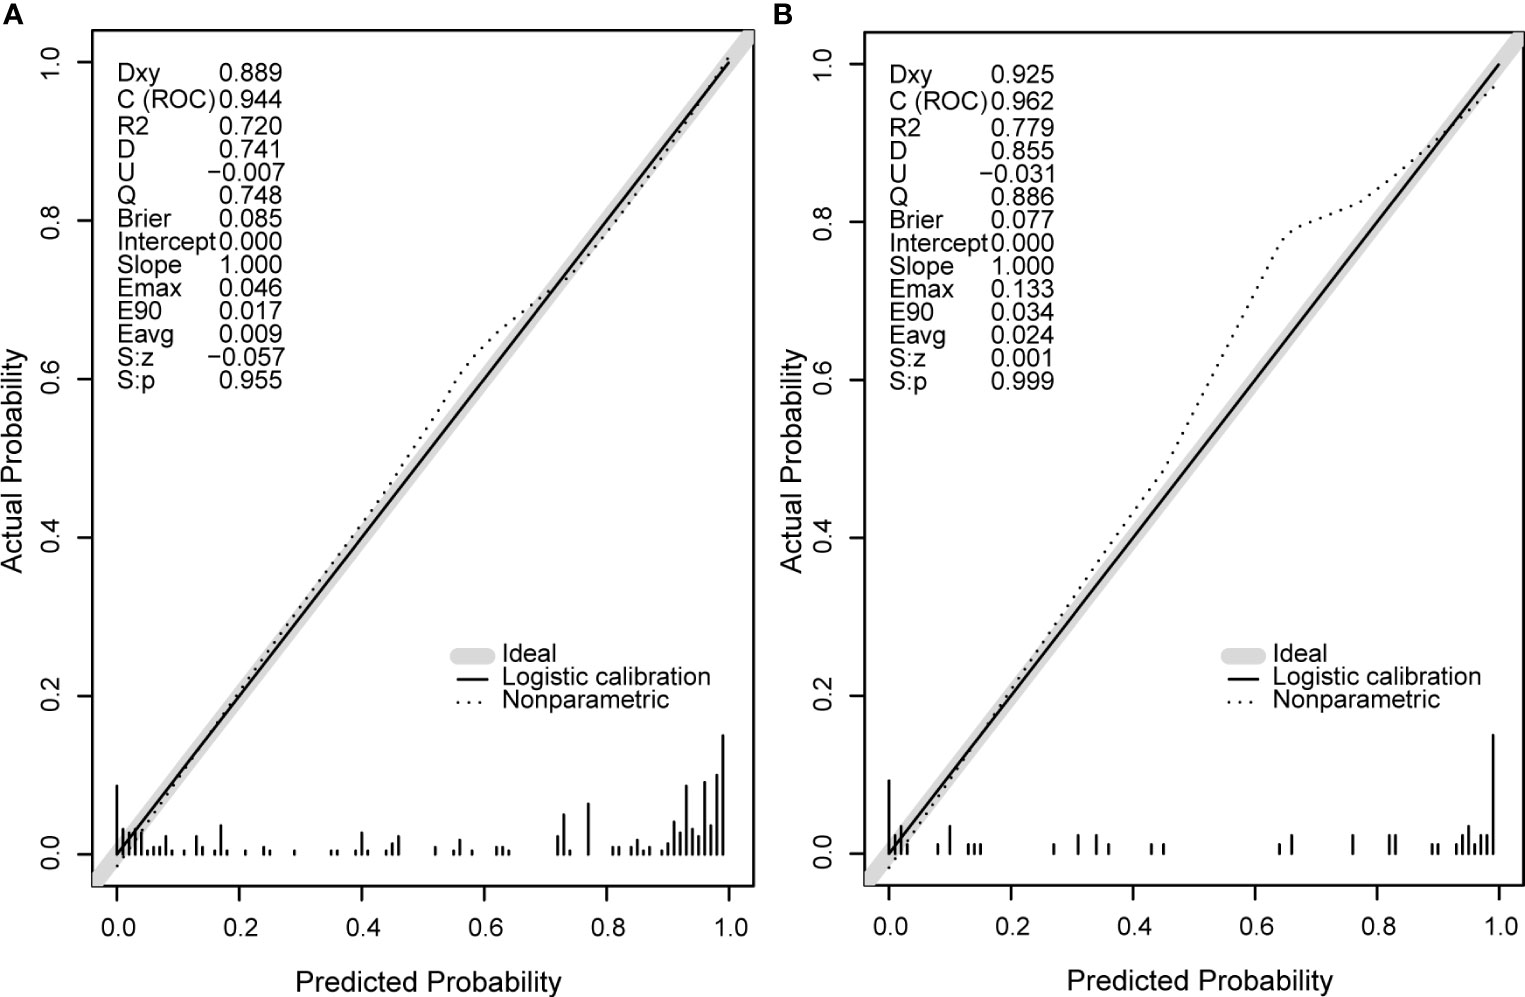
Figure 3 The calibration curve diagrams of the training set (A) and the validation set (B) have good agreement between the predicted probability and the actual probability, both S, p > 0.05. Emax, the maximum offset between the model and the ideal model; Eavg, the minimum offset between the model and the ideal model.
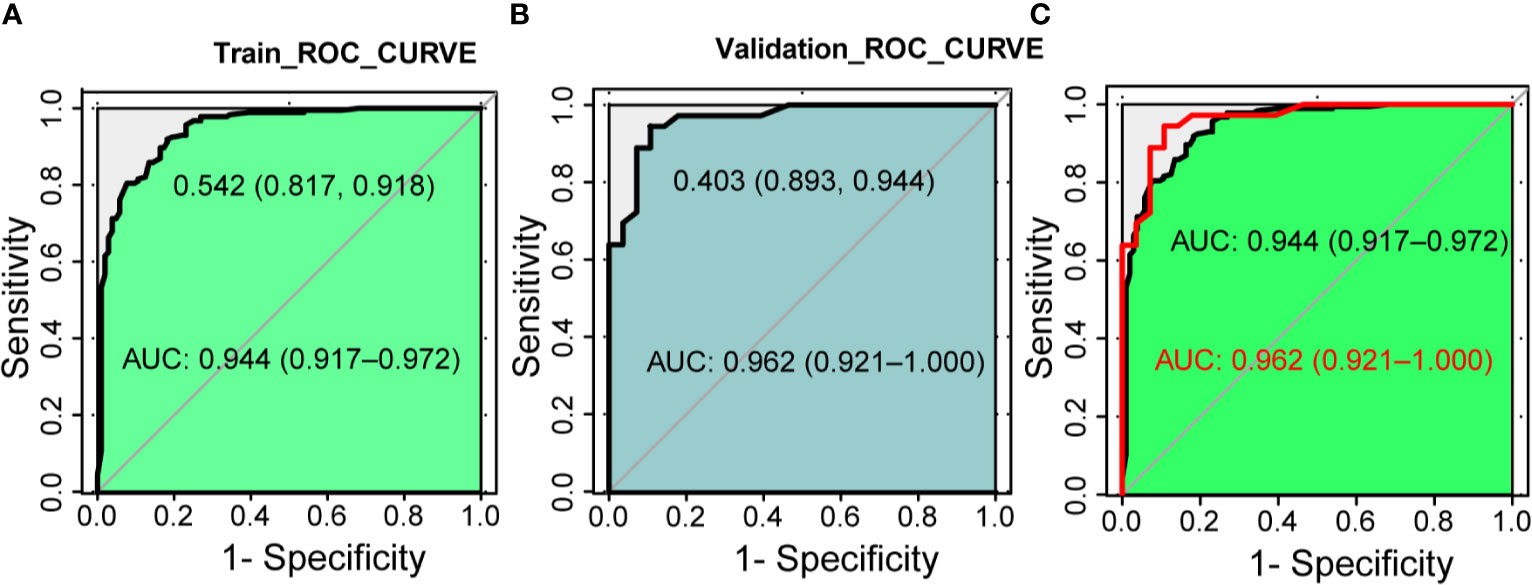
Figure 4 The discrimination test of nomogram model (ROC analysis). (A) The area under the AUC of the training set is 0.944(95%CI 0.917~0.972, P < 0.001), the best diagnostic threshold is 0.542. (B) The AUC of the validation set is 0.962 (95% CI 0.921~1.000, P < 0.001), the best diagnostic cut-off value is 0.403. (C) Combination of panels (A, B). AUC, the area under the receiver operating characteristic curve; ROC, the receiver operating characteristic.
Validation of the Prognostic Nomogram
The calibration graphs for internal verification and external verification are basically linear, showing excellent agreement between the estimated values of the nomogram and the actual observations in the 1-year, 3-year, and 5-year survival probabilities (Figure 5). In addition, all the prediction lines overlap the reference lines well, which proves the good performance of the nomogram.
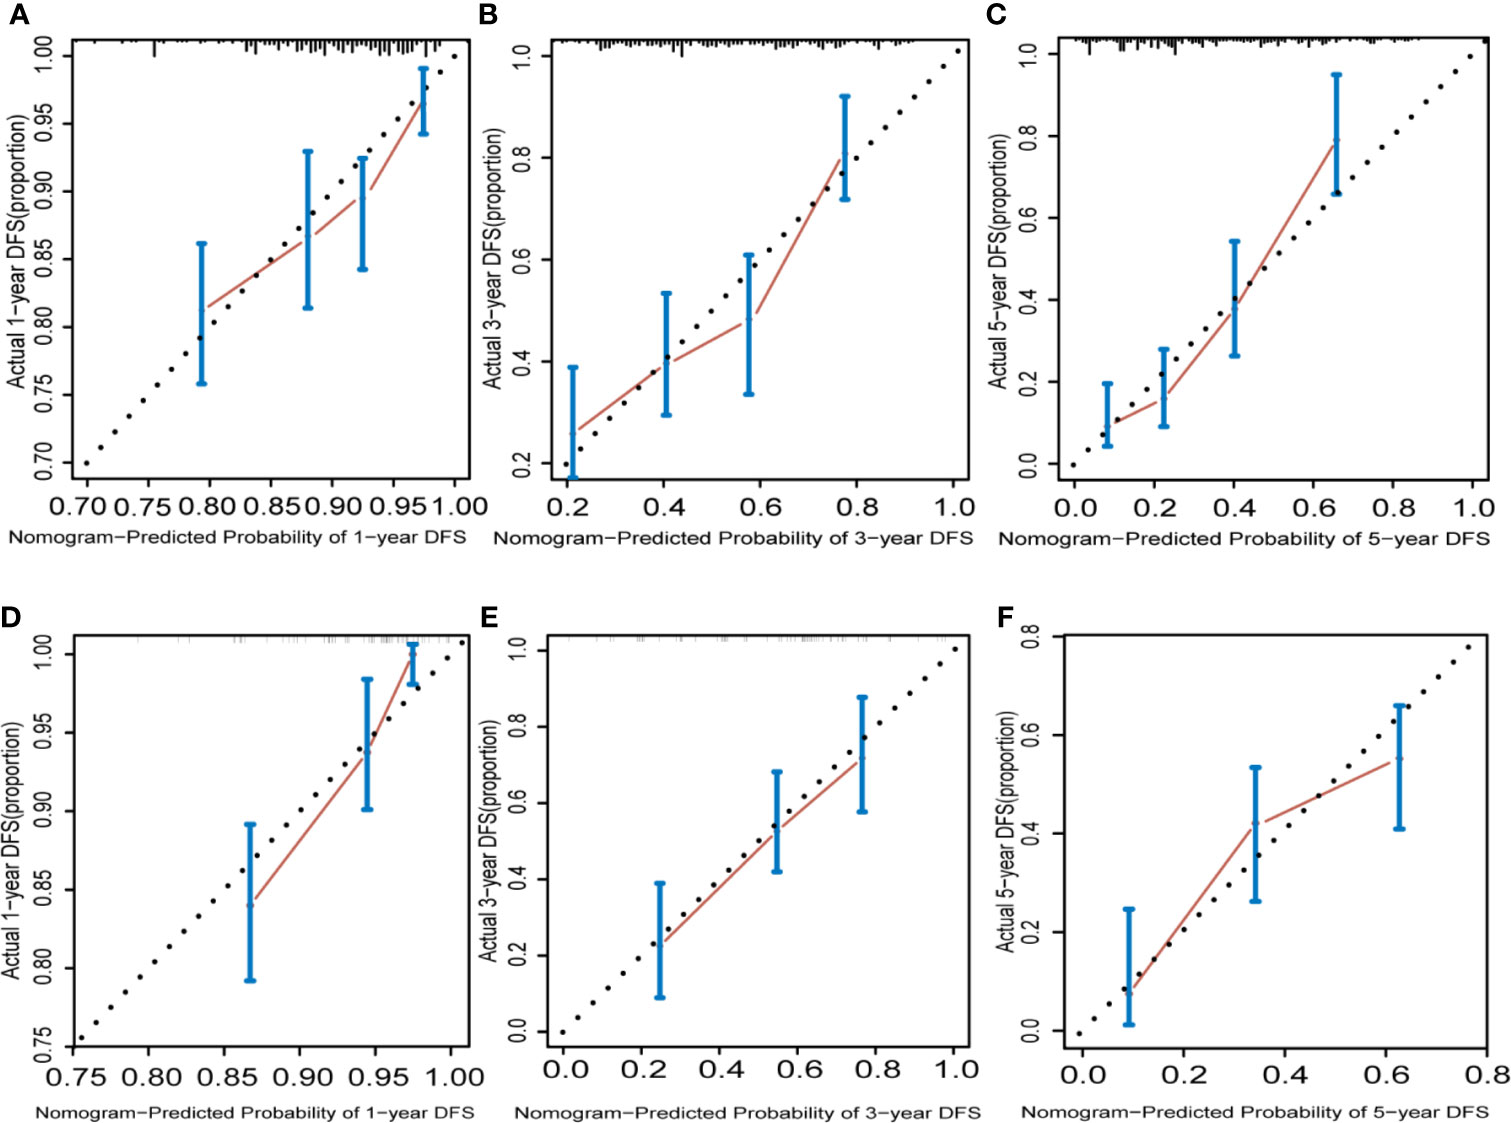
Figure 5 Hepatocellular carcinoma calibration curve. The calibration curve for predicting OS at 1 years (A) for training cohort; (D) for validation cohort), 3 years (B) for training cohort; (E) for validation cohort) and 5 years (C) for training cohort; (F) for validation cohort) in HCC patients. Nomogram-predicted probability of overall survival is plotted on the x axis and actual overall survival is plotted on the y axis.
Decision Curve Analysis
According to the risk factors of the model, in order to emphasize the control of prognostic factors, we finally drew the Kaplan-Meyer survival curves (Figure 6) to show the benefit of treatment based on the total population in this study. The risk factors showed significant statistical differences.
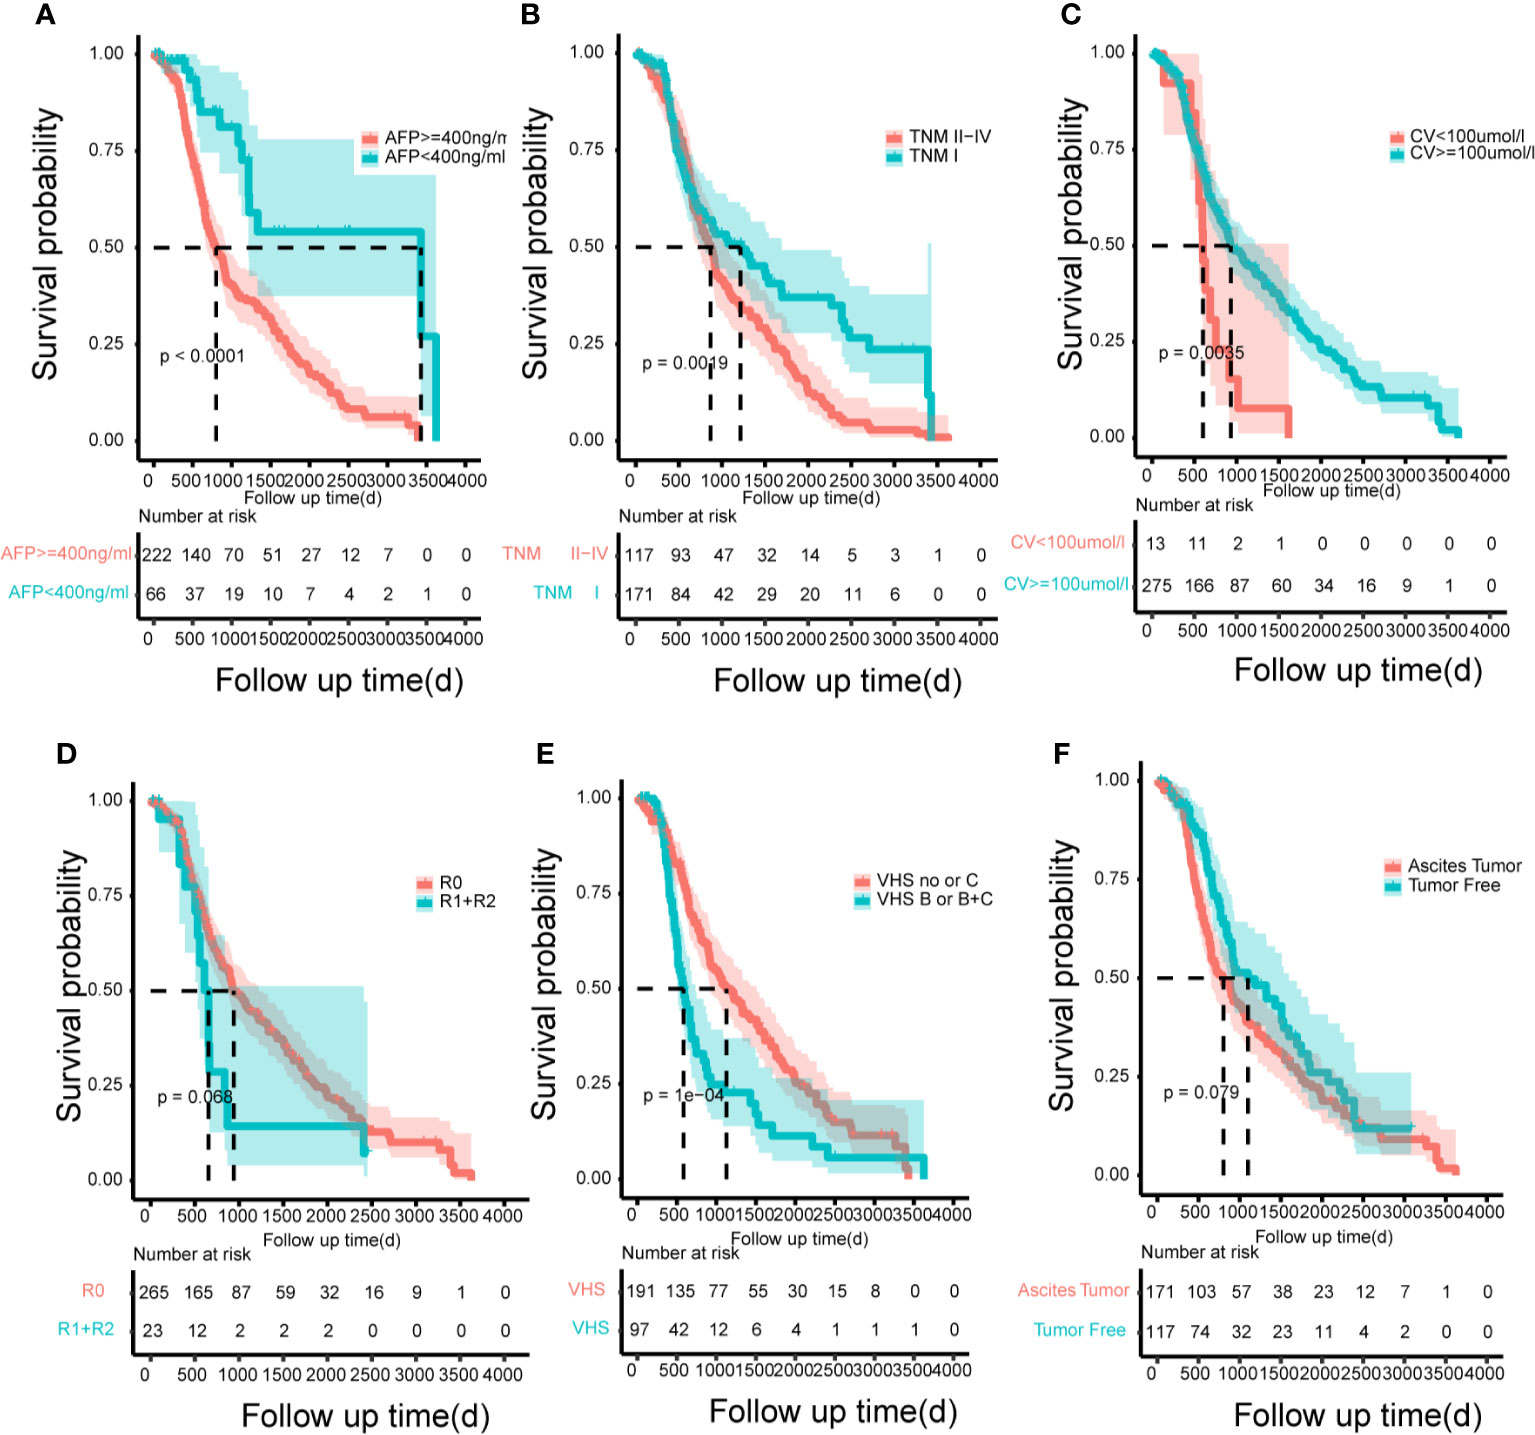
Figure 6 The Kaplan–Meier curves for subgroups of patients. Patients were stratified by the AFP (A), tumor node metastasis (B), creatinine value (C), resection marginal residual tumor (D), viral hepatitis serology (E) and patient’s tumor status (F) in the training cohort.
Drawing a decision curve analysis (DCA) can visually show the clinical benefits of patients. The DCA curve we drew shows that in the training and validation groups, our nomogram has a positive net benefit to patients, and has a wider range of benefit probability (Figure 7). And it can be seen that compared with the TNM prognostic evaluation system, the nomogram model has greater clinical net benefits and has obvious advantages in prognostic evaluation.
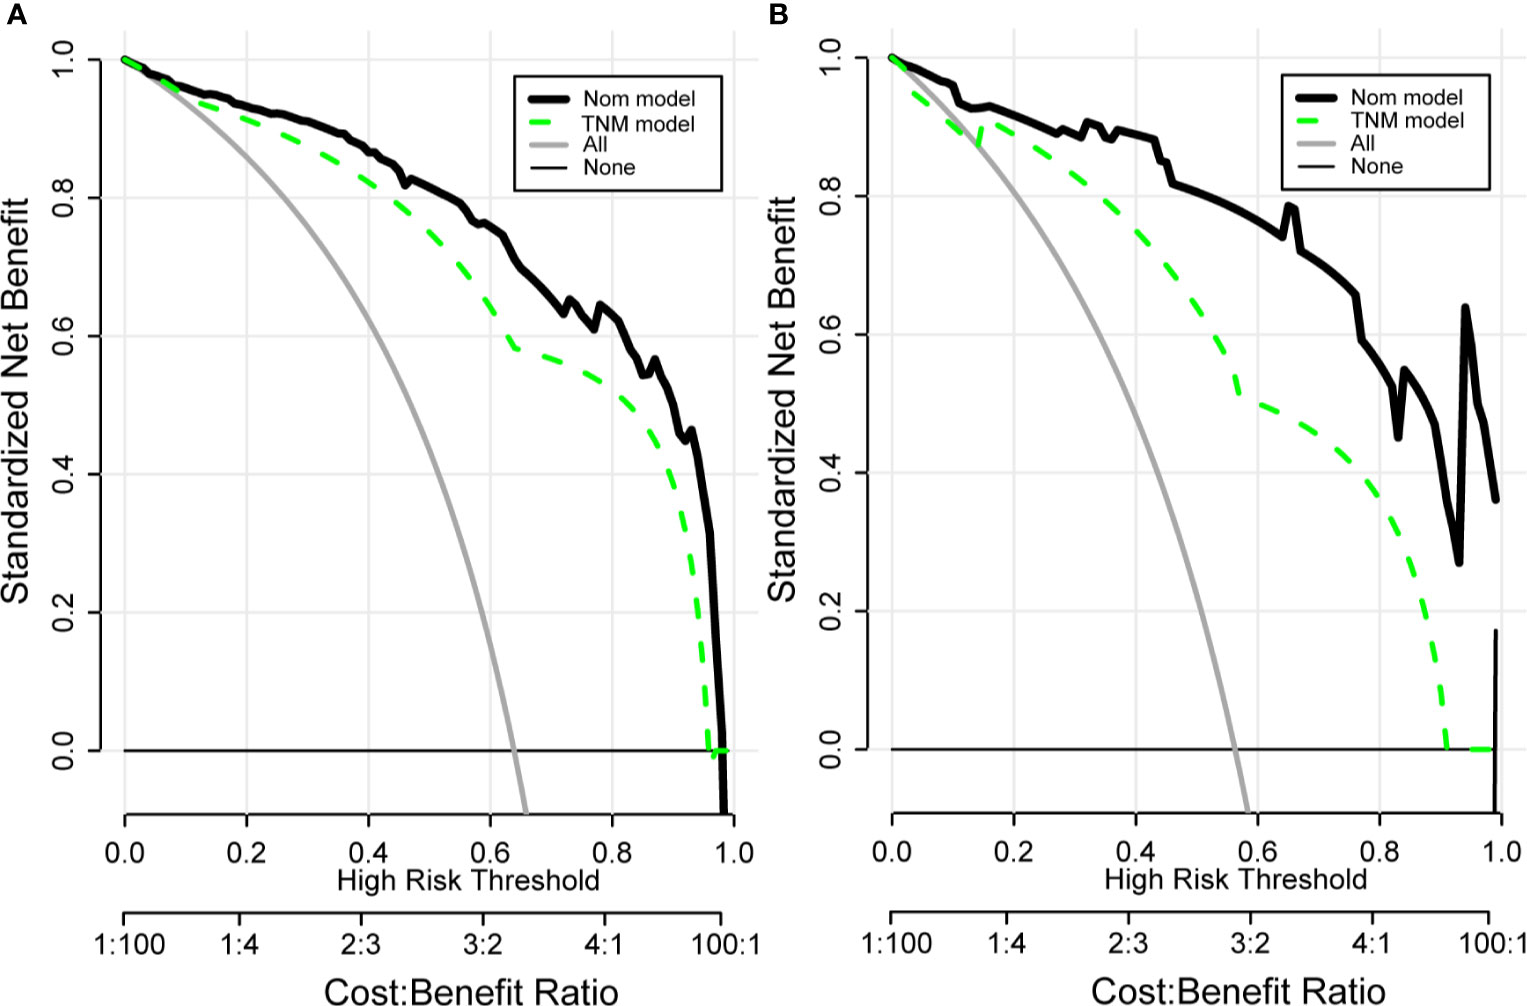
Figure 7 Clinical decision curve analysis (DCA) of the training group (A) and validation group (B) for clinical benefits. Comparison of DCA between Nom model and TNM model. X-axis stands for threshold probability. Y-axis stands for the net benefit after the advantage minus the disadvantage. The black horizontal line indicates that all samples are negative, which means none of the patients received interventions and the net benefit is 0; The gray oblique line indicates that all samples are positive and all patients received interventions. Nom model included AFP, VHS, CV, RT, TNM, PTS. TNM Model included T-stage, N-stage, and M-stage.
Discussion
Previous studies have shown that in tumor prognosis prediction models, nomograms are more practical and accurate than tumor staging systems (14–16). Based on this, we generated and verified the nomogram model which combines six independent risk factors for the prognosis assessment of hepatocellular carcinoma patients to accurately predict the survival rate of HCC patients. The calibration curve shows that there is a high degree of consistency between the predicted value and the actual value in the training set and the verification set, which confirms that the column graph model has good repeatability and provides a reliable reference basis for clinicians’ clinical decision-making. At the same time, in the 1-year, 3-year and 5-year survival rates, the nomogram evaluation model predicts OS better than other commonly used evaluation systems. In addition, in order to evaluate the clinical benefit obtained by the patient through the nomogram, we visually display it through the DCA curve. DCA is usually used to evaluate the maximum clinical net benefit of the model (17, 18), and is generally considered to be more accurate than the ROC curve (19). The net benefit of our nomogram model for clinical decision-making is significantly better than the TNM prognostic evaluation system, and it has been verified in the validation set. These results represent an excellent estimate of the outcome of the decision at a higher threshold probability level.
Although clinical guidelines provide clinical indications for treatment, we pay more attention to the prognosis of patients after surgery. Moreover, clinicians lack effective predictive methods (20), making them likely to be unable to predict the patient’s prognosis and miss the best time for end-of-life discussions and/or end-of-life care referrals (21). In addition, studies have shown that many patients were eager to understand their prognosis after hepatectomy (22). Therefore, this study explored the survival 1, 3, and 5 years after hepatectomy. Our nomogram can not only help clinicians make key treatment decisions but also provide patients with very important survival information based on individual risk factors.
Our nomogram involved six independent risk factors. These factors have already been shown to correlate with poor prognosis after HCC resection (23–27). In terms of these risk factors, our research is consistent with previous studies.
Tumor differentiation is related to the prognosis of liver tumors. A poor degree of differentiation can lead to poor prognosis. Previous studies have shown that the prognosis of hepatocellular carcinoma is related to poorer histopathological grades (28).
The accurate risk stratification of patients with postoperative hepatocellular carcinoma prognosis is critical, as the prognosis of patients may vary (29). Comprehensive consideration of a variety of factors will be more helpful for postoperative prognosis assessment of patients, and our nomogram model shows that the internal and external predictions (C-index: 0.944 and 0.962) of the model are good, suggesting that our nomogram can be better predict the survival rate of patients with hepatocellular carcinoma after surgery.
In summary, our nomogram performed well in internal verification and external verification. This study also has certain limitations. First of all, the study is a retrospective study. The data comes from a single hepatocellular carcinoma database, and there may be corresponding errors in the accuracy of the data. The sample size is still small, and more research is needed to verify the established nomogram from the outside. In addition, because the database lacks imaging data to evaluate tumor characteristics, the nomogram model is temporarily unable to evaluate its potential impact.
Conclusion
Above all, we have developed and verified a nomogram that predicts the 1-year, 3-year, and 5-year survival rates of HCC patients based on a large number of population-based cohorts. The nomogram prediction model shows higher prediction accuracy than the TNM staging system. Therefore, through this model, clinicians can more accurately estimate the survival rate of a single patient, and promptly intervene in the risk factors of high-risk patients to improve the patient’s prognosis.
Data Availability Statement
Publicly available datasets were analyzed in this study. This data can be found here: TCGA database.
Ethics Statement
The studies involving human participants were reviewed and approved by Nanjing Drum Tower Hospital, The Affiliated Hospital of Nanjing University Medical School.
Author Contributions
DY, QX, and JQ designed the study. DY and JW analyzed the data and wrote the manuscript. DY, QX, GL, and BS provided technical expertise and support. All authors contributed to the article and approved the submitted version.
Conflict of Interest
The authors declare that the research was conducted in the absence of any commercial or financial relationships that could be construed as a potential conflict of interest.
Publisher’s Note
All claims expressed in this article are solely those of the authors and do not necessarily represent those of their affiliated organizations, or those of the publisher, the editors and the reviewers. Any product that may be evaluated in this article, or claim that may be made by its manufacturer, is not guaranteed or endorsed by the publisher.
Acknowledgments
We sincerely thank the researchers and study participants for their contributions toward this study.
Supplementary Material
The Supplementary Material for this article can be found online at: https://www.frontiersin.org/articles/10.3389/fonc.2021.698980/full#supplementary-material
References
1. Bray F, Ferlay J, Soerjomataram I, Siegel RL, Torre LA, Jemal A. Global Cancer Statistics 2018: GLOBOCAN Estimates of Incidence and Mortality Worldwide for 36 Cancers in 185 Countries. CA Cancer J Clin (2018) 68(6):394–424. doi: 10.3322/caac.21492
2. Heimbach JK, Kulik LM, Finn RS, Sirlin CB, Abecassis MM, Roberts LR, et al. AASLD Guidelines for the Treatment of Hepatocellular Carcinoma. Hepatology (2018) 67(1):358–80. doi: 10.1002/hep.29086
3. Omata M, Cheng AL, Kokudo N, Kudo M, Lee JM, Jia J, et al. Asia-Pacific Clinical Practice Guidelines on the Management of Hepatocellular Carcinoma: A 2017 Update. Hepatol Int (2017) 11(4):317–70. doi: 10.1007/s12072-017-9799-9
4. EASL Clinical Practice Guidelines. Management of Hepatocellular Carcinoma. J Hepatol (2018) 69(1):182–236. doi: 10.1016/j.jhep.2018.03.019
5. Zhong JH, Ke Y, Gong WF, Xiang BD, Ma L, Ye XP, et al. Hepatic Resection Associated With Good Survival for Selected Patients With Intermediate and Advanced-Stage Hepatocellular Carcinoma. Ann Surg (2014) 260(2):329–40. doi: 10.1097/sla.0000000000000236
6. Zhong JH, Ke Y, Wang YY, Li LQ. Liver Resection for Patients With Hepatocellular Carcinoma and Macrovascular Invasion, Multiple Tumours, or Portal Hypertension. Gut (2015) 64(3):520–1. doi: 10.1136/gutjnl-2014-308139
7. Zhang K, Tao C, Wu F, Wu J, Rong W. A Practical Nomogram From the SEER Database to Predict the Prognosis of Hepatocellular Carcinoma in Patients With Lymph Node Metastasis. Ann Palliat Med (2021) 10(4):3847–63. doi: 10.21037/apm-20-1876
8. Serenari M, Han K-H, Ravaioli F, Kim S-U, Cucchetti A, Han DH, et al. A Nomogram Based on Liver Stiffness Predicts Postoperative Complications in Patients With Hepatocellular Carcinoma. J Hepatol (2020) 73(4):855–62. doi: 10.1016/j.jhep.2020.04.032
9. Huo RR, Liu X, Cui J, Ma L, Huang KH, He CY, et al. Development and Validation of a Nomogram for Assessing Survival in Patients With Hepatocellular Carcinoma After Hepatectomy. Biosci Rep (2020) 40(6):BSR20192690. doi: 10.1042/bsr20192690
10. Lin CW, Chen YS, Lin CC, Lee PH, Lo GH, Hsu CC, et al. Significant Predictors of Overall Survival in Patients With Hepatocellular Carcinoma After Surgical Resection. PloS One (2018) 13(9):e0202650. doi: 10.1371/journal.pone.0202650
11. Li C, Chen K, Liu X, Liu HT, Liang XM, Liang GL, et al. Analysis of Clinicopathological Characteristics and Prognosis of Young Patients With Hepatocellular Carcinoma After Hepatectomy. J Clin Transl Hepatol (2020) 8(3):285–91. doi: 10.14218/jcth.2020.00021
12. Berardi G, Morise Z, Sposito C, Igarashi K, Panetta V, Simonelli I, et al. Development of a Nomogram to Predict Outcome After Liver Resection for Hepatocellular Carcinoma in Child-Pugh B Cirrhosis. J Hepatol (2020) 72(1):75–84. doi: 10.1016/j.jhep.2019.08.032
13. Yang L, Wang Q, Cui T, Huang J, Shi N, Jin H. Reporting of Coronavirus Disease 2019 Prognostic Models: The Transparent Reporting of a Multivariable Prediction Model for Individual Prognosis or Diagnosis Statement. Ann Transl Med (2021) 9(5):421. doi: 10.21037/atm-20-6933
14. Weiser MR, Landmann RG, Kattan MW, Gonen M, Shia J, Chou J, et al. Individualized Prediction of Colon Cancer Recurrence Using a Nomogram. J Clin Oncol (2008) 26(3):380–5. doi: 10.1200/jco.2007.14.1291
15. Xu L, Peng ZW, Chen MS, Shi M, Zhang YJ, Guo RP, et al. Prognostic Nomogram for Patients With Unresectable Hepatocellular Carcinoma After Transcatheter Arterial Chemoembolization. J Hepatol (2015) 63(1):122–30. doi: 10.1016/j.jhep.2015.02.034
16. Huang YQ, Liang CH, He L, Tian J, Liang CS, Chen X, et al. Development and Validation of a Radiomics Nomogram for Preoperative Prediction of Lymph Node Metastasis in Colorectal Cancer. J Clin Oncol (2016) 34(18):2157–64. doi: 10.1200/jco.2015.65.9128
17. Kerr KF, Brown MD, Zhu K, Janes H. Assessing the Clinical Impact of Risk Prediction Models With Decision Curves: Guidance for Correct Interpretation and Appropriate Use. J Clin Oncol (2016) 34(21):2534–40. doi: 10.1200/jco.2015.65.5654
18. Lamain-de Ruiter M, Kwee A, Naaktgeboren CA, de Groot I, Evers IM, Groenendaal F, et al. External Validation of Prognostic Models to Predict Risk of Gestational Diabetes Mellitus in One Dutch Cohort: Prospective Multicentre Cohort Study. Bmj (2016) 354:i4338. doi: 10.1136/bmj.i4338
19. Rousson V, Zumbrunn T. Decision Curve Analysis Revisited: Overall Net Benefit, Relationships to ROC Curve Analysis, and Application to Case-Control Studies. BMC Med Inform Decis Mak (2011) 11:45. doi: 10.1186/1472-6947-11-45
20. Tseng YD, Krishnan MS, Sullivan AJ, Jones JA, Chow E, Balboni TA. How Radiation Oncologists Evaluate and Incorporate Life Expectancy Estimates Into the Treatment of Palliative Cancer Patients: A Survey-Based Study. Int J Radiat Oncol Biol Phys (2013) 87(3):471–8. doi: 10.1016/j.ijrobp.2013.06.2046
21. Lamont EB, Christakis NA. Prognostic Disclosure to Patients With Cancer Near the End of Life. Ann Intern Med (2001) 134(12):1096–105. doi: 10.7326/0003-4819-134-12-200106190-00009
22. Hagerty RG, Butow PN, Ellis PA, Lobb EA, Pendlebury S, Leighl N, et al. Cancer Patient Preferences for Communication of Prognosis in the Metastatic Setting. J Clin Oncol (2004) 22(9):1721–30. doi: 10.1200/jco.2004.04.095
23. Shen SL, Fu SJ, Chen B, Kuang M, Li SQ, Hua YP, et al. Preoperative Aspartate Aminotransferase to Platelet Ratio Is an Independent Prognostic Factor for Hepatitis B-Induced Hepatocellular Carcinoma After Hepatic Resection. Ann Surg Oncol (2014) 21(12):3802–9. doi: 10.1245/s10434-014-3771-x
24. Wang XP, Mao MJ, He ZL, Zhang L, Chi PD, Su JR, et al. A Retrospective Discussion of the Prognostic Value of Combining Prothrombin Time(PT) and Fibrinogen(Fbg) in Patients With Hepatocellular Carcinoma. J Cancer (2017) 8(11):2079–87. doi: 10.7150/jca.19181
25. Kato Y, Okamura Y, Sugiura T, Ito T, Yamamoto Y, Ashida R, et al. The Impact of Serosal Invasion on Prognosis After Curative Hepatectomy for Hepatocellular Carcinoma: Invasion to Adjacent Organs and Rupture of Tumor Were Crucial Tumor-Related Prognostic Factors Needed for Survival. Dig Surg (2018) 35(2):155–63. doi: 10.1159/000477270
26. Mähringer-Kunz A, Steinle V, Düber C, Weinmann A, Koch S, Schmidtmann I, et al. Extent of Portal Vein Tumour Thrombosis in Patients With Hepatocellular Carcinoma: The More, the Worse? Liver Int (2019) 39(2):324–31. doi: 10.1111/liv.13988
27. Mao M, Wang X, Song Y, Sheng H, Han R, Lin W, et al. Novel Prognostic Scores Based on Plasma Prothrombin Time and Fibrinogen Levels in Patients With AFP-Negative Hepatocellular Carcinoma. Cancer Control (2020) 27(1):1073274820915520. doi: 10.1177/1073274820915520
28. Çabuk F, Başsüllü N, Türkmen İ., Dayangaç M, Akyıldız M, Yüzer Y, et al. The Prognostic Relationship Between Histopathological and Immunohistochemical Features of Hepatocellular Carcinoma, Intrahepatic Cholangiocarcinoma and Mixed Type. Pol J Pathol (2020) 71(2):79–86. doi: 10.5114/pjp.2020.97015
Keywords: hepatocellular carcinoma, hepatectomy, nomogram, survival, prognosis
Citation: Ye D, Qu J, Wang J, Li G, Sun B and Xu Q (2021) A New Clinical Nomogram From the TCGA Database to Predict the Prognosis of Hepatocellular Carcinoma. Front. Oncol. 11:698980. doi: 10.3389/fonc.2021.698980
Received: 22 April 2021; Accepted: 20 August 2021;
Published: 06 September 2021.
Edited by:
Massimiliano Veroux, University of Catania, ItalyReviewed by:
Federico Ravaioli, University of Bologna, ItalyDuilio Pagano, Mediterranean Institute for Transplantation and Highly Specialized Therapies (ISMETT), Italy
Copyright © 2021 Ye, Qu, Wang, Li, Sun and Xu. This is an open-access article distributed under the terms of the Creative Commons Attribution License (CC BY). The use, distribution or reproduction in other forums is permitted, provided the original author(s) and the copyright owner(s) are credited and that the original publication in this journal is cited, in accordance with accepted academic practice. No use, distribution or reproduction is permitted which does not comply with these terms.
*Correspondence: Qingxiang Xu, xqx2016nj@sina.com