 Sara Rodríguez-Enríquez1*
 Diana Xochiquetzal Robledo-Cadena1
 Juan Carlos Gallardo-Pérez1
 Silvia Cecilia Pacheco-Velázquez1
 Citlali Vázquez1Emma Saavedra1Jorge Luis Vargas-Navarro1Betsy Alejandra Blanco-Carpintero1
 Álvaro Marín-Hernández1
 Ricardo Jasso-Chávez1Rusely Encalada1
 Luz Ruiz-Godoy2
 José Luis Aguilar-Ponce3
 Rafael Moreno-Sánchez1*
- 1Departamento de Bioquímica, Instituto Nacional de Cardiología, México, Mexico
- 2Banco de Tumores, Instituto Nacional de Cancerología, México, Mexico
- 3Departamento de Medicina Interna, Instituto Nacional de Cancerología, México, Mexico
Under dysbiosis, a gut metabolic disorder, short-chain carboxylic acids (SCCAs) are secreted to the lumen, affecting colorectal cancer (CRC) development. Butyrate and propionate act as CRC growth inhibitors, but they might also serve as carbon source. In turn, the roles of acetate as metabolic fuel and protein acetylation promoter have not been clearly elucidated. To assess whether acetate favors CRC growth through active mitochondrial catabolism, a systematic study evaluating acetate thiokinase (AcK), energy metabolism, cell proliferation, and invasiveness was performed in two CRC cell lines incubated with physiological SCCAs concentrations. In COLO 205, acetate (+glucose) increased the cell density (50%), mitochondrial protein content (3–10 times), 2-OGDH acetylation, and oxidative phosphorylation (OxPhos) flux (36%), whereas glycolysis remained unchanged vs. glucose-cultured cells; the acetate-induced OxPhos activation correlated with a high AcK activity, content, and acetylation (1.5–6-fold). In contrast, acetate showed no effect on HCT116 cell growth, OxPhos, AcK activity, protein content, and acetylation. However, a substantial increment in the HIF-1α content, HIF-1α-glycolytic protein targets (1–2.3 times), and glycolytic flux (64%) was observed. Butyrate and propionate decreased the growth of both CRC cells by impairing OxPhos flux through mitophagy and mitochondrial fragmentation activation. It is described, for the first time, the role of acetate as metabolic fuel for ATP supply in CRC COLO 205 cells to sustain proliferation, aside from its well-known role as protein epigenetic regulator. The level of AcK determined in COLO 205 cells was similar to that found in human CRC biopsies, showing its potential role as metabolic marker.
Introduction
It has been established that several bacteria found in the microbiome of colon cancer patients secrete bioactive metabolites (reactivated estrogens, short-chain carboxylic acids (SCCAs), amino acids, secondary bile acids) that may modulate colon cancer growth (1–4). In particular, SCCAs (acetate, propionate, butyrate) have been detected at high levels (50–346 µmol/g wet tissue) in both plasma and feces from CRC patients (5, 6), compared to samples from healthy persons.
The high SCCAs pool might serve primarily as metabolic fuel to be oxidized by CRC mitochondria to support CRC cell proliferation. However, studies analyzing the role of SCCAs in the energy metabolism of cancer cells are scarce, which may be related to the wide-spread belief that cancer cells have an impaired mitochondrial metabolism (7, 8).
It is well documented that butyrate and propionate (0.5–10 mM), but not acetate, strongly inhibit cancer cell growth in human colon (HT-29), prostate (PC3 and DU-145), lung (H1299 and H1703), and breast (MCF-7) adenocarcinomas (9–12). Cancer cell growth impairment has been associated to the strong inhibition of histone deacetylase activity induced by butyrate or propionate (13–15). However, the accelerated colon cancer cell growth is not completely subdued when histone deacetylase activity is suppressed by propionate or butyrate, indicating that cell growth also depends on other processes/factors not sensitive to propionate/butyrate.
On the other hand, acetate could be an important fuel for colon cancer mitochondria even in the presence of glucose or fatty acids. Indeed, it has been demonstrated that acetate oxidation may promote the Crabtree effect (16) by stimulating de novo lipid biosynthesis in breast cancer MDA-MB-468 cells (17), which may not favor OxPhos [reviewed in (18)]. In addition to its role as carbon source, acetate may also promote acetylation, a reversible post-translational covalent modification affecting histone and non-histone proteins. Key regulatory enzymes include histone deacetylases (HDACs) and histone acetyltransferases (HATs). In this regard, it has been documented that histone acetylation induced by acetate promotes lipid synthesis, cell migration, and cell adherence to extracellular matrix in cancer cells (19, 20). On the other hand, HATs have been implicated in the regulation of several proteins associated to signaling and metabolic pathways in non-cancer, cancer, and cancer stem cells (19, 21).
Therefore, the present study analyzes the effect of different SCCAs on cell growth, mitochondrial function, acetylation profile of energy metabolism proteins, and cell invasiveness, an ATP-dependent process. To this end, an integral analysis of the mitochondrial SCCAs oxidation was carried out in two widely used human CRC lines, COLO 205 and HCT 116 cells, by assessing the activity of acetate thiokinase (AcK), the initial step in the acetate oxidation pathway, the level of several OxPhos enzymes and their acetylation profile, and the OxPhos flux. To extend our findings to a more physiological setting with potential clinical relevance, analysis of AcK protein content and acetylation was also performed in human CRC biopsies. Our results clearly indicate that acetate (but not butyrate or propionate) at physiological doses was actively oxidized by COLO 205 cells, through a highly over-expressed and very active AcK, to sustain cancer growth. In contrast, HCT 116 cells showed a low AcK activity and decreased OxPhos capacity, which was compensated by glycolysis activation. In both CRC cell lines, butyrate and propionate decreased mitochondrial function, leading to ROS accumulation and cellular death by autophagy and mitochondrial fragmentation.
Material and Methods
CRC Cell Growth
Human metastatic colorectal COLO 205 and HCT 116 cells and triple negative breast cancer MDA-MB-231 cells were grown in Dulbecco’s Modified Eagle Medium (DMEM) supplemented with 10% fetal bovine serum (GIBCO; Rockville, MD, USA) plus 10,000 U penicillin/streptomycin (Sigma; Steinheim, Germany) and incubated under 5% CO2, 95% air at 37°C until 80–90% confluence. COLO 205 and HCT 116 cell genotyping analyses, performed by the National Institute of Genomic Medicine (INMEGEN, México), revealed that they shared 7 out of 15 and 16 out of 18 alleles, respectively, reported by the ATCC for their authentication. For cellular growth in the presence of the different SCCAs, COLO 205 and HCT 116 cells at 10,000 cells/0.1 ml were cultured in 96 multi-well plates in DMEM medium plus 5 mM glucose for 6 days. Acetate, propionate, or butyrate was added at the beginning of the cultivation (day 0) at 5 mM (acetate) or 0.1 mM (propionate or butyrate) final concentration. Acetate was also added to the culture medium in combination with butyrate at the doses previously indicated.
Human CRC Biopsies
As a merely exploratory translational study in human biopsies, the number of samples used was small, as has been published for other similar studies (22–24). Five colorectal carcinoma samples were collected at the Instituto Nacional de Cancerología, México, as described before (24), following the handling protocols approved by the Committees of Ethics and Research of Instituto Nacional de Cancerología, México (INCAN) (http://incan-mexico.org/incan//pub/investigacion/bioetica/Anexo7.pdf), and supported by patients’ informed consents according to the Declaration of Helsinki. The colorectal tissue from at least five hepatoma AS-30D-containing Wistar rats was used as positive control, whereas colorectal samples from non-cancer Wistar rats were used as negative control. All human biopsy samples and rat tissues were stored in liquid nitrogen until their use as previously described (24).
Western Blot Assays
Cells (4 × 10⁶ cells/ml) were cultured in 60 × 15 cm Petri culture dishes. After each SCCA treatment, cells were lysed in RIPA (50 mM Tris pH 7.4, 1% Nonidet-P40, 0.25% sodium deoxycholate, 150 mM NaCl, 1 mM EDTA, 1 mM PMSF, 1 mM sodium fluoride, and 1 tablet of protease inhibitors cocktail) buffer and collected. Protein preparations (50 μg) were separated by SDS‐PAGE and transferred to polyvinylidene fluoride (PVDF) membranes (BioRad; Hercules, CA, USA). Western blot analysis was performed by immunoblotting with anti-HIF1α, -GLUT-1, -GLUT-3, -HKI, -HKII, -HPI, -2-OGDH, -ATPS, -ND1, -ANT, -P-AMPK, -Beclin, -DRAM, -LAMP1, -PGC-1α, -PINK-1, -PARK-1, -FIS-1, -MFN-2, and -α-tubulin (1:1,000) or anti-AcK, -K-RAS, -SNAIL, -E-cadherin, -vimentin, -fibronectin (1:500) (Abcam; Cambridge, MA, USA) antibodies for total extracts. The hybridization bands were revealed with the corresponding secondary antibodies conjugated with horseradish peroxidase (Santa Cruz; CA, USA) and the ECL-plus detection system (Amersham; Buckinghamshire, UK). Percentage of each enzyme represented the mean ± S.D. of at least three independent experiments.
Human biopsy samples were resuspended and homogenized with a Teflon-pestle in 25 mM Tris–HCl buffer, 1 mM PMSF, 1 mM EDTA, and 5 mM DTT and centrifuged at 10,000 rpm for 30 min at 4°C (24). Protein samples (50 μg) were resuspended in loading buffer with 10% glycerol, 2% SDS, and 5% β-mercaptoethanol and subsequently separated by SDS-PAGE in 10 or 12.5% polyacrylamide gels. Afterwards, proteins were blotted onto PVDF membranes and incubated overnight with the following antibodies: anti-AcK, -K-RAS, and -α-tubulin (Santa Cruz Biotechnology; Santa Cruz, CA, USA) at 1:1,000 dilution. Bands of hybridization were detected with the corresponding secondary antibodies and the horseradish peroxidase reaction as previously described (25). Densitometry analysis was carried out using the Scion Image software (Scion; Walkersville, MD, USA). Normalization of all samples was performed against its respective loading control (α-tubulin), which was considered as 100% (24).
Immunoprecipitation Assays
To assess the AcK, GLUT-1, GLUT-3, HKI, HKII, HPI, ND1, 2-OGDH, ANT, and ATPS, acetylation status, all these proteins were immunoprecipitated with their respective specific antibodies or with IgG1 (1 μg) for 1 h plus protein A (Sigma-Aldrich, St. Louis, MO, USA) at 4°C. Acetylation status was detected in the immunoprecipitated proteins with anti-acetyl-Lysine antibodies (1:1,000 dilution; Abcam) following manufacturer instructions (26).
Acetate Thiokinase (AcK) Activity
HCT 116 and COLO 205 cytosol-enriched fractions were prepared from cells incubated in the absence or presence of the different SCCAs for 5 days. The cells were trypsinized, collected in Tris–HCl buffer (25 mM Tris–HCl, 1 mM EDTA. 5 mM DTT, 1 mM PMSF), and disrupted by freezing-thawing thrice. The homogenate was centrifuged at 3,500 rpm for 5 min at 4°C (27). AcK activity (EC 6.2.1.1; acetate-CoA ligase; acetate + CoA + ATP → acetyl-CoA + AMP + PPi) was determined at 37°C using a coupled enzymatic assay with pyruvate phosphate dikinase (PPDK; PEP + AMP + PPi → Pyr + ATP) from E. histolytica (28) and commercial lactate dehydrogenase (LDH). The incubation buffer contained 25 mM MOPS adjusted to pH 7.2. The reaction contained 10 mM acetate, 0.2 mM NADH, 10 mM CoA, 2 mM ATP, 10 mM MgCl2, 2 mM PEP, ~1U PPDK, 1.1 U LDH (Sigma, St. Louis, MO, USA) and 200–600 μg of cell protein. The addition of 0.02% Triton X-100 did not increase AcK activity, but it rather slightly inhibited it. NADH oxidation was monitored spectrophotometrically at 340 nm after specifically starting the reaction by adding acetate. Controls were done to ensure that the reaction rate was (i) under conditions of initial velocity (saturation of substrates, linear dependence on cell protein concentration, excess of coupling enzymes); and (ii) specific (reaction was started by adding one specific substrate-acetate; no activity was attained in the absence of any of the specific substrates; spurious activity was always subtracted); formate, propionate, or butyrate at 10 mM was unable to trigger the AcK reaction, indicating high specificity for acetate. The stock solutions of all substrates were always calibrated before use (28).
Energy Metabolism Pathway Fluxes
For glycolysis flux, intact CRC cells (2 mg protein/ml) were incubated in 1.5 ml Krebs-Ringer medium as previously described (29). Briefly, aerobic glycolysis was carried out in an orbital shaking water bath with cells incubated in plastic flasks at 37°C. The reaction mixture contained cancer cells incubated in Krebs Ringer medium in a final volume of 3 ml. The reaction was started by the addition of exogenous glucose (5 mM). At time 0 and 10 min, the reaction was stopped by mixing a cell aliquot with 3% (w/v) cold perchloric acid and centrifuged. In parallel sets of experiments, cells were also incubated for 0 and 10 min with 2-deoxyglucose (2-DG, 10 mM) to correct for lactate production by glutaminolysis. Residual lactate production (2-DG insensitive lactate formation) was totally blocked by 5 µM rotenone (inhibitor of respiratory chain site 1).
The supernatants were neutralized with 1 N KOH/100 mM Tris. Lactate was enzymatically determined by using LDH (Roche, Mannheim, Germany) following the NADH formation at 340 nm (30). The contribution of glycolysis to the cellular ATP supply was determined from lactate production, assuming a stoichiometry of 1 mol of ATP produced per 1 mol of lactate produced.
For OxPhos flux, cancer cells (4 mg protein/ml) were incubated at 37°C in 1.9 ml of air-saturated Krebs-Ringer medium plus 5 mM glucose, and the rate of 5 µM oligomycin sensitive-O2 consumption was determined by using a high-resolution Oxygraph-2k (O2k, OROBOROS Instruments, Innsbruck, Austria) (31). The contribution of OxPhos to the cellular ATP supply was determined from the oligomycin-sensitive respiration rate multiplied by the ATP/O ratio that corresponds to 2.5 in cancer mitochondria respiring on NADH-linked substrates (32). This ratio value was used because it is indeed similar to that determined by other researchers using non-cancer mitochondria (33, 34) and represents the amount of ATP synthesized (by the ATP synthase) per oxygen consumed (by the cytochrome c oxidase in the respiratory chain); the units of the ATP/O ratio would be nmol ATP/ng atom oxygen.
Isolation of AS-30D Hepatoma and Liver Mitochondria
Mitochondria were isolated from AS-30D hepatoma cells (35) or rat liver (36) using the standard sequential centrifugation method previously described. The mitochondrial protein content was determined by the Biuret assay using bovine serum albumin as standard. The mitochondrial and OxPhos functionality was evaluated in isolated mitochondria by measuring the rates of respiration in pseudo-state 4 (i.e., oxygen consumption by mitochondria incubated with Pi and oxidizable substrate before adding ADP), state 3 (i.e., oxygen consumption by mitochondria incubated with Pi and oxidizable substrate after adding exogenous ADP), and state 4 (i.e., oxygen consumption by mitochondria incubated with Pi and oxidizable substrate with ADP exhausted); and the coupling grade (i.e., respiratory control, RC = rate of state 3 respiration/rate of state 4 respiration) of both AS-30D and liver mitochondria. A high quality of mitochondrial preparations is revealed by RC values equal or greater than 4 (37–39).
Respiration of isolated mitochondria (1 mg protein/ml) was determined by polarography using a Clark-type O2 electrode in KME (120 mM KCl, 20 mM Mops, 1 mM EGTA) buffer pH 7.2 plus 2 mM KH2PO4 and the indicated oxidizable substrates.
For state 3 respiration 300–600 nmol ADP were added after 10–15 s incubation. Mitochondrial preparations with RC ratios greater than 4 in the presence of glutamate/malate as oxidizable substrate were commonly used for experimentation.
The transmembrane electrical potential (ΔΨm) of isolated mitochondria (0.5 mg/ml) was assayed in state 3 and pseudo-state 4 conditions with rhodamine 123 (50 nM). The changes in ΔΨm were monitored with a Shimadzu spectrofluorophotometer (RF-5301PC; Tokyo, Japan) at λexcitation = 488 nm and λemission = 575 nm. The maximal ΔΨm value was determined by measuring the change in the fluorescence signal before and after dissipation with the protonophore CCCP (1 µM) (40).
The content of mitochondrial citrate was determined as follows. Mitochondria (10 mg protein/ml) were incubated for 10 min in KME buffer + 2 mM K-phosphate at 37°C under smooth orbital shaking with glutamate (10 mM)/malate (5 mM) or acetate (5 mM)/malate (5 mM). After 10 min, 5 mM ADP was added; 2 min later, aliquots were withdrawn, mixed with ice-cold 3% (V/V) perchloric acid in 1 mM EDTA, and kept on ice. The aliquots were neutralized with 3M KOH/0.1 M Tris and stored at −72°C until use. Citrate was determined by a standard enzymatic assay (30).
Mitophagy Assay
COLO 205 and HCT 116 cells (3 × 10⁴/ml) were cultured in 35-mm glass-bottomed Petri dishes (MatTek; Ashland, MA, USA) in the presence of glucose and the different SCCAs. To reveal mitochondrial subcellular localization, cells were washed and pre-incubated with MitoTracker Green (MTG, 0.5 µM). To reveal lysosomes, autophagosomes, and autolysosomes, cells were pre-incubated with LysoTracker Red (LTR, 0.5 µM). Cells were loaded with both dyes for 20 min at 30°C in DMEM. Time series of confocal images were collected every 1 to 2 min with a Zeiss LSM 510 meta inverted laser scanning confocal microscope (Carl Zeiss; Oberkochen, Germany) using 63X oil 1.4 N.A. plan apochromat objective lens. LTR λexcitation of 543 nm was provided by a helium/neon laser, and λemission of 560 nm was measured. MTG λexcitation of 488 nm was provided by an argon laser, and λemission of 500–550 nm was followed. Laser excitation energy was attenuated 1,000-fold to minimize photobleaching and photodamage (41).
ROS Determination
Cells (1 × 10⁴ cells/ml) were cultured for 5 days in 96-well plates in DMEM in the presence of glucose and different SCCAs. After washing, cells were incubated with fresh free-serum DMEM (with no glucose or SCCAs), 25 μM dihydroethidium (DHE) was added, and ROS production was monitored every 30 s for 1 h with a Varioskan microplate reader (Thermo Fisher Scientific; Waltham, MA, USA) using λemission of 605 nm and λexcitation of 518 nm.
Invasiveness Assays
COLO 205 or HCT 116 cells were incubated in free-serum DMEM with 5 mM glucose and different SCCAs. After 24 h, the cells were washed and resuspended again in fresh free-serum DMEM containing the respective SCCAs and placed in the upper compartment of 96-multiwell Boyden chambers (Merck Millipore; MA, USA) at a final concentration of 5 × 10⁴ cells/well for another 24 h at 37°C. The Boyden chamber lower compartment was filled with free-serum DMEM. The migrating cells, collected in the lower compartment, were identified with 60 nM calcein-AM after 60 min incubation for dye loading. Calcein fluorescence was detected at λexcitation of 485 nm and λemission of 520 nm by using a Varioskan microplate reader.
Data Analysis
Experiments were performed with at least three independent samples. Data shown represent mean ± standard deviation (S.D.). For the detection of significant differences among several experimental groups, one-way ANOVA/post hoc Scheffé analysis was used (42).
Results
Effect of SCCAs on COLO 205 and HCT 116 Cellular Growth
Exposure of CRC cells to physiological concentrations of glucose (5 mM) + acetate (5 mM) significantly increased COLO 205 cell density by around 50% after 4–6 days of culture vs. control cells cultured with only glucose (Figure 1A); acetate also decreased the duplication time by 30% (from 59 ± 4 to 41 ± 5 h). In contrast, HCT 116 cell growth was unaffected by acetate + glucose (Figure 1B). Propionate or butyrate at 5 mM final concentration (+ 5 mM glucose) promoted a high cellular death (>95%) within the first days of cultivation (data not shown). In consequence, cells were exposed to much lower (0.1 mM) propionate or butyrate concentrations, at which both COLO 205 and HCT 116 cell growth was arrested, but viability was higher than 70% (Figure 1).
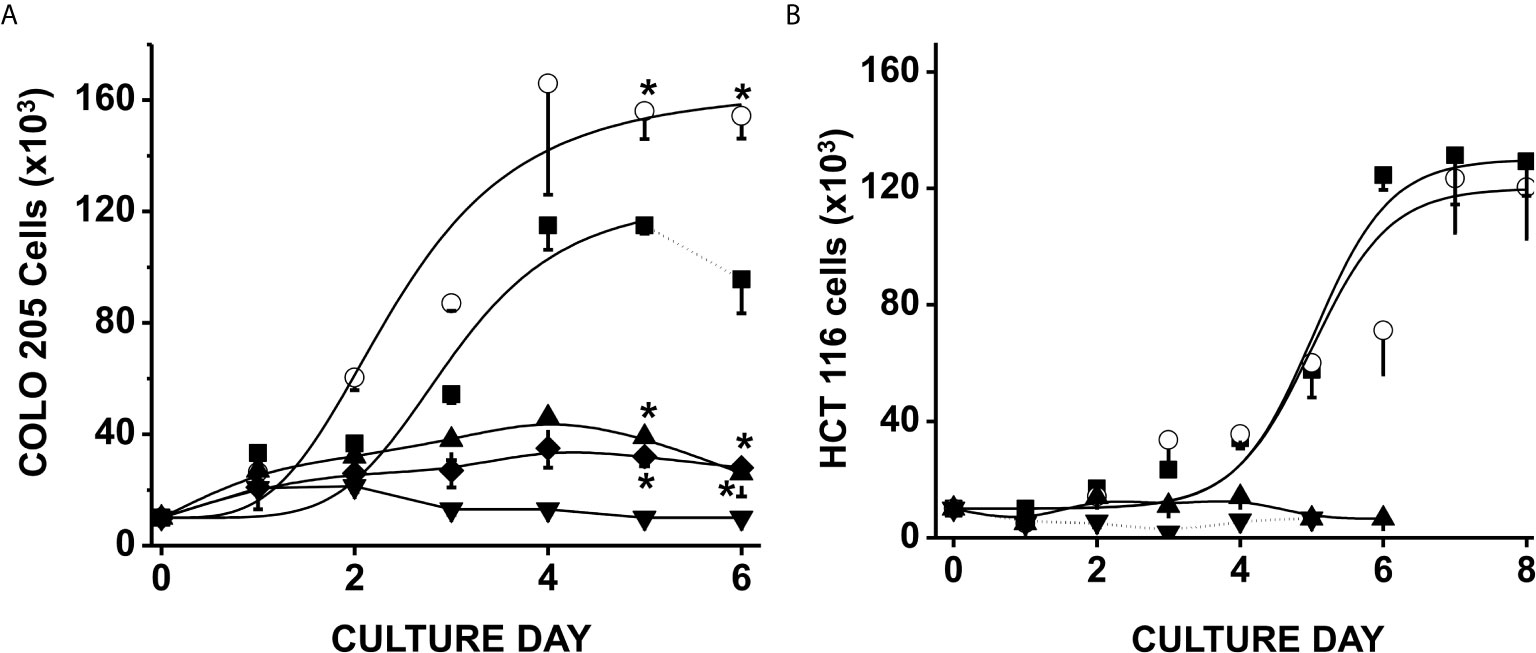
Figure 1 Effect of SCCAs on the growth of colorectal cancer cells. COLO 205 cells (A) and HCT 116 cells (B) were grown in the presence of 5 mM glucose alone (▪), or + 5 mM acetate (○), or 0.1 mM butyrate (▼) or 0.1 mM propionate (▲). Additionally, COLO 205 cells were grown in the presence of a mixture of 5 mM glucose + 5 mM acetate + 0.1 mM butyrate (♦). Solid lines represent the fitting to the experimental points by the exponential growth equation, which was made by using the Origin 8 software (Northampton, MA, USA). Dotted line at the end of 5 mM glucose condition indicates cellular death. Data shown represent the mean ± S.D. @ of at least three independent assays. *P < 0.05 vs. glucose alone.
In order to assess a more physiological condition, a mixture of 5 mM acetate, 0.1 mM butyrate, and 5 mM glucose was added to COLO 205 cells, and its effect on cell growth was determined (Figure 1A). This SCCAs combination restrained CRC cell growth as it has been documented for RKO colorectal cells and THP-1 monocytic cells (43, 44), but cellular viability was not affected (>95%), indicating that acetate was not able to overcome butyrate-induced proliferation arrest. It is also worth noting that the CRC proliferation was abolished when the cells were cultured in the presence of any SCCA but with no glucose (data not shown), indicating the role of glucose as a carbon source to maintain CRC proliferation.
Effect of SCCAs on CRC Cellular Energy Metabolism
Exposure of COLO 205 or HCT 116 cells to acetate, propionate, or butyrate in the presence of glucose for 5 days increased the levels of HIF-1α by 1.4 to 15.8 times vs. control cells (Supplementary Figure 1). In contrast, a significant decrease in the level of the glycolytic regulator P-AMPK was detected in (a) both cells cultured with acetate (24–40%); (b) both cells cultured with propionate (65–>90%); and (c) HCT 116 cells cultured with butyrate (60%). No changes in P-AMPK content were observed in COLO 205 cells exposed to butyrate (Supplementary Figure 1A). The increment in HIF-1α level positively correlated with a large increase in several flux-controlling glycolytic (GLUT-1, GLUT-3, and HKI) proteins (45) in both CRC cells exposed to the different SCCAs vs. cells exposed to only glucose. HKII remained unchanged in both colon cancer cells (Supplementary Figures 1A, B), except for a significant increase (3.9 times) induced by butyrate in COLO 205 cells (Supplementary Figure 1A).
In parallel, levels of some OxPhos (ND1 and ANT) proteins also augmented by 2.6 to 9.9 times in both cell lines under acetate, propionate, or butyrate treatment. ATP synthase (ATPS) also increased in COLO 205 cells by 3.1–6.9 times (Supplementary Figure 1A), whereas it remained unchanged in HCT 116 cells (Supplementary Figure 1B).
The higher OxPhos protein contents found in COLO 205 cells exposed to acetate correlated with a significant 36% increment in the OxPhos flux (i.e., the oligomycin-sensitive oxygen consumption) (Figure 2A). In contrast, propionate and butyrate induced a strong decrease in COLO 205 OxPhos by 66–72%, despite the high ND1, ANT, and ATPS levels detected. In COLO 205 cells, acetate, propionate, or butyrate did not significantly modify the glycolysis flux (i.e., the total produced lactate sensitive to the glycolytic inhibitor 2-deoxyglucose) (Figure 2A). Nevertheless, OxPhos was the main ATP supplier (79–96%) in COLO 205 cells under all conditions. In contrast, HCT 116 cells showed impaired OxPhos in the presence of glucose alone or with the supplementation of SCCAs (Figure 2A), and it was markedly lower (<95%) than that of COLO 205 cells. To compensate for OxPhos impairment, HCT 116 cells exhibited an enhanced glycolysis rate, which provided much of the ATP (73–91%) required for cellular processes. Because of the scarce amount of biomass generated by COLO 205 and HCT116 cells cultured in the presence of propionate+glucose, butyrate+glucose, or acetate+butyrate+glucose, OxPhos was not determined in these cells.
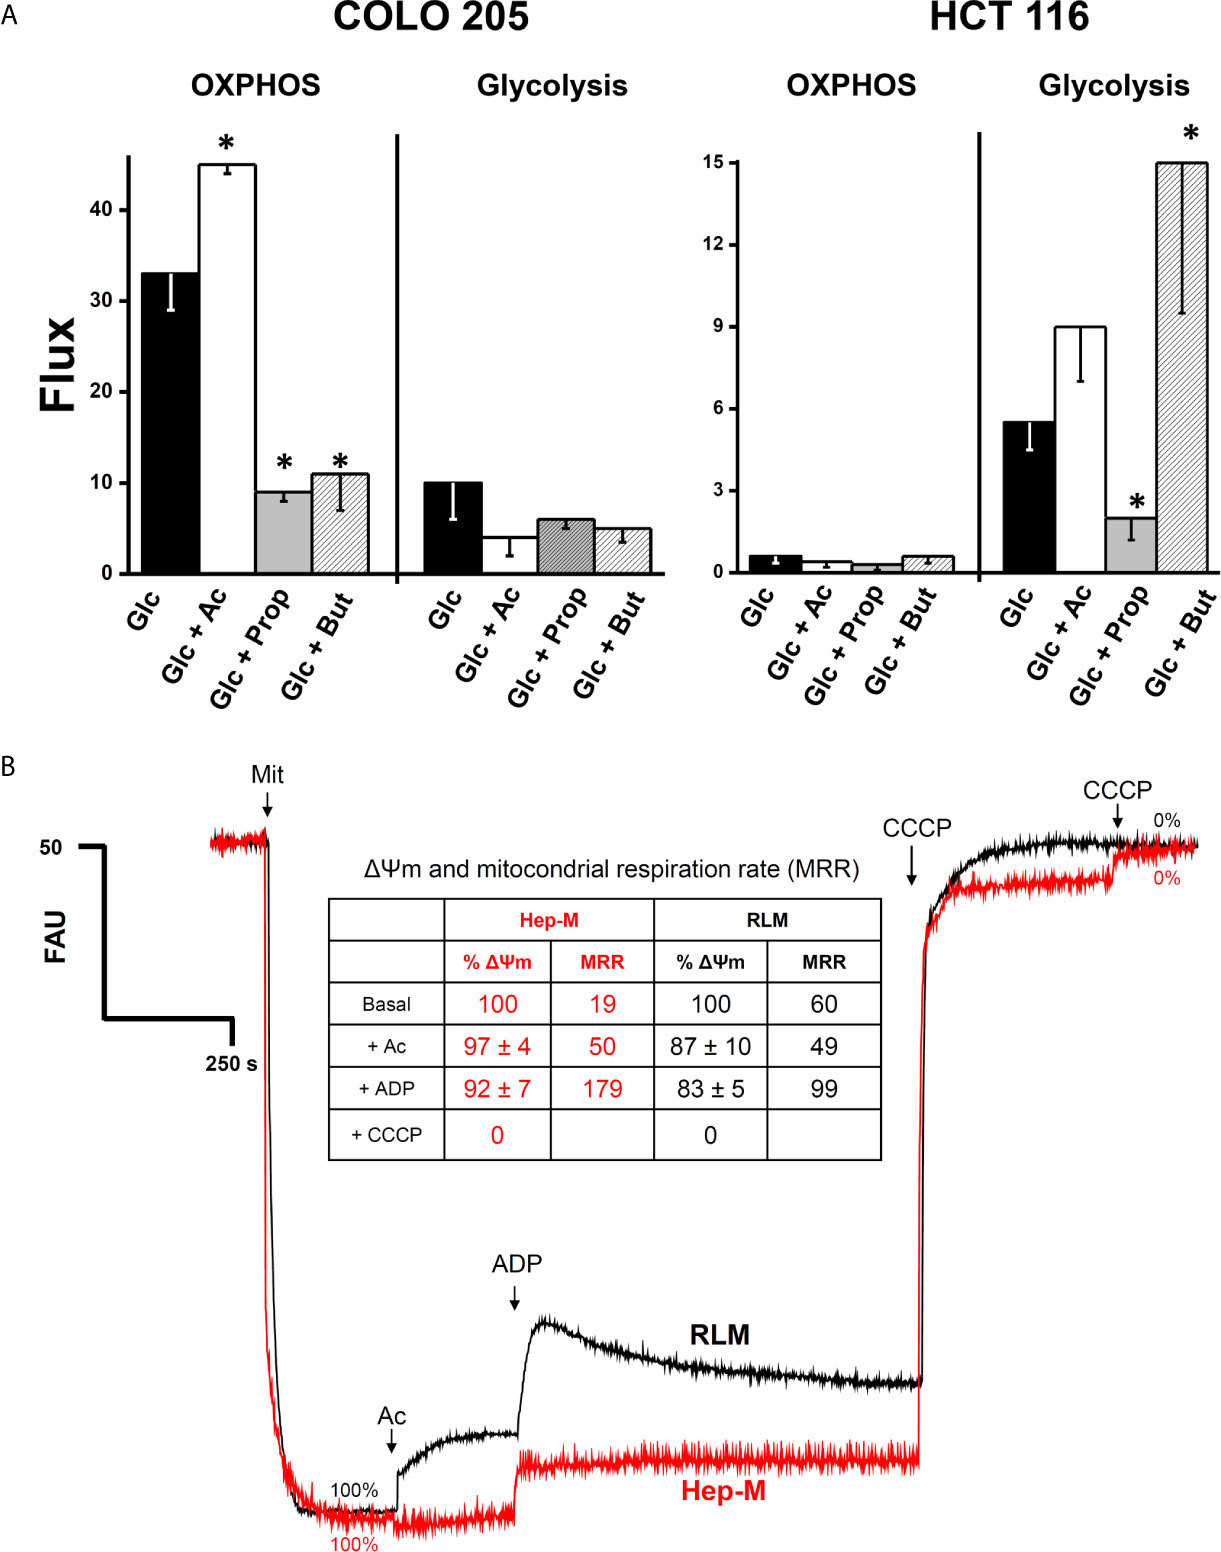
Figure 2 (A) Effect of SCCAs on the energy metabolism fluxes in COLO 205 and HCT 116 cells. Cells were cultured with the indicated carbon sources (5 mM glucose-Glc, 5 mM acetate-Ac, 0.1 mM propionate-Prop, 0.1 mM butyrate-But) for 5 days, harvested, washed, and used for energy fluxes determination. For OxPhos, flux represents the oligomycin-sensitive oxygen consumption expressed in ngAtO (nanogram atoms oxygen)/min/mg protein. For glycolysis, flux represents the 2DG-sensitive lactate production expressed in nmol of lactate produced/min/mg protein. The data shown are the mean ± S.D. @ of at least three different preparations. *P < 0.05 vs. Glc. (B) Effect of acetate on mitochondrial transmembrane potential (ΔΨm) in AS-30D hepatoma (Hep-M) and rat liver (RLM). Mitochondria (0.5 mg/ml) were incubated in KME buffer with malate (0.1 mM for Hep-M or (5 mM for RLM), 2 mM Pi, and 50 nM rhodamine 123. The experiment was initiated by the addition of mitochondria to the reaction mix. At the indicated times, acetate (Ac, 5 mM), ADP (300–600 nmol), and CCCP (1 µM final concentration) were added. Data in figure and inserted table represent the ΔΨm value in percentage calculated from Supplementary Table 2. Values shown between parentheses in bold letters, inside the inserted table, represent the mitochondrial respiratory rates expressed in ng atoms oxygen/min/mg protein taken from Table 1 (Hep-M) and Supplementary Table 1 (RLM).
In order to examine whether exogenous acetate promotes acetylation of energy metabolism proteins, which may impact the OxPhos functionality, the degree of (Lys) acetylation of several OxPhos as well as glycolytic proteins was determined in COLO 205 (Supplementary Figure 2A) and HCT 116 (Supplementary Figure 2B) cells. For COLO 205 cells cultured with acetate+glucose, significant higher acetylation of all proteins examined was attained (Supplementary Figure 2A), particularly of the mitochondrial 2-OGDH and glycolytic GLUT-1, but with the exception of GLUT-3, which showed less acetylation than in cells exposed to only glucose. For HCT 116 cells, acetate induced higher acetylation on ND1 and HK (I and II) isoforms, whereas low acetylation was observed in 2-OGDH, ATPS, and HPI (Supplementary Figure 2B).
Effect of SCCAs on OxPhos, Mitochondrial Membrane Potential (Δψm), and Intramitochondrial Citrate Content in Isolated Hepatoma AS-30D and Liver Mitochondria
It is certainly more rigorous to compare behavior and responses of CRC cells with their own isolated mitochondria. However, to obtain an enriched mitochondrial fraction of high quality and purity requires a large amount of cultured cancer cells. To overcome this situation, the rat AS-30D hepatoma model was used to grow a large cellular mass for production of high-quality mitochondrial preparations (23, 46). Therefore, in order to elucidate whether acetate, propionate, or butyrate may directly drive OxPhos (i.e., mitochondrial ATP synthesis), by serving as oxidizable substrates, and sustain other energy-dependent mitochondrial functions, we determined respiration rates (Table 1), Δψm (Figure 2B and Supplementary Table 2) and intramitochondrial citrate content (Supplementary Table 3) in mitochondria isolated from rat AS-30D hepatoma (Hep-M).

Table 1 SCCAs oxidation in mitochondria isolated from AS-30D hepatoma (Hep-M) cells.
For comparative purposes and as a control, bioenergetic parameters were also evaluated in isolated mitochondria from rat liver (RLM), which is the tissue of origin of AS-30D hepatoma (Supplementary Table 1 and Figure 2B). Because malate (≥0.5 mM) is rapidly oxidized by an active tumor mitochondrial matrix NADP+-dependent malic enzyme (23, 47), which is negligible in rat liver mitochondria (RLM), Hep-M was incubated with a lower malate concentration (0.1 mM). The rate of ADP-stimulated (state 3) respiration (i.e., oxygen consumption associated to OxPhos) and net state 3 respiration (state 3 respiration minus pseudo-state 4 respiration; as an index of OxPhos rate) in Hep-M with 0.1 mM malate was not stimulated by ADP (Table 1). Similarly, in the absence of 0.1 mM malate but in the presence of other exogenous NAD+-dependent substrates, ADP was unable to stimulate state 3 respiration rates (data not shown).
State 3 respiration in Hep-M incubated with acetate/malate was lower (2 times) than the net state 3 values obtained with pyruvate, the substrate derived from glycolytic glucose breakdown, suggesting that PDH is more efficient than AcK to generate mitochondrial acetyl CoA to drive ATP synthesis. However, other well-oxidized tumor mitochondrial substrates such as glutamate/malate maintained similar state 3 rates to those attained with acetate/malate (Table 1) (23, 48).
Propionate/malate or butyrate/malate caused either an apparent uncoupling or stimulated ATP hydrolysis, because state 4 respiration was enhanced and/or state 3 respiration remained elevated, unable to exhaust added ADP, resulting in a low respiratory control (Table 1). None of the substrates assayed affected the basal rate of respiration (i.e., pseudo-state 4 respiration).
In contrast to what was observed in Hep-M, ADP was unable to stimulate acetate-driven state 3 respiration rates in RLM (Supplementary Table 1) as has been reported (49). As expected, pyruvate/malate and glutamate/malate were oxidized at high rate by RLM (Supplementary Table 1). Propionate or butyrate inhibited state 3 respiration in RLM, whereas state 4 reached similar values as those with acetate/malate.
Acetate/malate oxidation in Hep-M and RLM was also monitored, measuring the Δψm under both state 3 (ADP-stimulated) and pseudo-state 4 (no ADP added) conditions (Figure 2B and Supplementary Table 2), as well as by assessing the content of intramitochondrial citrate (Supplementary Table 3). In Hep-M, acetate was able to generate and sustain a high Δψm, correlating with the stimulated net state 3 respiration induced by acetate (Figure 2B). In contrast, acetate addition induced in RLM a lower Δψm (Figure 2B), i.e., a slight uncoupling effect, which was not observed in Hep-M, and lower net state 3 respiration. Similar Δψm values were found in Hep-M and RLM in both states 3 and 4 respirations supported by pyruvate, glutamate, or butyrate. Acetate/malate oxidation increased the content of citrate by 38% in Hep-M, indicating that acetate is actively oxidized as occurs in RLM to stimulate the Krebs cycle for NADH production (Supplementary Table 3).
Acetate Thiokinase (AcK) Content, Acetylation Profile and Activity in CRC Cells and Human Colon Carcinoma Biopsies
In order to better understand the relationship between acetate effects and its oxidation, the protein levels, acetylation degree, and activity of acetate thiokinase (AcK) were determined in both CRC cells. The AcK protein level (six times; Figure 3A), the degree of (Lys) acetylation (50%, Supplementary Figure 3A), and activity (3.2 times; Table 2) were significantly higher in COLO 205 cells exposed to acetate (+ glucose) vs. cells exposed to glucose alone. The slightly higher Ack (Lys) acetylation in COLO 205 cells exposed to acetate+glucose (Supplementary Figure 3A) correlated with an increase in enzyme activity, suggesting that this covalent modification is required for AcK activation. Although the AcK protein level was also higher in COLO 205 cells cultured with propionate or butyrate (2.4–2.8 times), its activity severely decreased by 87% vs. glucose-cultured cells, which correlated with a lower degree of (Lys) acetylation (data not shown). For HCT 116 cells cultured with acetate (+glucose), a significant increment in the AcK content was also observed; however, activity remained unchanged vs. glucose-cultured cells, correlating again with a high degree of AcK acetylation (Supplementary Figure 3A). Similarly, no correlation between AcK content and activity was found in HCT 116 cells exposed to butyrate or propionate. Propionate or butyrate significantly decreased the AcK activity by 87%. Although its content increased by 1.7 and 3.5 times, respectively (Figure 3A and Table 2), the AcK acetylation was significantly diminished (data not shown).
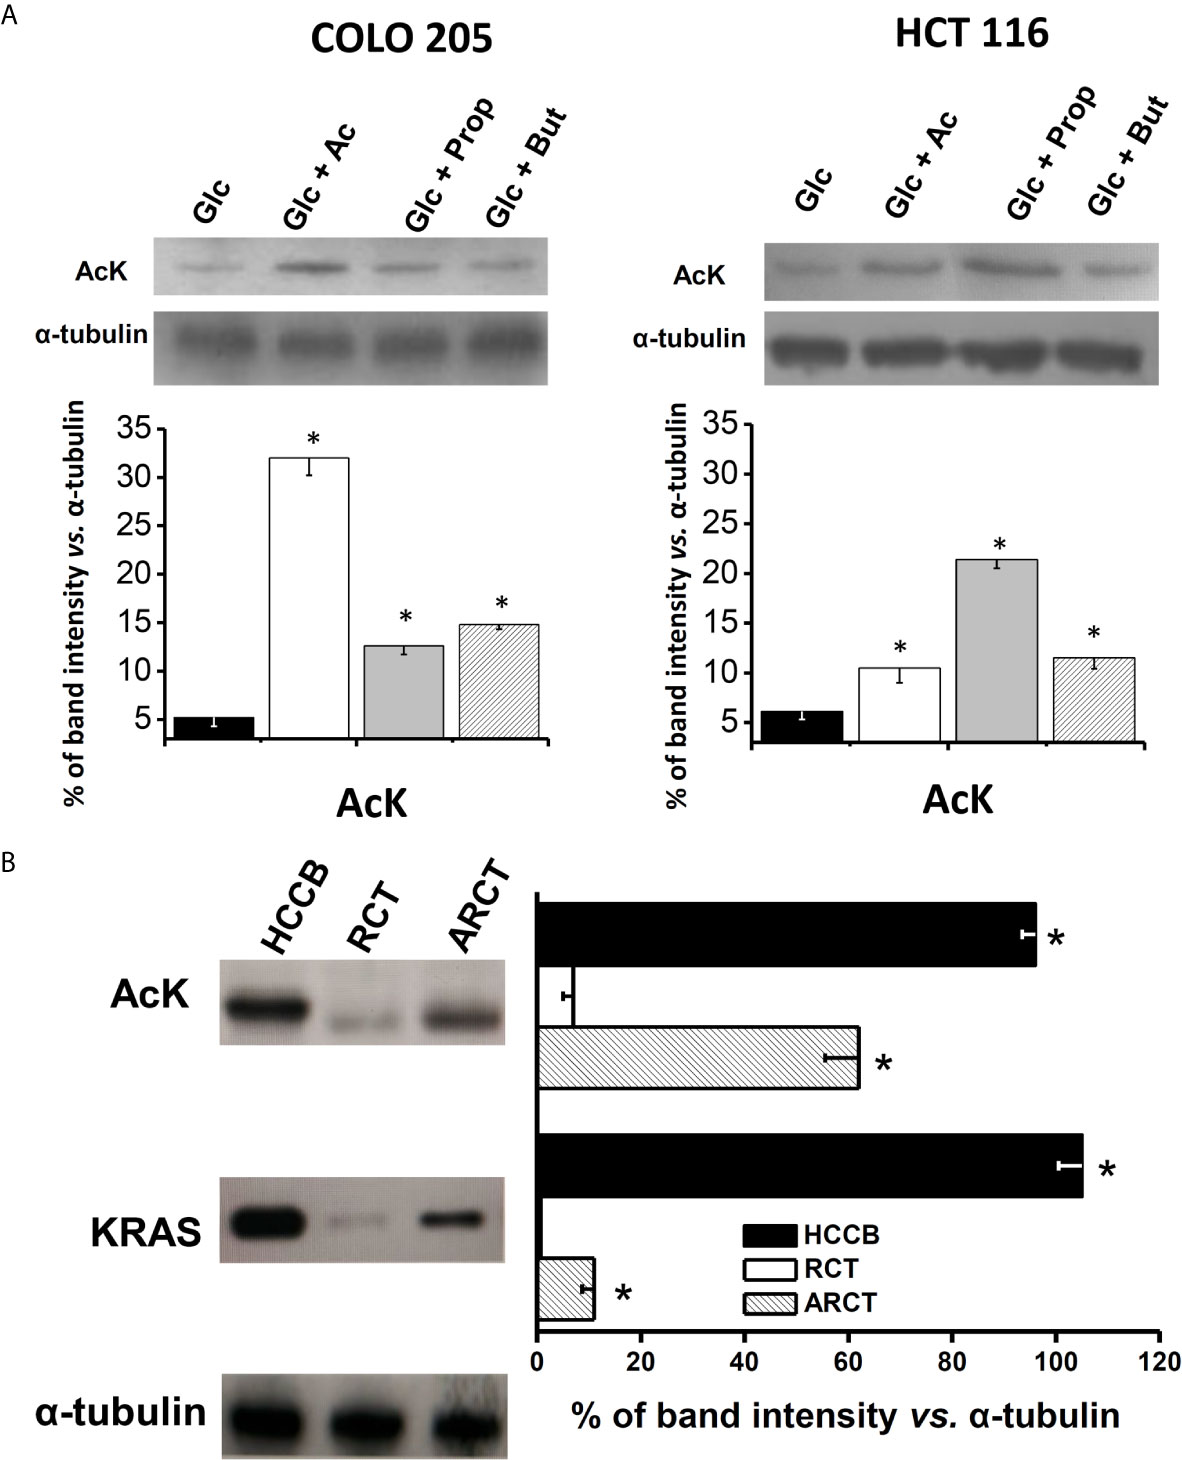
Figure 3 AcK protein content in (A) human colorectal cancer cells and (B) human cancer biopsy. The data shown represent the mean ± S.D. @ of at least three different preparations. *P < 0.01 vs. Glc for (A); * P < 0.01 vs. rat colon tissue (RCT). HCCB, human colon cancer biopsy; ARCT, ascites rat colon tissue.
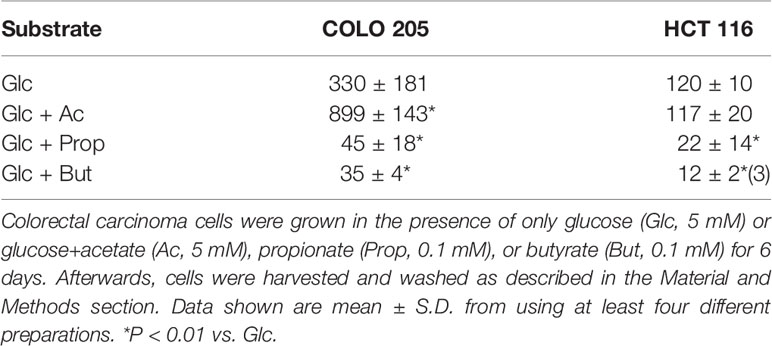
Table 2 Maximal activity (mU/mg cellular protein) of acetate thiokinase in colorectal cancer cells exposed to short-chain carboxylic acids.
In order to demonstrate whether butyrate or propionate directly inhibits the AcK activity, both SCCAs were tested on AcK activity from acetate+glucose-exposed CRC cells. The AcK activity from both CRC cells was inhibited by exogenous 0.1 mM propionate (25 and 52.5%) and 0.1 mM butyrate (92.5 and 19%) in COLO 205 and HCT 116, respectively (data not shown).
In order to assess whether AcK was also elevated in human colorectal tumors, analysis of the AcK content as well as acetylation degree was extended to human colorectal cancer biopsies (Figure 3B). As control, the AcK content was also determined in colon samples from non-cancerous animals, because no colon samples from healthy persons were available. A higher content of AcK (13.7 times) and acetylation degree (60%) was indeed found in human CRC biopsies vs. rat colon tissue, suggesting that a presumably acetylated AcK isoform was highly expressed in colon cancer tissue as previously reported (50).
As internal control for cancer identification, the K-RAS protein was also assessed in the tissue samples. As expected, the K-RAS protein was not detected in the healthy rat colon tissue, whereas its level was remarkable in human CRC biopsies. Interestingly, AcK levels found in human CRC biopsies were similar to those of K-RAS, suggesting a potential role of AcK as metabolic marker of human colon cancer. Analysis of AcK and its acetylation profile and K-RAS protein content was also performed in colon tissue from AS30D hepatoma-bearing animals. AS-30D hepatoma is a fast-growth ascitic cancer model that develops in the rodent peritoneal area close to colorectal tissue. This presumed interaction of AS-30D hepatoma cells with colon tissue for 5–7 days promoted a significant increase of the colon levels of AcK (8.8 times) and to lesser extent of K-RAS vs. colon from non-cancer-bearing animals, suggesting a change in the colon metabolism induced by hepatoma cells (Figure 3B). However, the high content of AcK in colon tissue from AS-30D hepatoma-bearing animals did not correlate with a high AcK (Lys) acetylation degree, as was observed in human CRC cell lines, suggesting that in the colon of hepatoma rats, some deacetylations may occur, affecting the AcK acetylation profile (Supplementary Figure 3B).
Effect of SCCAs on Cellular ROS Production
For ROS detection in acetate-, propionate-, or butyrate-treated cancer cells, the DHE fluorescent probe was used. To verify DHE specificity for ROS detection, the antioxidant cell-permeable N-acetylcysteine (NAC, 2 mM) was used. NAC blocked the DHE signal by >70% (data not shown), indicating that DHE was indeed sensing cell ROS, as previously demonstrated by others (51, 52). Increments in the intracellular ROS levels are frequently associated to OxPhos impairment (53, 54). Thus, the low OxPhos flux detected in HCT 116 cells incubated with glucose and acetate, propionate, or butyrate (Figure 2A) correlated with a significant increase (1.6–3.2 times) in ROS levels (Figure 4A), as compared to cells exposed to glucose alone. In contrast, COLO 205 cells incubated with acetate (+glucose) showed similar ROS levels to those found in glucose-exposed cells, correlating with a high OxPhos flux (Figure 2A). Exposure of COLO 205 cells to propionate or butyrate promoted a slightly higher ROS production (~1.4 times), which in turn correlated with a lower OxPhos capacity (Figure 2A). The basal ROS level with glucose alone was three times higher in COLO 205 cells vs. HCT 116 cells (Figure 4A), but it has been documented that the stationary state ROS content may differ between cancer cell lines (55–57).
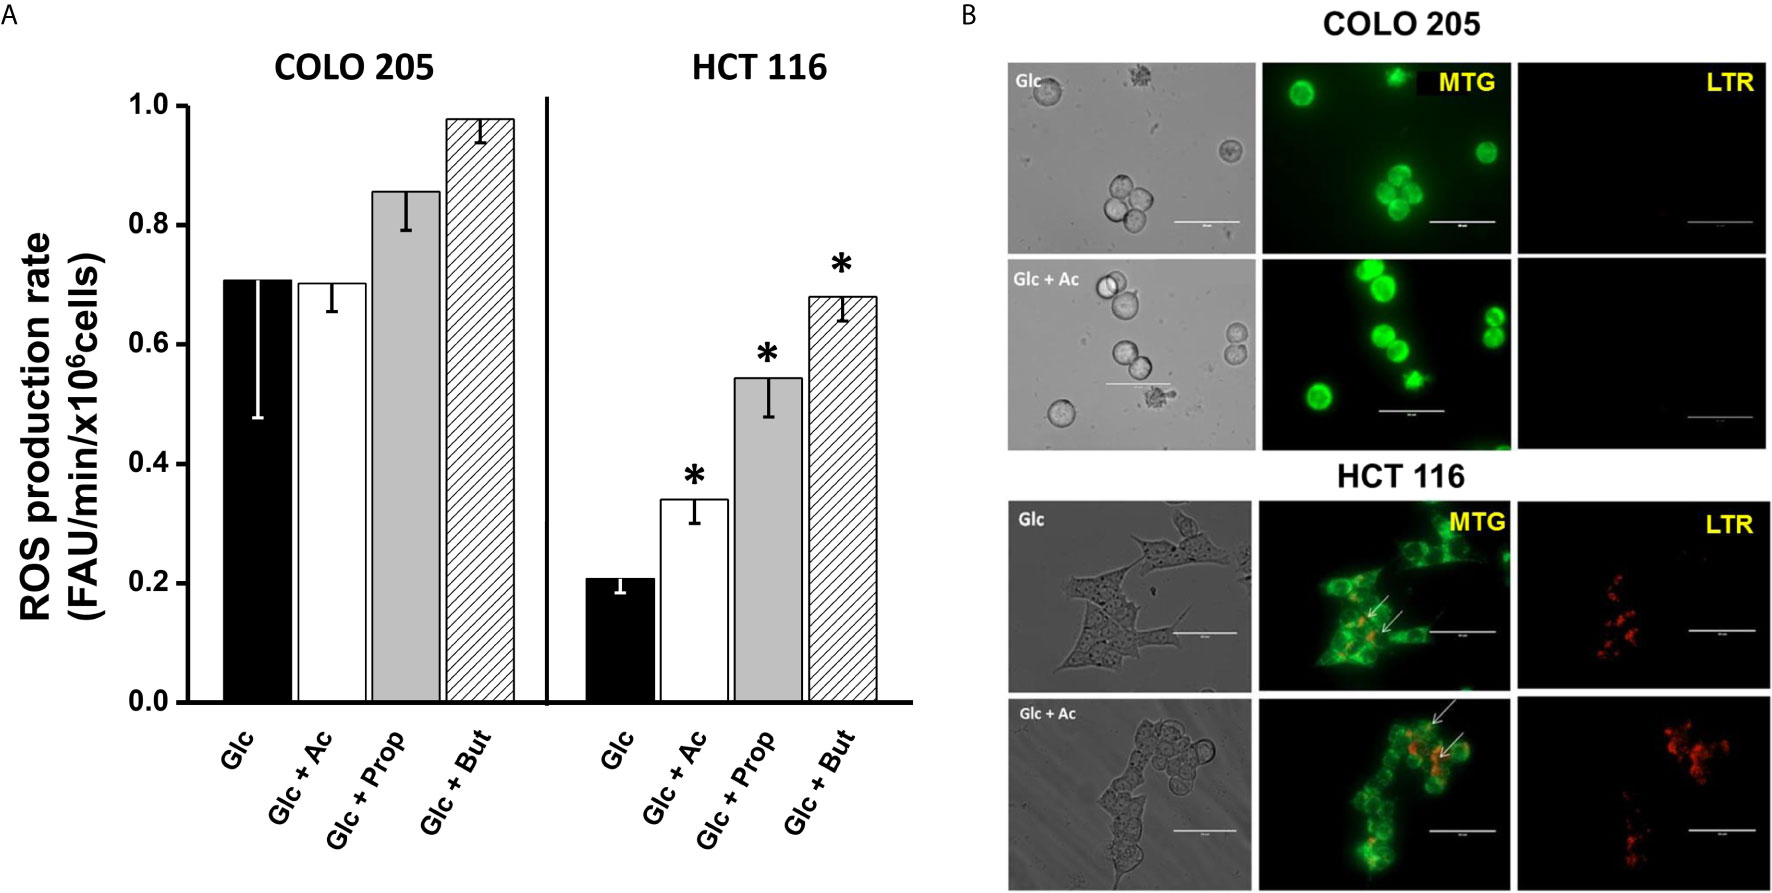
Figure 4 Effect of SCCAs on ROS production (A) and mitophagy (B) in COLO 205 and HCT116 cells. For ROS production, data shown represent the mean ± S.D. @ of three independent cultures; *P < 0.05 vs. Glc. For mitophagy, representative confocal microscopy images of MTG- and LTR-loaded COLO 205 or HCT 116 cells exposed to 5mM glucose (Glc) or 5 mM glucose + 5 mM acetate (Glc + Ac) are shown. Abbreviations as in Figure 2.
Effect of SCCAs on Mitophagy and Fusion/Fission Mitochondrial Proteins
Mitochondrial digestion was evaluated by assessing (i) the number of lysosomes and their co-localization with mitochondria in LTR/MTG-loaded cells by confocal microscopy (Figure 4B, upper panel); and (ii) the content of several autophagy proteins such as PINK-1, PARK, Beclin, DRAM, and LAMP1 (Supplementary Figure 4A). For mitophagy detection by confocal microscopy, mitochondrial subcellular localization was revealed with the dye MTG, which covalently binds to the thiols of mitochondrial proteins and accumulates in the mitochondrial matrix regardless of the mitochondrial transmembrane electrical potential. Cells were also loaded with the dye LTR, which accumulates inside lysosomes, autophagosomes, lysosomes, and autolysosomes by virtue of their internal acidic pH.
Confocal images revealed the presence of MTG-loaded mitochondria with apparently high mitochondrial membrane potential in COLO 205 cells incubated with acetate, and the absence of lysosomes. These acetate-incubated cells expressed autophagy proteins (PINK-1 and DRAM) at similar levels to those found in glucose-cultured cells (Supplementary Figure 4A). On the other hand, abundant yellow spots (as indicative of co-localization of MTG mitochondria and LTR lysosomes) were detected in HCT 116 cells, revealing an active mitochondrial digestion induced by the presence of acetate (Figure 4B, lower panel). The high number of co-loading spots in HCT 116 cells correlated with a significant increment in Beclin and PARK levels, whereas those of DRAM, PINK-1, and LAMP1 remained unchanged (Supplementary Figure 4A). For both CRC cells, the presence of propionate or butyrate decreased the number of MTG-loaded mitochondria and increased the number of LTR-loaded lysosomes (data not shown). In parallel, the levels of PINK-1 (1.5–2.7 times), PARK (2.2–5 times), DRAM (1.5–2.3 times), and LAMP1 (3–38 times) significantly increased, indicating mitophagy activation induced by propionate or butyrate.
A second molecular mechanism involved in the regulation of the number of functional mitochondria is related to the mitochondrial fission/fusion processes (58). Indeed, a significant increase (12.5 times) in the fission protein FIS-1 in HCT 116 cells cultured with acetate revealed a significant mitochondrial fragmentation (59) vs. COLO 205 cells (Supplementary Figure 4B). On the other hand, the protein mitofusin (MNF-1) involved in the mitochondrial fusion, an important process for the maintenance of functional mitochondria (60), was significantly increased in COLO 205 vs. HCT 116. These results correlated with the high OxPhos flux found in COLO 205 in the presence of acetate. Propionate or butyrate induced a strong FIS-1 overexpression, similar to that observed for autophagy proteins PINK and PARK, suggesting that these SCCAs may have impaired mitochondrial function through mitophagy and/or mitochondrial fission activation.
Effect of SCCAs on Colorectal Cancer Cell Invasiveness
For invasiveness, metastatic cells require an intensive supply of mitochondrial ATP (61). Therefore, in order to establish whether activation of OxPhos by acetate in COLO 205 cells correlated with the onset and development of the invasiveness process (Figure 5), several of the proteins involved as well as the cancer cell invasiveness itself were evaluated (Supplementary Figure 5).
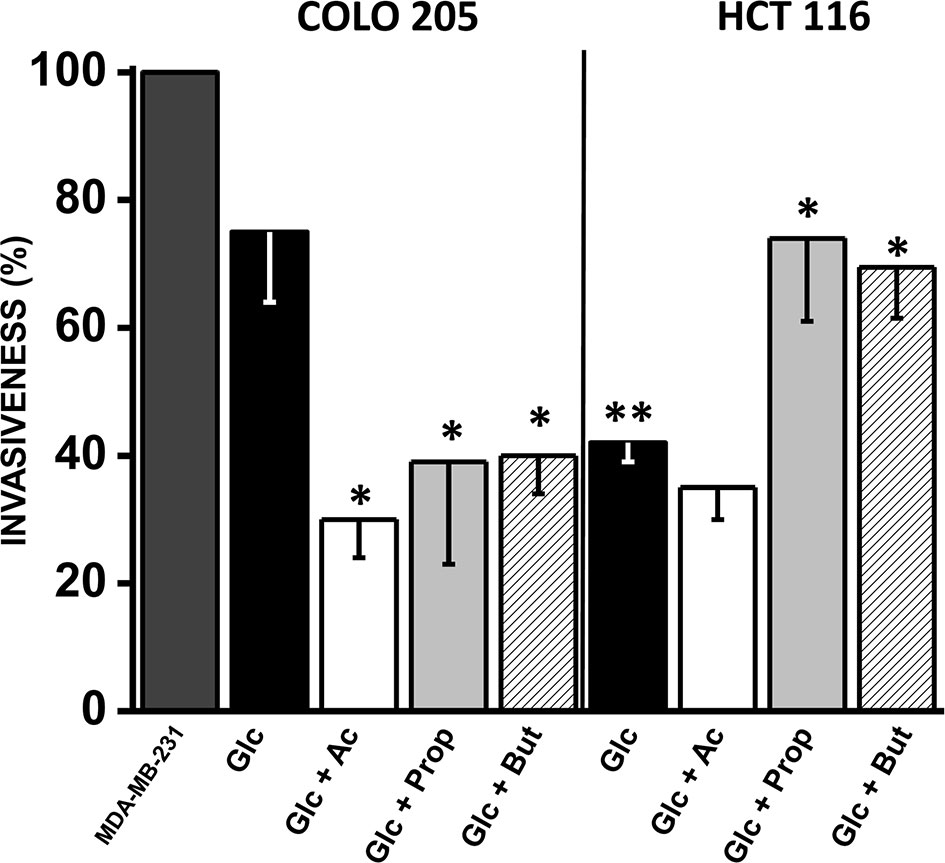
Figure 5 Effect of SCCAs on invasiveness of COLO 205 and HCT 116 cells. The data shown represent the mean ± S.D. @ of at least three different preparations. *P < 0.05; **P < 0.01 vs. Glc. Abbreviations as in Figure 2.
A significant change (1.7–4.7 times) in fibronectin (COLO 205 and HCT 116) and vimentin (HCT 116) levels were detected in acetate-exposed cells vs. only glucose (Supplementary Figure 5). However, no changes were detected in the levels of SNAIL, E-cadherin, and vimentin in acetate-exposed COLO 205 cells. Both CRC cells exposed to butyrate or propionate increased the levels (3–11 times) of several invasiveness proteins, whereas E-cadherin was significantly decreased (56–92%) (Supplementary Figure 5).
As positive control for maximal cell invasion (i.e., 100%), the well-known metastatic human breast cancer MDA-MB-231 cells, cultured in 25 mM glucose, were used (Figure 5). Cancer cell invasiveness was significantly diminished by acetate, propionate, or butyrate in COLO 205 cells by 30–40% vs. cells with only glucose, and 60–70% vs. MDA-MB-231 cells. For HCT 116 cells, their invasion profile was similar in acetate (+glucose) and only glucose, and significantly lower vs. COLO 205 cells cultured in glucose medium or vs. MDA-MB-231 cells. Surprisingly, propionate and butyrate stimulated HCT 116 cellular invasiveness by 75% vs. only glucose (Figure 5).
Discussion
Acetate Increases COLO 205 Cell Proliferation Through AcK and OxPhos Activation
Acetate represents more than 60% of the total SCCAs generated by colon-inhabiting bacterial consortia (62). Then, this simple two-carbon compound may have an important role as fuel as well as signaling molecule, or perhaps as transcriptional cofactor or metabolic modulator, to sustain CRC cell growth (63). Indeed, acetate promoted a significant increase in COLO 205 proliferation (cf. Figure 1A), like observed in other colorectal (HT-29) and gastric (AGS) carcinomas exposed to acetate (2–6.25 mM) for 3–16 days (64, 65). Proposed mechanisms induced by acetate include (a) associated histone acetylation of genes coding for proteins involved in cellular growth (66); (b) acetylation of non-histone proteins or transcription factors involved in cancer cell proliferation (21, 67); (c) increased levels of the proliferation marker Ki67 (64); and (d) increased mRNA and protein levels of some proinflammatory cytokines and interleukins associated with cell growth activation such as IL-1β, IL-8, and TNF-α (65).
In addition to the above mechanisms, acetate may support COLO 205 cells’ growth by serving as fuel and activating OxPhos for ATP supply. To this end, a dynamic cytosolic/mitochondrial acetate transport/diffusion and an active mitochondrial AcK and functional OxPhos are required. It has been documented that [14C] acetate (1 mM) is rapidly transported into HCT-15 CRC cells through overexpressed and active monocarboxylate transporters (MCT1 and/or MCT2), whereas acetate enters RKO cells by facilitated diffusion via aquaporins (68). In the cytosol, acetate is actively transformed by a cytosolic acetate thiokinase (AcK), which is also named acetyl-CoA synthetase-2 (ACSS2) (69), in an ATP-dependent reaction to form acetyl-CoA. This activated acetate may be used for fatty acid synthesis (70) that is required for the de novo plasma membrane biosynthesis to support cellular growth. An acetate fraction is efficiently transported into mitochondria and transformed by a mitochondrial AcK or ACSS (isoforms 1 and 3) (71), entering the Krebs cycle as acetyl-CoA and activating OxPhos.
The absence of a specific antibody against cytosolic or mitochondrial AcK isoforms precluded the precise identification of the mitochondrial AcK in our study. However, a high mRNA content of mitochondrial AcK has been detected in hepatocarcinoma SNU 449 cells exposed to acetate (72, 73), suggesting that acetate preferentially induces the mitochondrial AcK isoform. Although there are no other studies where mitochondrial (and cytosolic) AcK activity has been experimentally determined in cancer cells, experimental evidence (AcK enzyme activity; AcK protein content and OxPhos flux closely related with the acetate presence) shown in the present work indicated that acetate could be actively oxidized. However, the role of acetate supporting a non-catabolic role in CRC cells cannot be excluded.
Acetate oxidation leads to a high Δψm for ATP synthesis in hepatoma AS-30D-isolated mitochondria (Hep-M, c.f. Supplementary Table 2) at comparable rates to those of other canonical mitochondrial fuels such as pyruvate, glutamate/malate, glutamine, or FFAs (23). Acetate promoted (i) a slight uncoupling effect in liver mitochondria but not in hepatoma mitochondria (inserted table in Figure 2B) and (ii) elevated citrate levels for NADH production. These observations imply the presence of a highly active mitochondrial AcK, and active acetate metabolism, in cancer mitochondria.
AcK activity in cancer cells has not been previously determined probably because it has been assumed that (i) high AcK mRNA and/or protein contents or (ii) high AcK deacetylation levels induced by Sirt are tightly associated with high enzyme activity (72, 74), which is not always the case (75), and hence activity must be directly determined.
Thus, the direct measurement of COLO 205 AcK revealed that acetate increased its activity as well as its protein level; acetate also increased the HCT 116 AcK protein level but not its activity. These observations suggest that acetate might act as a transcriptional cofactor. The AcK Vmax values in COLO 205 and HCT 116 cells cultured with only glucose or glucose+acetate were in the range reported for some microorganisms (76, 77), but they were higher than those reported for mammalian cells (78).
The high AcK activity in COLO 205 cells exposed to glucose+acetate correlated with an enhanced OxPhos, whereas glycolysis remained unchanged. Similar observations were described for human CRC biopsies, where OxPhos increased >50% vs. healthy colon tissue, with no apparent change in glycolysis rate (79). COLO 205 cells cultured in glucose medium were also strongly dependent on OxPhos for ATP supply (85%). The addition of acetate promoted that COLO 205 cells depended almost exclusively on OxPhos (>95%). These observations indicated that acetate oxidation prompted OxPhos activation as the principal mechanism for ATP production in COLO 205 cells.
An increased copy number of mitochondrial DNA (mtDNA) was suggested as possible mechanism related with OxPhos activation in patient-derived microsatellite-stable CRC tissue samples (80). Other mechanisms associated to mitochondrial stabilization induced by acetate in CRC were identified, which have not been previously studied in CRC cells: active mitochondrial biogenesis (as judged by the PGC-1α level) and high mitochondrial fusion activity (as judged by the MFN-2 level). An elevated PGC-1α content has also been detected in brown adipocyte IM-BAT cells exposed to acetate (10 mM/7 days) (81). Increased mRNA levels of mitochondrial fusion proteins MFN-1, MFN-2, and OPA-1 were detected in human islets of Langerhans cells exposed to 1 mM acetate for 24 h (82). These acetate-induced mechanisms, along with a higher mtDNA copy number, may operate in COLO 205 cells stimulating OxPhos, increasing cell proliferation and perhaps activating survival mechanisms to avoid apoptosis induction as occurs in human CRC tissue samples (83).
Lysine acetylation has been identified as a widespread post-translational modification of several metabolic enzymes, including mitochondrial proteins (84). In this regard, acetate exposure increased lysine acetylation of mitochondrial AcK in COLO 205 cells correlating with an increment in its activity. In contrast, in HCT 116 cells where AcK activity was significantly lower vs. COLO 205, AcK lysine acetylation was also lower. This observation contradicts reports about mice liver and AcK purified enzyme, where AcK acetylation of a specific lysine residue blocks enzyme activity by 40–90% (50, 85, 86).
The differences in the acetylated AcK activity between non-cancer and cancer cells may be attributed to the acetylation of lysine residues directly involved in catalysis of AcK. In this regard, it has been documented that bacterial AcK could be acetylated at four different lysine residues, but only one is responsible of its activity inhibition (87). It has been shown for some glycolytic enzymes such as phosphoglycerate kinase-1 that acetylation of a single particular lysine residue (K220) may block enzyme activity (88), whereas acetylation of another lysine residue (K323) may increase activity (67). The acetylation of either lysine residues depends on the acetylases (PCAF and KAT9) and deacetylases (SIRT7 and HDAC3) expression and activity.
Perhaps, a similar dual response is also implicated in the AcK regulation by acetate. There are no available studies showing the acetylation degree of AcK in cancer cells exposed to acetate. Interestingly, the acetylation level of the AcK from human CRC biopsies was higher than the acetylation of COLO 205 cells AcK, suggesting that AcK protein in biopsies may also maintain a high activity.
It should be noted that aside from acetate, 4 mM glutamine was also present in the CRC culture medium, acting as an essential fuel for cancer proliferation (89). However, glutaminolysis (i.e., lactate production from glutamine breakdown) did not change in both CRC cells under all tested conditions (data not shown), suggesting that the principal carbon source for ATP synthesis, at least in COLO 205 cells, was acetate (+glucose) rather than glutamine.
Acetate Increased Glycolysis Rate to Sustain HCT 116 Cell Growth
Acetate did not affect growth in HCT 116 cells, in agreement with data previously reported (90). Apparently, acetate does not modify the histone acetylation profile, and consequently cell growth was not stimulated.
Energy metabolism in HCT 116 cells was completely different than that of COLO 205 cells. HCT 116 cells maintained a predominant glycolytic metabolism (high HIF-1α and glycolytic protein contents) in glucose or glucose + acetate medium, with OxPhos playing a minor role. There are no available studies examining the effect of acetate on glycolysis flux in cancer cells; however, it has been found that acetate increases the HIF-1α and HIF-2 levels in human fibrosarcoma HT1080, but after prolonged hypoxia (1% O2) (91). This observation suggests a potential transcriptional role for acetate.
None of the assayed SCCAs, including acetate, modified the OxPhos flux in HCT 116 cells. In addition, the OxPhos flux of HCT 116 cells was similar to that previously reported (92), but it was significantly lower than that of COLO 205 cells and other cancer cells studied previously like MCF-7, MDA-MB-231, MDA-MB-468, and HeLa cells (48, 61). The low OxPhos capacity of HCT 116 cells correlated with their low total AcK protein activity (c.f. Table 2) as well as with an active mitochondrial digestion (c.f. Figure 4B), indicating that HCT 116 cells have an impaired mitochondrial function.
Contrary to what was observed for AcK, most acetate-induced OxPhos or glycolysis enzymes were not acetylated by exogenous acetate, except 2-OGDH, GLUT-1, and HKII. It has been documented for non-cancer cells that acetylation of some mitochondrial enzymes such as ICDH, respiratory chain Complex I, GDH, or MDH promotes activity inhibition. However, in other enzymes such as enoyl-CoA hydratase or aconitase, acetylation increases activity [reviewed in (93)]. Unfortunately, there are no reports about the effects of acetylation on these energy-metabolism proteins and its correlation with their activity and stability in cancer cells.
It is important to emphasize that clear metabolic differences were found in both COLO 205 and HCT 116 cells after acetate exposure. These differences may be attributed to the following: (1) Different expression and activity of acetylase and deacetylase isoforms found in COLO 205 and HCT 116 cells (94). For instance, COLO 205 cells show a histone deacetylase activity 20% lower than that found in HCT 116 cells; and gene expression of particular deacetylase isoforms (i.e., HDAC 1-5) is different between COLO 205 and HCT 116. These events, among others, promote different epigenetic modifications affecting a wide range of cellular functions (95). (2) Remarkable phenotypic differences between COLO 205 and HCT 116 cells are apparent when they are cultured. COLO 205 cells were derived from the ascites region, i.e., these CRC cells underwent metastasis, which may explain why they show high invasion capacity (cf. Figure 5), whereas HCT 116 cells were derived from a primary colorectal solid tumor, whose invasion profile is significantly lower (96, 97). (3) Differences in the mutated or non-mutated (wild-type) status of transcription factors, such as p53, might promote differences in cellular responses (98, 99). In this regard, it has been documented that HCT 116 cells express wild-type p53, whereas COLO 205 contain a mutated p53 isoform, which most likely affects energy metabolism fluxes, drug sensitivity (99, 100), and most likely some other cell functions. This last observation may explain the observation that HCT 116 cells are acetate-producing cancer cells (101), instead of acetate-consuming cells like COLO 205.
Molecular Mechanisms Associated to the Impairment of Proliferation and OxPhos by Propionate or Butyrate in CRC Cells
Contrary to normal colonocytes (102, 103), physiological butyrate or propionate concentrations decrease CRC cell proliferation (c.f. Figure 1). The proposed molecular mechanisms associated to this effect are (1) strong histone deacetylases (HDACs) inhibition, which allows cyclin-dependent kinase inhibitory protein p21/Cip1 transcription, resulting in cell cycle arrest in the G1 phase (90, 104); (2) apoptosis induction through hyperactivation of the WNT/beta-catenin signaling pathway (105); (3) mitophagy induction (present study), increasing the levels of PARK, DRAM, and LAMP1 (c.f. Supplementary Figure 4) [it has been demonstrated in human CRC HCT 116 and SW480 and human hepatocellular carcinoma Huh 7 cells that mitophagy activation induced by butyrate or propionate occurs through downregulation of its negative regulator mTOR, which in turn promotes AMPKα hyperphosphorylation (106, 107); however, the levels of P-AMPK were unchanged when CRC cells were exposed to butyrate or propionate (Supplementary Figure 1)]; (4) active mitochondrial fission (c.f. Supplementary Figure 5), which, together with mitophagy, decreases the mitochondrial mass and in consequence OxPhos; (5) the direct inhibition of mitochondrial AcK by butyrate and propionate and in consequence the OxPhos flux.
Invasiveness Processes Are Strongly Affected by SCCAs in CRC Cancer Cells
There are no reports about the effect of acetate on CRC cell metastasis and invasion, whereas the effect of butyrate on cancer cell invasiveness has been widely analyzed. Butyrate at physiological concentrations (0.5–5 mM) increases the expression of metalloproteinases and upregulates miR-3935, which in turn inhibits migration and invasion in HT1080 fibrosarcoma and human A549 lung cancer cells (108, 109). It has been shown in HT29, LOVO, and HCT8 cells that blocking of migration induced by butyrate includes HDAC3, Akt1, and ERK1/2 inactivation (110). In agreement with the latter observations, the three SCCAs inhibited invasiveness of COLO 205 cells, although, in marked contrast, butyrate and propionate stimulated invasiveness of HCT 116 cells. This puzzling result clearly deserves further investigation.
AcK Overexpression in COLO 205 Cells and Human CRC Biopsies: A Potential Metabolic Marker for Cancer Identification
Human CRC biopsies showed a high AcK level, which was similar to that detected in COLO 205 cells. Interestingly, high levels of AcK and K-RAS were also detected in the colon derived from AS-30D ascites hepatoma-bearing animals (vs. colon from healthy rats; c.f. Figure 3B). This last result clearly indicated that cancer cells may induce changes in neighboring healthy tissues to acquire a metastatic phenotype.
Overexpression of AcK has been found in several CRC cells (111–113) as well as in CRC human biopsies (63, 114). In bladder urothelial BLCA and GCa carcinomas, mitochondrial AcK has been proposed as an enzyme with potential oncogenic role. Thus, it could be used as prognostic biomarker providing a promising novel target for cancer treatment (71, 115). However, it has also been described that inflammatory processes in the bowel, associated to a modified luminal bacterial metabolite composition (116), also increase the AcK protein level (63). Thus, AcK protein detection should be accompanied by other well-known CRC oncogenes such as H-RAS (c.f. Figure 3B) or K-RAS (117).
In the present study, animal experimental systems were used instead of human systems under the assumption that some cause-effect relationships are similar in humans and experimental systems. Accordingly, several studies have shown a high similitude in metabolic responses between animal models and human tissue (118, 119). Then, data derived from cultured cancer cells, isolated rat mitochondria, and human biopsies show one common important finding, which may be envisioned as potential alternative to deter CRC growth. (1) Some CRC cells acquire, via expression of mitochondrial AcK, a high acetate dependency for their growth. Elevated AcK levels were also found in cancer biopsies and cancer-isolated mitochondria. Then, selective inhibitors of this enzyme represent an opportunity to develop new anticancer therapeutics. In this regard, over 100,000 molecules capable of selectively inhibiting AcK have been recently discovered (120). As AcK is also found in healthy tissues like colon, chemotherapy should be oriented to use multi-target drugs for increasing potency and selectivity and decreasing adverse side-effects. (2) The present data suggest that acetate-producing bacteria (i.e., enteric bacteria) in the gut of healthy patients may favor the development of CRC, whereas propionate- and butyrate-producing gut bacteria may disfavor CRC growth. Therefore, the identification of a metabolic diet that may modulate the gut microbiome may be useful to decrease CRC growth.
Data Availability Statement
The original contributions presented in the study are included in the article/Supplementary Material. Further inquiries can be directed to the corresponding authors.
Ethics Statement
The studies involving human participants were reviewed and approved by Committees of Ethics and Research of Instituto Nacional de Cancerología, México (INCAN) (http://incan-mexico.org/incan//pub/investigacion/bioetica/Anexo7.pdf). The patients/participants provided their written informed consent to participate in this study. The experimental protocols for the use and care of laboratory animals followed the guidelines of the Norma Oficial Mexicana (NOM-062-ZOO-1999) and for disposal of biological residues (NOM-087-SEMARNAT-SSA1-2002).
Author Contributions
SR-E and RM-S: conception and design; analysis; interpretation of data; study supervision; manuscript writing; and manuscript revision. DR-C, JG-P, SP-V, CV, JV-N, BB-C, and RE: development of methodology and manuscript proofreading. ES, ÁM-H, RJ-C, LR-G, and JA-P: analysis, interpretation of data, and revision of manuscript. All authors contributed to the article and approved the submitted version.
Funding
This work was partially supported by CONACyT-México grant Nos. 283144 (SR-E), 377873 (SP-V), 282663 (ES), and 6379 (RM-S).
Conflict of Interest
The authors declare that the research was conducted in the absence of any commercial or financial relationships that could be construed as a potential conflict of interest.
Publisher’s Note
All claims expressed in this article are solely those of the authors and do not necessarily represent those of their affiliated organizations, or those of the publisher, the editors and the reviewers. Any product that may be evaluated in this article, or claim that may be made by its manufacturer, is not guaranteed or endorsed by the publisher.
Acknowledgments
We thank Professor Paul A. M. Michels from the University of Edinburgh, Scotland, for his advice during the preparation of the present manuscript.
Supplementary Material
The Supplementary Material for this article can be found online at: https://www.frontiersin.org/articles/10.3389/fonc.2021.697408/full#supplementary-material
Abbreviations
Ac, acetate; AcK, acetate thiokinase; ANT, adenine nucleotide translocase; ATPS, ATP synthase; CRC, colorectal cancer; But, butyrate; DHE, dihydroethidium; DRAM, damage-regulated autophagy modulator; FAU, fluorescence arbitrary units; FIS-1, mitochondrial fission-1 protein; Glc, glucose; Glu, glutamate; GLUT-1, glucose transporter 1; GLUT-3, glucose transporter 3; Hep-M, rat AS-30D hepatoma mitochondria; HKI, hexokinase I; HKII, hexokinase II; K-RAS, Kirsten rat sarcoma viral oncogene homolog; LAMP1, lysosomal associated-membrane protein-1; Mal, malate; MFN-2 mitofusin-2; ND1, NADH dehydrogenase subunit 1; OxPhos, oxidative phosphorylation; P-AMPK, phosphorylated AMP-activated protein kinase; PARK, parkin; PGC-1α, peroxisome proliferator activated receptor-gamma coactivator-1 alpha; PINK-1, PTEN induced-kinase 1; Prop, propionate; Pyr, pyruvate; RLM, rat liver mitochondria; ROS, reactive oxygen species; SCCAs, short-chain carboxylic acids.
References
1. Van de Wiele T, Vanhaecke L, Boeckaert C, Peru K, Headley J, Verstraete W, et al. Human Colon Microbiota Transform Polycyclic Aromatic Hydrocarbons to Estrogenic Metabolites. Environ Health Perspect (2005) 113(1):6–10. doi: 10.1289/ehp.7259
2. Nicholson JK, Holmes E, Kinross J, Burcelin R, Gibson G, Jia W, et al. Host-Gut Microbiota Metabolic Interactions. Science (2012) 336(6086):1262–67. doi: 10.1126/science.1223813
3. Krautkramer KA, Kreznar JH, Romano KA, Vivas EI, Barrett-Wilt GA, Rabaglia ME, et al. Diet-Microbiota Interactions Mediate Global Epigenetic Programming in Multiple Host Tissues. Mol Cell (2016) 64(5):982–92. doi: 10.1016/j.molcel.2016.10.025
4. Han S, Gao J, Zhou Q, Liu S, Wen C, Yang X. Role of Intestinal Flora in Colorectal Cancer From the Metabolite Perspective: A Systematic Review. Cancer Manag Res (2018) 10:199–206. doi: 10.2147/CMAR.S153482
5. Sze MA, Topçuoğlu BD, Lesniak NA, Ruffin MT4, Schloss PD. Fecal Short-Chain Fatty Acids Are Not Predictive of Colonic Tumor Status and Cannot Be Predicted Based on Bacterial Community Structure. mBio (2019) 10(4):e01454–19. doi: 10.1128/mBio.01454-19
6. Nomura M, Nagatomo R, Doi K, Shimizu J, Baba K, Saito T, et al. Association of Short-Chain Fatty Acids in the Gut Microbiome With Clinical Response to Treatment With Nivolumab or Pembrolizumab in Patients With Solid Cancer Tumors. JAMA Netw Open (2020) 3(4):e202895. doi: 10.1001/jamanetworkopen.2020.2895
7. Warburg O. On the Origin of Cancer Cells. Science (1956) 123(3191):309–14. doi: 10.1126/science.123.3191.309
8. Moreno-Sánchez R, Marín-Hernández A, Saavedra E, Pardo JP, Ralph SJ, Rodríguez-Enríquez S. Who Controls the ATP Supply in Cancer Cells? Biochemistry Lessons to Understand Cancer Energy Metabolism. Int J Biochem Cell Biol (2014) 50:10–23. doi: 10.1016/j.biocel.2014.01.025
9. Gamet L, Daviaud D, Denis-Pouxviel C, Remesy C, Murat JC. Effects of Short-Chain Fatty Acids on Growth and Differentiation of the Human Colon-Cancer Cell Line HT29. Int J Cancer (1992) 52(2):286–89. doi: 10.1002/ijc.2910520222
10. Mu D, Gao Z, Guo H, Zhou G, Sun B. Sodium Butyrate Induces Growth Inhibition and Apoptosis in Human Prostate Cancer DU145 Cells by Up-Regulation of the Expression of Annexin A1. PloS One (2013) 8(9):e74922. doi: 10.1371/journal.pone.0074922
11. Kim K, Kwon O, Ryu TY, Jung CR, Kim J, Min JK, et al. Propionate of a Microbiota Metabolite Induces Cell Apoptosis and Cell Cycle Arrest in Lung Cancer. Mol Med Rep (2019) 20(2):1569–74. doi: 10.3892/mmr.2019.10431
12. Semaan J, El-Hakim S, Ibrahim JN, Safi R, Elnar AA, El Boustany C. Comparative Effect of Sodium Butyrate and Sodium Propionate on Proliferation, Cell Cycle and Apoptosis in Human Breast Cancer Cells MCF-7. Breast Cancer (2020) 27(4):696–705. doi: 10.1007/s12282-020-01063-6
13. Kurz EU, Wilson SE, Leader KB, Sampey BP, Allan WP, Yalowich JC, et al. The Histone Deacetylase Inhibitor Sodium Butyrate Induces DNA Topoisomerase II Alpha Expression and Confers Hypersensitivity to Etoposide in Human Leukemic Cell Lines. Mol Cancer Ther (2001) 1(2):121–31.
14. Silva LG, Ferguson BS, Avila AS, Faciola AP. Sodium Propionate and Sodium Butyrate Effects on Histone Deacetylase (HDAC) Activity, Histone Acetylation, and Inflammatory Gene Expression in Bovine Mammary Epithelial Cells. J Anim Sci (2018) 96(12):5244–52. doi: 10.1093/jas/sky373
15. Davie JR. Inhibition of Histone Deacetylase Activity by Butyrate. J Nutr (2003) 133(7 Suppl):2485S–93S. doi: 10.1093/jn/133.7.2485S
16. Blachier F, Boutry C, Bos C, Tomé D. Metabolism and Functions of L-Glutamate in the Epithelial Cells of the Small and Large Intestines. Am J Clin Nutr (2009) 90(3):814S–21S. doi: 10.3945/ajcn.2009.27462S
17. Kamphorst JJ, Chung MK, Fan J, Rabinowitz JD. Quantitative Analysis of Acetyl-CoA Production in Hypoxic Cancer Cells Reveals Substantial Contribution From Acetate. Cancer Metab (2014) 2:23. doi: 10.1186/2049-3002-2-23
18. Hosios AM, Vander Heiden MG. Acetate Metabolism in Cancer Cells. Cancer Metab (2014) 2(1):27. doi: 10.1186/s40170-014-0027-y
19. Gao X, Lin SH, Ren F, Li JT, Chen JJ, Yao CB, et al. Acetate Functions as an Epigenetic Metabolite to Promote Lipid Synthesis Under Hypoxia. Nat Commun (2016) 7:11960. doi: 10.1038/ncomms11960
20. Lee JV, Berry CT, Kim K, Sen P, Kim T, Carrer A, et al. Acetyl-CoA Promotes Glioblastoma Cell Adhesion and Migration Through Ca2+-NFAT Signaling. Genes Dev (2018) 32(7-8):497–511. doi: 10.1101/gad.311027.117
21. Xia C, Tao Y, Li M, Che T, Qu J. Protein Acetylation and Deacetylation: An Important Regulatory Modification in Gene Transcription (Review). Exp Ther Med (2020) 20(4):2923–40. doi: 10.3892/etm.2020.9073
22. Isidoro A, Martínez M, Fernández PL, Ortega AD, Santamaría G, Chamorro M, et al. Alteration of the Bioenergetic Phenotype of Mitochondria Is a Hallmark of Breast, Gastric, Lung and Oesophageal Cancer. Biochem J (2004) 378:17–20. doi: 10.1042/BJ20031541
23. Rodríguez-Enríquez S, Hernández-Esquivel L, Marín-Hernández A, El Hafidi M, Gallardo-Pérez JC, Hernández-Reséndiz I, et al. Mitochondrial Free Fatty Acid β-Oxidation Supports Oxidative Phosphorylation and Proliferation in Cancer Cells. Int J Biochem Cell Biol (2015) 65:209–21. doi: 10.1016/j.biocel.2015.06.010
24. Pacheco-Velázquez SC, Gallardo-Pérez JC, Díaz D, Adán-Ladrón de Guevara A, Robledo-Cadena DX, Saavedra E, et al. Heart Myxoma Develops Oncogenic and Metastatic Phenotype. J Cancer Res Clin Oncol (2019) 145(5):1283–95. doi: 10.1007/s00432-019-02897-0
25. Gallardo-Pérez JC, Rivero-Segura NA, Marín-Hernández A, Moreno-Sánchez R, Rodríguez-Enríquez S. GPI/AMF Inhibition Blocks the Development of the Metastatic Phenotype of Mature Multi-Cellular Tumor Spheroids. Biochim Biophys Acta (2014) 1843(6):1043–53. doi: 10.1016/j.bbamcr.2014.01.013
26. Moreno-Sánchez R, Marín-Hernández Á, Gallardo-Pérez JC, Vázquez C, Rodríguez-Enríquez S, Saavedra E. Control of the NADPH Supply and GSH Recycling for Oxidative Stress Management in Hepatoma and Liver Mitochondria. Biochim Biophys Acta Bioenerg (2018) 1859(10):1138–50. doi: 10.1016/j.bbabio.2018.07.008
27. Marín-Hernández Á, Gallardo-Pérez JC, Reyes-García MA, Sosa-Garrocho M, Macías-Silva M, Rodríguez-Enríquez S, et al. Kinetic Modeling of Glucose Central Metabolism in Hepatocytes and Hepatoma Cells. Biochim Biophys Acta Gen Subj (2020) 1864(11):129687. doi: 10.1016/j.bbagen.2020.129687
28. Saavedra E, Encalada R, Pineda E, Jasso-Chávez R, Moreno-Sánchez R. Glycolysis in Entamoeba Histolytica. Biochemical Characterization of Recombinant Glycolytic Enzymes and Flux Control Analysis. FEBS J (2005) 272(7):1767–83. doi: 10.1111/j.1742-4658.2005.04610.x
29. Marín-Hernández A, Rodríguez-Enríquez S, Vital-González PA, Flores-Rodríguez FL, Macías-Silva M, Sosa-Garrocho M, et al. Determining and Understanding the Control of Glycolysis in Fast-Growth Tumor Cells. Flux Control by an Over-Expressed But Strongly Product-Inhibited Hexokinase. FEBS J (2006) 273(9):1975–88. doi: 10.1111/j.1742-4658.2006.05214.x
31. Rodríguez-Enríquez S, Torres-Márquez ME, Moreno-Sánchez R. Substrate Oxidation and ATP Supply in AS-30D Hepatoma Cells. Arch Biochem Biophys (2000) 375(1):21–30. doi: 10.1006/abbi.1999.1582
32. Nakashima RA, Paggi MG, Pedersen PL. Contributions of Glycolysis and Oxidative Phosphorylation to Adenosine 5′-Triphosphate Production in AS-30D Hepatoma Cells. Cancer Res (1984) 44(12 Pt 1):5702–06.
33. Lemasters JJ. The ATP-to-Oxygen Stoichiometries of Oxidative Phosphorylation by Rat Liver Mitochondria. An Analysis of ADP-Induced Oxygen Jumps by Linear Nonequilibrium Thermodynamics. J Biol Chem (1984) 259(21):13123–30. doi: 10.1016/S0021-9258(18)90666-6
34. Brand MD, Harper ME, Taylor HC. Control of the Effective P/O Ratio of Oxidative Phosphorylation in Liver Mitochondria and Hepatocytes. Biochem J (1993) 291(Pt 3):739–48. doi: 10.1042/bj2910739
35. Moreadith RW, Fiskum G. Isolation of Mitochondria From Ascites Tumor Cells Permeabilized With Digitonin. Anal Biochem (1984) 137(2):360–7. doi: 10.1016/0003-2697(84)90098-8
36. Moreno-Sánchez R. Regulation of Oxidative Phosphorylation in Mitochondria by External Free Ca2+ Concentrations. J Biol Chem (1985) 260(7):4028–34. doi: 10.1016/S0021-9258(18)89226-2
37. Gellerich FN, Deschauer M, Chen Y, Müller T, Neudecker S, Zierz S. Mitochondrial Respiratory Rates and Activities of Respiratory Chain Complexes Correlate Linearly With Heteroplasmy of Deleted mtDNA Without Threshold and Independently of Deletion Size. Biochim Biophys Acta (2002) 1556(1):41–52. doi: 10.1016/s0005-2728(02)00305-5
39. Gnaiger E. MitoEAGLE Task Group. Mitochondrial Physiology. Bioenerg Commun (2020) 2020(1):1–44. doi: 10.26124/bec:2020-0001.v1
40. Baracca A, Sgarbi G, Solaini G, Lenaz G. Rhodamine 123 as a Probe of Mitochondrial Membrane Potential: Evaluation of Proton Flux Through F(0) During ATP Synthesis. Biochim Biophys Acta (2003) 1606(1-3):137–46. doi: 10.1016/s0005-2728(03)00110-5
41. Rodriguez-Enriquez S, Kim I, Currin RT, Lemasters JJ. Tracker Dyes to Probe Mitochondrial Autophagy (Mitophagy) in Rat Hepatocytes. Autophagy (2006) 2(1):39–46. doi: 10.4161/auto.2229
42. Krzywinsk i M, Altman N. Points of Significance: Analysis of Variance and Blocking. Nat Methods (2014) 11(7):699–700. doi: 10.1038/nmeth.3005
43. Casanova MR, Azevedo-Silva J, Rodrigues LR, Preto A. Colorectal Cancer Cells Increase the Production of Short Chain Fatty Acids by Propionibacterium Freudenreichii Impacting on Cancer Cells Survival. Front Nutr (2018) 5:44. doi: 10.3389/fnut.2018.00044
44. Wenzel TJ, Gates EJ, Ranger AL, Klegeris A. Short-Chain Fatty Acids (SCFAs) Alone or in Combination Regulate Select Immune Functions of Microglia-Like Cells. Mol Cell Neurosci (2020) 105:103493. doi: 10.1016/j.mcn.2020.103493
45. Marín-Hernández A, Gallardo-Pérez JC, Ralph SJ, Rodríguez-Enríquez S, Moreno-Sánchez R. HIF-1alpha Modulates Energy Metabolism in Cancer Cells by Inducing Over-Expression of Specific Glycolytic Isoforms. Mini Rev Med Chem (2009) 9(9):1084–101. doi: 10.2174/138955709788922610
46. Dietzen DJ, Davis EJ. Oxidation of Pyruvate, Malate, Citrate, and Cytosolic Reducing Equivalents by AS-30D Hepatoma Mitochondria. Arch Biochem Biophys (1993) 305(1):91–102. doi: 10.1006/abbi.1993.1397
47. Nagel WO, Dauchy RT, Sauer LA. Mitochondrial Malic Enzymes. An Association Between NAD(P)+-Dependent Malic Enzyme and Cell Renewal in Sprague-Dawley Rat Tissues. J Biol Chem (1980) 255(9):3849–54. doi: 10.1016/S0021-9258(19)85602-8
48. Rodríguez-Enríquez S, Pacheco-Velázquez SC, Marín-Hernández Á, Gallardo-Pérez JC, Robledo-Cadena DX, Hernández-Reséndiz I, et al. Resveratrol Inhibits Cancer Cell Proliferation by Impairing Oxidative Phosphorylation and Inducing Oxidative Stress. Toxicol Appl Pharmacol (2019) 370:65–77. doi: 10.1016/j.taap.2019.03.008
49. Lumeng L, Davis EJ. The Oxidation of Acetate by Liver Mitochondria. FEBS Lett (1973) 29(2):124–6. doi: 10.1016/0014-5793(73)80541-1
50. Schwer B, Bunkenborg J, Verdin RO, Andersen JS, Verdin E. Reversible Lysine Acetylation Controls the Activity of the Mitochondrial Enzyme Acetyl-CoA Synthetase 2. Proc Natl Acad Sci U S A (2006) 103(27):10224–29. doi: 10.1073/pnas.0603968103
51. Hussain SP, Amstad P, He P, Robles A, Lupold S, Kaneko I, et al. P53-Induced Up-Regulation of MnSOD and GPx But Not Catalase Increases Oxidative Stress and Apoptosis. Cancer Res (2004) 64(7):2350–56. doi: 10.1158/0008-5472.can-2287-2
52. Abubaker AA, Vara D, Eggleston I, Canobbio I, Pula G. A Novel Flow Cytometry Assay Using Dihydroethidium as Redox-Sensitive Probe Reveals NADPH Oxidase-Dependent Generation of Superoxide Anion in Human Platelets Exposed to Amyloid Peptide β. Platelets (2019) 30(2):181–89. doi: 10.1080/09537104.2017.1392497
53. Staniek K, Nohl H. Are Mitochondria a Permanent Source of Reactive Oxygen Species? Biochim Biophys Acta (2000) 1460(2-3):268–75. doi: 10.1016/s0005-2728(00)00152-3
54. St-Pierre J, Buckingham JA, Roebuck SJ, Brand MD. Topology of Superoxide Production From Different Sites in the Mitochondrial Electron Transport Chain. J Biol Chem (2002) 277(47):44784–90. doi: 10.1074/jbc.M207217200
55. Kumar B, Koul S, Khandrika L, Meacham RB, Koul HK. Oxidative Stress Is Inherent in Prostate Cancer Cells and Is Required for Aggressive Phenotype. Cancer Res (2008) 68(6):1777–85. doi: 10.1158/0008-5472.CAN-07-5259
56. Sarmiento-Salinas FL, Delgado-Magallón A, Montes-Alvarado JB, Ramírez-Ramírez D, Flores-Alonso JC, Cortés-Hernández P, et al. Breast Cancer Subtypes Present a Differential Production of Reactive Oxygen Species (ROS) and Susceptibility to Antioxidant Treatment. Front Oncol (2019) 9:480. doi: 10.3389/fonc.2019.00480
57. Zaidieh T, Smith JR, Ball KE, An Q. ROS as a Novel Indicator to Predict Anticancer Drug Efficacy. BMC Cancer (2019) 19(1):1224. doi: 10.1186/s12885-019-6438-y
58. Youle RJ, van der Bliek AM. Mitochondrial Fission, Fusion, and Stress. Science (2012) 337(6098):1062–65. doi: 10.1126/science.1219855
59. Stojanovski D, Koutsopoulos OS, Okamoto K, Ryan MT. Levels of Human Fis1 at the Mitochondrial Outer Membrane Regulate Mitochondrial Morphology. J Cell Sci (2004) 117(Pt 7):1201–10. doi: 10.1242/jcs.01058
60. Hermann GJ, Thatcher JW, Mills JP, Hales KG, Fuller MT, Nunnari J, et al. Mitochondrial Fusion in Yeast Requires the Transmembrane GTPase Fzo1p. J Cell Biol (1998) 143(2):359–73. doi: 10.1083/jcb.143.2.359
61. Pacheco-Velázquez SC, Robledo-Cadena DX, Hernández-Reséndiz I, Gallardo-Pérez JC, Moreno-Sánchez R, Rodríguez-Enríquez S. Energy Metabolism Drugs Block Triple Negative Breast Metastatic Cancer Cell Phenotype. Mol Pharm (2018) 15(6):2151–64. doi: 10.1021/acs.molpharmaceut.8b00015
62. Miller TL, Wolin MJ. Pathways of Acetate, Propionate, and Butyrate Formation by the Human Fecal Microbial Flora. Appl Environ Microbiol (1996) 62(5):1589–92. doi: 10.1128/AEM.62.5.1589-1592.1996
63. Schug ZT, Peck B, Jones DT, Zhang Q, Grosskurth S, Alam IS, et al. Acetyl-CoA Synthetase 2 Promotes Acetate Utilization and Maintains Cancer Cell Growth Under Metabolic Stress. Cancer Cell (2015) 27(1):57–71. doi: 10.1016/j.ccell.2014.12.002
64. Leschelle X, Delpal S, Goubern M, Blottière HM, Blachier F. Butyrate Metabolism Upstream and Downstream Acetyl-CoA Synthesis and Growth Control of Human Colon Carcinoma Cells. Eur J Biochem (2000) 267(21):6435–42. doi: 10.1046/j.1432-1327.2000.01731.x
65. Sun J, Bi L, Chi Y, Aoki K, Misumi J. Effect of Sodium Acetate on Cell Proliferation and Induction of Proinflammatory Cytokines: A Preliminary Evaluation. Food Chem Toxicol (2005) 43(12):1773–80. doi: 10.1016/j.fct.2005.05.020
66. Cai L, Sutter BM, Li B, Tu BP. Acetyl-CoA Induces Cell Growth and Proliferation by Promoting the Acetylation of Histones at Growth Genes. Mol Cell (2011) 42(4):426–37. doi: 10.1016/j.molcel.2011.05.004
67. Hu H, Zhu W, Qin J, Chen M, Gong L, Li L, et al. Acetylation of PGK1 Promotes Liver Cancer Cell Proliferation and Tumorigenesis. Hepatology (2017) 65(2):515–28. doi: 10.1002/hep.28887
68. Ferro S, Azevedo-Silva J, Casal M, Côrte-Real M, Baltazar F, Preto A. Characterization of Acetate Transport in Colorectal Cancer Cells and Potential Therapeutic Implications. Oncotarget (2016) 7(43):70639–53. doi: 10.18632/oncotarget.12156
69. Moffett JR, Puthillathu N, Vengilote R, Jaworski DM, Namboodiri AM. Acetate Revisited: A Key Biomolecule at the Nexus of Metabolism, Epigenetics, and Oncogenesis - Part 2: Acetate and ACSS2 in Health and Disease. Front Physiol (2020) 11:580171. doi: 10.3389/fphys.2020.580171
70. Soloviev D, Fini A, Chierichetti F, Al-Nahhas A, Rubello D. PET Imaging With 11C-Acetate in Prostate Cancer: A Biochemical, Radiochemical and Clinical Perspective. Eur J Nucl Med Mol Imaging (2008) 35(5):942–49. doi: 10.1007/s00259-007-0662-4
71. Chang KP, Wu CC, Chen HC, Chen SJ, Peng PH, Tsang NM, et al. Identification of Candidate Nasopharyngeal Carcinoma Serum Biomarkers by Cancer Cell Secretome and Tissue Transcriptome Analysis: Potential Usage of Cystatin A for Predicting Nodal Stage and Poor Prognosis. Proteomics (2010) 10(14):2644–60. doi: 10.1002/pmic.200900620
72. Yun M, Bang SH, Kim JW, Park JY, Kim KS, Lee JD. The Importance of Acetyl Coenzyme A Synthetase for 11C-Acetate Uptake and Cell Survival in Hepatocellular Carcinoma. J Nucl Med (2009) 50(8):1222–28. doi: 10.2967/jnumed.109.062703
73. Crabtree B, Gordon MJ, Christie SL. Measurement of the Rates of Acetyl-CoA Hydrolysis and Synthesis From Acetate in Rat Hepatocytes and the Role of These Fluxes in Substrate Cycling. Biochem J (1990) 270(1):219–25. doi: 10.1042/bj2700219
74. Hirschey MD, Shimazu T, Capra JA, Pollard KS, Verdin E. SIRT1 and SIRT3 Deacetylate Homologous Substrates: AceCS1,2 and HMGCS1,2. Aging (Albany NY) (2011) 3(6):635–42. doi: 10.18632/aging.100339
75. Moreno-Sánchez R, Saavedra E, Gallardo-Pérez JC, Rumjanek FD, Rodríguez-Enríquez S. Understanding the Cancer Cell Phenotype Beyond the Limitations of Current Omics Analyses. FEBS J (2016) 283(1):54–73. doi: 10.1111/febs.13535
76. Koselny K, Green J, Favazzo L, Glazier VE, DiDone L, Ransford S, et al. Antitumor/Antifungal Celecoxib Derivative AR-12 Is a Non-Nucleoside Inhibitor of the ANL-Family Adenylating Enzyme Acetyl CoA Synthetase. ACS Infect Dis (2016) 2(4):268–80. doi: 10.1021/acsinfecdis.5b00134
77. Liang MH, Qv XY, Jin HH, Jiang JG. Characterization and Expression of AMP-Forming Acetyl-CoA Synthetase From Dunaliella Tertiolecta and its Response to Nitrogen Starvation Stress. Sci Rep (2016) 6:23445. doi: 10.1038/srep23445
78. Knowles SE, Jarrett IG, Filsell OH, Ballard FJ. Production and Utilization of Acetate in Mammals. Biochem J (1974) 142(2):401–11. doi: 10.1042/bj1420401
79. Chekulayev V, Mado K, Shevchuk I, Koit A, Kaldma A, Klepinin A, et al. Metabolic Remodeling in Human Colorectal Cancer and Surrounding Tissues: Alterations in Regulation of Mitochondrial Respiration and Metabolic Fluxes. Biochem Biophys Rep (2015) 4:111–25. doi: 10.1016/j.bbrep.2015.08.020
80. Sun X, Zhan L, Chen Y, Wang G, He L, Wang Q, et al. Increased mtDNA Copy Number Promotes Cancer Progression by Enhancing Mitochondrial Oxidative Phosphorylation in Microsatellite-Stable Colorectal Cancer. Signal Transduct Target Ther (2018) 3:8. doi: 10.1038/s41392-018-0011-z
81. Hu J, Kyrou I, Tan BK, Dimitriadis GK, Ramanjaneya M, Tripathi G, et al. Short-Chain Fatty Acid Acetate Stimulates Adipogenesis and Mitochondrial Biogenesis Via GPR43 in Brown Adipocytes. Endocrinology (2016) 157(5):1881–94. doi: 10.1210/en.2015-1944
82. Hu S, Kuwabara R, de Haan BJ, Smink AM, de Vos P. Acetate and Butyrate Improve β-Cell Metabolism and Mitochondrial Respiration Under Oxidative Stress. Int J Mol Sci (2020) 21(4):1542. doi: 10.3390/ijms21041542
83. Feng S, Xiong L, Ji Z, Cheng W, Yang H. Correlation Between Increased Copy Number of Mitochondrial DNA and Clinicopathological Stage in Colorectal Cancer. Oncol Lett (2011) 2(5):899–903. doi: 10.3892/ol.2011.322
84. Anderson KA, Hirschey MD. Mitochondrial Protein Acetylation Regulates Metabolism. Essays Biochem (2012) 52:23–35. doi: 10.1042/bse0520023
85. Hallows WC, Lee S, Denu JM. Sirtuins Deacetylate and Activate Mammalian Acetyl-CoA Synthetases. Proc Natl Acad Sci U S A (2006) 103(27):10230–35. doi: 10.1073/pnas.0604392103
86. Still AJ, Floyd BJ, Hebert AS, Bingman CA, Carson JJ, Gunderson DR, et al. Quantification of Mitochondrial Acetylation Dynamics Highlights Prominent Sites of Metabolic Regulation. J Biol Chem (2013) 288(36):26209–19. doi: 10.1074/jbc.M113.483396
87. You D, Yao LL, Huang D, Escalante-Semerena JC, Ye BC. Acetyl Coenzyme A Synthetase Is Acetylated on Multiple Lysine Residues by a Protein Acetyltransferase With a Single Gcn5-Type N-Acetyltransferase (GNAT) Domain in Saccharopolyspora Erythraea. J Bacteriol (2014) 196(17):3169–78. doi: 10.1128/JB.01961-14
88. Wang S, Jiang B, Zhang T, Liu L, Wang Y, Wang Y, et al. Correction: Insulin and mTOR Pathway Regulate HDAC3-Mediated Deacetylation and Activation of PGK1. PloS Biol (2015) 13(11):e1002287. doi: 10.1371/journal.pbio.1002287
89. Rodríguez-Enríquez S, Vital-González PA, Flores-Rodríguez FL, Marín-Hernández A, Ruiz-Azuara L, Moreno-Sánchez R. Control of Cellular Proliferation by Modulation of Oxidative Phosphorylation in Human and Rodent Fast-Growing Tumor Cells. Toxicol Appl Pharmacol (2006) 215(2):208–17. doi: 10.1016/j.taap.2006.02.005
90. Hinnebusch BF, Meng S, Wu JT, Archer SY, Hodin RA. The Effects of Short-Chain Fatty Acids on Human Colon Cancer Cell Phenotype Are Associated With Histone Hyperacetylation. J Nutr (2002) 132(5):1012–17. doi: 10.1093/jn/132.5.1012
91. Chen R, Xu M, Nagati JS, Hogg RT, Das A, Gerard RD, et al. The Acetate/ACSS2 Switch Regulates HIF-2 Stress Signaling in the Tumor Cell Microenvironment. PloS One (2015) 10(2):e0116515. doi: 10.1371/journal.pone.0116515
92. Sánchez-Aragó M, Chamorro M, Cuezva JM. Selection of Cancer Cells With Repressed Mitochondria Triggers Colon Cancer Progression. Carcinogenesis (2010) 31(4):567–76. doi: 10.1093/carcin/bgq012
93. Baeza J, Smallegan MJ, Denu JM. Mechanisms and Dynamics of Protein Acetylation in Mitochondria. Trends Biochem Sci (2016) 41(3):231–44. doi: 10.1016/j.tibs.2015.12.006
94. Thangaraju M, Carswell KN, Prasad PD, Ganapathy V. Colon Cancer Cells Maintain Low Levels of Pyruvate to Avoid Cell Death Caused by Inhibition of HDAC1/HDAC3. Biochem J (2009) 417(1):379–89. doi: 10.1042/BJ20081132
95. Moosavi A, Motevalizadeh Ardekani A. Role of Epigenetics in Biology and Human Diseases. Iran BioMed J (2016) 20(5):246–58. doi: 10.22045/ibj.2016.01
96. Semple TU, Quinn LA, Woods LK, Moore GE. Tumor and Lymphoid Cell Lines From a Patient With Carcinoma of the Colon for a Cytotoxicity Model. Cancer Res (1978) 38(5):1345–55.
97. Brattain MG, Fine WD, Khaled FM, Thompson J, Brattain DE. Heterogeneity of Malignant Cells From a Human Colonic Carcinoma. Cancer Res (1981) 41(5):1751–56.
98. Abu el Maaty M, Strassburger W, Qaiser T, Dabiri Y, Wölfl S. Differences in P53 Status Significantly Influence the Cellular Response and Cell Survival to 1,25-Dihydroxyvitamin D3-Metformin Cotreatment in Colorectal Cancer Cells. Mol Carcinog (2017) 56(11):2486–98. doi: 10.1002/mc.22696
99. Blandino G, Levine AJ, Oren M. Mutant P53 Gain of Function: Differential Effects of Different P53 Mutants on Resistance of Cultured Cells to Chemotherapy. Oncogene (1999) 18(2):477–85. doi: 10.1038/sj.onc.1202314
100. Mariadason JM, Arango D, Shi Q, Wilson AJ, Corner GA, Nicholas C, et al. Gene Expression Profiling-Based Prediction of Response of Colon Carcinoma Cells to 5-Fluorouracil and Camptothecin. Cancer Res (2003) 63(24):8791–812.
101. Liu X, Cooper DE, Cluntun AA, Warmoes MO, Zhao S, Reid MA, et al. Acetate Production From Glucose and Coupling to Mitochondrial Metabolism in Mammals. Cell (2018) 175(2):502–13.e13. doi: 10.1016/j.cell.2018.08.040
102. Hague A, Manning AM, Hanlon KA, Huschtscha LI, Hart D, Paraskeva C. Sodium Butyrate Induces Apoptosis in Human Colonic Tumour Cell Lines in a P53-Independent Pathway: Implications for the Possible Role of Dietary Fibre in the Prevention of Large-Bowel Cancer. Int J Cancer (1993) 55(3):498–505. doi: 10.1002/ijc.2910550329
103. Heerdt BG, Houston MA, Augenlicht LH. Potentiation by Specific Short-Chain Fatty Acids of Differentiation and Apoptosis in Human Colonic Carcinoma Cell Lines. Cancer Res (1994) 54(12):3288–93.
104. Blottière HM, Buecher B, Galmiche JP, Cherbut C. Molecular Analysis of the Effect of Short-Chain Fatty Acids on Intestinal Cell Proliferation. Proc Nutr Soc (2003) 62(1):101–06. doi: 10.1079/PNS2002215
105. Lazarova DL, Bordonaro M. Extreme Fluctuations in Wnt/beta-Catenin Signaling as an Approach for Colon Cancer Prevention and Therapy. Adv Study Biol (2012) 4(8):351–62.
106. Tang Y, Chen Y, Jiang H, Nie D. Short-Chain Fatty Acids Induced Autophagy Serves as an Adaptive Strategy for Retarding Mitochondria-Mediated Apoptotic Cell Death. Cell Death Differ (2011) 18(4):602–18. doi: 10.1038/cdd.2010.117
107. Pant K, Saraya A, Venugopal SK. Oxidative Stress Plays a Key Role in Butyrate-Mediated Autophagy Via Akt/mTOR Pathway in Hepatoma Cells. Chem Biol Interact (2017) 273:99–106. doi: 10.1016/j.cbi.2017.06.001
108. Zeng H, Briske-Anderson M. Prolonged Butyrate Treatment Inhibits the Migration and Invasion Potential of HT1080 Tumor Cells. J Nutr (2005) 135(2):291–95. doi: 10.1093/jn/135.2.291
109. Xiao X, Cao Y, Chen H. Profiling and Characterization of microRNAs Responding to Sodium Butyrate Treatment in A549 Cells. J Cell Biochem (2018) 119(4):3563–73. doi: 10.1002/jcb.26547
110. Li Q, Ding C, Meng T, Lu W, Liu W, Hao H, et al. Butyrate Suppresses Motility of Colorectal Cancer Cells Via Deactivating Akt/ERK Signaling in Histone Deacetylase Dependent Manner. J Pharmacol Sci (2017) 135(4):148–55. doi: 10.1016/j.jphs.2017.11.004
111. Yoshii Y, Furukawa T, Yoshii H, Mori T, Kiyono Y, Waki A, et al. Cytosolic Acetyl-CoA Synthetase Affected Tumor Cell Survival Under Hypoxia: The Possible Function in Tumor Acetyl-CoA/acetate Metabolism. Cancer Sci (2009) 100(5):821–27. doi: 10.1111/j.1349-7006.2009.01099.x
112. Yao L, Guo X, Gui Y. Acetyl-CoA Synthetase 2 Promotes Cell Migration and Invasion of Renal Cell Carcinoma by Upregulating Lysosomal-Associated Membrane Protein 1 Expression. Cell Physiol Biochem (2018) 45(3):984–92. doi: 10.1159/000487293
113. Sahuri-Arisoylu M, Brody LP, Parkinson JR, Parkes H, Navaratnam N, Miller AD, et al. Reprogramming of Hepatic Fat Accumulation and ‘Browning’ of Adipose Tissue by the Short-Chain Fatty Acid Acetate. Int J Obes (Lond) (2016) 40(6):955–63. doi: 10.1038/ijo.2016.23
114. Yu T, Cui L, Liu C, Wang G, Wu T, Huang Y. Expression of Acetyl Coenzyme A Synthetase 2 in Colorectal Cancer and its Biological Role. Zhonghua Wei Chang Wai Ke Za Zhi (2017) 20(10):1174–79. doi: 10.3760/cma.j.issn.1671-0274.2017.10.018
115. Zhang J, Duan H, Feng Z, Han X, Gu C. Acetyl-CoA Synthetase 3 Promotes Bladder Cancer Cell Growth Under Metabolic Stress. Oncogenesis (2020) 9(5):46. doi: 10.1038/s41389-020-0230-3
116. Bjerrum JT, Wang Y, Hao F, Coskun M, Ludwig C, Günther U, et al. Metabonomics of Human Fecal Extracts Characterize Ulcerative Colitis, Crohn’s Disease and Healthy Individuals. Metabolomics (2015) 11:122–33. doi: 10.1007/s11306-014-0677-3
117. Maffeis V, Nicolè L, Cappellesso R. RAS, Cellular Plasticity, and Tumor Budding in Colorectal Cancer. Front Oncol (2019) 9:1255. doi: 10.3389/fonc.2019.01255
118. Jacobs RA, Díaz V, Meinild AK, Gassmann M, Lundby C. The C57Bl/6 Mouse Serves as a Suitable Model of Human Skeletal Muscle Mitochondrial Function. Exp Physiol (2013) 98(4):908–21. doi: 10.1113/expphysiol.2012.070037
119. McIntyre RE, Buczacki SJ, Arends MJ, Adams DJ. Mouse Models of Colorectal Cancer as Preclinical Models. Bioessays (2015) 37(8):909–20. doi: 10.1002/bies.201500032
Keywords: acetate thiokinase, cancer biomarker, colon cancer, acetylation, oxidative phoshorylation
Citation: Rodríguez-Enríquez S, Robledo-Cadena DX, Gallardo-Pérez JC, Pacheco-Velázquez SC, Vázquez C, Saavedra E, Vargas-Navarro JL, Blanco-Carpintero BA, Marín-Hernández Á, Jasso-Chávez R, Encalada R, Ruiz-Godoy L, Aguilar-Ponce JL and Moreno-Sánchez R (2021) Acetate Promotes a Differential Energy Metabolic Response in Human HCT 116 and COLO 205 Colon Cancer Cells Impacting Cancer Cell Growth and Invasiveness. Front. Oncol. 11:697408. doi: 10.3389/fonc.2021.697408
Received: 19 April 2021; Accepted: 15 July 2021;
Published: 03 August 2021.
Edited by:
Federica Sotgia, University of Salford, United KingdomReviewed by:
Hsueh-Wei Chang, Kaohsiung Medical University, TaiwanShona Mookerjee, Touro University California, United States
Copyright © 2021 Rodríguez-Enríquez, Robledo-Cadena, Gallardo-Pérez, Pacheco-Velázquez, Vázquez, Saavedra, Vargas-Navarro, Blanco-Carpintero, Marín-Hernández, Jasso-Chávez, Encalada, Ruiz-Godoy, Aguilar-Ponce and Moreno-Sánchez. This is an open-access article distributed under the terms of the Creative Commons Attribution License (CC BY). The use, distribution or reproduction in other forums is permitted, provided the original author(s) and the copyright owner(s) are credited and that the original publication in this journal is cited, in accordance with accepted academic practice. No use, distribution or reproduction is permitted which does not comply with these terms.
*Correspondence: Sara Rodríguez-Enríquez, sara.rodriguez@cardiologia.org.mx; saren960104@hotmail.com; Rafael Moreno-Sánchez, rafael.moreno@cardiologia.org.mx