 Zhenyu Yang
 Yulan Deng
 Jiahan Cheng1,2
 Lunxu Liu
- 1Institute of Thoracic Oncology and Department of Thoracic Surgery, West China Hospital, Sichuan University, Chengdu, China
- 2Western China Collaborative Innovation Center for Early Diagnosis and Multidisciplinary Therapy of Lung Cancer, Sichuan University, Chengdu, China
Background: Stratification of patients who could benefit from immune checkpoint inhibitor (ICI) therapy is of much importance. PD-1hiCD8+ T cells represent a newly identified and effective biomarker for ICI therapy response biomarker in lung cancer. Accurately quantifying these T cells using commonly available RNA sequencing (RNA-seq) data may extend their applications to more cancer types.
Method: We built a transcriptome signature of PD-1hiCD8+ T cells from bulk RNA-seq and single-cell RNA-seq (scRNA-seq) data of tumor-infiltrating immune cells. The signature was validated by flow cytometry and in independent datasets. The clinical applications of the signature were explored in non-small-cell lung cancer, melanoma, gastric cancer, urothelial cancer, and a mouse model of breast cancer samples treated with ICI, and systematically evaluated across 21 cancer types in The Cancer Genome Atlas (TCGA). Its associations with other biomarkers were also determined.
Results: Signature scores could be used to identify the PD-1hiCD8+ T subset and were correlated with the fraction of PD-1hiCD8+ T cells in tumor tissue (Pearson correlation, R=0.76, p=0.0004). Furthermore, in the scRNA-seq dataset, we confirmed the capability of PD-1hiCD8+ T cells to secrete CXCL13, as well as their interactions with other immune cells. In 581 clinical samples and 204 mouse models treated with ICIs, high signature scores were associated with increased survival, and the signature achieved area under the receiver operating characteristic curve scores of 0.755 (ranging from 0.61 to 0.91) in predicting therapy response. In TCGA pan-cancer datasets, our signature scores were consistently correlated with therapy response (R=0.78, p<0.0001) and partially explained the diverse response rates among different cancer types. Finally, our signature generally outperformed other mRNA-based predictors and showed improved predictive performance when used in combination with tumor mutational burden (TMB). The signature score is available in the R package “PD1highCD8Tscore” (https://github.com/Liulab/PD1highCD8Tscore).
Conclusion: Through estimating the fraction of the PD-1hiCD8+ T cell, our signature could predict response to ICI therapy across multiple cancers and could serve as a complementary biomarker to TMB.
Introduction
Genomic alterations in malignant tumors distinguish them from normal cells and produce persistent antigenic stimulation, thereby suppressing T cell functions (1–3). Immune checkpoint inhibitors (ICIs) successfully reinvigorate T cell functions and have led to impressive progress in the treatment of non-small-cell lung cancer (NSCLC), melanoma, and urothelial cancer, especially in the advanced stages (4–6). However, only a limited proportion of patients receiving ICI therapy have superior clinical outcomes across various cancer types. To solve this problem, several biomarkers have been identified in recent years, including tumor mutational burden (TMB), tumor-neoantigen burden, programmed cell death protein 1 (PD-1) or programmed cell death ligand 1 (PD-L1) expression level, interferon-gamma (IFNγ) signature, and CD8+ T cell infiltration (7–11). Although these factors are related to the effectiveness of ICIs, their predictive power is not sufficient (9, 12), nor do they fully explain the mechanism of resistance to ICIs. There is thus an urgent need for new biomarkers that can be used to identify patients sensitive to ICI therapy
PD-1hiCD8+ T cells represent a distinct population of CD8+ T cells, which are upregulated in T-cell-exhaustion and cell proliferation process (13). A recent retrospective analysis used immunohistochemistry (IHC) assays to estimate the fraction of PD-1hiCD8+ T cells in the tumor microenvironment (TME) and demonstrated that this was positively associated with treatment response and patient survival in cases of NSCLC treated with PD-1 blockade (13). This finding raised the question of whether the predictive value of PD-1hiCD8+ T cells could be extrapolated to other cancer types. Commonly available datasets such as RNA sequencing (RNA-seq) datasets could help to settle this issue. Therefore, we built a transcriptional signature for PD-1hiCD8+ T cells, validated its ability to quantify such cells in the TME, and further explored its predictive performance with respect to ICI therapy outcomes across multiple cancer types.
Materials and Methods
Data Collection
We identified ICI-treated patients with available RNA-seq data from the Gene Expression Omnibus (GEO, https://www.ncbi.nlm.nih.gov/geo/) and Sequence Read Archive (SRA, https://www.ncbi.nlm.nih.gov/sra/) databases. Data from The Cancer Genome Atlas (TCGA, http://cancergenome.nih.gov/;legacy archive, version 2016_01_28) were downloaded from FIREBROWSE (http://firebrowse.org/). All the deposited datasets are summarized in Table 1.
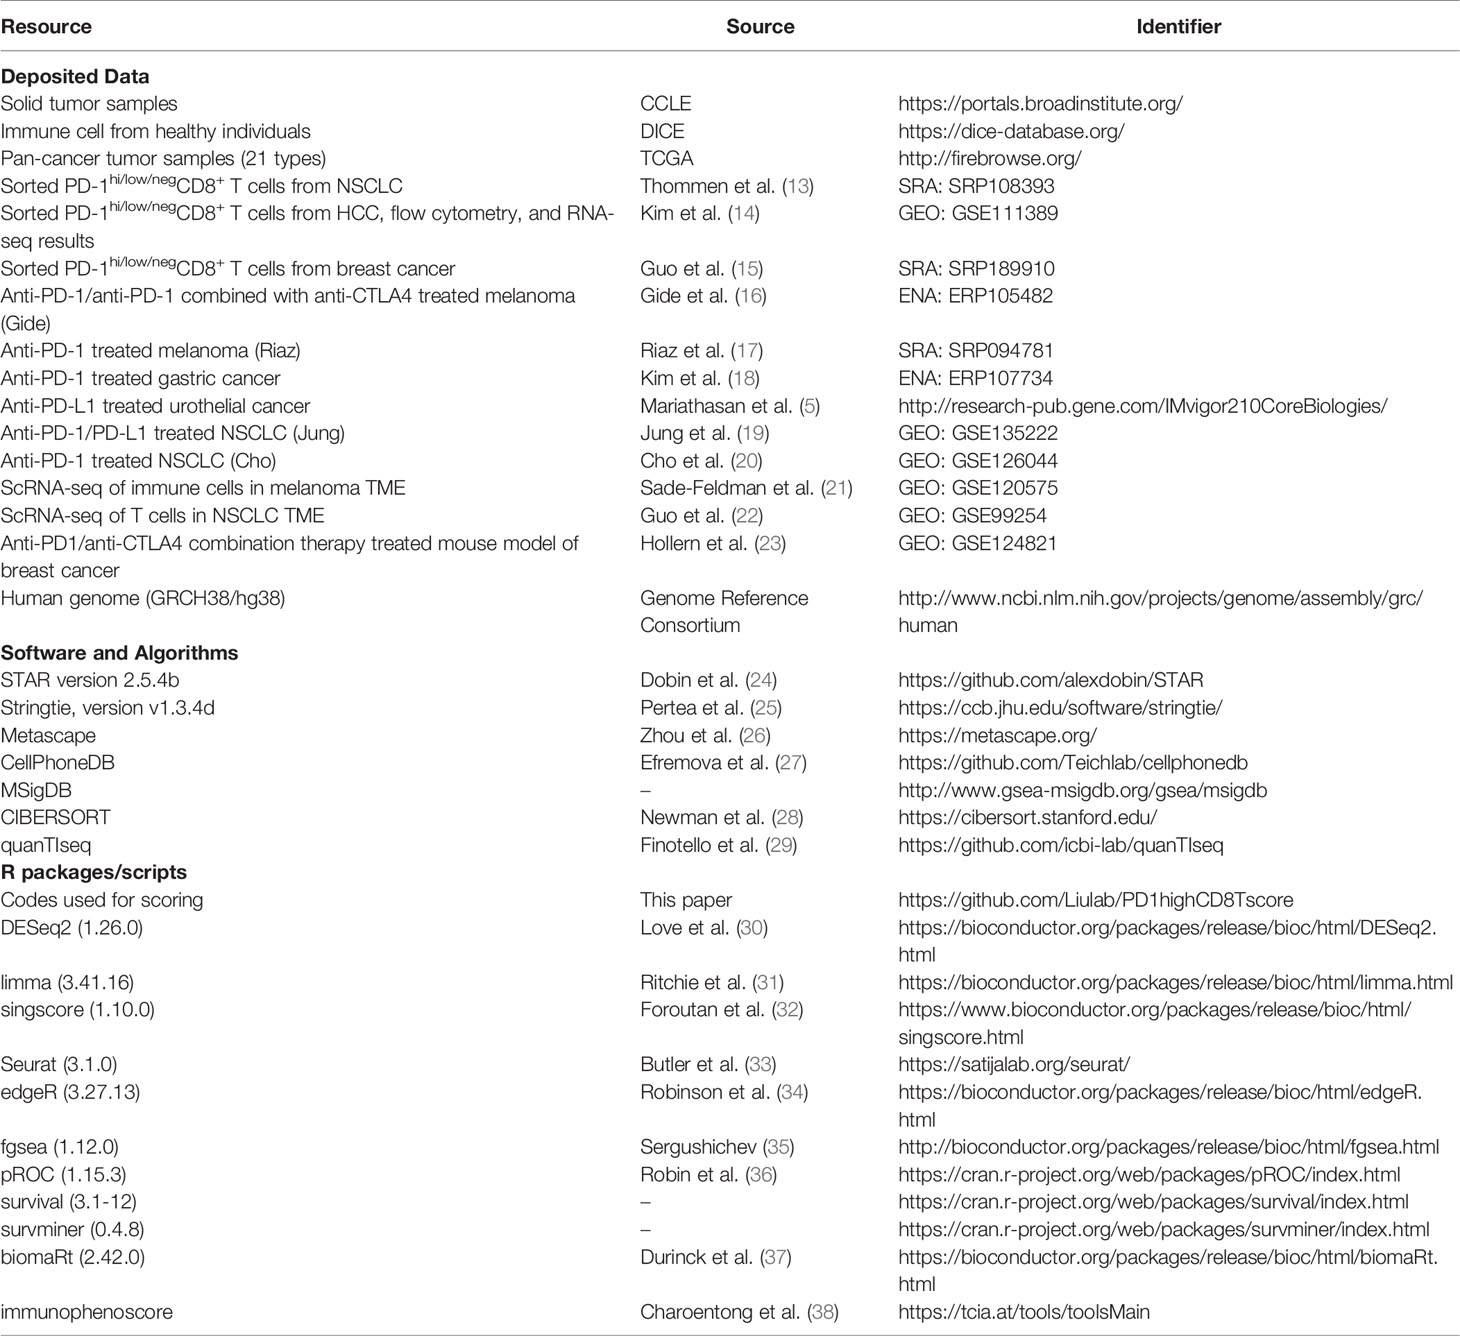
Table 1 Key resource table.
Identification of Differentially Expressed Genes
The RNA-seq data were aligned to the human genome (GRCH38/hg38) using the STAR (24) version 2.5.4b 2-pass mapping strategy. Transcript assembly and gene level quantification were performed using StringTie version v1.3.4d (25). DEGs were identified using DESeq2 (30) (version 1.26.0). Genes were considered to be DEGs based on adjusted p value (p.adj) < 0.05 and |log2 [fold change (FC)] | >1.
Construction of Gene Signature for PD-1hiCD8+ T Cells
The workflow followed to build the signature building is described in Figure 1 (left). First, we combined CD8+-T-cell-specific genes from Schmiedel et al. (39) with PD-1hiCD8+-T-cell-specific genes from NSCLC tumor-infiltrating lymphocytes (TILs) (13). In the latter case, PD-1hiCD8+-T-cell-specific genes were defined as genes that were significantly upregulated in PD-1hiCD8+ T cells compared with other CD8+ T cells. Second, we excluded genes that were highly expressed in solid tumors using expression data from The Cancer Cell Line Encyclopedia (CCLE, https://portals.broadinstitute.org/ccle). Genes were retained if their median expression (log transcripts per million [TPM]) in cancer cells was below 3.1. Third, to determine the optimal threshold for filtering low expression genes in PD-1hiCD8+ T cells, we scanned a range of cutoffs to select top genes as input for unsupervised hierarchical clustering (from 20% to 80%, with 20% increments). We found that the top 60% genes were sufficient to distinguish PD-1hiCD8+ T cells from other CD8+ T cells and kept them as the initial gene set. The signature scores were calculated by singscore (32), where the background gene set was selected as genes with mean TPM>1 in TCGA samples (21 cancer types). When calculating the signature score of the initial gene set in a single-cell RNA-seq(scRNA-seq) dataset (GSE120575) (21), we found that a cluster of CD8+ T cells resembled PD-1hiCD8+ T cells from NSCLC TILs (13). Therefore, we kept the cluster marker genes from the initial signature genes and got a reduced final signature. The discrimination abilities of the initial and final gene signature scores were compared using the area under the receiver operation characteristic curve (AUC). Finally, we supplied an easy-to-use R package “PD1highCD8Tscore” to calculate our signature score.
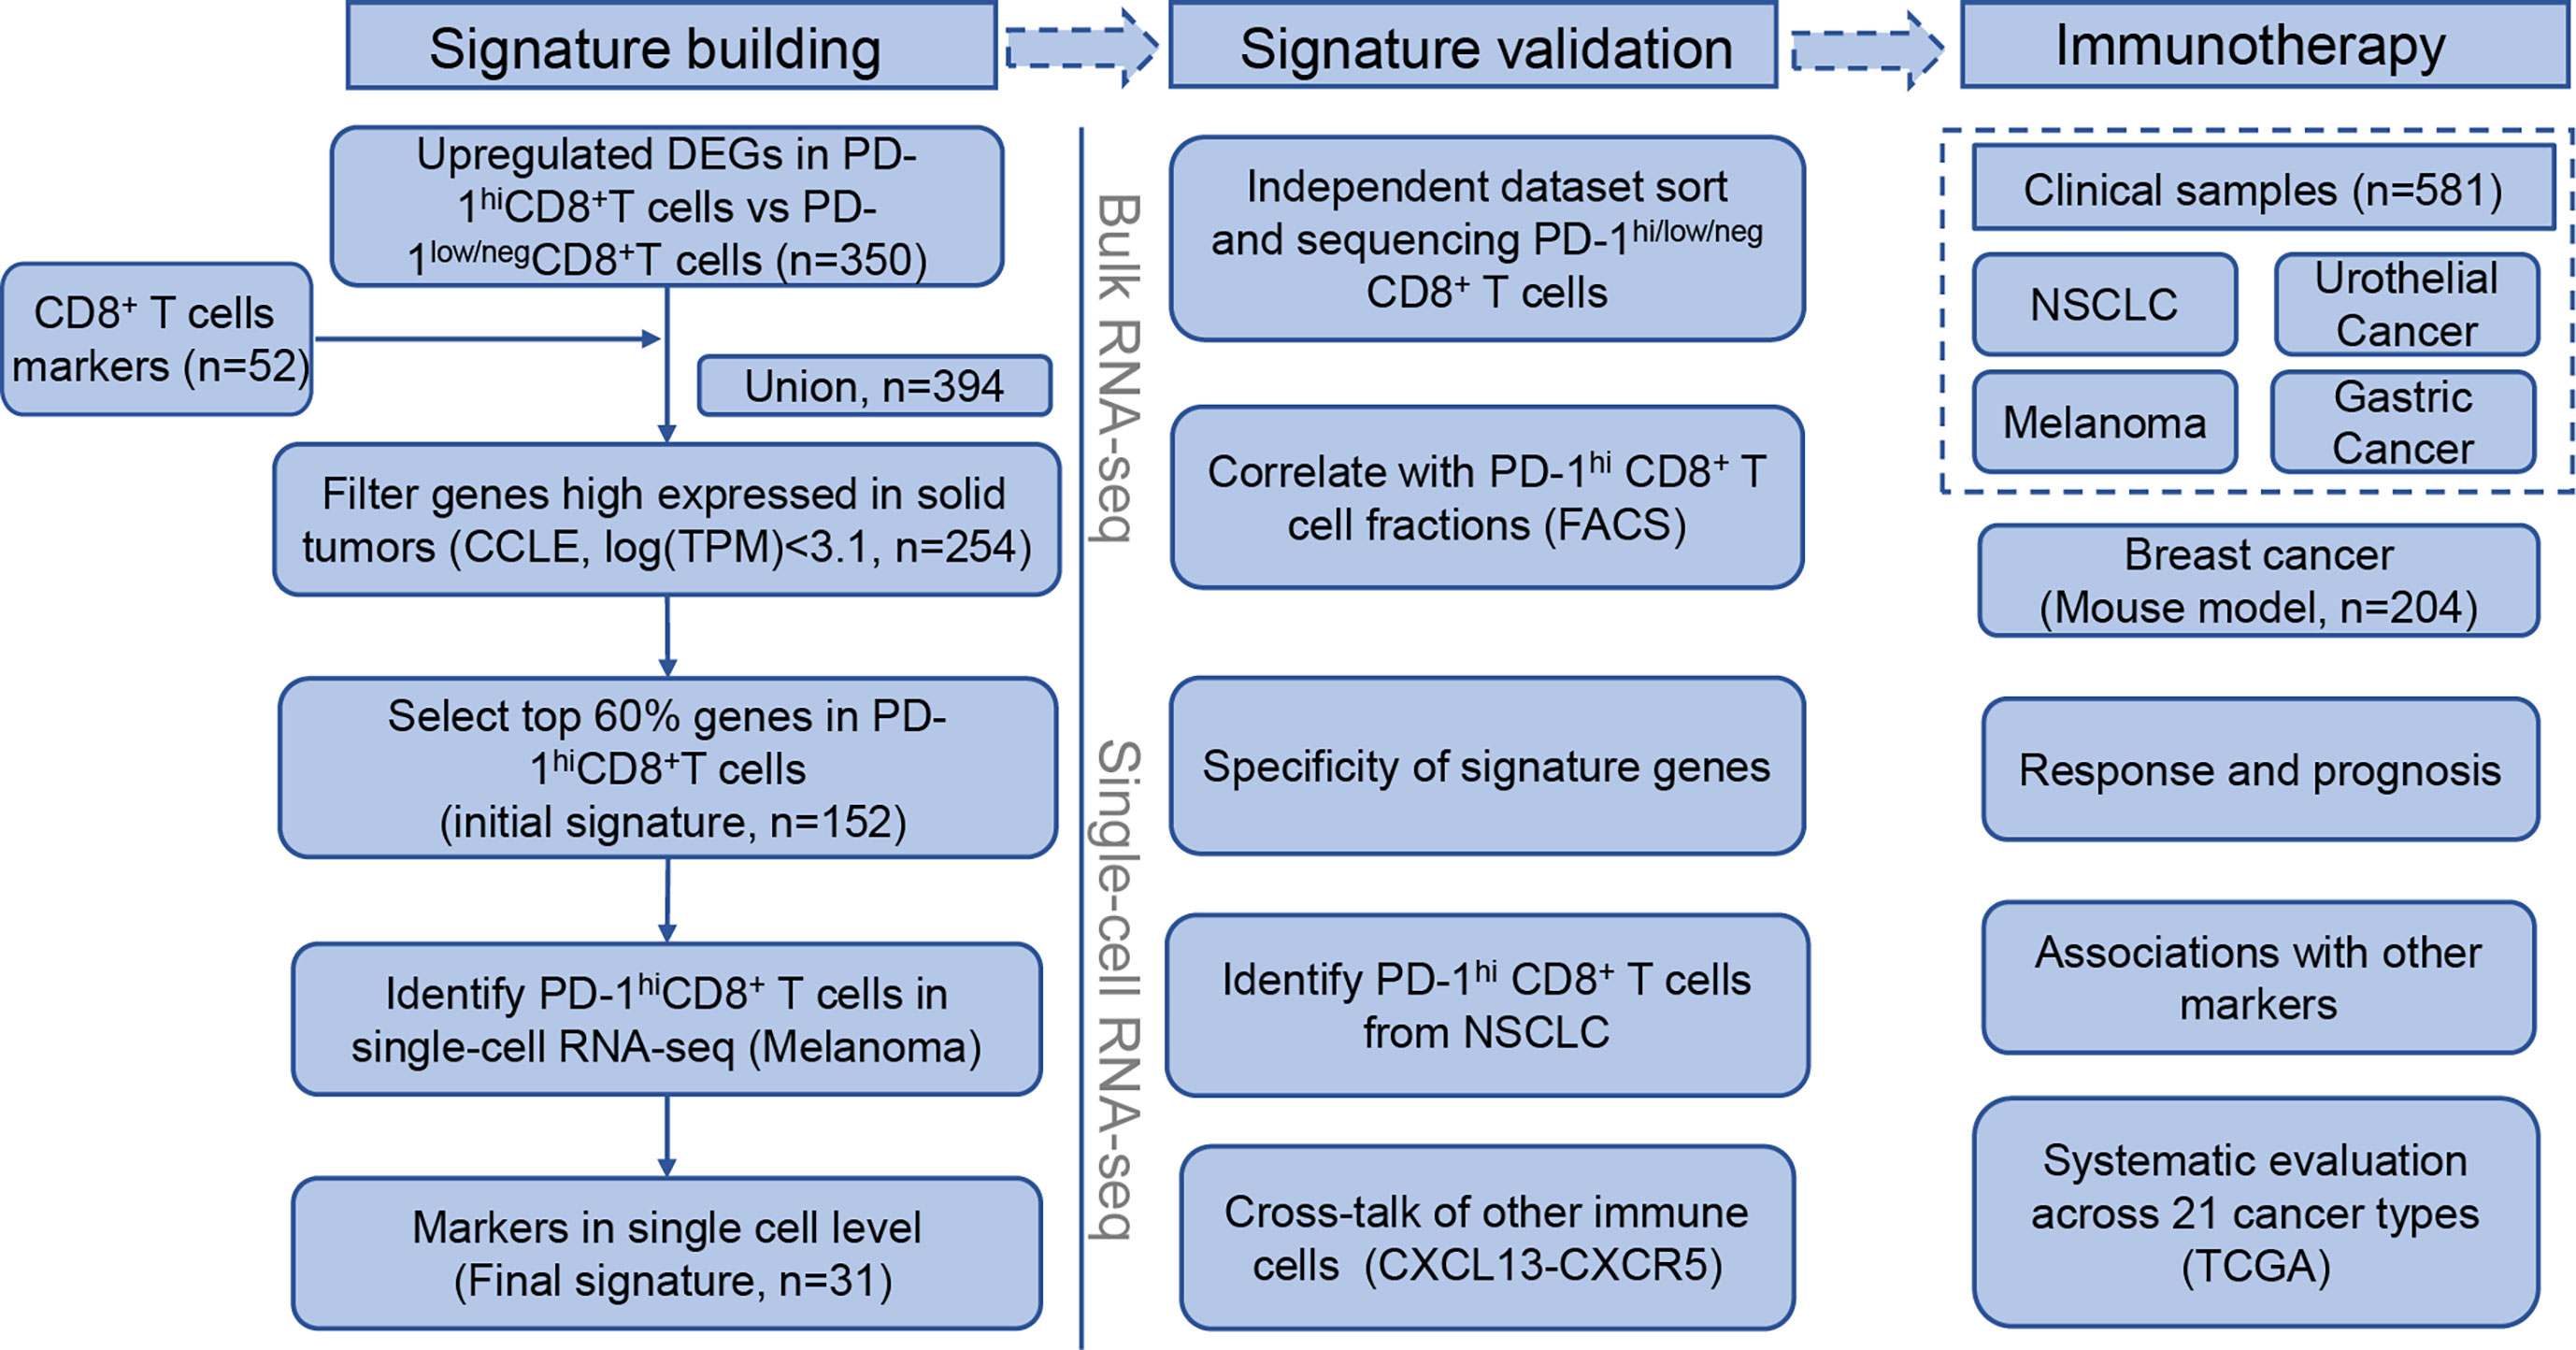
Figure 1 Flowchart of PD-1hiCD8+ T cells signature building, validation, and clinical implications in immune checkpoint inhibitor therapy.
Signature Validation
To explore whether the signature genes were specific to PD-1hiCD8+ T cells, we compared the expression levels of signature genes between PD-1hiCD8+ T cells and other immune cells in an external dataset (39) after normalization by 15 house-keeping genes (RPL38, UBA52, RPL4, RPS29, SLC25A3, CLTC, RPL37, PSMA1, RPL8, PPP2CA, TXNL1, MMADHC, PSMC1, RPL13A, and MRFAP1) (40). Two previous studies also sorted and sequenced PD-1hi/low/negCD8+ T cells among hepatocellular carcinoma (HCC) and breast cancer TILs with a similar gating and sorting strategy (14, 15). To estimate whether our signature characterized similar cell populations in NSCLC, breast cancer, and HCC, we performed principal component analysis (PCA) and calculated the correlations between all cells after removing the batch effect using the “limma” package (31). Scores were calculated and compared in each bulk RNA-seq dataset. Moreover, we calculated the scores in 17 HCC tumor samples and analyzed the correlation between scores and the absolute fraction of PD-1hiCD8+ T cells. The absolute fraction of PD-1hi CD8+ T cells was defined as the product of the relative fraction of PD-1hi CD8+ T cells in CD8+ T cells and the fraction of CD8+ T cells in tumor samples. The former fraction was based on the flow cytometry results of Kim et al. (data were obtained by personal communications). The latter fraction was estimated by QuanTIseq (29).
We downloaded TPM data and/or count data and cell labels from two scRNA-seq (21, 22) datasets for immune cells. Cells with 1,000–5,000 detected genes and expressing <5% mitochondrial genes were retained. Standard procedures for variable gene selection, dimensionality reduction, and clustering were performed using Seurat version 3 (33), and the top 3,000 variable genes were selected. Signature scores were calculated based on TPM data. The cluster with the highest signature score was labeled the PD-1hiCD8+ T cell, and other clusters were labeled according to the original paper. Clustering results were visualized using uniform manifold approximation and projection. Differential expression test was performed using the “FindMarkers” function with Wilcoxon rank-sum test in genes expressed in at least 25% of cells using the default threshold (|logFC|>0.25). Gene ontology (GO) enrichment analyses were performed using Metascape (26) with p<0.01 and enrichment score >1.5. Cell–cell communication analysis was conducted using CellPhoneDB (27).
Signature Scores in ICI-Treated Patients and Mouse Models
We scored all ICI-treated samples (5, 16–20) and compared the differences between responders (durable clinical benefit, DCB) and nonresponders (nondurable benefit, NDB) by Wilcoxon rank-sum test. DCB was defined as complete response (CR), partial response (PR), or stable disease (SD) for more than 6 months. NDB was defined as progressive disease (PD) or SD for less than 6 months. In two studies (17, 18), no detailed information was available on DCB/NDB; therefore, we compared the CR/PR group with the PD group as a surrogate. In a mouse model of ICI-treated breast cancer (23), we used the “biomaRt” package (37) to convert genes from mouse to human and compared the scores between ICI-resistant and ICI-sensitive samples. The predictive value of the signature score in response for ICI therapy was evaluated by calculating AUC values (36). Patients with survival data available were divided into high and low score groups according to the Yuden index. Overall survival (OS) and progression-free survival (PFS) were estimated by Kaplan-Meier curves, and the log-rank test was used to compare Kaplan-Meier survival curves. A multivariable Cox proportional hazard model was built to correct the effects of potential confounding factors.
TCGA Data Processing
Reported objective response rates (ORRs) across 21 cancer types were obtained from Lee and Ruppin (9). We scored 6,764 samples from TCGA in the corresponding cancer types. We investigated the correlation of the proportion of high signature score samples in each cancer type with the response rate. DEGs between the samples with the top 33% and bottom 33% signature scores were detected by edgeR (34). The definition of DEGs was the same as that in Section 2.2. Kyoto Encyclopedia of Genes and Genomes (KEGG) gene sets from the Molecular Signatures Database (MSigDB, http://www.gsea-msigdb.org/gsea/msigdb) were scored for DEGs using gene set variation analysis (GSVA), where p<0.05 and |normalized enrichment score (NES)| >1 were considered to indicate significance.
Other ICI Therapy Biomarkers
We compared our signature with other predictive biomarkers for ICI. PD-L1 is an IHC biomarker approved by the Food and Drug Administration (FDA) (41). PD-L1 gene expression was used here as an IHC surrogate. PD-1 gene expression is also a predictor of ICI therapy response (7). IFNγ was found to be a response biomarker by Ayers et al. (10). The mean expression of six genes (IFNG, STAT1, IDO1, CXCL10, CXCL9, and HLA-DRA) in this pathway was used to estimate their performance (10). The score for Anti-CTLA4 resistance MAGE genes (CRMA) was calculated as the average of MAGEA3, MAGEA2, MAGEA2B, MAGEA12, and MAGEA6 (42). Immunophenoscore (IPS) was calculated using a script supplied by The Cancer Immunome Atlas (https://tcia.at/) (38). Tertiary lymphoid structure (TLS) signature genes were obtained from Cabrita et al. (43). CD8+ T cell proportions were estimated by CIBERSORT (28) (CD8+ T CIBERSROT). TMB was available for two cohorts. For Figures 6A, B, a logistic regression of TMB and signature score was used to assess the combined predictive value for ICI. In the survival analysis of Figures 6C–F, patients were divided into four groups, TMBhighScorehigh, TMBlowScorehigh, TMBhighScorelow, and TMBlowScorelow, according to their TMB and signature score. The cutoff was determined by the best Yuden index. Similarly, the effect of combination of PDL1 and our score was also analyzed.
Statistical Analysis
All the software packages and algorithms are summarized in Table 1. R version 3.5.1 was used for statistical analysis and visualization. The AUC was used to evaluate the predictive value of the signature score to ICI therapy. A two-sided Wilcoxon rank-sum test was used for between-group comparisons, and p-value<0.05 was regarded as statistically significant.
Results
Building the PD-1hiCD8+-T-Cell-Derived Signature
The flowchart of the process of building the PD-1hiCD8+-T-cell signature is depicted in Figure 1 (left). We first combined CD8+-T-cells-specific genes and DEGs in PD-1hiCD8+ T cells (Supplementary Figure 1), resulting in 394 genes. To identify immune-specific genes, the sequencing data of solid cancer from CCLE were downloaded, and 150 genes highly expressed (logTPM>3.1) in cancer cells were filtered. We selected the top 60% expressed genes in PD-1hiCD8+ T cells as an initial signature (152 genes), which were sufficient for clustering PD-1hiCD8+ T cells apart from PD-1low/negCD8+ T (Supplementary Figures 2, 3A, B). In a scRNA-seq dataset, we found a cluster of cells with a high initial signature score that exhibited a similar phenotype to that of PD-1hiCD8+ T cells (upregulated genes enriched in T cell exhaustion and cell proliferation/growth) (Supplementary Figures 4A, B). The common genes between the initial signature and marker genes of this cluster were considered as the final signature (31 genes, Table S1). The discrimination ability of the final signature was the same as that of the initial signature (AUC=1) (Supplementary Figures 3A, B). The signature included seven cell-cycle-associated genes (BARD1, CENPE, RAD51, SMC2, GINS2, CLSPN, and CCNF) and seven T-cell-exhaustion-associated genes (CTLA4, PDCD1, TOX, SIRPG, HAVCR2, TIGIT, and IGFLR1) (44, 45).
Validation of PD-1hiCD8+-T-Cell-Derived Signature
The PD-1hiCD8+-T-cell signature was validated in both bulk RNA-seq and scRNA-seq data (Figure 1, middle). In the bulk RNA-seq data (13, 39), we found that the signature score could discriminate PD-1hiCD8+ T cells from other immune cells collected from healthy individuals (p<0.0001), and the signature genes were relatively specific (Figures 2A, B). In two independent studies (14, 15), PD-1hi/low/negCD8+ T cells were also sorted and sequenced from HCC and breast cancer TILs by flow cytometry. The PCA and correlation results showed that the sorted PD-1hiCD8+ T cells had similar transcriptional features and were tissue-agnostic among lung, liver, and breast tissues (Supplementary Figures 3C, D). The PD-1hiCD8+ T cells had the highest signature score compared with other CD8+ T cells and were accurately identified by our score (AUC=1) (Figure 2C and Supplementary Figures 3A, B, E). The signature score was correlated with the fraction of PD-1hiCD8+ T cells in HCC tumor samples (Pearson correlation, R=0.76, p=0.0004, Figure 2D). Patients with high fractions of PD-1hiCD8+ T cells had higher scores than other patients (p=0.0009, Supplementary Figure 3F). In scRNA-seq data of melanoma TILs (21), the PD-1hiCD8+ T cells were identified by our score (Figure 2E and Supplementary Figure 4A), and most of the signature genes had higher expression values in this subset than other immune cells in the TME. (Figure 2F). Similar results were found in another scRNA-seq data of NSCLC TILs (Supplementary Figure 4C) (22). We identified a high-scoring subcluster of exhausted CD8+ T cells, with highly expressed genes enriched in cell proliferation/growth (Supplementary Figure 4B). GSVA analyses also confirmed that the cell cycle pathway was more activated in PD-1hiCD8+ T cells compared with other exhausted CD8+ T cell subsets with PD-1 expression (melanoma: NES=2.07, p.adj=0.0059; NSCLC: NES=1.98, p.adj=0.0130). Increased glycolysis (melanoma: p<0.0001; NSCLC: p<0.0001) and secretion of CXCL13 were found in (melanoma: logFC=1.22, p.adj<0.0001; NSCLC: logFC=0.85, p.adj<0.0001) PD-1hiCD8+ T cell, consistent with a previous report (Supplementary Figure 5) (13). The cell–cell interaction analysis using CellPhoneDB found that PD-1hiCD8+ T cells interacted with B cells (mean= 5.424, p<0.0001), regulatory T cell (mean= 3.801, p<0.0001), and cytotoxicity T cells (mean= 3.683, p<0.0001) through the CXCL13-CXCR5 axis (Figure 2G).
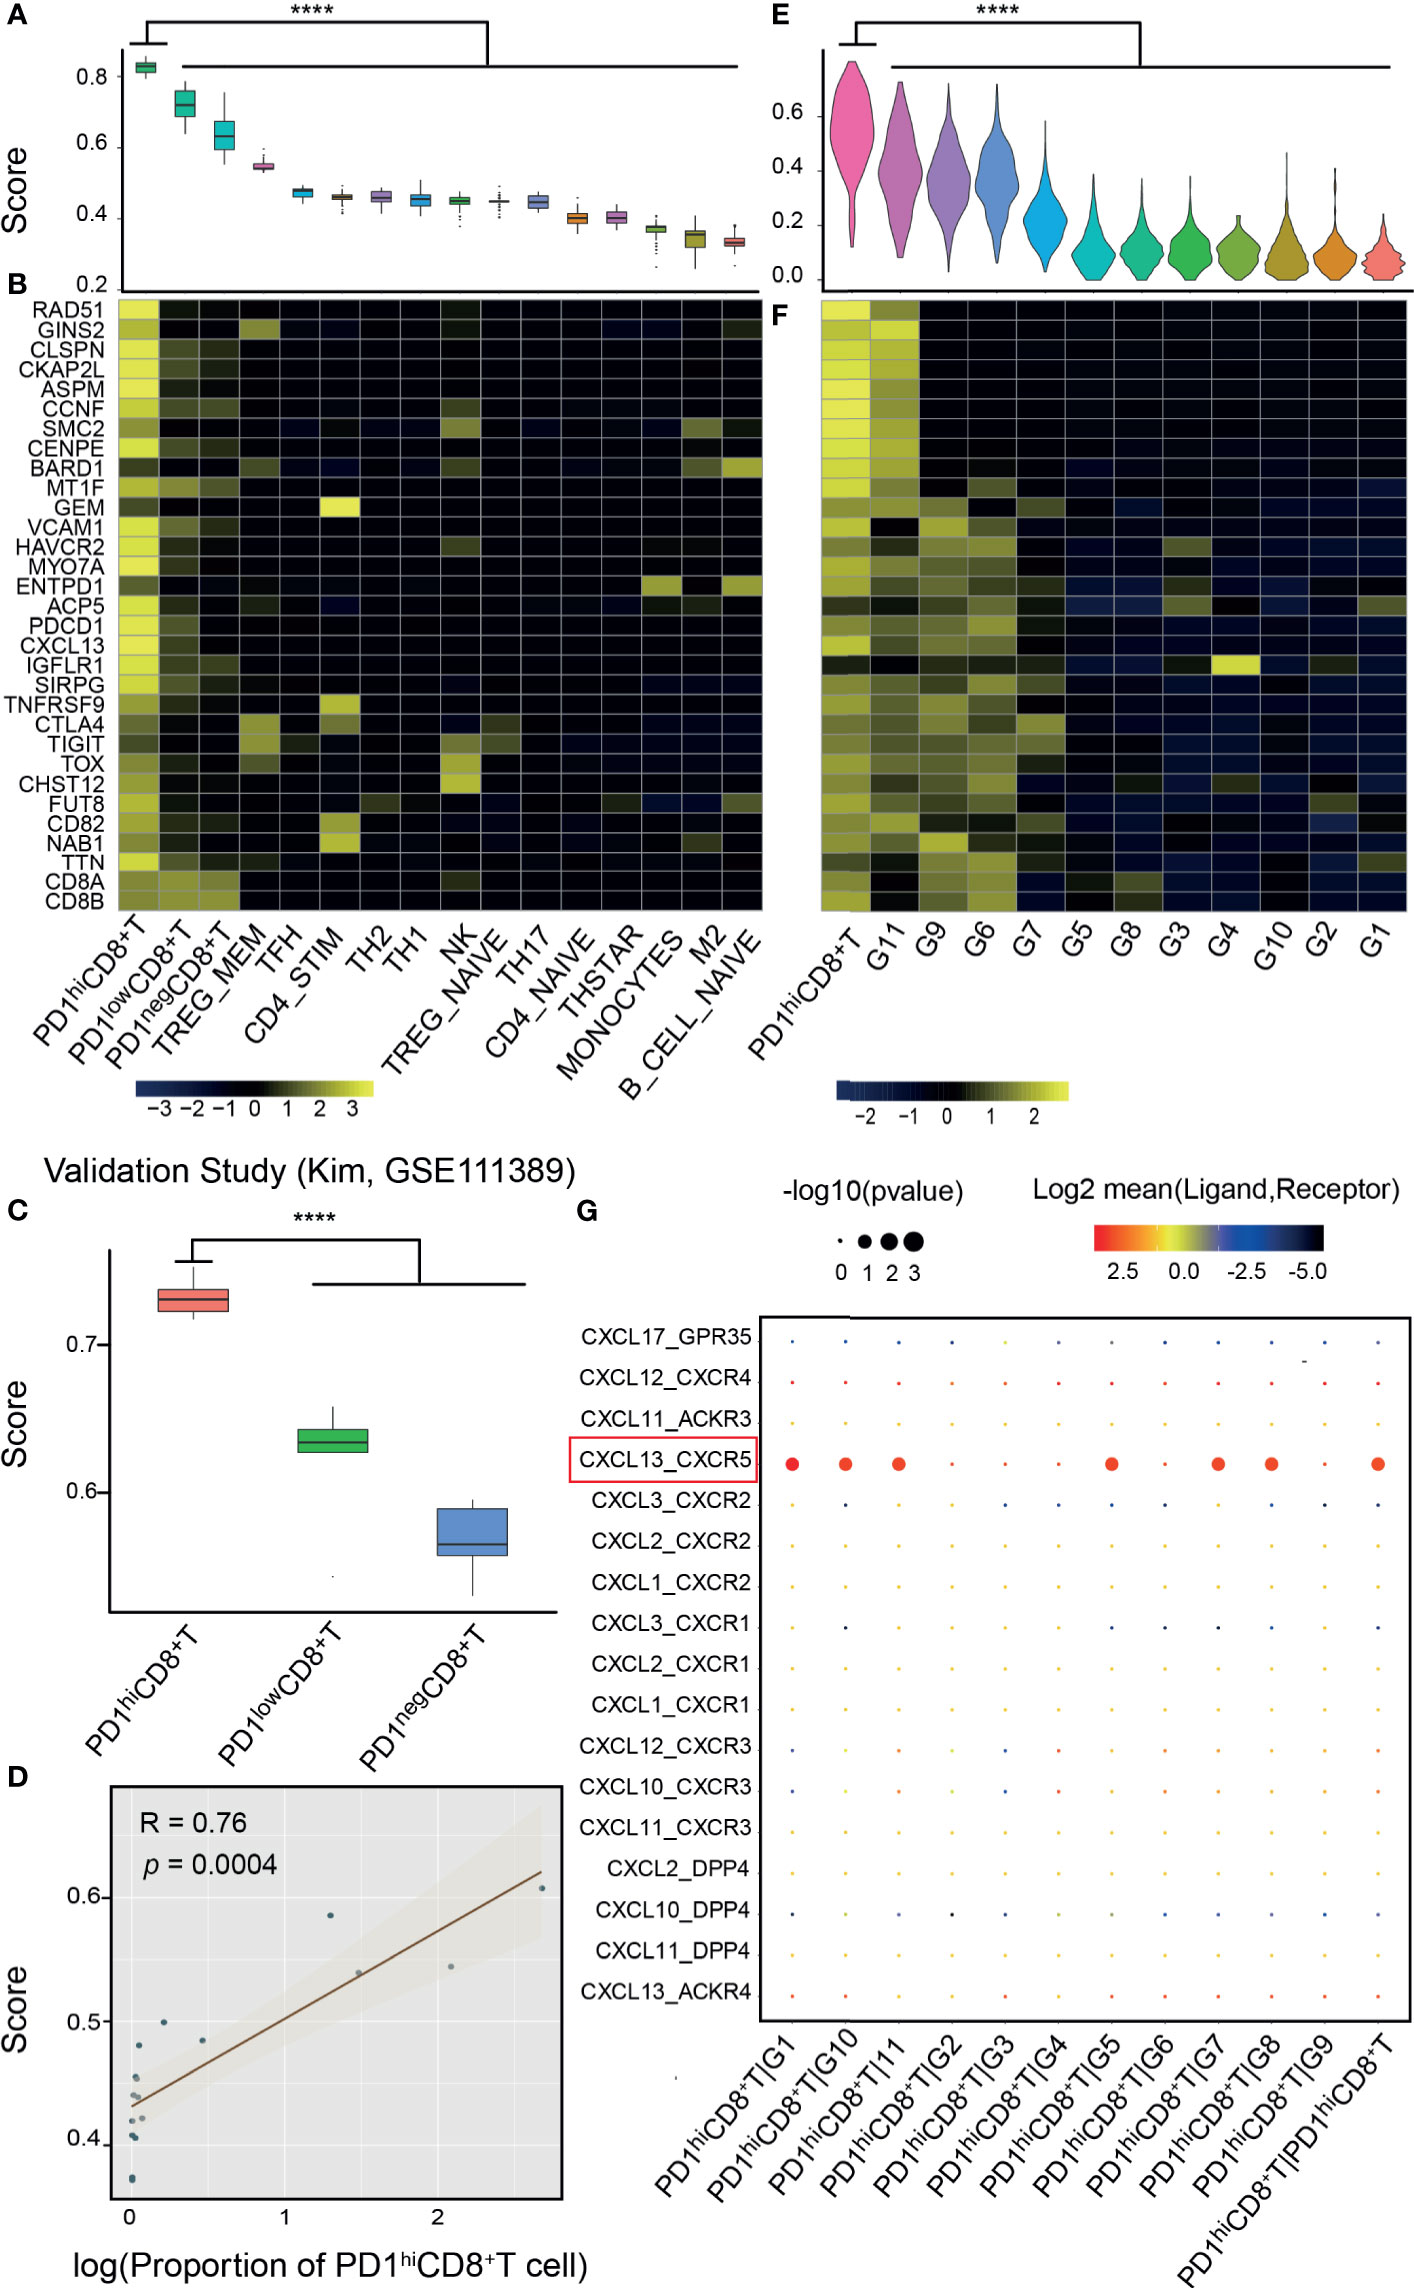
Figure 2 Validation of the signature score from bulk and single-cell RNA-seq data. (A) Bulk RNA-seq data of PD-1hiCD8+ T cells and other immune cells from the database of immune cell expression project were integrated after normalization by house-keeping genes. PD-1hiCD8+ T cells had the highest score than other immune cells (****: p<0.0001). (B) Signature genes were specific to PD-1hiCD8+ T cells. (C) The signature score can discriminate PD-1hi/low/negCD8+ T cells in another study (18), where these cells were sorted and sequenced from hepatocellular carcinoma (HCC). (D) The proportion of PD-1hiCD8+ T cells in HCC tumor samples was correlated with the signature score (Pearson correlation, R=0.76, p=0.0004). (E) In single-cell RNA-seq of melanoma tumor infiltrating immune cells, PD-1hiCD8+ T cells had the highest score (****: p<0.0001), and the signature genes were highly expressed in this cluster (F). (G) The ligand–receptor interactions between PD1hiCD8+T cells and other immune cells. PD1hiCD8+T cells secreted CXCL13 chemokine and interacted with the chemokine receptor CXCR5 expressing on B cells, cytotoxicity lymphocytes, memory T cells, and regulatory T cells. G1, B cells; G2, plasma cells; G3, monocytes/macrophages; G4, dendritic cells; G5, lymphocytes; G6, exhausted CD8+ T cells; G7, regulatory T cells; G8, cytotoxicity lymphocytes; G9, exhausted/heat-shock CD8+ T cells; G10, memory T cells; G11, exhausted/cell cycle (CD4+ T cell).
Effectiveness of Signature Score in Predicting Response to ICI Therapy
To evaluate the effectiveness of our signature score in predicting response to ICI therapy, we obtained 581 RNA-seq samples from eight cohorts (six studies) across four cancer types, NSCLC, melanoma, gastric cancer, and urothelial cancer (Figure 1, right). These studies are summarized in Supplementary Table 2. Interestingly, the signature scores were significantly higher in responders than in nonresponders, except in one cohort where the difference was nearly significant (p=0.096) (Figures 3A–H). In another 204 ICI-treated breast cancer mouse models, the sensitive groups had higher scores than resistant groups at all the 4 timepoints of sample collection (pretreatment, p<0.0001;3 days after ICI p=0.0002;7 days after ICI p=0.0001; end of study p<0.0001; Supplementary Figure 6). Next, we calculated AUCs to evaluate the predictive value of PD-1hiCD8+ T cells for ICI therapy response. The median AUC across the eight cohorts was 0.755 (range: 0.61 to 0.91) (Figure 3I). In two studies involving both pretreatment and on-treatment datasets, the AUCs in the on-treatment groups were higher than those in the pretreatment group from the same study. Moreover, the signature score (continuous variable, Table S3) was positively associated with OS and PFS. We divided each cohort into high- and low-score groups and found that high-score patients had better survival with respect to either OS or PFS (Figure 4). Furthermore, to explore whether the signature score was an independent prognostic factor, we built a multivariable Cox proportional hazard model including age, sex, and treatment regimens if available. A high PD-1hiCD8+ T cell score was found to be independently associated with a 76–94% reduction in the risk of disease progression and a 28–92% reduction in the risk for all mortality (Table 2). Similarly, the hazard ratios (HRs) in the on-treatment cohort (OS, HR=0.08, p=0.034; PFS, HR=0.06, p=0.003) were smaller than those in the pretreatment group (OS, HR=0.29, p=0.002; PFS, HR=0.29, p<0.001). Taken together, these results showed that our signature score could predict ICI therapy response and survival outcomes.
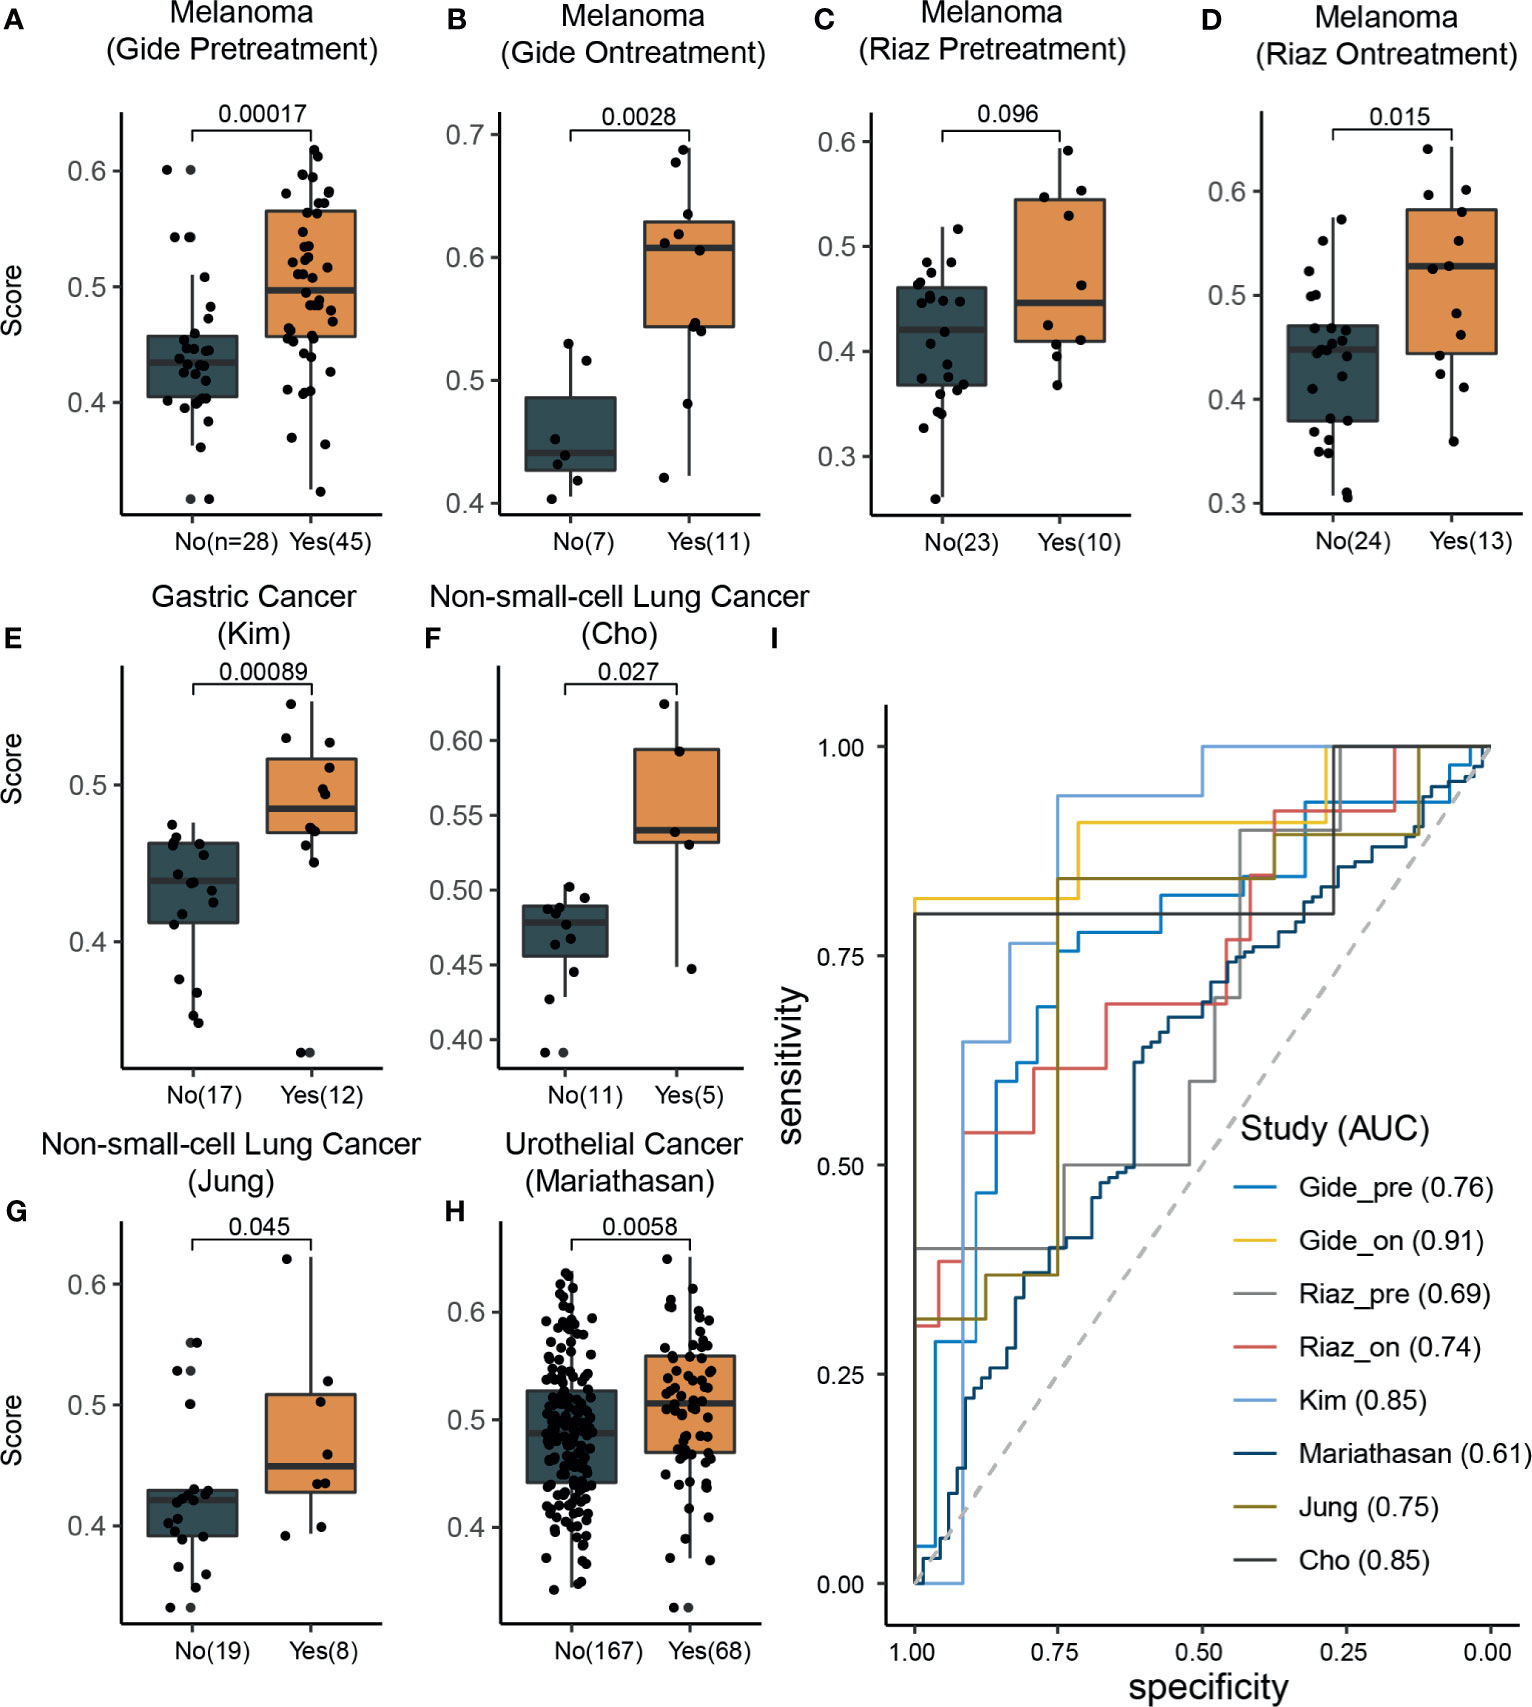
Figure 3 The signature scores were associated with response rates across different cancer types. (A–H) In all datasets, the response group samples had significant (Wilcoxon rank-sum test) higher signature scores than nonresponse group samples (marginally significant in the Riaz pretreatment dataset; C). (I) Receiver operating characteristic curve analysis for response prediction in all datasets.
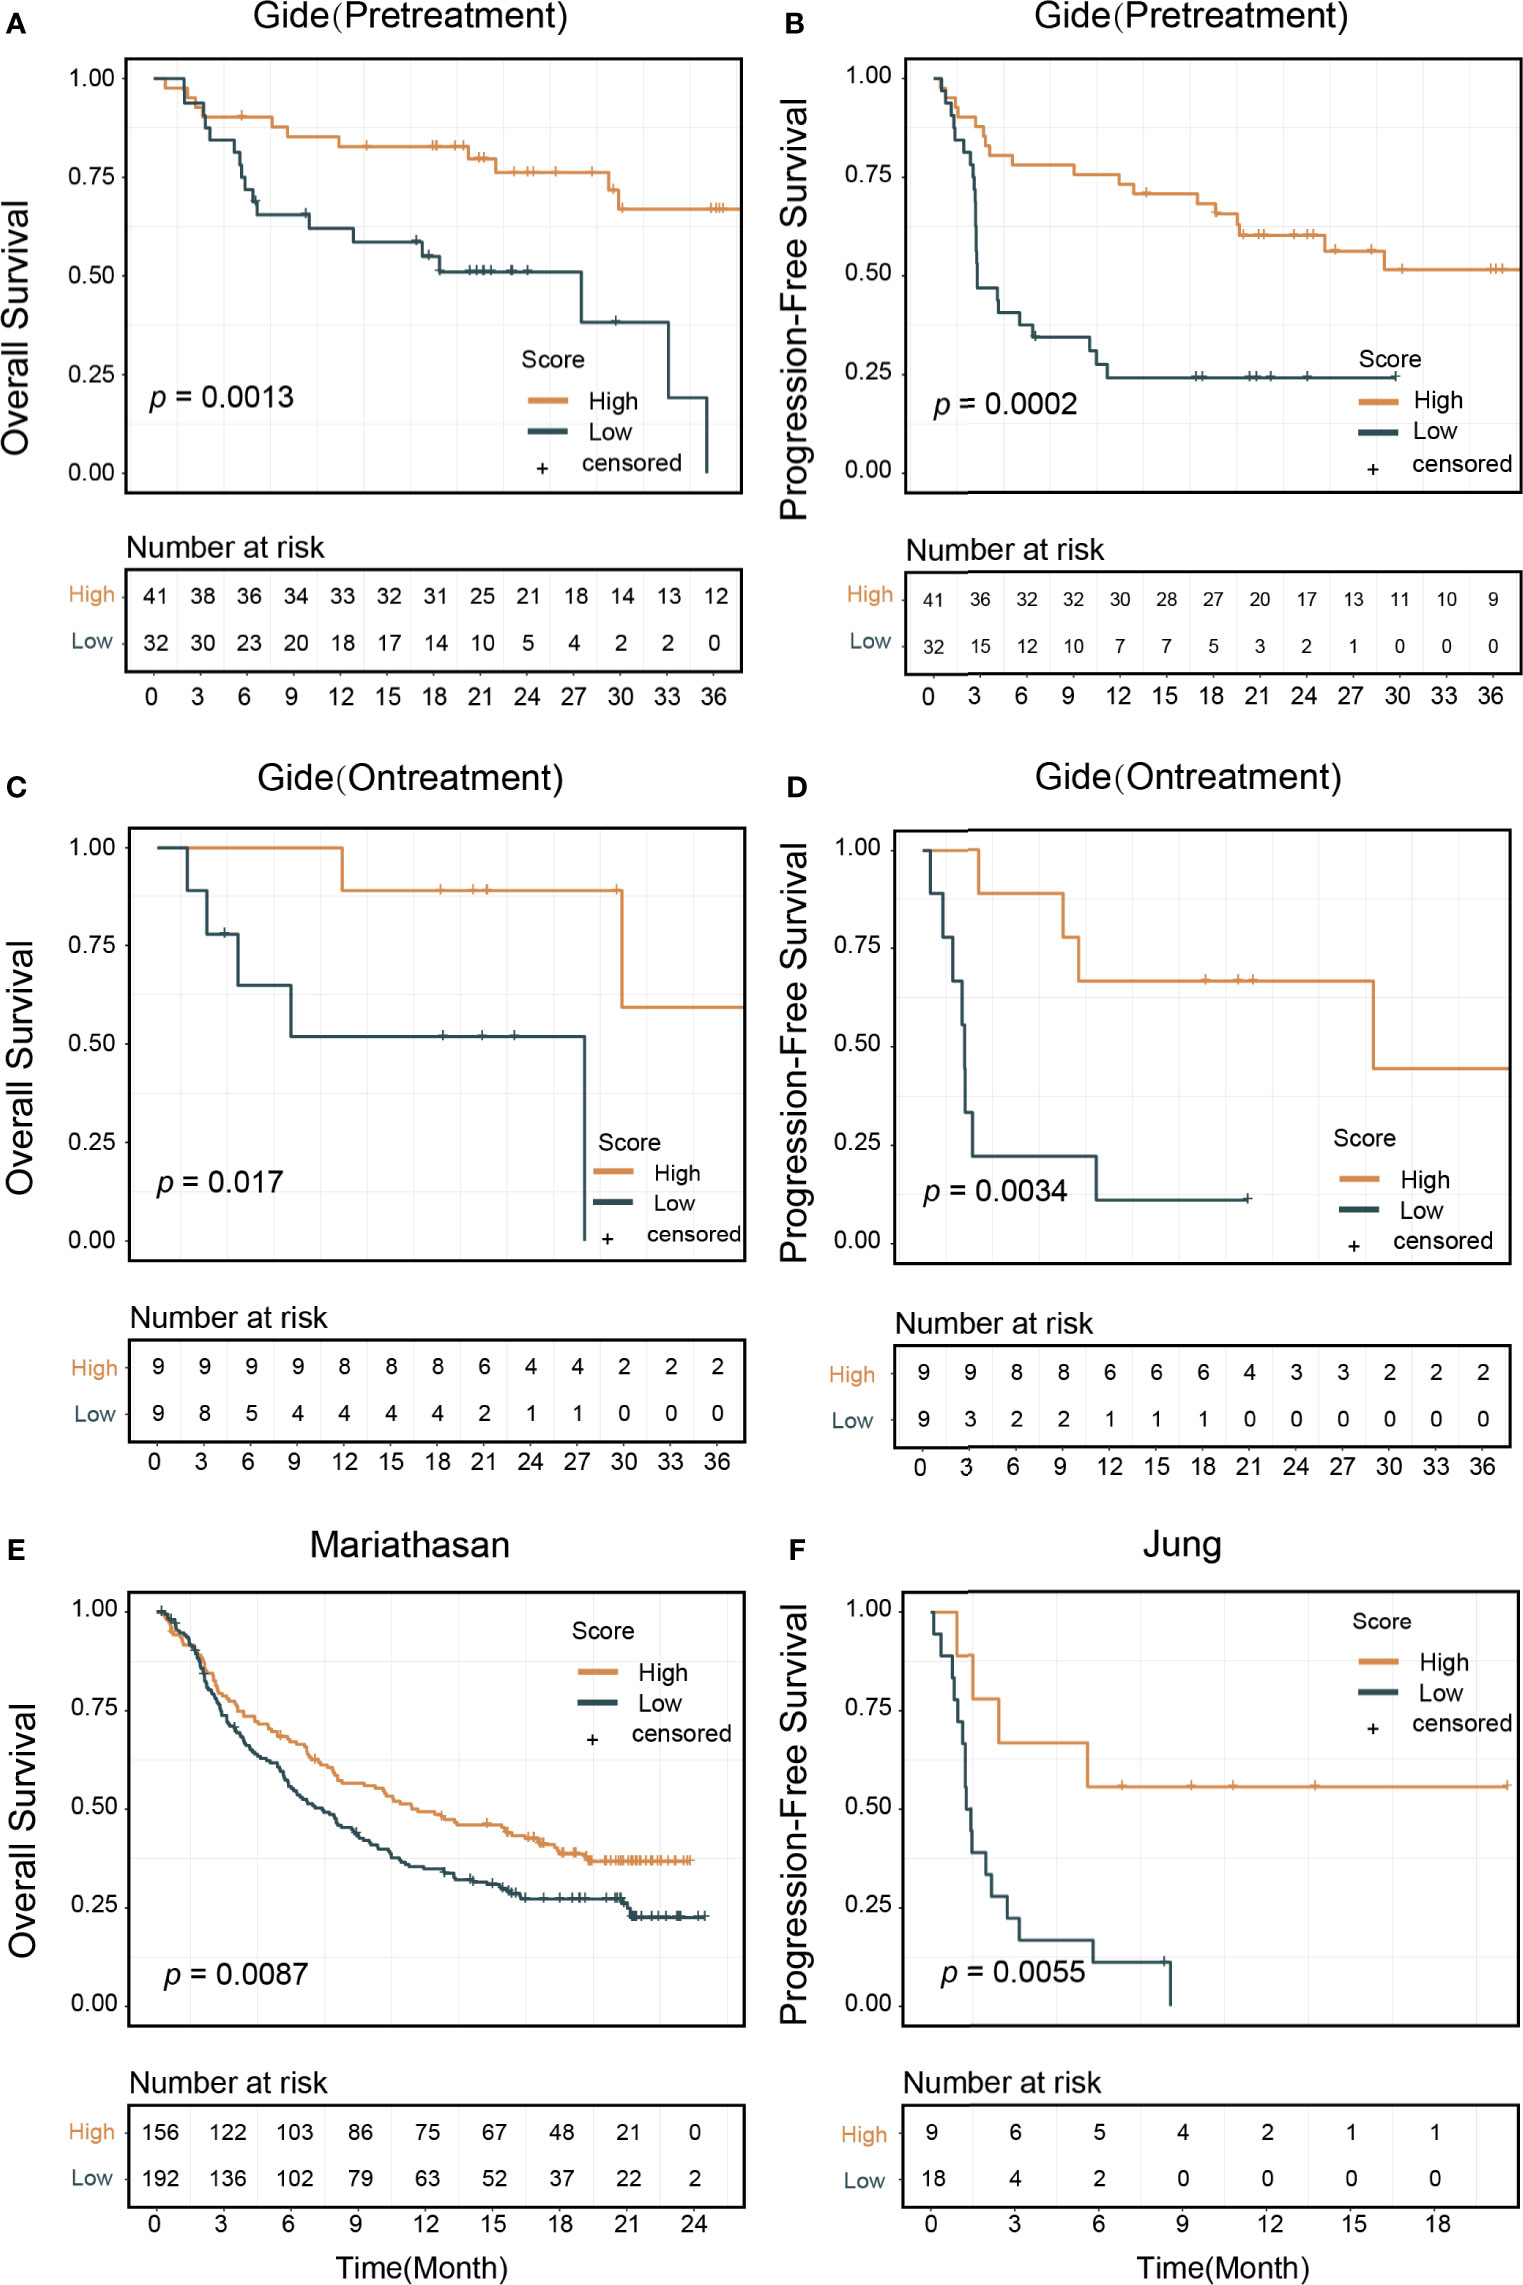
Figure 4 Signature score and patients survival outcomes. Patients treated with immune checkpoint inhibitors were divided into high and low signature score groups. Kaplan–Meier curves showed that high score group patients had better survival outcomes: (A) In the pretreatment Gide dataset, p=0.013 (log-rank test) in overall survival, (B) p=0.0002 in progression-free survival. (C) In the on-treatment Gide dataset, p=0.017 for overall survival, (D) p=0.0034 in progression-free survival. (E) In the Mariathasan dataset, p=0.0087 for overall survival. (F) In the Jung dataset, p=0.0055 for progression-free survival.
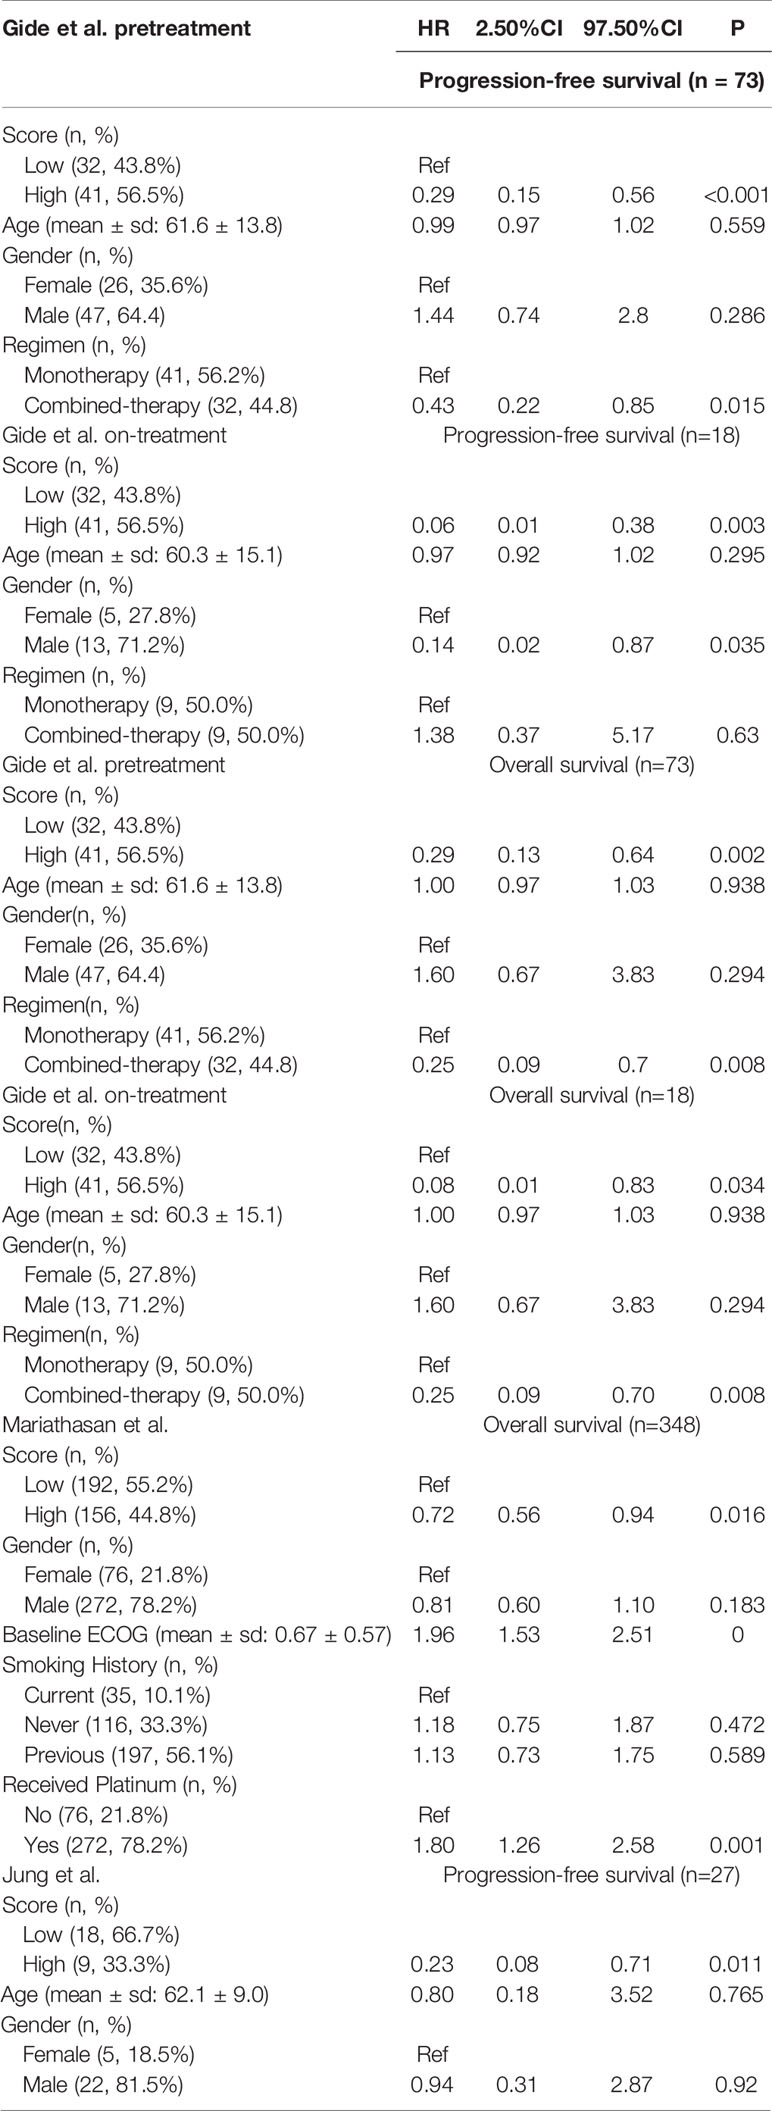
Table 2 Multivariable Cox proportional model of signature score and other clinical factors.
Predictive Value of the Signature Score in Pan-Cancer Analysis
We calculated the signature scores of 6,764 samples across 21 cancer types from TCGA and collected ORR data for anti-PD-1/PD-L1 therapy from Lee and Ruppin (9). The distribution of signature scores was higher in immune-hot tumors, including colon adenocarcinoma with microsatellite instability phenotype (COAD_MSI), lung squamous cell carcinoma (LUSC), lung adenocarcinoma (LUAD), head and neck squamous cell carcinoma, skin cutaneous melanoma (SKCM), and bladder urothelial carcinoma (BLCA) which were more sensitive to ICI therapy (Figure 5) (46, 47). In prostate adenocarcinoma, ovarian serous cystadenocarcinoma (OV) and glioblastoma multiforme tumors, which are known to be immune-cold tumors, the signature scores were lower (46, 47). Moreover, in the Mariathasan dataset, the immune-inflamed phenotype had higher scores than the immune-desert and immune-excluded phenotypes (Supplementary Figure 7A). Generally, the breast cancer samples showed low immune infiltration but had scores at the median level. This phenomenon could be attributed to the heterogeneity of tumor subtypes; triple-negative breast cancer had higher scores than other subtypes (p<0.0001, Supplementary Figure 7B). The fraction of high-score (80th-percentile) samples was correlated with ORR (Pearson correlation, R=0.78, p<0.0001). To explore the differences between high-score (top 33%) and low-score (bottom 33%) samples, DEGs were identified and their KEGG pathway enrichment was analyzed (Supplementary Figure 8). T cell receptor signaling pathway, cytokine–cytokine receptor interaction, and chemokine signaling pathway were activated in samples with high signature score across most cancer types (85%, [17/20], 100% [20/20], and 85%[17/20], respectively). The cell adhesion molecule (CAM) pathway, an important mediator of immune cell migration (48), was also upregulated in high-score samples (85%[17/20]). These results demonstrated that cancers with high signature scores had increased cell cross-talk and immune cell infiltration, reflecting an immune-hot phenotype. We also found that glycolysis and fatty acid metabolism were upregulated only in some ICI-therapy-sensitive cancer types. The interaction of PD-1 with the PD-L1 axis can upregulate aerobic glycolysis and induce fatty acid oxidation in T cells, leading to immunosuppression (49). Consequently, these cancer types were sensitive to anti-PD-1/PD-L1 therapy.
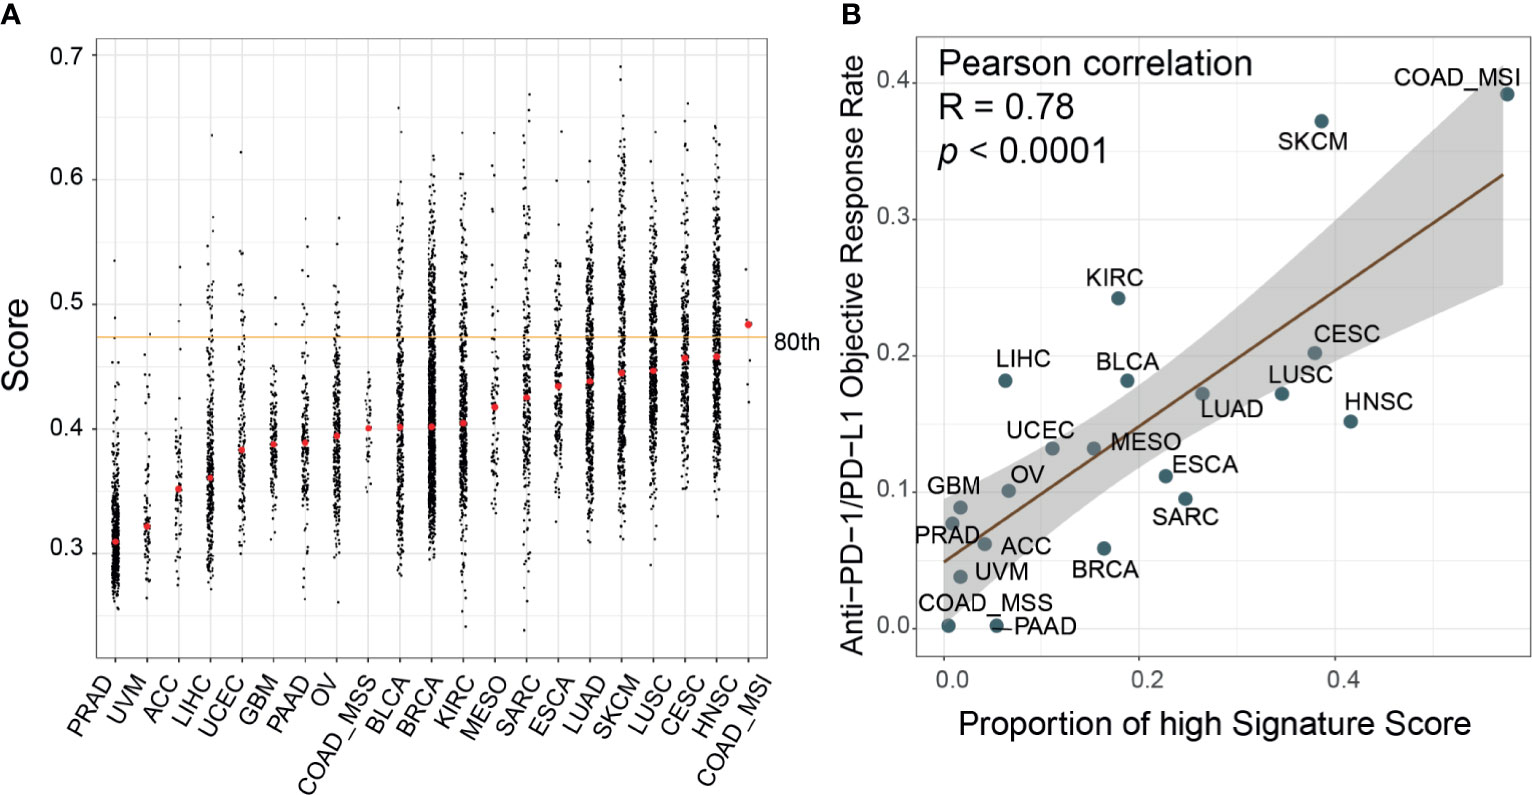
Figure 5 Evaluation of the correlates of immune-check point inhibitors to signature scores across cancer types. (A) Distribution of the signature scores across 21 cancer types in The Cancer Genome Atlas (TCGA) dataset. The red dot within each cancer type denoted the median score; the orange line represented the 80th percentile score across all samples. (B) The proportion of high signature score (>80th percentile) samples was correlated with the reported objective response rates in a published paper (Pearson correlation, R=0.78, p<0.0001). ACC, adrenocortical carcinoma; BLCA, bladder urothelial carcinoma; BRCA, breast invasive carcinoma; CESC, cervical squamous cell carcinoma and endocervical adenocarcinoma; COAD, colon adenocarcinoma; ESCA, esophageal carcinoma; GBM, glioblastoma multiforme; HNSC, head and neck squamous cell carcinoma; KIRC, kidney renal clear cell carcinoma; LIHC, liver hepatocellular carcinoma; LUAD, lung adenocarcinoma; LUSC, lung squamous cell carcinoma; MESO, mesothelioma; OV, ovarian serous cystadenocarcinoma; PAAD, pancreatic adenocarcinoma; PRAD, prostate adenocarcinoma; SARC, sarcoma; SKCM, skin cutaneous melanoma; UCEC, uterine corpus endometrial carcinoma; UVM, uveal melanoma.
Comparison With Other ICI Biomarkers
We compared the predictive performance of our signature score with those of other widely used transcriptome biomarkers, including IFN-γ, PD-L1, PD-1, CRMA, TLS, IPS, and CD8+ T CIBERSORT. Our score was positively associated with all of these markers except CRMA (Supplementary Figure 9A). The net reclassification index showed that our score could better classify responders to ICI therapy except in two Riaz cohorts (Supplementary Figure 9B). A possible explanation was that in the Riaz cohorts, some of the patients had received ipilimumab therapy before PD-1 treatment, which may have influenced their immune status. The AUCs of the signature score, IFN-γ, and PD-L1 were higher than those of the other biomarkers (Supplementary Figure 9C). PD-L1 mRNA expression was correlated with our score (Supplementary Figures 9A, 10A–H). In many cases (n=452), PD-L1 and our score stratified patients consistently (Supplementary Table 4). In the Mariathasan cohort, where there were 75 discordant samples between PD-L1 and our signature score, the combination of PD-L1 and our score resulted in slightly improved predictive value (AUC from 0.61 to 0.63). It is noteworthy that the OS rate was significantly higher for PD-L1highScorehigh samples than for other samples (log-rank, p=0.0025) (Supplementary Figures 10I–K). TMB has been reported as a genomic predictor of ICI therapy response in multiple cancer types (9). In two cohorts where TMB data were available, we found no significant association between TMB and our score (Supplementary Figure 9A). The combination of our signature and TMB was of higher predictive value than either our signature or TMB alone (Figures 6A, B). Next, we divided the patients into four groups by our signature score and TMB. The 1-year OS rates were 70.0% (95% CI: 59.0-83.0%) for the TMBhighScorehigh group, 39.7% (95% CI: 29.0–54.3%) for the TMBhighScorelow group, 42.4% (95% CI: 31.8–56.7%) for the TMBlowScorehigh group, and 30.1% (95% CI: 21.7–41.7%) for the TMBlowScorelow group (Mariathasan cohort, Figure 6C). The 1-year PFS rates were 60% (95% CI: 29–100%) for the TMBhighScorehigh group and 50.0% (95% CI: 18.8–100%) for the TMBlowScorehigh, in the other two groups; all patients progressed in less than 1 year (Jung cohort, Figure 6D). Patients in the TMBhighScorehigh group showed better survival outcomes compared with other groups (log-rank p<0.001 for OS, p=0.045 for PFS, Figures 6E, F). In the Mariathasan cohort, patients in the TMBhighScorehigh group showed increased OS compared with patients in the TMBhighScorelow group (log-rank p=0.008; HR=0.51, 95%CI: 0.30-0.84, p=0.008), suggesting that the signature score could act as a complementary biomarker to TMB.
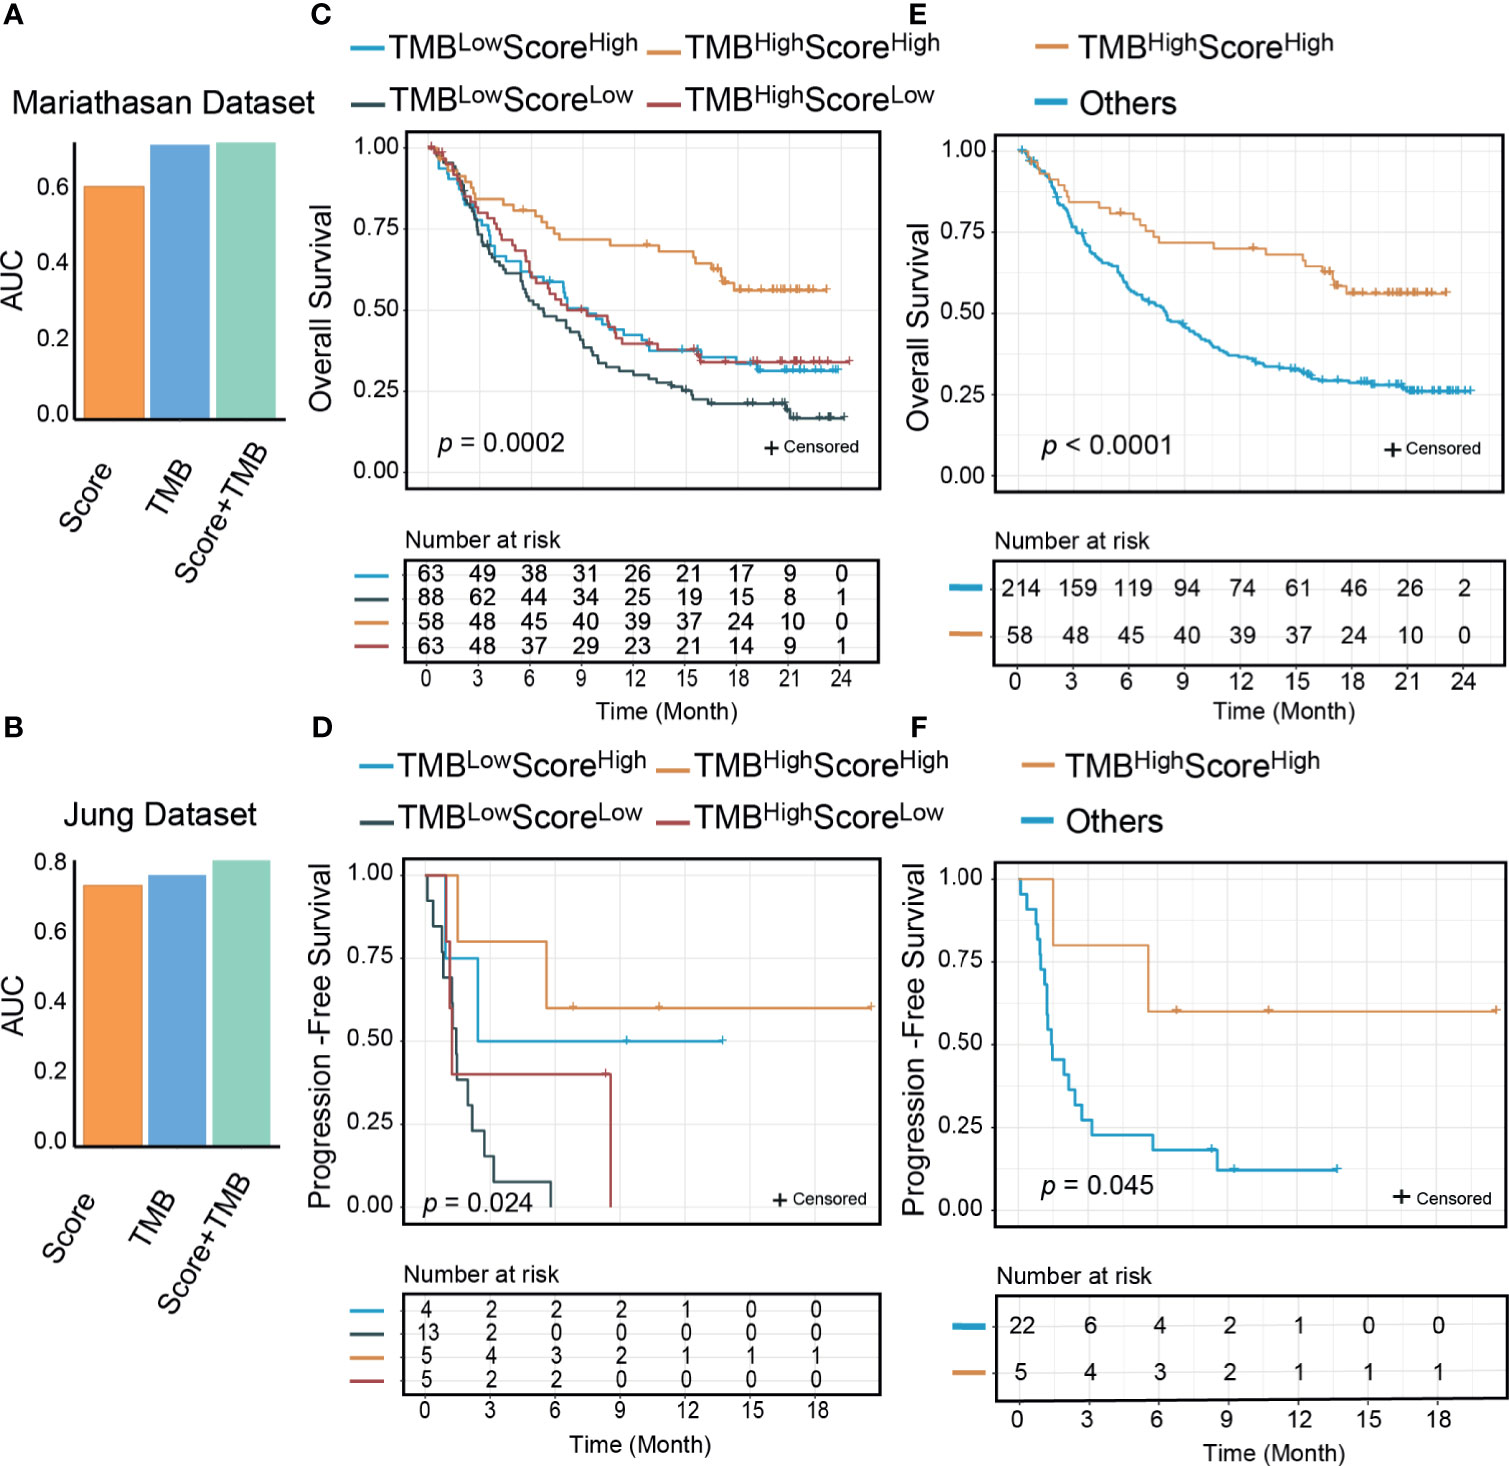
Figure 6 The signature score could improve the predictive and prognostic value of tumor mutational burden (TMB). The area under the receiver operating characteristic curve (AUC) of the combination of the signature score and TMB was higher than TMB and the signature score (A: Mariathasan dataset; B: Jung dataset); Significant differences exist between the four groups (TMBhighScorehigh, TMBlowScorehigh, TMBhighScorelow, and TMBlowScorelow) in either overall survivals (C: Mariathasan dataset, p=0.0002) or progression-free survivals (D: Jung dataset, p=0.024) than other groups. TMBhighScorehigh group patients had better overall survival (E: Mariathasan dataset, p<0.0001) and progression-free survival (F: Jung dataset, p=0.045) than other three groups.
Discussion
The introduction of ICI therapy represents a milestone in cancer therapy. However, the low response rates to this type of therapy will increase the economic burden on cancer patients. Treatment with anti-PD-1 agents requires about $6,000 per infusion, which is a much higher cost than transcriptome tests. Therefore, developing biomarkers for predicting ICI therapy response is an urgent and cost-effective field. In this study, we built a transcriptional signature of PD-1hiCD8+ T cells. The signature score could discriminate this population from other immune cells in both bulk and single-cell-level datasets across different cancer types. Based on flow cytometry and RNA-seq results from an independent study, we validated the ability of our signature to quantify the fraction of PD-1hiCD8+ T cells in tumor samples. Furthermore, we found that in NSCLC, melanoma, gastric cancer, urothelial cancer, and a mouse model of breast cancer, samples with high signature scores showed more benefit from ICI therapy. The predictive value of the signature score was better than those of other transcriptional markers. Combination of the signature score with TMB would improve its predictive value. In 21 TCGA cancer types, the signature score was correlated with ICI therapy response, revealing the intrinsic connection of the immunological activity of the TME described by the signature of each cancer tissue. Our study also offers an easy-to-use R package to evaluate PD-1hiCD8+ T cell infiltration in more tumor samples.
Many studies have revealed that CD8+ TILs are heterogenous, and that different types of CD8+ TILs showed different response to ICIs (1, 21, 44). Our results also demonstrated the limited predictive value of CD8+ TILs. Persistent antigen exposure from tumor cells or antigen-presenting cells can cause CD8+ T cell exhaustion, inducing sustained expression of PD-1 in CD8+ TILs (1). Even within this dysfunctional compartment, CD8+ T cells have distinct roles in tumor immunity. Thommen et al. found that in NSCLC, the presence of PD-1hiCD8+ T cells strongly predicted response to ICI therapy and was correlated with increased OS (13). In these cells, immune-checkpoint genes (PD-1, CTLA4, TIGIT, HAVCR2/TIM-3, and TNFRSF9) (8) and transcription factor TOX, a central regulator of distinct exhausted T cell transformation (45), were highly expressed. PD-1hiCD8+ T cells were distinct from other PD-1 positive CD8+ T cells, as the cell cycle and glycolysis process were upregulated in these cells. This phenotype was similar to that of the PD-1+TIM-3+ TRM cell identified by Clarke et al. (50), which was shown to be a favorable ICI therapy marker in NSCLC (50). Although it was not clear to what extent PD-1hiCD8+ T cells overlapped with PD-1+TIM-3+ TRM cells, the predictive values of PD-1hiCD8+ T cells were confirmed across 5 cancer types in nearly 600 clinical samples and 204 mouse models. Generally, we found that PD-1hiCD8+ T cell scores of on-treatment samples were better than those of pretreatment samples because of the better reflection of immune status after therapy (51). Two studies have reported that the relative fraction of PD-1hiCD8+ T cells in CD8+ cells, rather than the absolute fraction in total tumor tissue as estimated by our signature score, was negatively associated with ICI therapy outcomes (21, 52). In predicting ICI therapy response, the relative fraction of PD-1hiCD8+ T cells might be largely influenced by the complex functions of other intratumor CD8+ T cells with negative or low PD-1 expression (21, 53).
Our results indicated that the PD-1hiCD8+ T cell score was associated with the immune phenotype. Immune-hot tumors (COAD_MSI, SKCM, BLCA, LUSC, and LUAD) had higher signature scores and were sensitive to ICI therapy. Our score was predictive of the ORR to anti-PD-1/PD-L1 therapy across 21 cancer types in 6,764 TCGA samples (Pearson correlation, R=0.78, p<0.0001). In support of these results, we found that important pathways in antitumor activity were consistently upregulated in high-score samples, including cytokine–cytokine receptor interaction, chemokine signaling pathway, and T cell receptor signaling pathway (54). The CAM pathway was also activated in the high-score group, which was correlated with T cell infiltration in tumors (48). Moreover, in the Mariathasan dataset, immune-inflamed tumors had higher signature scores than immune-excluded or immune-desert samples. However, not all scores for these tumors were correlated with their phenotype. This discordance could be related to the spatial location of PD-1hiCD8+ T cells and the impact of other immune cells, whereas our study mainly focused on the transcriptional features of PD-1hiCD8+ T cells. Heterogeneity of tumor subtypes could also weaken the associations between our score and immune phenotypes. For example, breast cancer is generally considered as low immune-reactive cancer, but triple-negative breast cancer has been reported to be a high-immune-infiltration subtype (55). Our results consistently showed that this subtype had higher scores than other subtypes. Similarly, the COAD_MSI subtype was of immune-hot phenotype, unlike other COAD subtypes (56). On the other hand, glycolysis and fatty acid metabolism were only upregulated in some of the ICI-sensitive cancer samples with high scores. In PD-1 signaling, tumor cells can block antitumor immunity through this two metabolic pathways (49). These results partially explain why these cancer types are sensitive to anti-PD-1/PD-L1 therapy. Recent findings showed that targeting these metabolic interventions in combination with ICI could offer opportunities to improve therapy response; several clinical trials of such treatment are ongoing (57).
The main function of PD-1hiCD8+ T cells is the secretion of CXCL13. In a previous study, CXCL13 was found to be mainly expressed by CD4+ follicular helper T cells, recruiting B cells and inducing TLS formation in the nonlymphoid tissue (58). In scRNA-seq data, as well as identifying a cluster of CD4+ T cells with high CXCL13 expression, we confirmed the secretion of CXCL13 from PD-1hiCD8+ T cells and their interaction with B cells and regulatory T cells through the CXCL13-CXCR5 axis. These results indicated that PD-1hiCD8+ T cells might recruit and organize immune cells through secretion of CXCL13, modulating the TME to an immune-hot phenotype. The positive association between the TLS score and the PD-1hiCD8+ T cell score also supports this. The importance of CXCL13 in ICI therapy has been confirmed in vivo. Anti-PD-1 therapy failed in a CXCL13-null mouse model of BLCA, whereas the wild-type model showed a good response (59), and the treatment with a combination of CXCL13 and anti-PD-1 successfully retarded tumor growth in another mouse model of OV (60). Although the differences in CXCL13 secretion between CD4+ T cells and PD-1hiCD8+ T cells remain elusive, these results indicate that CXCL13 is a potential therapeutic target that could be targeted in combination with ICI therapy.
Increasing evidence shows that response to ICI therapy is influenced by both immune cells and tumor-associated factors. PD-L1 positivity of tumor cells has been shown to be a good indicator of response to ICI therapy. In recent years, it has been recognized that high PD-L1 expression in dendritic cells, regulatory T cells, and macrophages can attenuate T cell activation and promote T cell exhaustion (61). The expression of PD-1 or PD-L1 in the TME is important for ICI therapy. In our study, patients in the PD-L1highScorehigh group benefited more from ICI therapy than other patients (Supplementary Figure 10K). TMB-high tumors had high levels of neoantigens, which make them more immunogenic and trigger a TIL response (11, 12). TMB has been approved by the FDA as a genomic biomarker in some cancer types (41, 62). However, TMB has some limitations as a biomarker, and it has been suggested that a combination of TMB with other predictors may show superior performance (12). Whereas TMB is reflective of tumor properties, our signature score for the PD-1hiCD8+ T cell characterizes the tumor environment. In our analysis, TMB and the signature score both showed a good predictive value for ICI but were independent of each other. Therefore, it was intuitive to explore their potential combined effects. When samples were divided into four subtypes based on TMB and the signature score, the patients in the TMBhighScorehigh group not only were highly immunogenic (characterized by a high TMB) but also showed an immune hot phenotype (characterized by a high signature score). These patients would be expected to be more sensitive to ICI therapy, and indeed they exhibited the best clinical outcomes in two independent datasets. These results warrant further confirmation and extension.
One of the potential limitations of our study was that our analysis was an integrated, retrospective study. Second, although the multivariable Cox proportional hazard model showed that the PD-1hiCD8+ T cell score was an independent prognostic indicator, some clinical prognostic factors, including the number of metastatic sites, first-line therapy information, and details of ICI therapy regimens, were not available. In the Riaz cohort, the difference between responders and nonresponders was not as obvious as those in other cohorts. Some patients receiving ipilimumab therapy before PD-1 treatment might be an additional confounder that would weaken the statistical power of our analysis (63, 64). Third, our study did not explore the mechanisms underlying the different effects of the PD-1hiCD8+ T cell score in different cohorts or the variation in cutoff values for high-score samples in different cohorts. One possible mechanism may involve the complicated PD-L1 status in tumor cells or immune cells, like dendritic cells and macrophages. However, the gene expression of PD-L1 is a mixture of those cell types in RNA-seq; other methods including cytometry by time of flight and codetection by indexing may help explore this in the future.
Conclusions
In summary, we built a 31-gene signature to represent the fraction of PD-1hiCD8+ T cells from bulk RNA-seq data and demonstrated promising potential of the PD-1hiCD8+ T cell as a pan-cancer biomarker in patients receiving ICI therapy. The combination of the signature score with TMB could further increase its predictive value. The secretion of CXCL13 is a potential mechanism of how PD-1hiCD8+ T cells modulate the TME and why high-scoring patients tend to have favorable outcomes of ICI therapy.
Data Availability Statement
The original contributions presented in the study are included in the article/Supplementary Material. Further inquiries can be directed to the corresponding author.
Author Contributions
Study concept and design: ZY, YD, and LL. Acquisition, analysis, or interpretation of data: ZY, YD, JC, SW, and HL. Drafting of the manuscript: all authors. Critical revision of the manuscript for important intellectual content: all authors. Study supervision: LL and YD. All authors contributed to the article and approved the submitted version.
Funding
This study was funded by the National Natural Science Foundation of China (NSFC 81672311 to LL and NSFC 31801119 to YD).
Conflict of Interest
The authors declare that the research was conducted in the absence of any commercial or financial relationships that could be construed as a potential conflict of interest.
Publisher’s Note
All claims expressed in this article are solely those of the authors and do not necessarily represent those of their affiliated organizations, or those of the publisher, the editors and the reviewers. Any product that may be evaluated in this article, or claim that may be made by its manufacturer, is not guaranteed or endorsed by the publisher.
Acknowledgments
We thank Prof. Hyung-Don Kim and Su-Hyung Park from Korea Advanced Institute of Science and Technology for kindly sharing bulk HCC tissue RNA-seq data as well as the percentage of PD-1hiCD8+ TILs assessed by flow cytometry. We thank Prof. Shensi Shen from the Institute of Thoracic Oncology and Department of Thoracic Surgery, West China Hospital, Sichuan University for advice in revision.
Supplementary Material
The Supplementary Material for this article can be found online at: https://www.frontiersin.org/articles/10.3389/fonc.2021.695006/full#supplementary-material
Abbreviations
AUC, area under the receiver operation characteristic curve; BLCA, bladder urothelial carcinoma; CAM, cell adhesion molecules; CCLE, The Cancer Cell Line Encyclopedia; CR, complete response; CRMA, Anti-CTLA4 resistance MAGE genes; COAD_MSI, colon adenocarcinoma with microsatellite instability phenotype; DCB, durable clinical benefit; DEG, differential expressed gene; FDA, Food and Drug Administration; GO, gene ontology; GSVA, gene set variation analysis; HCC, hepatocellular carcinoma; ICI, immune checkpoint inhibitor; IHC, immunohistochemistry; IPS, immunophenoscore; KEGG, Kyoto Encyclopedia of Genes and Genomes; LUAD, lung adenocarcinoma; LUSC, lung squamous cell carcinoma; MSigDB, Molecular Signatures Database; NSCLC, non-small cell lung cancer; NDB, nondurable benefit; ORR, objective response rate; OS, overall survival; OV, ovarian serous cystadenocarcinoma; PFS, progression-free survival; PR, partial response; scRNA-seq, single-cell RNA-seq; SD, stable disease; SKCM, skin cutaneous melanoma; TCGA, The Cancer Genome Atlas; TIL, tumor infiltrating lymphocytes; TMB, tumor mutational burden.
References
1. Thommen DS, Schumacher TN. T Cell Dysfunction in Cancer. Cancer Cell (2018) 33(4):547–62. doi: 10.1016/j.ccell.2018.03.012
2. O’Donnell JS, Teng MWL, Smyth MJ. Cancer Immunoediting and Resistance to T Cell-Based Immunotherapy. Nat Rev Clin Oncol (2019) 16(3):151–67. doi: 10.1038/s41571-018-0142-8
3. Mortezaee K. Immune Escape: A Critical Hallmark in Solid Tumors. Life Sci (2020) 258:118110. doi: 10.1016/j.lfs.2020.118110
4. Doroshow DB, Sanmamed MF, Hastings K, Politi K, Rimm DL, Chen L, et al. Immunotherapy in non-Small Cell Lung Cancer: Facts and Hopes. Clin Cancer Res (2019) 25(15):4592–602. doi: 10.1158/1078-0432.Ccr-18-1538
5. Mariathasan S, Turley SJ, Nickles D, Castiglioni A, Yuen K, Wang Y, et al. Tgfβ Attenuates Tumour Response to PD-L1 Blockade by Contributing to Exclusion of T Cells. Nature (2018) 554(7693):544–8. doi: 10.1038/nature25501
6. Beaver JA, Hazarika M, Mulkey F, Mushti S, Chen H, He K, et al. Patients With Melanoma Treated With an Anti-PD-1 Antibody Beyond RECIST Progression: A US Food and Drug Administration Pooled Analysis. Lancet Oncol (2018) 19(2):229–39. doi: 10.1016/s1470-2045(17)30846-x
7. Paré L, Pascual T, Seguí E, Teixidó C, Gonzalez-Cao M, Galván P, et al. Association Between PD1 mRNA and Response to Anti-PD1 Monotherapy Across Multiple Cancer Types. Ann Oncol (2018) 29(10):2121–8. doi: 10.1093/annonc/mdy335
8. Hu FF, Liu CJ, Liu LL, Zhang Q, Guo AY. Expression Profile of Immune Checkpoint Genes and Their Roles in Predicting Immunotherapy Response. Brief Bioinform (2020) 22(3):bbaa176. doi: 10.1093/bib/bbaa176
9. Lee JS, Ruppin E. Multiomics Prediction of Response Rates to Therapies to Inhibit Programmed Cell Death 1 and Programmed Cell Death 1 Ligand 1. JAMA Oncol (2019) 5(11):1614–8. doi: 10.1001/jamaoncol.2019.2311
10. Ayers M, Lunceford J, Nebozhyn M, Murphy E, Loboda A, Kaufman DR, et al. IFN-Γ-Related mRNA Profile Predicts Clinical Response to PD-1 Blockade. J Clin Invest (2017) 127(8):2930–40. doi: 10.1172/jci91190
11. Sha D, Jin Z, Budczies J, Kluck K, Stenzinger A, Sinicrope FA. Tumor Mutational Burden as a Predictive Biomarker in Solid Tumors. Cancer Discovery (2020) 10(12):1808–25. doi: 10.1158/2159-8290.Cd-20-0522
12. Jardim D, Goodman A, de Melo Gagliato D, Kurzrock R. The Challenges of Tumor Mutational Burden as an Immunotherapy Biomarker. Cancer Cell (2020) 39(2):154–73. doi: 10.1016/j.ccell.2020.10.001
13. Thommen DS, Koelzer VH, Herzig P, Roller A, Trefny M, Dimeloe S, et al. A Transcriptionally and Functionally Distinct PD-1 CD8 T Cell Pool With Predictive Potential in Non-Small-Cell Lung Cancer Treated With PD-1 Blockade. Nat Med (2018) 24(7):994–1004. doi: 10.1038/s41591-018-0057-z
14. Kim HD, Song GW, Park S, Jung MK, Kim MH, Kang HJ, et al. Association Between Expression Level of PD1 by Tumor-Infiltrating CD8(+) T Cells and Features of Hepatocellular Carcinoma. Gastroenterology (2018a) 155(6):1936–50.e17. doi: 10.1053/j.gastro.2018.08.030
15. Guo L, Cao C, Goswami S, Huang X, Ma L, Guo Y, et al. Tumoral PD-1hicd8+ T Cells are Partially Exhausted and Predict Favorable Outcome in Triple-Negative Breast Cancer. Clin Sci (Lond) (2020) 134(7):711–26. doi: 10.1042/cs20191261
16. Gide TN, Quek C, Menzies AM, Tasker AT, Shang P, Holst J, et al. Distinct Immune Cell Populations Define Response to Anti-PD-1 Monotherapy and Anti-PD-1/Anti-CTLA-4 Combined Therapy. Cancer Cell (2019) 35(2):238–55.e6. doi: 10.1016/j.ccell.2019.01.003
17. Riaz N, Havel JJ, Makarov V, Desrichard A, Urba WJ, Sims JS, et al. Tumor and Microenvironment Evolution During Immunotherapy With Nivolumab. Cell (2017) 171(4):934–49.e16. doi: 10.1016/j.cell.2017.09.028
18. Kim ST, Cristescu R, Bass AJ, Kim KM, Odegaard JI, Kim K, et al. Comprehensive Molecular Characterization of Clinical Responses to PD-1 Inhibition in Metastatic Gastric Cancer. Nat Med (2018b) 24(9):1449–58. doi: 10.1038/s41591-018-0101-z
19. Jung H, Kim HS, Kim JY, Sun JM, Ahn JS, Ahn MJ, et al. DNA Methylation Loss Promotes Immune Evasion of Tumours With High Mutation and Copy Number Load. Nat Commun (2019) 10(1):4278. doi: 10.1038/s41467-019-12159-9
20. Cho JW, Hong MH, Ha SJ, Kim YJ, Cho BC, Lee I, et al. Genome-Wide Identification of Differentially Methylated Promoters and Enhancers Associated With Response to Anti-PD-1 Therapy in Non-Small Cell Lung Cancer. Exp Mol Med (2020) 52(9):1550–63. doi: 10.1038/s12276-020-00493-8
21. Sade-Feldman M, Yizhak K, Bjorgaard SL, Ray JP, de Boer CG, Jenkins RW, et al. Defining T Cell States Associated With Response to Checkpoint Immunotherapy in Melanoma. Cell (2018) 175(4):998–1013.e20. doi: 10.1016/j.cell.2018.10.038
22. Guo X, Zhang Y, Zheng L, Zheng C, Song J, Zhang Q, et al. Global Characterization of T Cells in Non-Small-Cell Lung Cancer by Single-Cell Sequencing. Nat Med (2018) 24(7):978–85. doi: 10.1038/s41591-018-0045-3
23. Hollern D, Xu N, Thennavan A, Glodowski C, Garcia-Recio S, Mott K, et al. B Cells and T Follicular Helper Cells Mediate Response to Checkpoint Inhibitors in High Mutation Burden Mouse Models of Breast Cancer. Cell (2019) 179(5):1191–206.e21. doi: 10.1016/j.cell.2019.10.028
24. Dobin A, Davis CA, Schlesinger F, Drenkow J, Zaleski C, Jha S, et al. STAR: Ultrafast Universal RNA-Seq Aligner. Bioinformatics (2013) 29(1):15–21. doi: 10.1093/bioinformatics/bts635
25. Pertea M, Kim D, Pertea G, Leek J, Salzberg S. Transcript-Level Expression Analysis of RNA-Seq Experiments With HISAT, Stringtie and Ballgown. Nat Protoc (2016) 11: (9):1650–67. doi: 10.1038/nprot.2016.095
26. Zhou Y, Zhou B, Pache L, Chang M, Khodabakhshi AH, Tanaseichuk O, et al. Metascape Provides a Biologist-Oriented Resource for the Analysis of Systems-Level Datasets. Nat Commun (2019) 10(1):1523. doi: 10.1038/s41467-019-09234-6
27. Efremova M, Vento-Tormo M, Teichmann SA, Vento-Tormo R. Cellphonedb: Inferring Cell-Cell Communication From Combined Expression of Multi-Subunit Ligand-Receptor Complexes. Nat Protoc (2020) 15(4):1484–506. doi: 10.1038/s41596-020-0292-x
28. Newman AM, Liu CL, Green MR, Gentles AJ, Feng W, Xu Y, et al. Robust Enumeration of Cell Subsets From Tissue Expression Profiles. Nat Methods (2015) 12(5):453–7. doi: 10.1038/nmeth.3337
29. Finotello F, Mayer C, Plattner C, Laschober G, Rieder D, Hackl H, et al. Molecular and Pharmacological Modulators of the Tumor Immune Contexture Revealed by Deconvolution of RNA-Seq Data. Genome Med (2019) 11(1):34. doi: 10.1186/s13073-019-0638-6
30. Love MI, Huber W, Anders S. Moderated Estimation of Fold Change and Dispersion for RNA-Seq Data With Deseq2. Genome Biol (2014) 15(12):550. doi: 10.1186/s13059-014-0550-8
31. Ritchie M, Phipson B, Wu D, Hu Y, Law C, Shi W, et al. Limma Powers Differential Expression Analyses for RNA-Sequencing and Microarray Studies. Nucleic Acids Res (2015) 43(7):e47. doi: 10.1093/nar/gkv007
32. Foroutan M, Bhuva DD, Lyu R, Horan K, Cursons J, Davis MJ. Single Sample Scoring of Molecular Phenotypes. BMC Bioinf (2018) 19(1):404. doi: 10.1186/s12859-018-2435-4
33. Butler A, Hoffman P, Smibert P, Papalexi E, Satija R. Integrating Single-Cell Transcriptomic Data Across Different Conditions, Technologies, and Species. Nat Biotechnol (2018) 36(5):411–20. doi: 10.1038/nbt.4096
34. Robinson M, McCarthy D, Smyth GJB. Edger: A Bioconductor Package for Differential Expression Analysis of Digital Gene Expression Data. Bioinformatics (2010) 26(1):139–40. doi: 10.1093/bioinformatics/btp616
35. Sergushichev A. An Algorithm for Fast Preranked Gene Set Enrichment Analysis Using Statistic Calculation. bioRxiv. doi: 10.1101/060012
36. Robin X, Turck N, Hainard A, Tiberti N, Lisacek F, Sanchez J, et al. Proc: An Open-Source Package for R and s+ to Analyze and Compare ROC Curves. BMC Bioinformatics (2011) 12:77. doi: 10.1186/1471-2105-12-77
37. Durinck S, Spellman P, Birney E, Huber W. Mapping Identifiers for the Integration of Genomic Datasets With the R/Bioconductor Package Biomart. Nat Protoc (2009) 4(8):1184–91. doi: 10.1038/nprot.2009.97
38. Charoentong P, Finotello F, Angelova M, Mayer C, Efremova M, Rieder D, et al. Pan-Cancer Immunogenomic Analyses Reveal Genotype-Immunophenotype Relationships and Predictors of Response to Checkpoint Blockade. Cell Rep (2017) 18(1):248–62. doi: 10.1016/j.celrep.2016.12.019
39. Schmiedel BJ, Singh D, Madrigal A, Valdovino-Gonzalez AG, White BM, Zapardiel-Gonzalo J, et al. Impact of Genetic Polymorphisms on Human Immune Cell Gene Expression. Cell (2018) 175(6):1701–15.e16. doi: 10.1016/j.cell.2018.10.022
40. Sommariva S, Tarricone R, Lazzeri M, Ricciardi W, Montorsi F. Prognostic Value of the Cell Cycle Progression Score in Patients With Prostate Cancer: A Systematic Review and Meta-Analysis. Eur Urol (2016) 69(1):107–15. doi: 10.1016/j.eururo.2014.11.038
41. Vaddepally RK, Kharel P, Pandey R, Garje R, Chandra AB. Review of Indications of FDA-Approved Immune Checkpoint Inhibitors Per NCCN Guidelines With the Level of Evidence. Cancers (Basel) (2020) 12(3):738. doi: 10.3390/cancers12030738
42. Shukla SA, Bachireddy P, Schilling B, Galonska C, Zhan Q, Bango C, et al. Cancer-Germline Antigen Expression Discriminates Clinical Outcome to CTLA-4 Blockade. Cell (2018) 173(3):624–33.e8. doi: 10.1016/j.cell.2018.03.026
43. Cabrita R, Lauss M, Sanna A, Donia M, Skaarup Larsen M, Mitra S, et al. Tertiary Lymphoid Structures Improve Immunotherapy and Survival in Melanoma. Nature (2020) 577(7791):561–5. doi: 10.1038/s41586-019-1914-8
44. Wherry E, Kurachi M. Molecular and Cellular Insights Into T Cell Exhaustion. Nat Rev Immunol (2015) 15(8):486–99. doi: 10.1038/nri3862
45. Khan O, Giles JR, McDonald S, Manne S, Ngiow SF, Patel KP, et al. TOX Transcriptionally and Epigenetically Programs CD8(+) T Cell Exhaustion. Nature (2019) 571(7764):211–8. doi: 10.1038/s41586-019-1325-x
46. Duan Q, Zhang H, Zheng J, Zhang L. Turning Cold Into Hot: Firing Up the Tumor Microenvironment. Trends Cancer (2020) 6(7):605–18. doi: 10.1016/j.trecan.2020.02.022
47. Kather J, Suarez-Carmona M, Charoentong P, Weis C, Hirsch D, Bankhead P, et al. Topography of Cancer-Associated Immune Cells in Human Solid Tumors. Elife (2018) 7:e36967. doi: 10.7554/eLife.36967
48. Harjunpää H, Llort Asens M, Guenther C, Fagerholm SC. Cell Adhesion Molecules and Their Roles and Regulation in the Immune and Tumor Microenvironment. Front Immunol (2019) 10:1078. doi: 10.3389/fimmu.2019.01078
49. Li X, Wenes M, Romero P, Huang S, Fendt S, Ho P. Navigating Metabolic Pathways to Enhance Antitumour Immunity and Immunotherapy. Nat Rev Clin Oncol (2019) 16(7):425–41. doi: 10.1038/s41571-019-0203-7
50. Clarke J, Panwar B, Madrigal A, Singh D, Gujar R, Wood O, et al. Single-Cell Transcriptomic Analysis of Tissue-Resident Memory T Cells in Human Lung Cancer. J Exp Med (2019) 216(9):2128–49. doi: 10.1084/jem.20190249
51. Huang AC, Orlowski RJ, Xu X, Mick R, George SM, Yan PK, et al. A Single Dose of Neoadjuvant PD-1 Blockade Predicts Clinical Outcomes in Resectable Melanoma. Nat Med (2019) 25(3):454–61. doi: 10.1038/s41591-019-0357-y
52. Lepletier A, Madore J, O’Donnell JS, Johnston RL, Li XY, McDonald E, et al. Tumor CD155 Expression is Associated With Resistance to Anti-PD1 Immunotherapy in Metastatic Melanoma. Clin Cancer Res (2020) 26(14):3671–81. doi: 10.1158/1078-0432.Ccr-19-3925
53. van der Leun A, Thommen D, Schumacher T. CD8 T Cell States in Human Cancer: Insights From Single-Cell Analysis. J Nat Rev Cancer (2020) 20(4):218–32. doi: 10.1038/s41568-019-0235-4
54. Berraondo P, Sanmamed M, Ochoa M, Etxeberria I, Aznar M, Pérez-Gracia J, et al. Cytokines in Clinical Cancer Immunotherapy. Br J Cancer (2019) 120(1):6–15. doi: 10.1038/s41416-018-0328-y
55. Stanton S, Adams S, Disis M. Variation in the Incidence and Magnitude of Tumor-Infiltrating Lymphocytes in Breast Cancer Subtypes: A Systematic Review. JAMA Oncol (2016) 2(10):1354–60. doi: 10.1001/jamaoncol.2016.1061
56. Zhang P, Liu M, Cui Y, Zheng P, Liu Y. Microsatellite Instability Status Differentially Associates With Intratumoral Immune Microenvironment in Human Cancers. Brief Bioinform (2021) 22(3):bbaa180. doi: 10.1093/bib/bbaa180
57. Cerezo M, Rocchi S. Cancer Cell Metabolic Reprogramming: A Keystone for the Response to Immunotherapy. Cell Death Dis (2020) 11(11):964. doi: 10.1038/s41419-020-03175-5
58. Gu-Trantien C, Migliori E, Buisseret L, de Wind A, Brohée S, Garaud S, et al. CXCL13-Producing TFH Cells Link Immune Suppression and Adaptive Memory in Human Breast Cancer. JCI Insight (2017) 2(11):e91487. doi: 10.1172/jci.insight.91487
59. Goswami S, Chen Y, Anandhan S, Szabo P, Basu S, Blando J, et al. ARID1A Mutation Plus CXCL13 Expression Act as Combinatorial Biomarkers to Predict Responses to Immune Checkpoint Therapy in Mucc. Sci Trans Med (2020) 12(548):eabc4220. doi: 10.1126/scitranslmed.abc4220
60. Yang M, Lu J, Zhang G, Wang Y, He M, Xu Q, et al. CXCL13 Shapes Immunoactive Tumor Microenvironment and Enhances the Efficacy of PD-1 Checkpoint Blockade in High-Grade Serous Ovarian Cancer. J Immunother Cancer (2021) 9(1):e001136. doi: 10.1136/jitc-2020-001136
61. Majidpoor J, Mortezaee K. The Efficacy of PD-1/PD-L1 Blockade in Cold Cancers and Future Perspectives. Clin Immunol (2021) 226:108707. doi: 10.1016/j.clim.2021.108707
62. Cohen EEW, Bell RB, Bifulco CB, Burtness B, Gillison ML, Harrington KJ, et al. The Society for Immunotherapy of Cancer Consensus Statement on Immunotherapy for the Treatment of Squamous Cell Carcinoma of the Head and Neck (HNSCC). J Immunother Cancer (2019) 7(1):184. doi: 10.1186/s40425-019-0662-5
63. Egen J, Ouyang W, Wu LJI. Human Anti-Tumor Immunity: Insights From Immunotherapy Clinical Trials. Immunity (2020) 52(1):36–54. doi: 10.1016/j.immuni.2019.12.010
64. Friedlander P, Wood K, Wassmann K, Christenfeld A, Bhardwaj N, Oh W. A Whole-Blood RNA Transcript-Based Gene Signature Is Associated With the Development of CTLA-4 Blockade-Related Diarrhea in Patients With Advanced Melanoma Treated With the Checkpoint Inhibitor Tremelimumab. J Immunother Cancer (2018) 6: (1):90. doi: 10.1186/s40425-018-0408-9
Keywords: immune checkpoint inhibitor, cancer, PD-1hiCD8+ T cell, biomarker, CXCL13
Citation: Yang Z, Deng Y, Cheng J, Wei S, Luo H and Liu L (2021) Tumor-Infiltrating PD-1hiCD8+-T-Cell Signature as an Effective Biomarker for Immune Checkpoint Inhibitor Therapy Response Across Multiple Cancers. Front. Oncol. 11:695006. doi: 10.3389/fonc.2021.695006
Received: 14 April 2021; Accepted: 25 August 2021;
Published: 15 September 2021.
Edited by:
Benjamin Frey, University Hospital Erlangen, GermanyReviewed by:
Stina Linnea Wickström, Karolinska Institutet (KI), SwedenKeywan Mortezaee, Kurdistan University of Medical Sciences, Iran
Copyright © 2021 Yang, Deng, Cheng, Wei, Luo and Liu. This is an open-access article distributed under the terms of the Creative Commons Attribution License (CC BY). The use, distribution or reproduction in other forums is permitted, provided the original author(s) and the copyright owner(s) are credited and that the original publication in this journal is cited, in accordance with accepted academic practice. No use, distribution or reproduction is permitted which does not comply with these terms.
*Correspondence: Lunxu Liu, lunxu_liu@aliyun.com
†These authors have contributed equally to this work