 Jiarui Yang1†
 Shuguang Zhu2†Juanjuan Yong3†Long Xia2Xiangjun Qian1Jiawei Yang1
 Xueqiao Hu1Yuxuan Li1Chusi Wang1,4Wenguang Peng1
 Lei Zhang1*Meihai Deng4*
 Weidong Pan1*
- 1Department of Biliary-Pancreatic Surgery, The Third Affiliated Hospital of Sun Yat-sen University, Guangzhou, China
- 2Department of Hepatic Surgery and Liver Transplantation Center, The Third Affiliated Hospital of Sun Yat-Sen University, Guangzhou, China
- 3Department of Pathology, Sun Yat-Sen Memorial Hospital, Sun Yat-Sen University, Guangzhou, China
- 4Department of Hepatobiliary Surgery, The Third Affiliated Hospital of Sun Yat-sen University, Guangzhou, China
Background: Microvascular invasion (MVI) is highly associated with poor prognosis in patients with liver cancer. Predicting MVI before surgery is helpful for surgeons to better make surgical plan. In this study, we aim at establishing a nomogram to preoperatively predict the occurrence of microvascular invasion in liver cancer.
Method: A total of 405 patients with postoperative pathological reports who underwent curative hepatocellular carcinoma resection in the Third Affiliated Hospital of Sun Yat-sen University from 2013 to 2015 were collected in this study. Among these patients, 290 were randomly assigned to the development group while others were assigned to the validation group. The MVI predictive factors were selected by Lasso regression analysis. Nomogram was established to preoperatively predict the MVI risk in HCC based on these predictive factors. The discrimination, calibration, and effectiveness of nomogram were evaluated by internal validation.
Results: Lasso regression analysis revealed that discomfort of right upper abdomen, vascular invasion, lymph node metastases, unclear tumor boundary, tumor necrosis, tumor size, higher alkaline phosphatase were predictive MVI factors in HCC. The nomogram was established with the value of AUROC 0.757 (0.716–0.809) and 0.768 (0.703–0.814) in the development and the validation groups. Well-fitted calibration was in both development and validation groups. Decision curve analysis confirmed that the predictive model provided more benefit than treat all or none patients. The predictive model demonstrated sensitivity of 58.7%, specificity of 80.7% at the cut-off value of 0.312.
Conclusion: Nomogram was established for predicting preoperative risk of MVI in HCC. Better treatment plans can be formulated according to the predicted results.
Introduction
Hepatocellular carcinoma (HCC) is the sixth most common cancer and ranks as the third tumor-related death in the world (1). Although HCC can potentially be cured through resection or transplantation at early stage, most patients lost opportunities for curative surgical treatment because of liver dysfunction or disease extension (2). HCC recurrence occurs in nearly 70% of patients within 5 years (3).
Vascular invasion is one of the most crucial factors for poor prognosis after operation for HCC (4). It can be divided into macrovascular invasion (vascular invasion) and microvascular invasion (MVI). The invasion of cancer cell nest in the endothelial vascular lumen is defined as MVI (5). MVI is difficult to identify by preoperative imagine, and it can only be affirmed by postoperative pathology with little value in preoperative treatment management.
Lots of efforts have been taken to explore the relationships between preoperative parameters and MVI. Tumor diameter has been reported to be predictors for MVI in HCC patients (6, 7). However, the cut-off values of tumor diameter are inconsistent and they are just simply divided by equidistance. The use of serum or tumor biomarkers (such as AFP) to estimate MVI risk has also been reported (7, 8). Unfortunately, these serum markers can also elevate in HCC without MVI. Although some radiomic signatures have been shown to predict MVI risk, they were difficult to apply in clinical work (9). Therefore, we retrospectively analyzed clinical, imagine features and the feeling of patients with HCC to explore predictive factors of MVI in this study. We also developed a preoperative prediction model for MVI and validated it by internal validation.
Materials and Methods
Patients
Four hundred five consecutive HCC patients who received liver resection were prospectively collected at the Third Affiliated Hospital of Sun Yat-sen University, between January 1, 2013, and December 31, 2015. The inclusion criteria were (1) undergone R0 tumor resection as defined in a previous report (10), (2) MR enhanced scan of the liver was performed within 1 month before resection, (3) Child-Pugh A or B. The exclusion criteria were: (1) HCC with satellite lesions, portal vein tumor thrombus, or extrahepatic metastasis, (2) patients with previous anticancer treatment, (3) patients with other malignancies prior to surgery, (4) incomplete clinical data. Two hundred ninety eligible patients were included into the development group for developing the nomogram; one hundred fifteen patients were entered into the validation group. The assignment of development and validation groups was based on random number generated by package “caret” of R software and the random number generation code was followed by the instruction of package “caret”. The two groups were randomly assigned by a ratio of 7:3. The random number was 20191218.
Laboratory Test and Pathological Characteristics
Basic information of admission included the discomfort of right upper abdomen, routine preoperative laboratory examination, preoperative liver function tests, HBV DNA load, and α-fetoprotein (AFP) levels were collected from medical records, ultrasonography, MRI, and CT of the abdomen. All surgical specimens were routinely examined histopathologically. Each specimen was cut continuously at the maximum diameter, fixed within 30 min after removal, and then seven-point baseline sampling was performed (11). Cancer cell nest in the endothelial vascular lumen was defined as MVI, including intra-tumoral and extra-tumoral MVI.
Statistical Analysis
T-test was used to analyze parametric data of component numerical variables, and Mann–Whitney rank sum test was used to analyze non-parametric data. Fisher’s exact test or chi square test was used to compare the categorical variables. The sensitivity and specificity were estimated by the ROC numerical integration. The optimum subsection of each numerical variable is obtained by the ROC and the optimal scale regression analysis. P less than 0.05 represented statistical significance. The above analyses were performed by SPSS 23.0 software (IBM corporation, 2015, USA). Application of lasso regression analysis was used to select the best predictors of liver cancer in patients with MVI and the non-zero coefficient factor should be selected (12). All possible predictive factors were performed to construct a simplified model for preoperative prediction of MVI. A simplified nomogram is shown based on the results of LASSO regression analyses. The discrimination performance of the nomogram was quantified by the Harrell’s concordance index (C-index) and the discrimination was relatively good when the value of C-index was higher than 0.75 (13). Calibration curves were conducted to estimate the predictive efficacy of the predictive model (14). Decision curve was carried out to calculate the net benefits of individuals in different threshold probabilities and confirm clinical efficacy of the predictive model (15). The net benefit was calculated by subtracting all false positive patients’ proportion from the true positive patients’ (16). And it was a decision analysis method that put benefits and harms on the same scale (17). The above statistical methods were carried out with R software version 3.6.1 (http://www.r-project.org) with R software packages “Hmisc”, “rms”, “ROCR”, “rmda”, “caret”, “glmnet” and “foreign”.
Results
Patients Characteristics
The baseline data of 405 patients were listed in Table 1; 290 and 115 patients were divided into the development and validation groups, respectively. There was no significant difference in baseline clinicopathological data between the development and validation groups. MVI was found in 123 (42.4%) and 45 (39.1%) patients in the two groups, respectively.
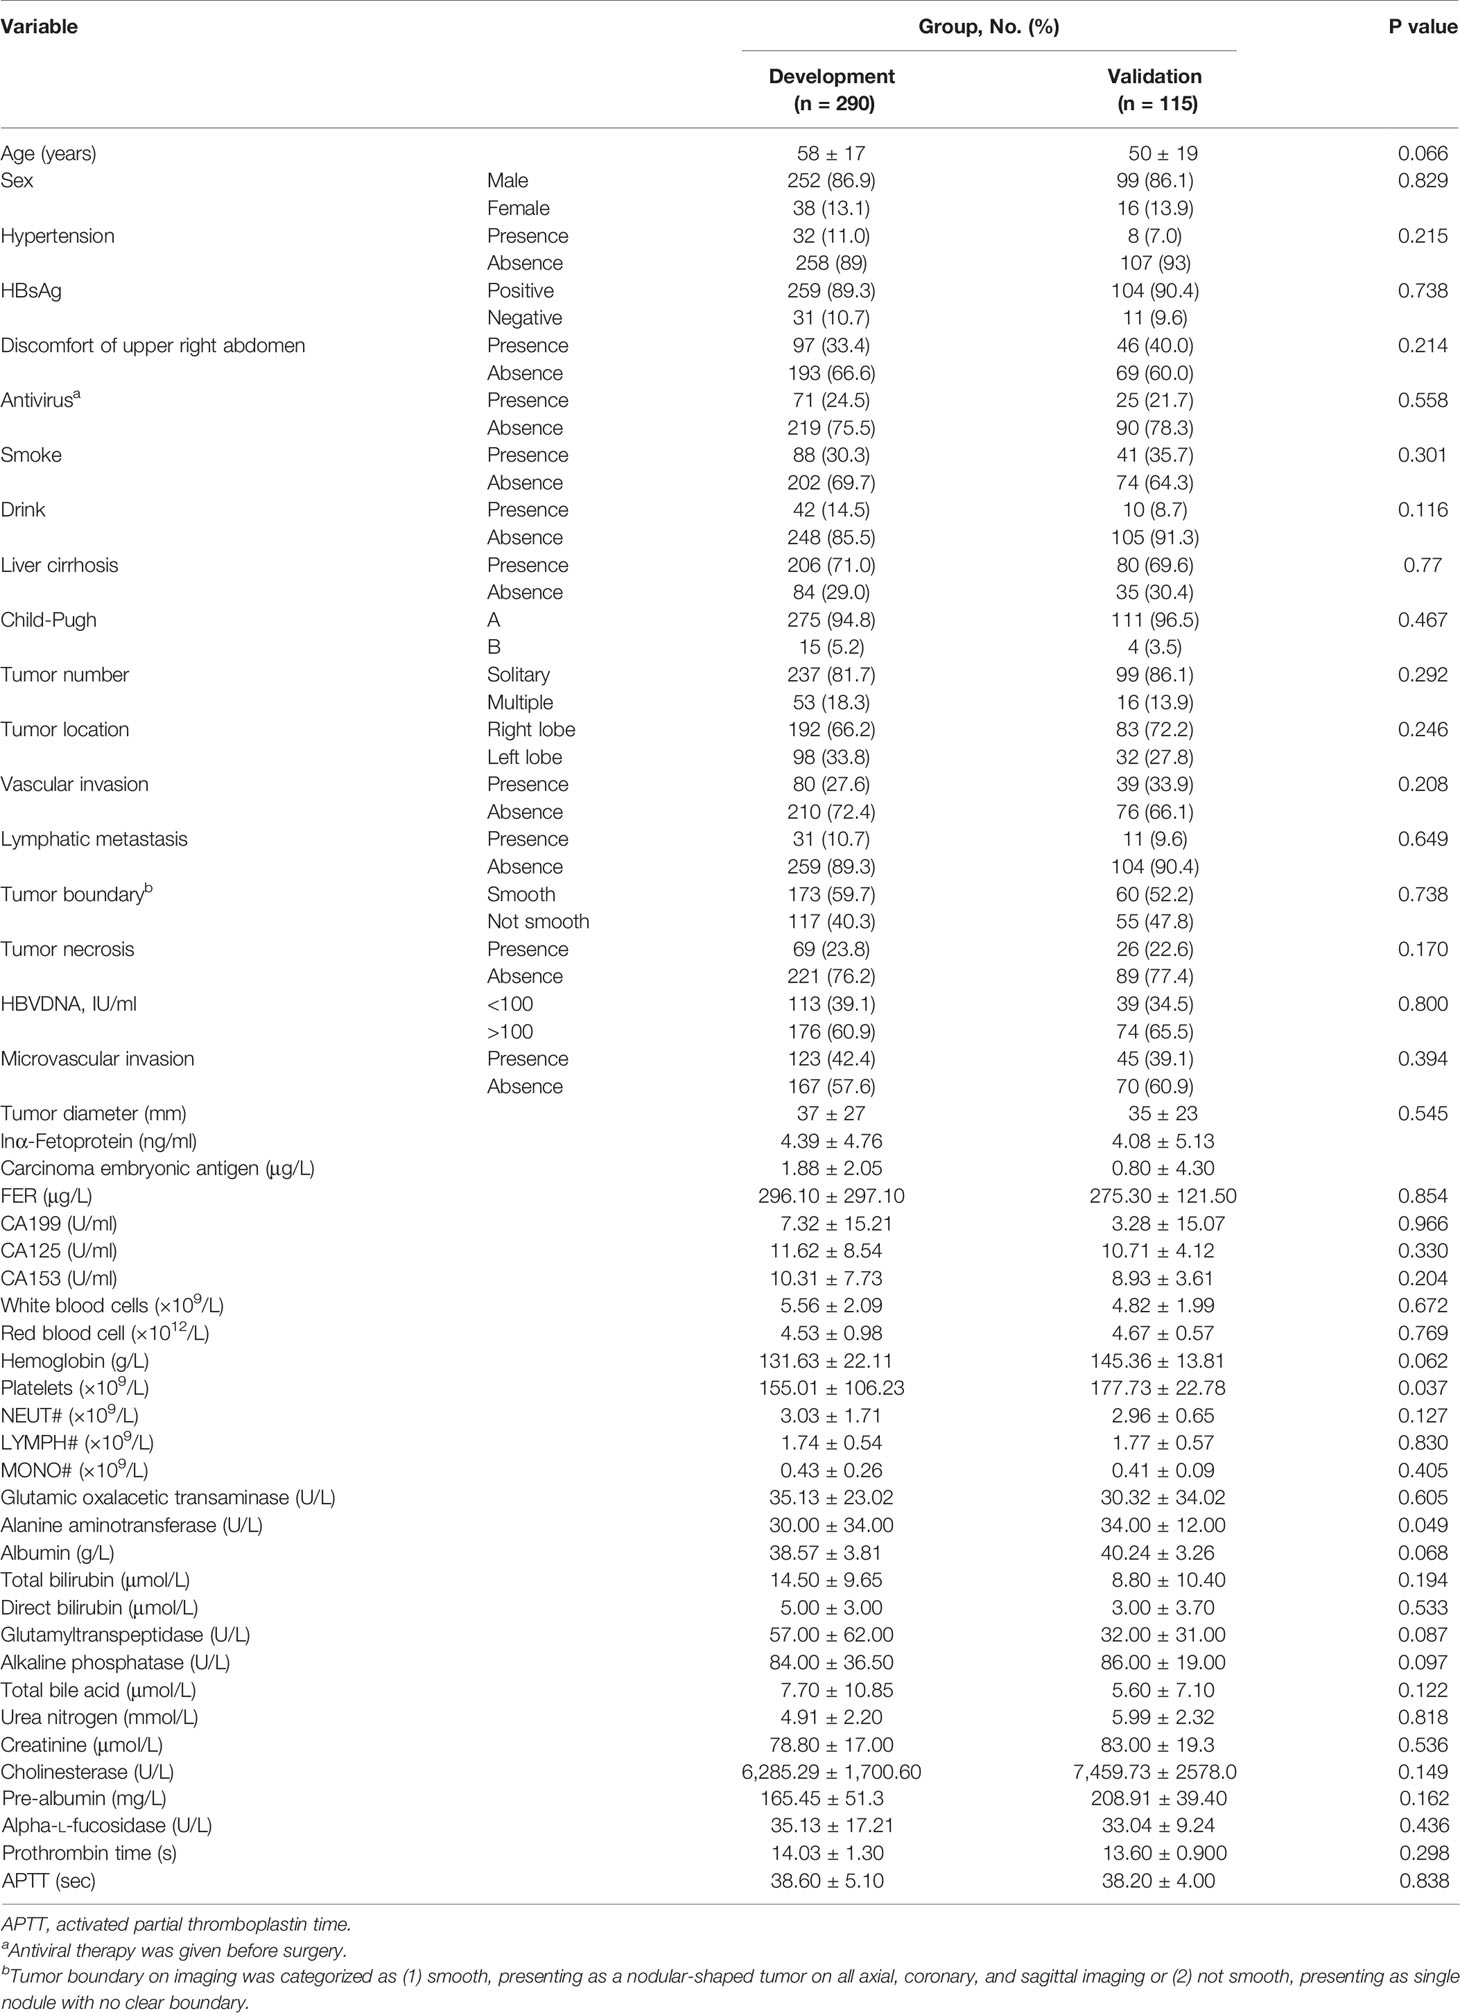
Table 1 Patients Characteristics.
Factor Selection
The variables used in LASSO regression analyses were collected from the data obtained preoperatively. Diameter, number, boundary and necrosis of tumor were extracted by preoperative imaging. LASSO regression analyses results were presented in Figure 1. Seven factors were found to be related with the MVI. These factors included discomfort of right upper abdomen, vascular invasion, lymphatic metastasis, tumor boundary, tumor diameter, tumor necrosis, and alkaline phosphatase (ALP). Discomfort of right upper abdomen had already excluded the discomfort caused by biliary tract disease or stomach illness. Vascular invasion and lymphatic invasion were the focus which could be observed directly by MRI. Tumor diameter was divided into four grades by optimal scale regression analysis (10–35, 35–65, 65–120, 120–220 mm).
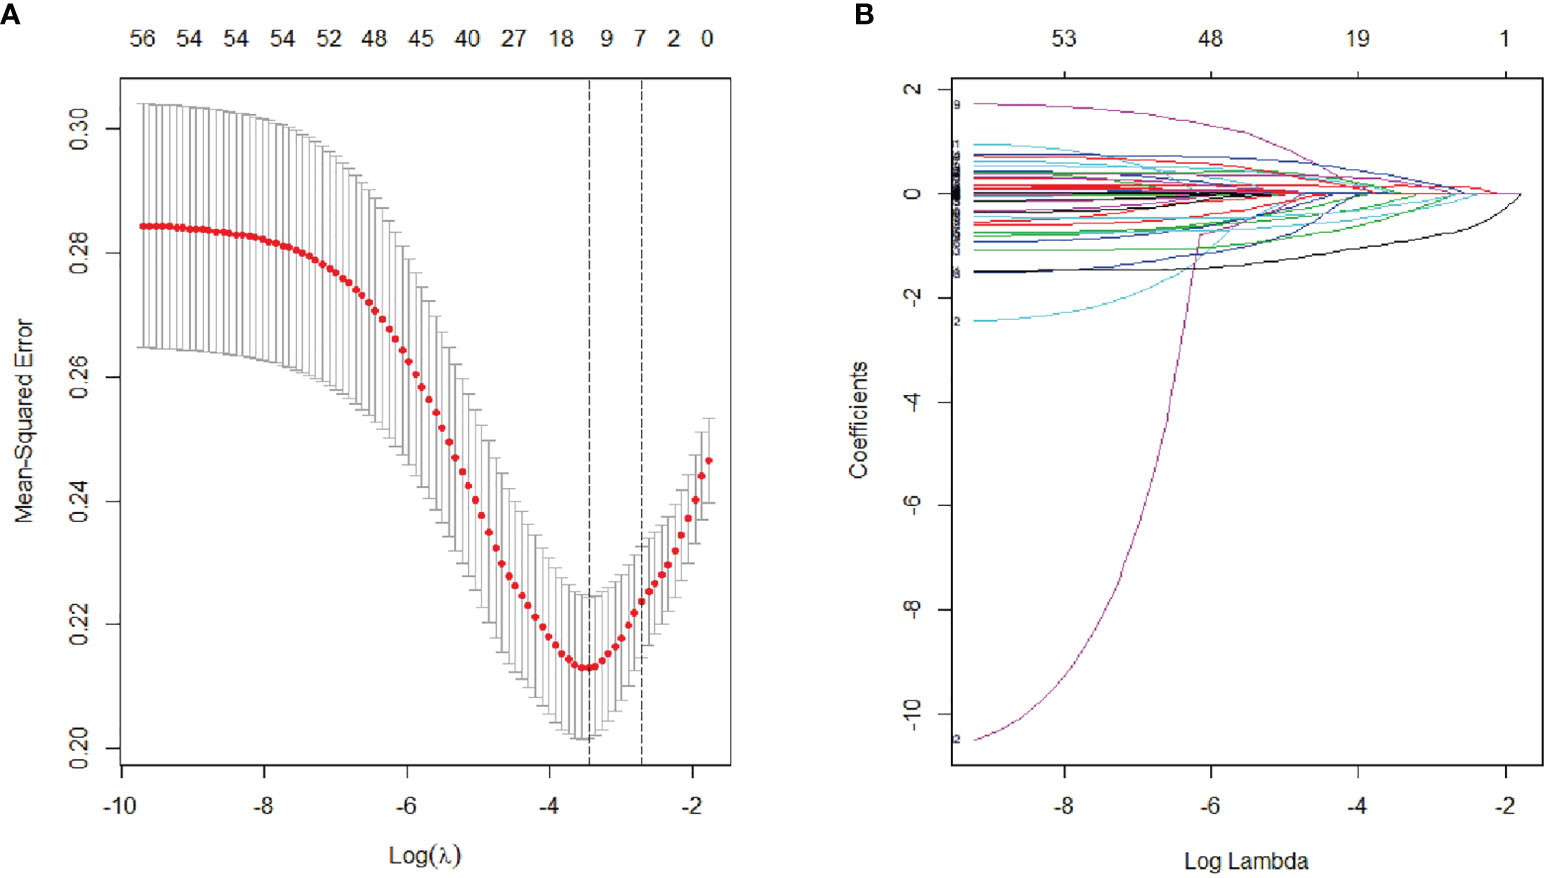
Figure 1 Lasso binary logistic regression analysis to select predictors of MVI. (A) The optimal parameter (λ) of Lasso is selected by the minimum criterion for five times cross validation. The relationship between partial likelihood deviation (binomial deviation) and logarithm (λ). By executing the minimum criterion and the 1 SE (1-SE criterion) of the minimum criterion, a dashed line was displayed at the optimal value. (B) The distribution of lasso coefficient of fifty-six factors. The coefficient distribution is calculated according to the logarithmic (λ) sequence. Vertical lines were shown at the values selected using cross validation, where the best λ produced seven factors with non-zero coefficients.
Constructing MVI Preoperative Prediction Nomogram
Seven factors chosen by LASSO regression analyses were used to construct a MVI predictive nomogram (Figure 2). The calibration curves showed a good agreement (Figure 3) in both development and validation groups. The C-index was 0.757 (0.723–0.792) in the development group and 0.768 (0.718–0.803) in the validation group. The results indicated an acceptable discrimination capability. The ROC curve in development and validation groups were showed in Figure 4. The AUC values of the nomogram were 0.757 and 0.768 in the development and validation groups, respectively.
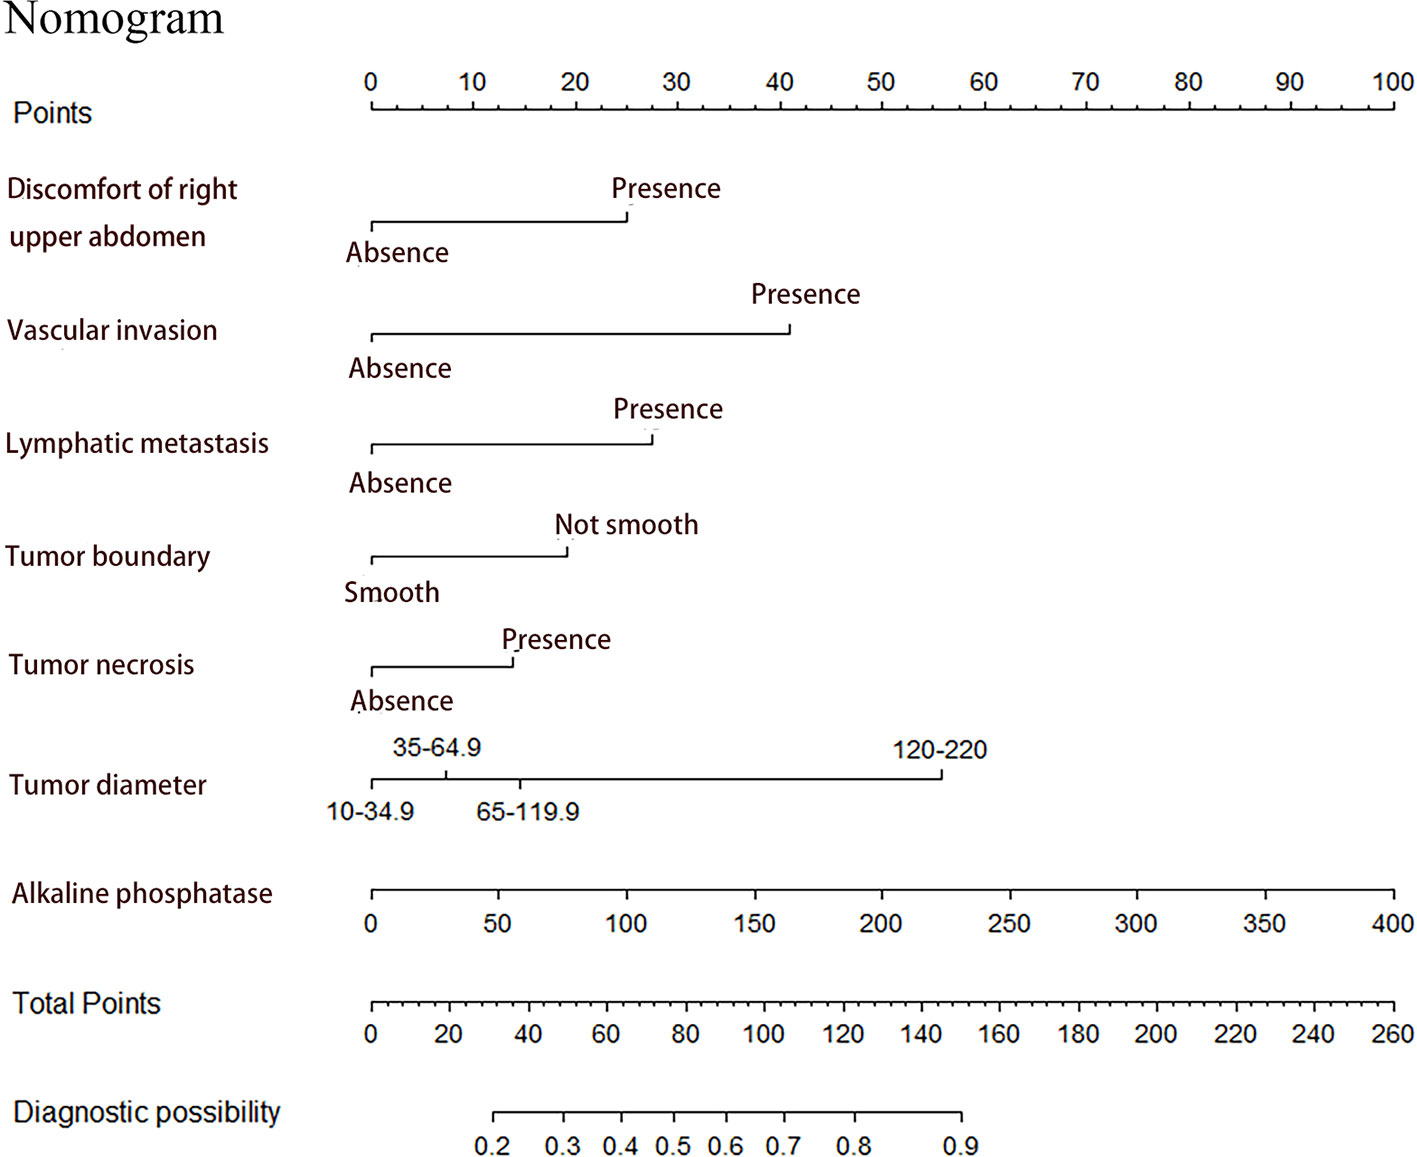
Figure 2 Prediction of MVI in patients with hepatocellular carcinoma by nomogram. In order to get every factor’s position on the corresponding axis, lines were drawn on the point axis to represent the number of points. Added all points, find the position of the total score to determine the MVI probability of that line in the nomogram.
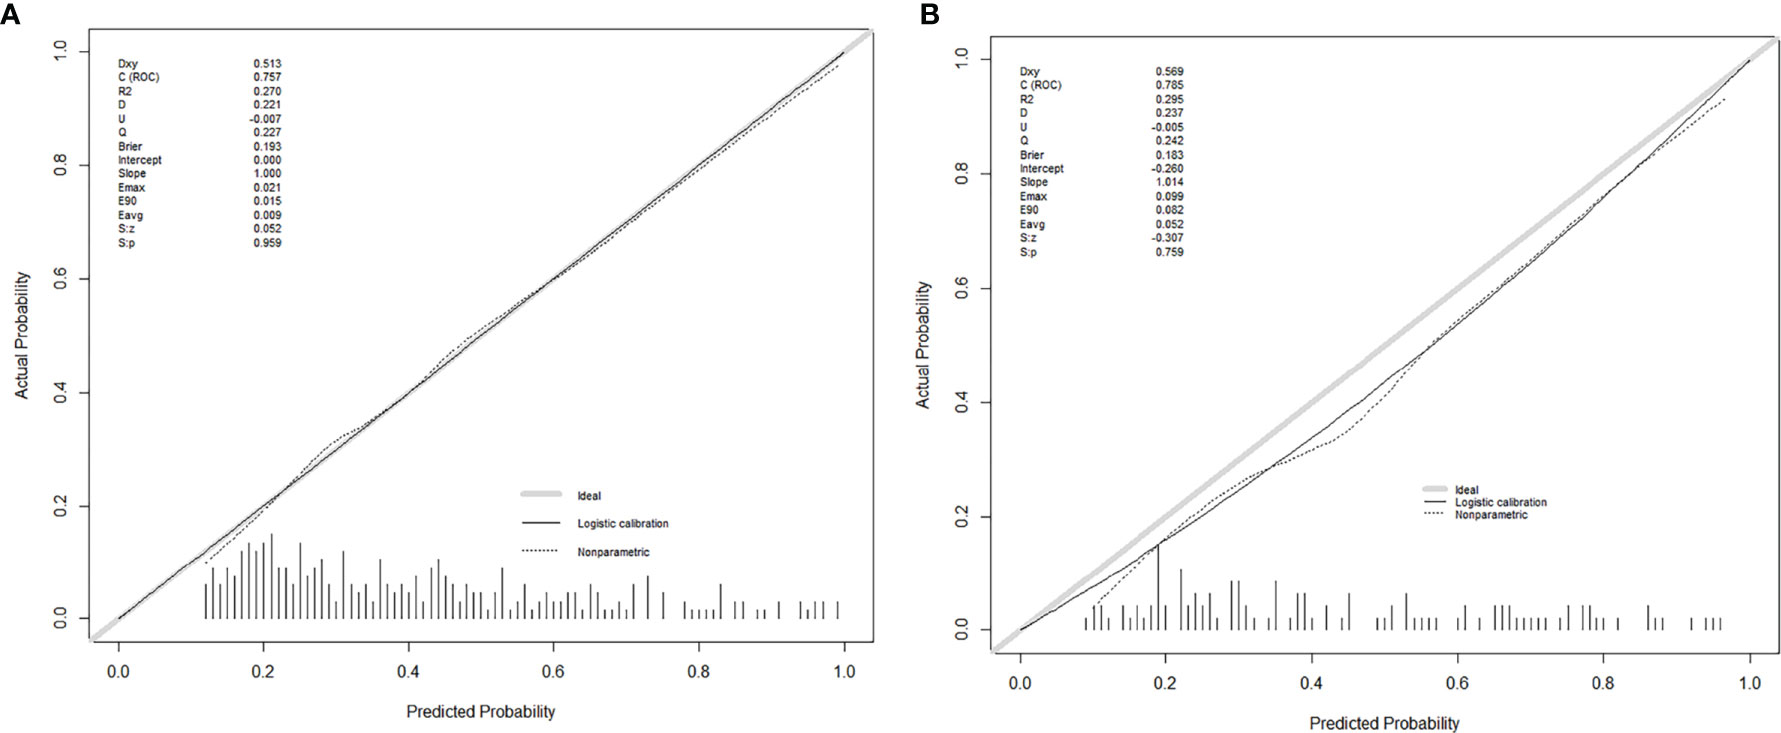
Figure 3 The calibration curves for predicting MVI in the development group (A) and the validation group (B), respectively. Nomogram-predicted MVI was plotted on the X-axis, and the actual MVI occurrence was plotted on the Y-axis. A plot along the 45° line would indicate a perfect calibration model in which the predicted MVI is identical to the actual MVI. The distribution of the predicted probabilities of MVI occurrence was shown at the top of the graphs.
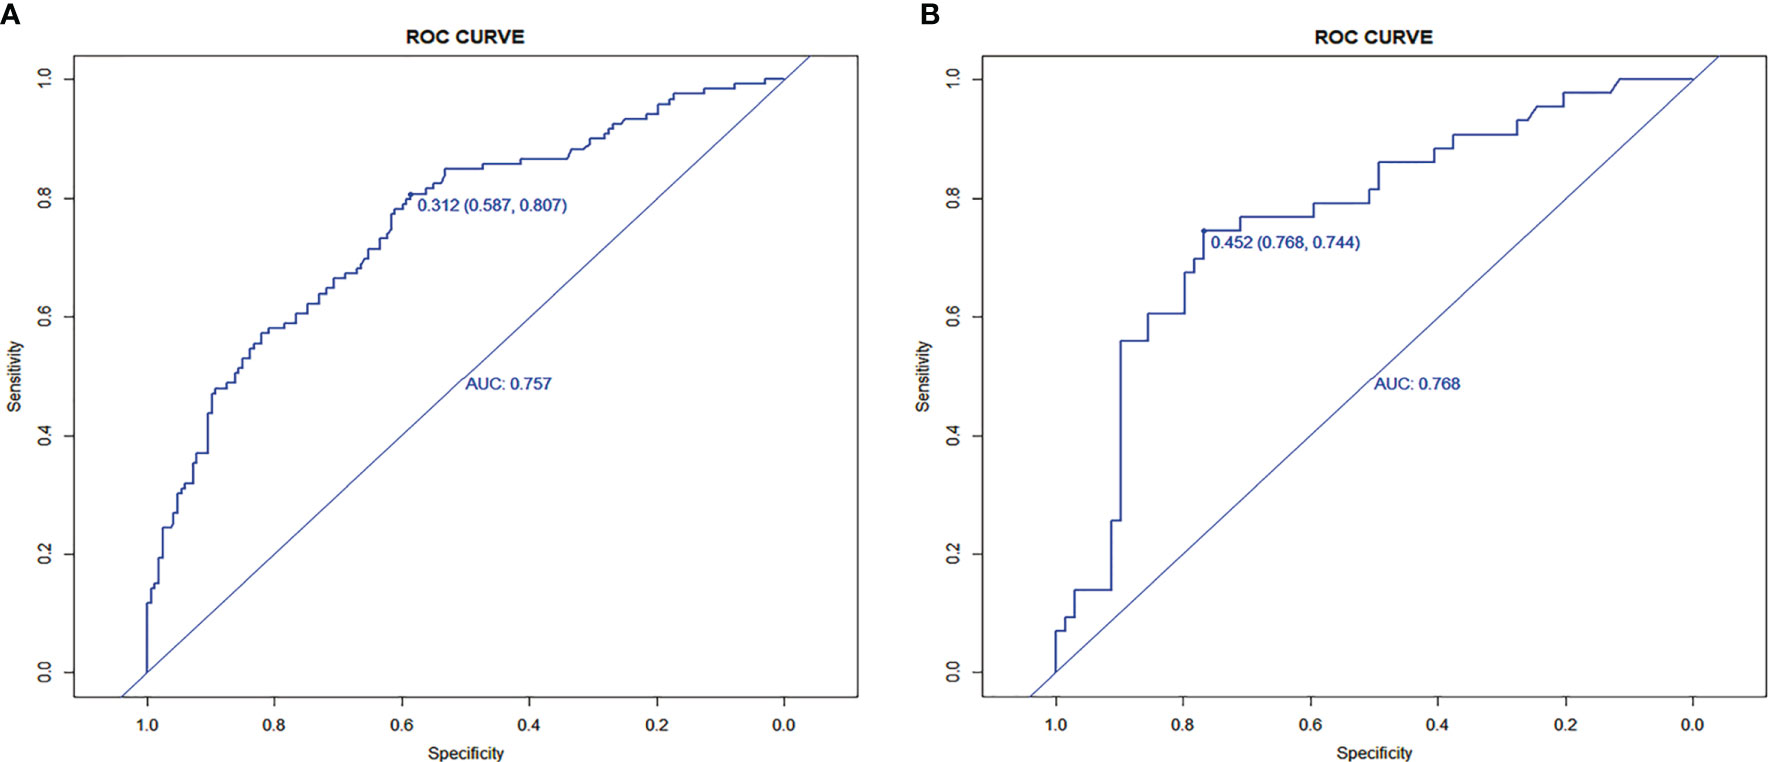
Figure 4 The ROC curves in (A) the development group (0.757) and (B) the validation group (0.768).
The decision curve was exhibited in Figure 5. When the cut-off value was 0.312, the net benefit was 20.5 and 18.0 in the development and validation groups, respectively.
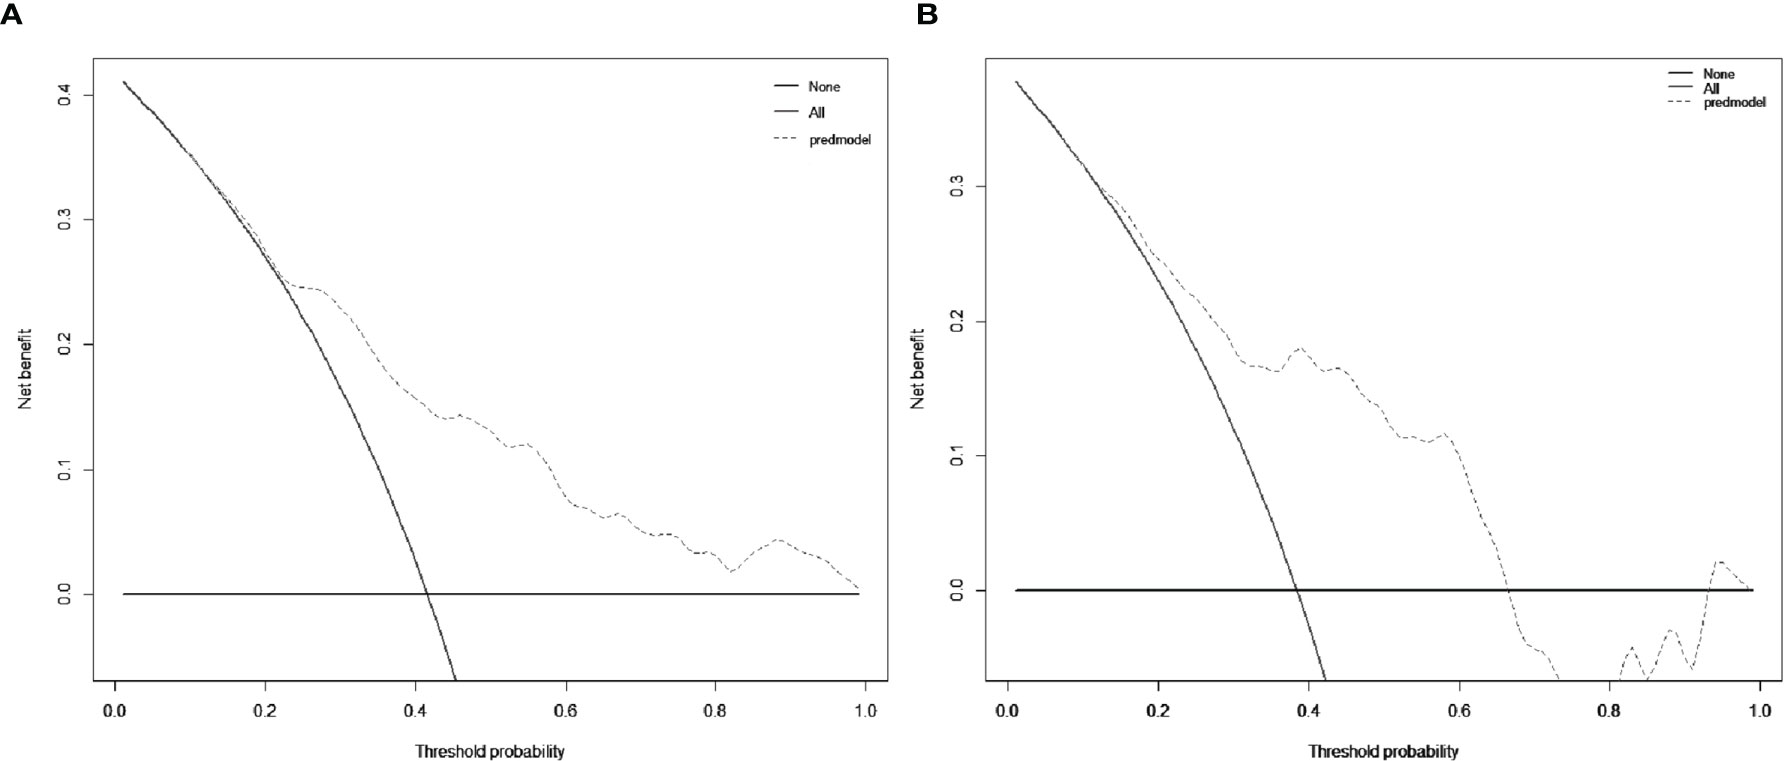
Figure 5 Decision curve analysis (DCA) for the nomogram in the development group (A) and the validation group (B), respectively. The black solid lines hypothesized that all patients were MVI positive or negative, respectively. The dotted-line represented the net benefit of the nomogram at different threshold probabilities.
Risk of MVI Based on the Nomogram
The optimal cut-off value of the nomogram was 0.312. The sensitivity and specificity when used in differentiating the presence from absence of MVI were 58.7 and 80.7% in the development group, and 76.8 and 74.4% in the validation group, respectively.
Discussion
It was difficult to predict MVI preoperatively because MVI lacked specific clinical features and imaging characteristic. We conducted a model to preoperatively predict MVI in HCC patients in this study. Furthermore, we performed an internal validation to evaluate the quality of the nomogram. The nomogram incorporated discomfort of right upper abdomen, vascular invasion, lymphatic metastasis, tumor boundary, tumor diameter, tumor necrosis and alkaline phosphatase (ALP), which exhibited a good accuracy for predicting MVI. All factors used in the nomogram to predict MVI were easy-acquired, non-invasive for patients.
Previous studies (6, 7) used tumor boundary as well as diameter to predict MVI, but further clinical validation was required. In addition, we represented the first study to report the discomfort of the right upper abdomen for preoperative prediction of MVI. After excluding other reasons for discomfort of the right upper abdomen, such as biliary tract, gallbladder disease, and stomach disease, our results indicated that discomfort of the right upper abdomen related to MVI. Discomfort of the right upper abdomen suggested the injury of liver. In our study the proportion of discomfort of the right upper abdomen was 59 and 32% in HCC patients with or without MVI, respectively.
The gold standard that diagnosed MVI is histopathological examination after surgical resection and MVI couldn’t be observed by imaging (11). Therefore, if we observed vascular invasion in HCC by imaging examination, we still couldn’t diagnosis MVI. In our study, 47% of patients who showed MVI by pathologic examination after surgery had vascular invasion by gross examination before surgery. In contrast, only 17% of patients who did not show MVI on pathologic examination after surgery had vascular invasion by gross examination before surgery. 66% of patients who were found with vascular invasion were found to have MVI by histopathological examination after surgery. Although there was no report on the association between vascular invasion and MVI, Alberto et al. (18). reported that intravascular free-floating tumor cluster formed by vascular invasion may act like MVI. It supported our findings that vascular invasion was an important factor associated with MVI.
According to histology, MVI-positive tumor had an aggressive tendency to invade the tumor capsule and lymphatic nodules, which led to irregular tumor boundary and lymphatic metastasis (19, 20). Chou et al. (21) reported 67% MVI positive patients were found irregular boundary preoperatively. MVI was usually distributed on the edge of HCC (11). Previous studies (7, 9) also used these factors to predict MVI. Another predictive factor was tumor diameters. Almost all studies indicated that tumor diameter was associated with MVI. However, the classification of tumor diameter remained controversial. Kim et al. (22) suggested that tumor diameter more than 2 cm was risk factor of MVI. Siegel et al. (23) considered that tumor diameter more than 3 cm was risk factor of MVI. In our study, we made a more detailed division of tumor diameter by using optimal scale regression analysis in development group (10–35, 35–65, 65–120, 120–220 mm). Pawlik et al. found that the positive rate of MVI was 25, 40, 55, and 63% with tumor diameter less than 3 cm, between and 5 cm, between and 6.5 cm and more than 6.5 cm, respectively. This was basically consistent with our results.
In addition to the imaging analysis, we also evaluated the preoperative clinical factors. We found that ALP was associated with MVI. ALP was widely distributed in the liver. The increased value of ALP was associated with extrahepatic bile duct obstruction and intrahepatic space-occupying lesions. There were no studies reporting the correlation between ALP and MVI. A prospective study about the relationship between ALP and MVI was urgently needed.
Furthermore, we developed a user-friendly nomogram based on easy-accessible, non-invasive factors. Moreover, the nomogram showed satisfactory predictive performance of predicting MVI in both development group (C-index: 0.757) and validation group (C-index: 0.768) with favorable calibration. The use of our nomogram might be helpful to the surgeon in therapeutic decision making.
Our study had some limitations. First, it was a unicentric retrospective study and internal validation. Therefore, it should validate the results from the other centers. Second, the discomfort of the right upper abdomen should be classified in detail, but we didn’t find the related reports. Last, there were no quantitative prediction of MVI and no prediction of MVI classification.
Conclusion
We developed and validated a nomogram for preoperative prediction of MVI. The nomogram incorporated clinical and imaging risk factors achieved favorable effectiveness in preoperatively predicting MVI of HCC patients.
Data Availability Statement
The original contributions presented in the study are included in the article/Supplementary Material. Further inquiries can be directed to the corresponding authors.
Ethics Statement
The study followed the Declaration of Helsinki. Because of the retrospective nature of the study, patient consent for inclusion was waived.
Author Contributions
JRY, SZ, and JJY conceived and wrote the paper. LX, XQ, JWY, XH, YL, CW, and WGP collected and analyzed the data. LZ, MD, and WDP revised the whole paper. All authors contributed to the article and approved the submitted version.
Funding
This work was supported by Sun Yat-Sen University Clinical Research Program (YHJH201910), China Postdoctoral Science Foundation (2020TQ0370), and National Science Foundation of China (grant no. 82002587).
Conflict of Interest
The authors declare that the research was conducted in the absence of any commercial or financial relationships that could be construed as a potential conflict of interest.
Acknowledgments
We would like to thank the researchers and study participants for their contributions.
Supplementary Material
The Supplementary Material for this article can be found online at: https://www.frontiersin.org/articles/10.3389/fonc.2021.616976/full#supplementary-material
Supplementary Figure 1 | Tumor size dividing by optimal scale regression analysis. According to the trend of the curve in the figure, tumor size was divided into 10–35, 35–65, 65–120, and 120–220 mm groups.
Supplementary Figure 2 | The histopathological images of the microvascular invasion. The arrows point to the microvascular invasion. (A) ×100; (B) ×400.
References
1. Bray F, Ferlay J, Soerjomataram I, Siegel RL, Torre LA, Jemal A. Global cancer statistics 2018: GLOBOCAN estimates of incidence and mortality worldwide for 36 cancers in 185 countries. CA Cancer J Clin (2018) 68:394–424. doi: 10.3322/caac.21492
2. Adhoute X, Pénaranda G, Raoul JL, Edeline J, Blanc JF, Pol B, et al. Barcelona clinic liver cancer nomogram and others staging/scoring systems in a French hepatocellular carcinoma cohort. World J Gastroenterol (2017) 23:2545–55. doi: 10.3748/wjg.v23.i14.2545
3. Vitale A, Peck-Radosavljevic M, Giannini EG, Vibert E, Sieghart W, Van Poucke S, et al. Personalized treatment of patients with very early hepatocellular carcinoma. J Hepatol (2017) 66:412–23. doi: 10.1016/j.jhep.2016.09.012
4. Otto G, Heuschen U, Hofmann WJ, Krumm G, Hinz U, Herfarth C. Survival and recurrence after liver transplantation versus liver resection for hepatocellular carcinoma: a retrospective analysis. Ann Surg (1998) 227:424–32. doi: 10.1097/00000658-199803000-00015
5. Roayaie S, Blume IN, Thung SN, Guido M, Fiel MI, Hiotis S, et al. A system of classifying microvascular invasion to predict outcome after resection in patients with hepatocellular carcinoma. Gastroenterology (2009) 137:850–5. doi: 10.1053/j.gastro.2009.06.003
6. Lin S, Ye F, Rong W, Song Y, Wu F, Liu Y, et al. Nomogram to Assist in Surgical Plan for Hepatocellular Carcinoma: a Prediction Model for Microvascular Invasion. J Gastrointest Surg (2019) 23:2372–82. doi: 10.1007/s11605-019-04140-0
7. Lei Z, Li J, Wu D, Xia Y, Wang Q, Si A, et al. Nomogram for Preoperative Estimation of Microvascular Invasion Risk in Hepatitis B Virus-Related Hepatocellular Carcinoma Within the Milan Criteria. JAMA Surg (2016) 151:356–63. doi: 10.1001/jamasurg.2015.4257
8. Gouw AS, Balabaud C, Kusano H, Todo S, Ichida T, Kojiro M. Markers for microvascular invasion in hepatocellular carcinoma: where do we stand? Liver Transpl (2011) 17 Suppl 2:S72–80. doi: 10.1002/lt.22368
9. Yang L, Gu D, Wei J, Yang C, Rao S, Wang W, et al. A Radiomics Nomogram for Preoperative Prediction of Microvascular Invasion in Hepatocellular Carcinoma. Liver Cancer (2019) 8:373–86. doi: 10.1159/000494099
10. Wang K, Liu J, Yan ZL, Li J, Shi LH, Cong WM, et al. Overexpression of aspartyl-(asparaginyl)-beta-hydroxylase in hepatocellular carcinoma is associated with worse surgical outcome. Hepatology (2010) 52:164–73. doi: 10.1002/hep.23650
11. Cong WM, Bu H, Chen J, Dong H, Zhu YY, Feng LH, et al. Practice guidelines for the pathological diagnosis of primary liver cancer: 2015 update. World J Gastroenterol (2016) 22:9279–87. doi: 10.3748/wjg.v22.i42.9279
12. Kidd AC, McGettrick M, Tsim S, Halligan DL, Bylesjo M, Blyth KG. Survival prediction in mesothelioma using a scalable Lasso regression model: instructions for use and initial performance using clinical predictors. BMJ Open Respir Res (2018) 5:e000240. doi: 10.1136/bmjresp-2017-000240
13. Han DS, Suh YS, Kong SH, Lee HJ, Choi Y, Aikou S, et al. Nomogram predicting long-term survival after d2 gastrectomy for gastric cancer. J Clin Oncol (2012) 30:3834–40. doi: 10.1200/jco.2012.41.8343
14. Kramer AA, Zimmerman JE. Assessing the calibration of mortality benchmarks in critical care: The Hosmer-Lemeshow test revisited. Crit Care Med (2007) 35:2052–6. doi: 10.1097/01.Ccm.0000275267.64078.B0
15. Vickers AJ, Cronin AM, Elkin EB, Gonen M. Extensions to decision curve analysis, a novel method for evaluating diagnostic tests, prediction models and molecular markers. BMC Med Inform Decis Mak (2008) 8:53. doi: 10.1186/1472-6947-8-53
16. Van Calster B, Wynants L, Verbeek JFM, Verbakel JY, Christodoulou E, Vickers AJ, et al. Reporting and Interpreting Decision Curve Analysis: A Guide for Investigators. Eur Urol (2018) 74:796–804. doi: 10.1016/j.eururo.2018.08.038
17. Vickers AJ, Van Calster B, Steyerberg EW. Net benefit approaches to the evaluation of prediction models, molecular markers, and diagnostic tests. Bmj (2016) 352:i6. doi: 10.1136/bmj.i6
18. Quaglia A, Etessami N, Sim R, Difford J, Dhillon AP. Vascular invasion and herniation by hepatocellular carcinoma in cirrhosis: A wolf in sheep’s clothing? Arch Pathol Lab Med (2005) 129:639–44. doi: 10.1043/1543-2165(2005)129<0639:Viahbh>2.0.Co;2
19. Hu H, Zheng Q, Huang Y, Huang XW, Lai ZC, Liu J, et al. A non-smooth tumor margin on preoperative imaging assesses microvascular invasion of hepatocellular carcinoma: A systematic review and meta-analysis. Sci Rep (2017) 7:15375. doi: 10.1038/s41598-017-15491-6
20. Wang XL, Ai ZS, Fang JP, Tang RY, Chen XM. [Expression of vascular endothelial growth factors (VEGF)-A, -C and -D and their prognostic significance and relationship with angio- and lymphangiogenesis in gastric cancer]. Zhonghua Zhong Liu Za Zhi (2008) 30:837–43.
21. Chou CT, Chen RC, Lin WC, Ko CJ, Chen CB, Chen YL. Prediction of microvascular invasion of hepatocellular carcinoma: preoperative CT and histopathologic correlation. AJR Am J Roentgenol (2014) 203:W253–9. doi: 10.2214/ajr.13.10595
22. Kim BK, Han KH, Park YN, Park MS, Kim KS, Choi JS, et al. Prediction of microvascular invasion before curative resection of hepatocellular carcinoma. J Surg Oncol (2008) 97:246–52. doi: 10.1002/jso.20953
Keywords: hepatocellular carcinoma, microvascular invasion, prediction model, nomogram, internal validation
Citation: Yang J, Zhu S, Yong J, Xia L, Qian X, Yang J, Hu X, Li Y, Wang C, Peng W, Zhang L, Deng M and Pan W (2021) A Nomogram for Preoperative Estimation of Microvascular Invasion Risk in Hepatocellular Carcinoma: Single-Center Analyses With Internal Validation. Front. Oncol. 11:616976. doi: 10.3389/fonc.2021.616976
Received: 13 October 2020; Accepted: 25 January 2021;
Published: 04 March 2021.
Edited by:
Liang Qiao, Westmead Institute for Medical Research, AustraliaReviewed by:
Yun Dai, Peking University First Hospital, ChinaGayatri Ramakrishna, The Institute of Liver and Biliary Sciences (ILBS), India
Copyright © 2021 Yang, Zhu, Yong, Xia, Qian, Yang, Hu, Li, Wang, Peng, Zhang, Deng and Pan. This is an open-access article distributed under the terms of the Creative Commons Attribution License (CC BY). The use, distribution or reproduction in other forums is permitted, provided the original author(s) and the copyright owner(s) are credited and that the original publication in this journal is cited, in accordance with accepted academic practice. No use, distribution or reproduction is permitted which does not comply with these terms.
*Correspondence: Lei Zhang, zhanglei63@mail.sysu.edu.cn; Meihai Deng, dengmeih@mail.sysu.edu.cn; Weidong Pan, panwd@mail.sysu.edu.cn
†These authors have contributed equally to this work