 Leilei Shen
 Hongchao Fu1†
 Guangyu Tao
 Zheng Yuan
 Xiaodan Ye
- 1Department of Radiology, Shanghai Chest Hospital, Shanghai JiaoTong University, Shanghai, China
- 2Department of Radiology, Huadong Hospital, Fudan University, Shanghai, China
Objective: To investigate the utility of the pre-immunotherapy contrast-enhanced CT-based texture classification in predicting response to non-small cell lung cancer (NSCLC) immunotherapy treatment.
Methods: Sixty-three patients with 72 lesions who received immunotherapy were enrolled in this study. We extracted textures including histogram, absolute gradient, run-length matrix, gray-level co-occurrence matrix, autoregressive model, and wavelet transform from pre-immunotherapy contrast-enhanced CT by using Mazda software. Three different methods, namely, Fisher coefficient, mutual information measure (MI), and minimization of classification error probability combined average correlation coefficients (POE + ACC), were performed to select 10 optimal texture feature sets, respectively. The patients were divided into non-progressive disease (non-PD) and progressive disease (PD) groups. t-test or Mann–Whitney U-test was performed to test the differences in each texture feature set between the above two groups. Each texture feature set was analyzed by principal component analysis (PCA), linear discriminant analysis (LDA), and non-linear discriminant analysis (NDA). The area under the curve (AUC) was used to quantify the predictive accuracy of the above three analysis models for each texture feature set, and the sensitivity, specificity, accuracy, positive predictive value (PPV), and negative predictive value (NPV) were also calculated, respectively.
Results: Among the three texture feature sets, the texture parameter differences of kurtosis (2.12 ± 3.92 vs. 0.78 ± 1.10, p = 0.047), “S(2,2)SumEntrp” (1.14 ± 0.31 vs. 1.24 ± 0.12, p = 0.036), and “S(1,0)SumEntrp” (1.18 ± 0.27 vs. 1.28 ± 0.11, p = 0.046) between the non-PD and PD group were statistically significant (all p < 0.05). The classification result of texture feature set selected by POE + ACC and analyzed by NDA was identified as the best model (AUC = 0.812, 95% CI: 0.706–0.919) with a sensitivity, specificity, accuracy, PPV, and NPV of 88.2, 76.3, 81.9, 76.9, and 87.9%, respectively.
Conclusion: Pre-immunotherapy contrast-enhanced CT-based texture provides a new method for clinical evaluation of the NSCLC immunotherapy efficacy prediction.
Introduction
In recent years, with the development of tumor immunology research, many breakthroughs have been made in tumor immunotherapy. Some immunotherapy has significantly prolonged the survival of tumor patients and improved the quality of life (1, 2). In the second-line treatment of non-small cell lung cancer (NSCLC), immune checkpoint inhibitors have made progress. From Checkmate-017 and Checkmate-057 studies to KEYNOTE-010 and OAK studies, they have gradually established the programmed death-1/programmed death ligand-1 (PD-1/PD-L1) inhibitors as standard treatment for advanced NSCLC after chemotherapy failure (3, 4). Although solid tumor immunotherapy is currently being widely carried out clinically and has achieved some exciting results, there are still many unresolved problems, such as the lack of effective methods for immunotherapy to find individual tumor-specific targets (5). Among these problems, how to accurately evaluate the efficacy of immunotherapy at an early stage is still a difficult problem for clinicians when making clinical treatment decisions. Recently, with the development of medical image informatics, extraction of image features and analyzing clinical information have gradually attracted the attention of medical experts. In particular, the research results of radiomics for the evaluation of efficacy (6) and prognosis (7) have a potentially great value for guiding and optimizing clinical decisions and achieving individualized and precise treatment of lung cancer.
In our study, we extracted and analyzed the texture features of enhanced CT images of NSCLC before immunotherapy to evaluate its feasibility and clinical application value for predicting the efficacy of tumor immunotherapy.
Materials and Methods
Subjects
Our Institutional Review Board approved this retrospective study and waived the need for informed consent from the patients. From January 2018 to February 2019, patients of our hospital with advanced-stage NSCLC receiving PD-1/PD-L1 inhibitor nivolumab immunotherapy were selected in this study. Inclusion criteria are as follows: (1) patients underwent contrast-enhanced CT in our hospital within 1 week before receiving tumor immunotherapy; (2) with measurable lesions for the evaluation of efficacy; and (3) at least one follow-up data were used to evaluate the efficacy.
CT Screening
CT scans were obtained with a 128-detector row scanner (Brilliance, Philips, Cleveland, OH, USA) using the helical technique at the end of inspiration during one breath hold. The scanning parameters of routine CT were as follows: pitch, 1.0; matrix, 1,024 × 1,024; FOV, 300 mm; 120 kVp and 200 mA. After non-enhanced CT scanning, a double-cylinder high-pressure syringe pump was used to inject 2 ml/kg BW of iodine contrast agent (Iophorol 320 mg I/ml) into the elbow vein, with an 18-gauge needle, followed by 20 ml of normal saline at a flow rate of 3 ml/s. Enhanced CT scans were acquired 25 and 75 s after drug infusion, respectively. The scanning range covered the entire area from the apex to the base of the lung with the patient lying supine, which included adrenal glands on both sides. When a lesion was found, an HRCT target scan between arterial phase and delay-enhanced scan followed with the following parameters: pitch, 1.0; section thickness and interval, 1.0 and 1.0 mm; matrix, 1,024 × 1,024; FOV, 150 mm; 120 kVp and 200 mA. The images of the contrast-enhanced CT lesions (HRCT target scans) were stored as Dicom for image texture feature extraction.
Image Segmentation and Feature Extraction
All raw thin-slice DICOM format images of the contrast-enhanced CT lesions (HRCT target scans) were transferred to Mazda software (The Technical University of Lodz, Institute of Electronics, http: //www.eletel. P.lodz.pl/mazda/). Tumors were segmented by two radiologists with different experience in thoracic oncological imaging (5 and 15 years). The primary radiologist selected the largest section of the lesion, manually drawing the ROI diagram, and then the experienced senior radiologist confirmed the ROI setting, taking the lead when the two radiologists disagreed. The specific methods and steps are as follows:
1) ROI is drawn on the enhanced CT image of the median window (width, 360 HU; level, 60 HU) at the central level of the cross-section of each target lesion. The two radiologists were mainly responsible for delineating the boundary of each primary tumor manually layer by layer, which required to include all lesions as much as possible.
2) After ROI, the texture parameters of the images of the lesions within the range shown by the ROI are calculated by the Mazda software;
3) Feature extraction
Since there are many texture feature parameters extracted by the Mazda software, we chose three methods for screening feature texture parameter with clinical interpretation, namely: Fisher coefficient, mutual information (MI), and classification error probability combined average correlation coefficients (POE + ACC). We selected all screen 10 characteristic texture parameters from the above three methods.
Tumor Immunotherapy and Evaluation Methods
All patients received a treatment of nivolumab (OPDIVO, Bristol-Myers Squibb Company), 240 mg, once every 2 weeks. Tumor assessments were performed every 6–8 weeks by contrast-enhanced computed tomography (CT) scan after the start of treatment. We only evaluate target lesions in the mediastinal window, including primary lesions or metastases, while we do not calculate changes in lesions outside the lung parenchyma such as lymph nodes. According to RECIST 1.1 standard (8), the longest diameters of target lesions were recorded by two chest radiologists, centrally reviewed all consecutive CT scans independently. When the results are different, another oncologist joined to discuss the decision. Complete response (CR) was defined as the disappearance of all lesions. Partial response (PR) was more than 30% decrease in the sum of the longest diameters of the target lesions. Suspicion of progression was recorded as immune unconfirmed progressive disease (iUPD) according to the iRECIST guideline (9). Oncologists judged whether to continue treatment integrately based on the patient's tumor type, disease stage, and clinical situation. Another evaluation of contrast-enhanced CT was preformed 4–6 weeks later to confirm the true progressive disease (iCPD). Progressive disease (PD) was defined as a more than 20% increase in the sum of the longest diameters of the target lesions. A patient who could not be classified as having either PR or PD was diagnosed as having stable disease (SD). Patients were divided into the non-progressive group (including CR, PR, and SD) and the progressive group (PD) on the basis of the follow-up CT scan date after the first cycle immunotherapy.
Statistical Analysis
t-test (categorical data) or Chi-square test (enumeration data) was performed to compare the differences of the clinical characteristics between non-PD and PD patients. t-test (normal distribution data) or Mann–Whitney U (non-normal distribution data) was performed to compare the radiomics texture features extracted by Fisher coefficient, mutual information measure (MI), and minimization of classification error probability combined average correlation coefficients (POE + ACC) between the non-progressive disease (non-PD) group and the progressive disease (PD) group. According to the selected texture features, the B11 statistical software module included in the Mazda software package is used to classify the predictive effect of tumor immunotherapy target lesions. Classification methods include linear discriminant analysis (LDA), non-linear discriminant analysis (NDA), and principal component analysis (PCA). Based on the texture features of the pre-immunotherapy contrast-enhanced CT, we calculated the sensitivity, specificity, accuracy, positive predictive value, and negative predictive value of each classification method by SPSS 22.0 software, to predict the efficacy of NSCLC immunotherapy and calculate the area under the curve (AUC) to compare the effectiveness of various classification methods to predict the efficacy.
Result
A total of 63 NSCLC patients (51 males and 12 females, with an average age of 61.2 years and a range of 40–79 years) were analyzed. The clinical characteristics of the patients are shown in Table 1. There were 72 lesions, in which 39 were non-progressive lesions (including 12 PR and 27 SD) and 33 were progressive lesions, divided into two groups based on the evaluation of immune efficacy. When there were multiple target lesions in the same patient, the efficacy was consistent.
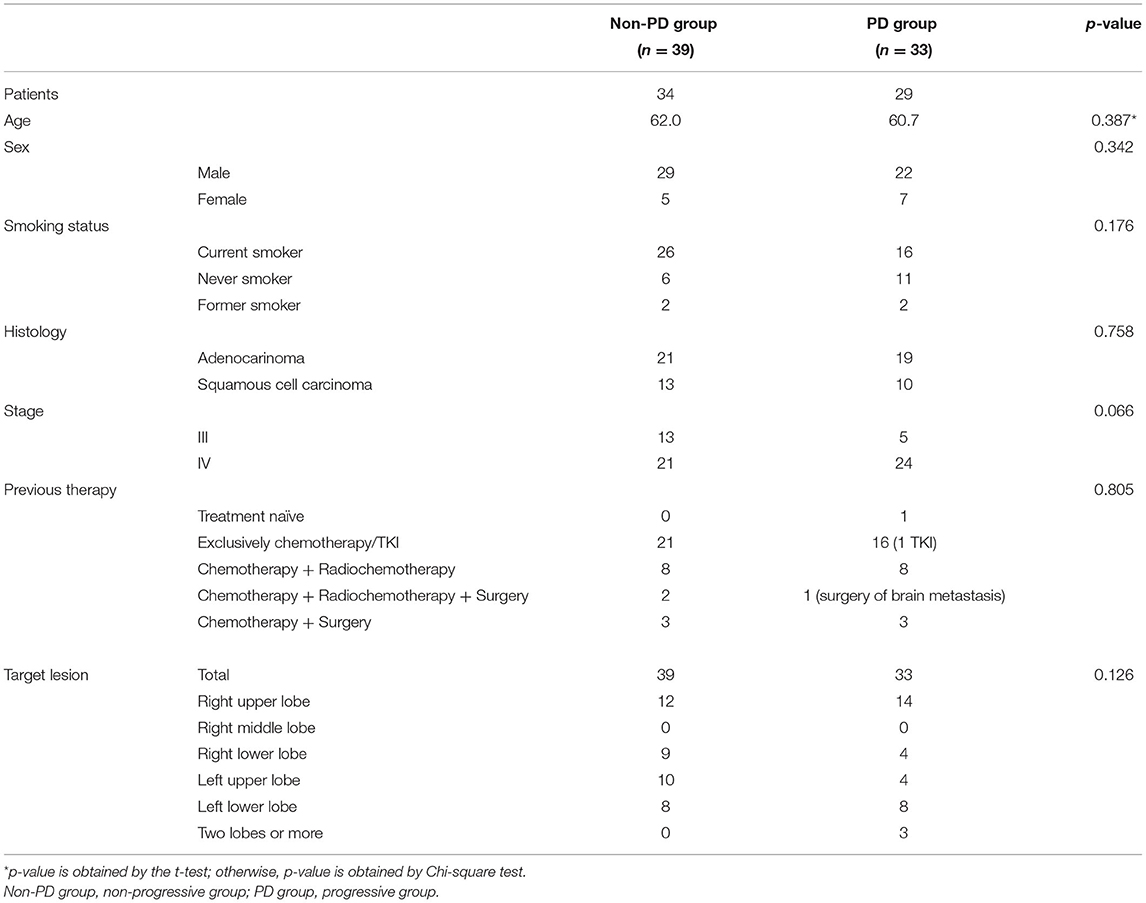
Table 1. Clinical characteristics of patients.
Difference of the Feature Textures Extracted by the Three Methods Between the Non-progressive Group and the Progressive Group
The characteristic texture parameters extracted by Fisher coefficient, MI, and the POE + ACC method are shown in Table 2. Three radiomics features that were statistically significant between the non-progressive group and the progressive group (Figure 1) were as follows: kurtosis (2.12 ± 3.92 vs. 0.78 ± 1.10, p = 0.047), “S(2,2)SumEntrp” (1.14 ± 0.31 vs. 1.24 ± 0.12, p = 0.036), and “S(1,0)SumEntrp” (1.18 ± 0.27 vs. 1.28 ± 0.11, p = 0.046), among which kurtosis is the parameter of grayscale histogram. The values of “S(2,2)SumEntrp” and “S(1,0)SumEntrp” were larger in the progress group than in the non-progress group. “S(2,2)SumEntrp” and “S(1,0)SumEntrp” are the parameters and entropy of the gray-level co-occurrence matrix. The larger the value, the greater the amount of image information and the more complex the image. The parameter value of the progress group is greater than that of the non-progress group (Figures 2, 3).
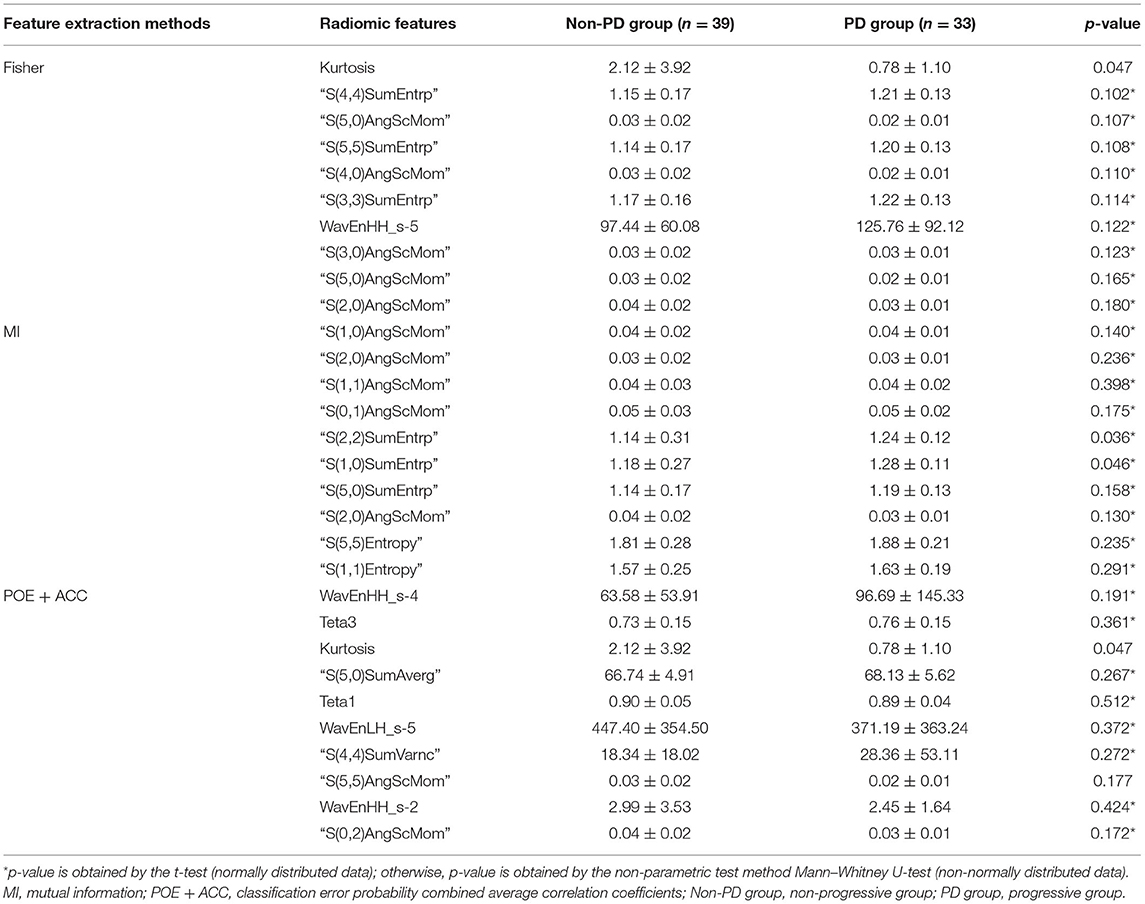
Table 2. Comparison of the selected radiomic features.
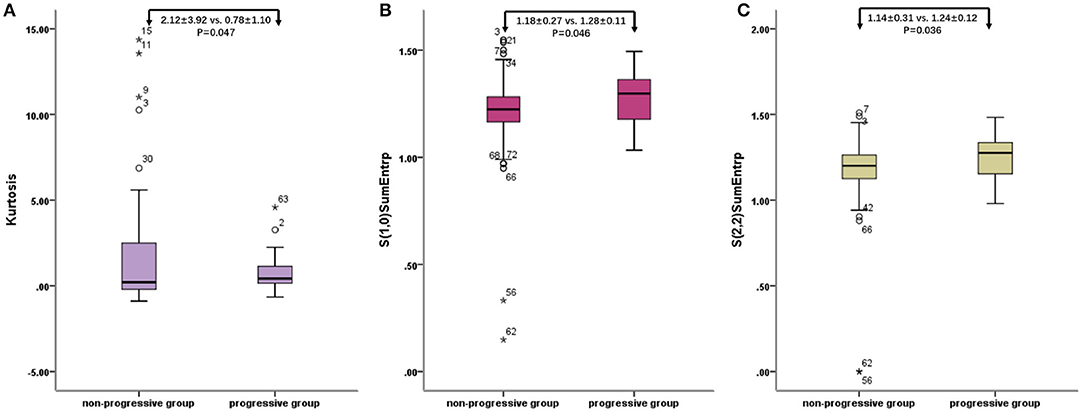
Figure 1. Radiomic features of baseline contrast-enhanced CT: box plot of Kurtosis (A), “S(2,2)SumEntrp” (B), and “S(1,0)SumEntrp” (C). o stands for outlier.
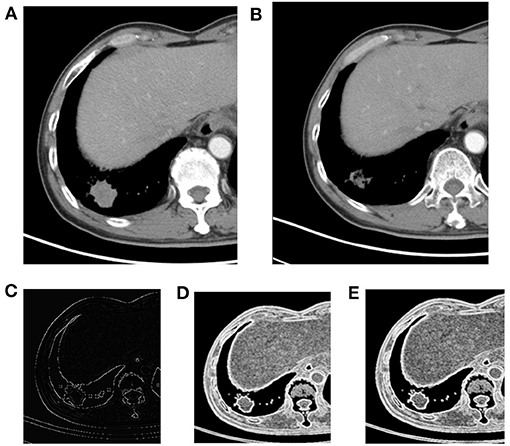
Figure 2. Right lower lobe nodule, NSCLC. (A) Pre-treatment contrast-enhanced; (B) contrast-enhanced CT 6 weeks later after treatment, the efficacy evaluation was partial response (PR); (C) kurtosis; (D) S(1,0) SumEntrp map; (E) S(2,2) SumEntrp map.
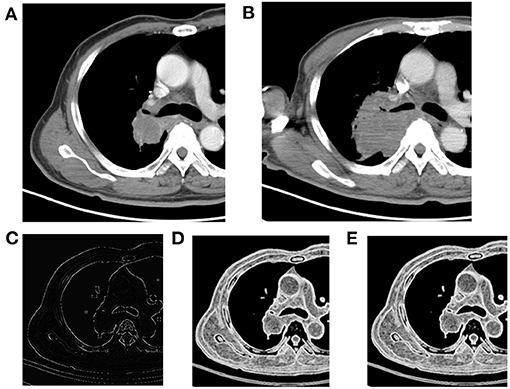
Figure 3. Right upper lobe mass, NSCLC. (A) Pre-treatment contrast-enhanced CT; (B) contrast-enhanced CT 8 weeks later after treatment, the efficacy evaluation was progression (PD); (C) kurtosis map; (D) S(1,0) SumEntrp map; (E) S(2,2) SumEntrp map.
Evaluation of the Value of Immunotherapy Through Three Classification Methods
The three sets of texture features extracted by Fisher coefficient, MI, and POE + ACC methods are classified by PCA, LDA, and NDA methods, respectively (Table 3). The diagnostic efficacy of each method was further evaluated by receiver operating characteristic (ROC) analyses and calculated AUCs (Figure 4). The accuracy of various methods for predicting the therapeutic effect varies from 47.2 to 81.9%. The texture features extracted by the POE + ACC method have the best diagnostic efficacy by using the NDA classification method to predict the therapeutic effect (AUC = 0.812, 95% CI: 0.706–0.919). To predict the first effect after treatment, the sensitivity was 88.2%, the specificity was 76.3%, the accuracy was 81.9%, the positive predictive value was 76.9%, and the negative predictive value was 87.9%.
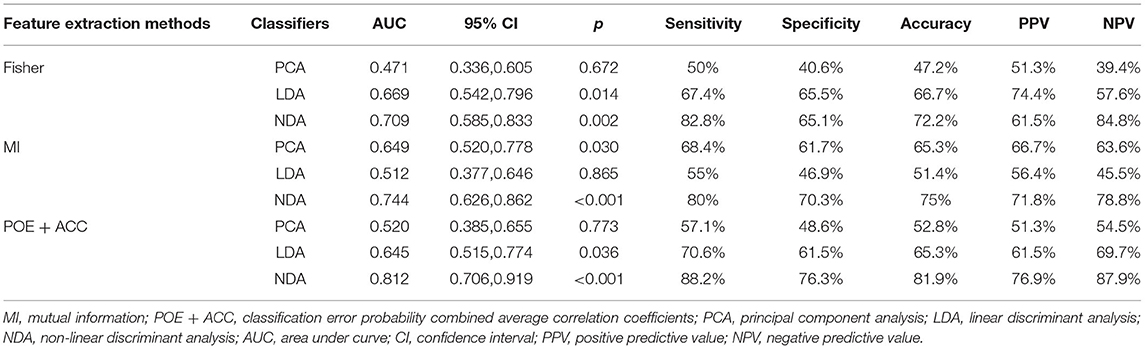
Table 3. Comparison of the performance metrics of the three classifiers.
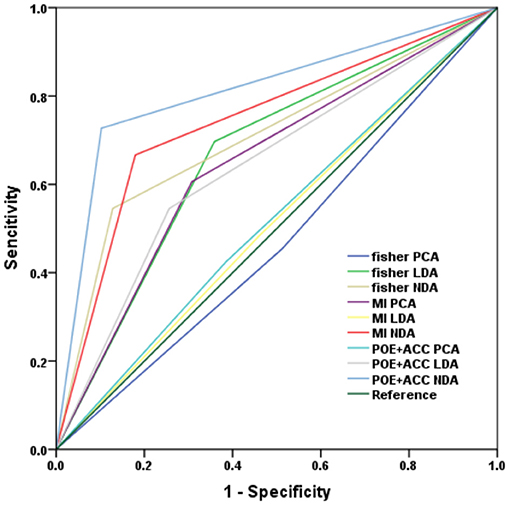
Figure 4. ROC curve of the three classification subtypes under each classifier model.
Discussion
Modern immunotherapies play an important role in personalized cancer treatment. In oncological image monitoring, high-resolution CT is the standard for staging of the chest. However, special clinical manifestations such as pseudoprogression (PsPD), delayed response, and hyper-progressive disease (HPD) caused by infiltration of inflammatory cells and necrosis/edema of tumor tissue present a challenge (10). When clinicians confronted with atypical response patterns, it is difficult to evaluate the response and survival benefits. Therefore, they might be in a dilemma whether to continue immunotherapy or not. Thus, it is important to find robust non-invasive biomarkers on the basis of imaging that could allow prediction of patient response to immunotherapy and prognosis. The main research directions are functional and molecular imaging techniques, radiomics, and radiogenomics and the development of imaging biomarkers for immunotherapy (11). Our study used image texture analysis to analyze the texture features based on the contrast-enhanced CT images of tumor lesions before treatment. We extracted and classified features and predicted the efficacy of NSCLC immunotherapy according to the radiomics features. The 10 image texture features extracted by the POE + ACC method predicted the sensitivity of the tumor progression after treatment to be 88.2%, the specificity was 76.3%, and the accuracy rate was 81.9%. This result indicated that the radiomic signature can perceive the differences in the tumor microenvironment before treatment and provides valuable information for predicting the efficacy of immunotherapy.
Although solid tumor immunotherapy is currently widely practiced and has achieved some exciting results, there are still many unresolved problems. For example, immunotherapy lacks effective methods to find individualized tumor-specific targets (5); T lymphocytes, the main force of immunotherapy, generally have the disadvantages of decreased vitality, immune tolerance, and exhaustion of functions (12); immune cells cannot effectively penetrate infiltrating tumor tissues due to defects in their vascular structure and due to being rich in stroma (13); the tumor immunosuppressive microenvironment is intricate and monotherapy is not effective (14). Because the anti-tumor immune response is a complex process involving many immune cells and molecules, it is very complex and regulated by the body finely and dynamically. Therefore, compared with chemotherapy and targeted therapy, it is more challenging to find markers for predicting the efficacy of immunotherapy. At present, the commonly used efficacy prediction markers in clinical research of tumor immunotherapy include DNA mismatch repair defects, tumor cell PD-L1 overexpression, tumor mutation burden (TMB), etc. (15). In addition, different types of immune cells in the tumor microenvironment can also be used as markers for predicting the efficacy of immunotherapy. For example, CD8+ T cell infiltration often indicates a good response and prognosis for immunotherapy (16); a combination of different immune cells, such as CD3/CD8/CD45RO combined immune score (17), etc.
In recent years, with the development of medical image informatics, extraction of image features from medical images and analysis of clinical information have gradually attracted the attention of medical experts. In the field of oncology radiomics, breakthroughs have been made in the areas of differential diagnosis, pathological typing, metastasis assessment, and gene mutation prediction, especially for predicting the efficacy and prognosis (18). It has potentially great value for guiding and optimizing clinical decision-making as well as achieving individualized and precise treatment of lung cancer. A recent multi-cohort retrospective study published in the journal Lancet Oncol. also showed that the tumor infiltration CD8+ T cell imaging histology label can be used as an effective imaging biomarker for identifying tumor immunophenotypes and predicting PD-1/PD-L1 monoclonal antibody treatment efficacy (19). Vaidya et al. (20) and Tunali et al. (21) focused on hyper-progression of NSCLC, which not only segmented intratumor area but also delineated peritumoral region. Trebeschi et al. (22) used enhanced CT images before treatment to analyze the efficacy of anti-PD1 treatment in patients with melanoma and NSCLC by artificial intelligence (AI) technology. Moreover, genomics set analysis revealed some biological basis of the proposed biomarkers, which might be evident based on oncological decision-making. In our study, by comparing the texture features of contrast-enhanced CT images before treatment, the progressive group had larger S(2,2)SumEntrp and S(1,0)SumEntrp than the non-progressive group. Kurtosis values are smaller in the progressive group than in the non-progressive group. These texture features reflect that the lesions have large CT values and complex internal structure. The possible pathological mechanism that these characteristics affect the efficacy of immunotherapy is that defect of the tumor tissue vascular structure and rich stroma make it difficult for immune cells to penetrate effectively and infiltrate; the tumor immunosuppressive microenvironment is complicated, and the monotherapy is not effective (23, 24). This result coincides with the reason why we chose the enhanced image for analysis, that the immune status of the tumor is substantially influenced by its degree of vascularization (25).
Our study has some limitations. First, the sample size is small and comes from a single center. We will continue to expand the sample size, including multi-center data to further verify the reliability of the conclusion. Second, the image texture analysis in this study is based on 2D images (central cross-sectional images of target lesions) to represent the entire lesion, and results may be biased. In the next study, we will use 3D images to extract the entire tumor to minimize the bias caused by this factor.
Conclusions
In short, through texture analysis of the baseline contrast-enhanced chest CT imaging before treatment and texture feature extraction, the efficacy prediction of NSCLC immunotherapy can be achieved. The highest prediction efficiency is sensitivity, specificity, and accuracy rate were 88.2%, 76.3%, and 81.9%, respectively. Radiomics texture provides a new method for early clinical evaluation of the NSCLC immunotherapy efficacy prediction.
Data Availability Statement
The raw data supporting the conclusions of this article will be made available by the authors, without undue reservation.
Ethics Statement
The studies involving human participants were reviewed and approved by Institutional Ethics Review Committee of the Shanghai Chest Hospital. Written informed consent for participation was not required for this study in accordance with the national legislation and the institutional requirements.
Author Contributions
The literature search, analysis, data explanation, and manuscript draft were finished by LS. LS, HF, and XY are responsible for the analysis and explanation of the radiomics imaging features data. HF, GT, and XL acquired the clinical information and imaging. ZY and XY designed the study, explained the data, and made multiple revisions to the manuscript. All authors contributed to the article and approved the submitted version.
Funding
This study was funded by the National Science Foundation of China (81571629, 81972187, and 82071990), the Project of Shanghai Science and Technology Commission (19411965200), and the Shanghai Chest Hospital Project of Collaborative Innovative Grant (YJT20191015).
Conflict of Interest
The authors declare that the research was conducted in the absence of any commercial or financial relationships that could be construed as a potential conflict of interest.
References
1. Rittmeyer A, Barlesi F, Waterkamp D, Park K, Ciardiello F, von Pawel J, et al. Atezolizumab versus docetaxel in patients with previously treated non-small-cell lung cancer (OAK): a phase 3, open-label, multicentre randomised controlled trial. Lancet. (2017) 389:255–65. doi: 10.1016/S0140-6736(16)32517-X
2. Balar AV, Galsky MD, Rosenberg JE, Powles T, Petrylak DP, Bellmunt J, et al. Atezolizumab as first-line treatment in cisplatin-ineligible patients with locally advanced and metastatic urothelial carcinoma: a single-arm, multicentre, phase 2 trial. Lancet. (2017) 389:67–76. doi: 10.1016/S0140-6736(16)32455-2
3. Nadal E, Massuti B, Dómine M, García-Campelo R, Cobo M, Felip E. Immunotherapy with checkpoint inhibitors in non-small cell lung cancer: insights from long-term survivors. Cancer Immunol Immunother. (2019) 68:341–52. doi: 10.1007/s00262-019-02310-2
4. Wu Z, Man S, Sun R, Li Z, Wu Y, Zuo D. Recent advances and challenges of immune checkpoint inhibitors in immunotherapy of non-small cell lung cancer. Int Immunopharmacol. (2020) 85:106613. doi: 10.1016/j.intimp.2020.106613
5. Xia L, Liu Y, Wang Y. PD-1/PD-L1 blockade therapy in advanced non-small-cell lung cancer: current status and future directions. Oncologist. (2019) 24(Suppl 1):S31–41. doi: 10.1634/theoncologist.2019-IO-S1-s05
6. Coroller TP, Agrawal V, Narayan V, Hou Y, Grossmann P, Lee SW, et al. Radiomic phenotype features predict pathological response in non-small cell lung cancer. Radiother Oncol. (2016) 119:480–6. doi: 10.1016/j.radonc.2016.04.004
7. Song J, Shi J, Dong D, Fang M, Zhong W, Wang K, et al. A new approach to predict progression-free survival in Stage IV EGFR-mutant NSCLC patients with EGFR-TKI therapy. Clin Cancer Res. (2018) 24:3583–92. doi: 10.1158/1078-0432.CCR-17-2507
8. Eisenhauer EA, Therasse P, Bogaerts J, Schwartz LH, Sargent D, Ford R, et al. New response evaluation criteria in solid tumours: revised RECIST guideline (version 1.1). Eur J Cancer. (2009) 45:228–47. doi: 10.1016/j.ejca.2008.10.026
9. Seymour L, Bogaerts J, Perrone A, Ford R, Schwartz LH, Mandrekar S, et al. iRECIST: guidelines for response criteria for use in trials testing immunotherapeutics. Lancet Oncol. (2017) 18:e143–52. doi: 10.1016/S1470-2045(17)30074-8
10. Chiou VL, Burotto M. Pseudoprogression and immune-related response in solid tumors. J Clin Oncol. (2015) 33:3541–3. doi: 10.1200/JCO.2015.61.6870
11. García-Figueiras R, Baleato-González S, Luna A, Muñoz-Iglesias J, Oleaga L, Vallejo Casas JA, et al. Assessing immunotherapy with functional and molecular imaging and radiomics. Radiographics. (2020) 40:1987–2010. doi: 10.1148/rg.2020200070
12. Hope HC, Salmond RJ. Targeting the tumor microenvironment and T cell metabolism for effective cancer immunotherapy. Eur J Immunol. (2019) 49:1147–52. doi: 10.1002/eji.201848058
13. Turley SJ, Cremasco V, Astarita JL. Immunological hallmarks of stromal cells in the tumour microenvironment. Nat Rev Immunol. (2015) 15:669–82. doi: 10.1038/nri3902
14. Andrews LP, Yano H, Vignali DAA. Inhibitory receptors and ligands beyond PD-1, PD-L1 and CTLA-4: breakthroughs or backups. Nat Immunol. (2019) 20:1425–34. doi: 10.1038/s41590-019-0512-0
15. Kaderbhaï C, Tharin Z, Ghiringhelli F. The role of molecular profiling to predict the response to immune checkpoint inhibitors in lung cancer. Cancers. (2019) 11:201. doi: 10.3390/cancers11020201
16. Jiang X, Xu J, Liu M, Xing H, Wang Z, Huang L, et al. Adoptive CD8+ T cell therapy against cancer: challenges and opportunities. Cancer Lett. (2019) 462:23–32. doi: 10.1016/j.canlet.2019.07.017
17. Nosho K, Baba Y, Tanaka N, Shima K, Hayashi M, Meyerhardt JA, et al. Tumour-infiltrating T-cell subsets, molecular changes in colorectal cancer, and prognosis: cohort study and literature review. J Pathol. (2010) 222:350–66. doi: 10.1002/path.2774
18. Nishino M, Hatabu H, Hodi FS. Imaging of cancer immunotherapy: current approaches and future directions. Radiology. (2019) 290:9–22. doi: 10.1148/radiol.2018181349
19. Sun R, Limkin EJ, Vakalopoulou M, Dercle L, Champiat S, Han SR, et al. A radiomics approach to assess tumour-infiltrating CD8 cells and response to anti-PD-1 or anti-PD-L1 immunotherapy: an imaging biomarker, retrospective multicohort study. Lancet Oncol. (2018) 19:1180–91. doi: 10.1016/S1470-2045(18)30413-3
20. Vaidya P, Bera K, Patil PD, Gupta A, Jain P, Alilou M, et al. Novel, non-invasive imaging approach to identify patients with advanced non-small cell lung cancer at risk of hyperprogressive disease with immune checkpoint blockade. J Immunother Cancer. (2020) 8:e001343. doi: 10.1136/jitc-2020-001343
21. Tunali I, Gray JE, Qi J, Abdalah M, Jeong DK, Guvenis A, et al. Novel clinical and radiomic predictors of rapid disease progression phenotypes among lung cancer patients treated with immunotherapy: an early report. Lung Cancer. (2019) 129:75–9. doi: 10.1016/j.lungcan.2019.01.010
22. Trebeschi S, Drago SG, Birkbak NJ, Kurilova I, Cǎlin AM, Delli Pizzi A, et al. Predicting response to cancer immunotherapy using non-invasive radiomic biomarkers. Ann Oncol. (2019) 30:998–1004. doi: 10.1093/annonc/mdz108
23. Anderson KG, Stromnes IM, Greenberg PD. Obstacles posed by the tumor microenvironment to T cell activity: a case for synergistic therapies. Cancer Cell. (2017) 31:311–25. doi: 10.1016/j.ccell.2017.02.008
24. Wang RF, Wang HY. Immune targets and neoantigens for cancer immunotherapy and precision medicine. Cell Res. (2017) 27:11–37. doi: 10.1038/cr.2016.155
Keywords: texture, immunotherapy, radiomics, response prediction, non-small cell lung cancer
Citation: Shen L, Fu H, Tao G, Liu X, Yuan Z and Ye X (2021) Pre-Immunotherapy Contrast-Enhanced CT Texture-Based Classification: A Useful Approach to Non-Small Cell Lung Cancer Immunotherapy Efficacy Prediction. Front. Oncol. 11:591106. doi: 10.3389/fonc.2021.591106
Received: 03 August 2020; Accepted: 18 February 2021;
Published: 23 April 2021.
Edited by:
Bo Gao, Affiliated Hospital of Guizhou Medical University, ChinaReviewed by:
Qijun Shen, First Zhejiang University, ChinaShanshan Wu, Affiliated Hospital of Guizhou Medical University, China
Copyright © 2021 Shen, Fu, Tao, Liu, Yuan and Ye. This is an open-access article distributed under the terms of the Creative Commons Attribution License (CC BY). The use, distribution or reproduction in other forums is permitted, provided the original author(s) and the copyright owner(s) are credited and that the original publication in this journal is cited, in accordance with accepted academic practice. No use, distribution or reproduction is permitted which does not comply with these terms.
*Correspondence: Zheng Yuan, yuanzheng0404@163.com; Xiaodan Ye, xiaodan.ye@shchest.org
†These authors have contributed equally to this work