 Varun Sasidharan Nair
 Reem Saleh
 Salman M. Toor
 Nehad M. Alajez
 Eyad Elkord
- Cancer Research Center, Qatar Biomedical Research Institute (QBRI), Hamad Bin Khalifa University (HBKU), Qatar Foundation (QF), Doha, Qatar
Myeloid-derived suppressor cells (MDSCs) promote tumor immune evasion and favor tumorigenesis by activating various tumor-promoting downstream signals. MDSC expansion is evident in the circulation and tumor microenvironment of many solid tumors including colorectal cancer (CRC). We have recently reported the transcriptomic profiles of tumor-infiltrating MDSCs in CRC patients and uncovered pathways, which could potentially assist tumor progression. In this study, we sorted different subsets of circulating MDSCs in CRC patients and investigated their transcriptomic profiles in order to disclose pathways, which could potentially contribute to disease progression. The sorted subsets included polymorphonuclear/granulocytic MDSCs (PMN-MDSCs), immature MDSCs (I-MDSCs), and monocytic MDSCs (M-MDSCs). Our functional annotation analyses revealed that multiple pathways including DNA damage-, chemotaxis-, apoptosis-, mitogen-activated protein kinase-, transforming growth factor β-, and myeloid differentiation–related transcripts were higher in PMN-MDSCs, compared with monocytic antigen-presenting cells (APCs) or I-MDSCs. Furthermore, genes related to Janus kinase (JAK)–signal transducer and activator of transcription (STAT) were also elevated in PMN-MDSCs. These data suggest that upregulation of JAK-STAT pathway could trigger multiple downstream targets in PMN-MDSCs, which favor tumor progression. Additionally, we found that pathways including phosphatidyl inositol 3-kinase (PI3K), interleukin 6, and TGF-β in M-MDSCs and cell cycle–related pathways in I-MDSCs were upregulated, compared with monocytic APCs. Moreover, acetylation-related genes were upregulated in both PMN-MDSCs and M-MDSCs. This latter finding implicates that epigenetic modifications could also play a role in the regulation of multiple tumor-promoting genes in PMN-MDSCs and M-MDSCs. Taken together, this study reveals various signaling pathways, which regulate the function of MDSC subsets in the circulation of CRC patients. However, functional studies are warranted to support these findings.
Introduction
Colorectal cancer (CRC) ranks second in terms of mortality and third in terms of incidence among all cancers in 2018 (1). Immune cells play an indispensable role in tumorigenesis and progression of CRC (2, 3). The infiltration of CD3+CD8+ T cells into the CRC tumor microenvironment (TME) has been reported as an indicator of disease prognosis; higher CD3+CD8+ T-cell infiltrates have been associated with favorable prognosis (2). Apart from lymphoid cells, the involvement of myeloid cells in the enhancement of metastatic cascade in solid tumors has also been reported (4). Myeloid-derived suppressor cells (MDSCs) play a predominant role in the survival of tumor cells by providing an immunosuppressive shield to protect them from host immune response and facilitate resistance to immunotherapy (4). It has been shown that MDSCs favor the survival of regulatory T cells within the TME, which are a key component of the immunosuppressive mediators that attenuate functionality of tumor-reactive T cells (5) and also induce the differentiation of fibroblasts to cancer-associated fibroblasts (6). Increase in circulating MDSC in higher stages of cancer has been reported to be correlated with worse survival rates and resistance to immune checkpoint blockade (7–9). These reports suggest that targeting MDSCs improves the host-immune responses against malignant cells and also enhances the efficiency of immune checkpoint blockade therapy.
Different MDSC subsets can suppress antitumor immune responses via distinct mechanisms (10). Monocytic MDSCs (M-MDSCs) can inhibit T-cell activation via arginase 1 (ARG1)–, inducible nitric oxide synthase–, and transforming growth factor β (TGF-β)–mediated signaling pathways (11, 12). In contrast, polymorphonuclear/granulocytic MDSCs (PMN-MDSCs), which are usually the most predominant MDSC subset in most cancers, can release high levels of reactive oxygen species and inhibit T-cell stimulation/activation in an antigen-specific manner (13–15). The presence of immature MDSCs (I-MDSCs) in tumor issues and peripheral blood of cancer patients and their relationship with poor prognosis has been reported (16); however, distinct immunosuppression-mediated mechanisms for I-MDSCs have not been yet elucidated.
We have previously reported that PMN-MDSCs and I-MDSCs were expanded in the CRC TME, whereas only PMN-MDSCs were expanded in circulation of CRC patients (3). Importantly, we found that the levels of circulating PMN-MDSCs correlated with tumor stage and histological grade in CRC patients (3). In this study, we investigated the transcriptomic analyses to reveal signaling pathways and biological mechanisms regulated by MDSC subsets in the circulation of CRC patients. We performed comparative analyses of the transcriptomic profiles of the different myeloid subsets, compared to monocytic antigen-presenting cells (APCs).
We found that multiple cancer-related pathways were upregulated in the different myeloid cell subsets. Interestingly, we found that acetylation-related genes were upregulated in both M-MDSCs and PMN-MDSCs, which could play a role in the transcriptional regulation of genes favoring tumor progression and metastasis of malignant cells. Collectively, our data reveal that tumor-promoting signaling pathways were upregulated in circulating myeloid suppressive cell subsets of CRC patients, suggesting their contribution to carcinogenesis and tumor progression. However, these data lack functional studies due to limited cell numbers following FACS sorting, and further confirmation studies are needed in a larger number of patients.
Materials and Methods
Sample Collection and Storage
Peripheral blood samples were obtained from 4 treatment-naive CRC patients (No. 7, 9, 12, and 16) at Hamad Medical Corporation, Doha, Qatar. Table 1 shows the clinical and pathological characteristics of participating patients. All patients provided written informed consent prior to sample collection. Peripheral blood mononuclear cells (PBMCs) were isolated from fresh blood using Histopaque gradient centrifugation and stored, as previously described (17). This study was performed under ethics approvals from Hamad Medical Corporation, Doha, Qatar (protocol no. MRC-02-18-012), and Qatar Biomedical Research Institute, Doha, Qatar (protocol no. 2018-018). All experiments were executed in accordance with relevant guidelines and regulations.
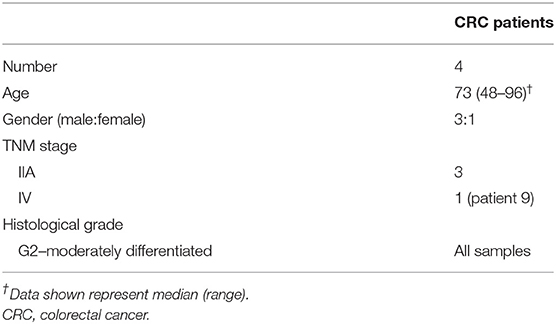
Table 1. Characteristic features of study populations.
Multiparametric Flow Cytometry
Isolated PBMCs were stained as previously described (17, 18). Briefly, cells were stained with antibodies against CD33–fluorescein isothiocyanate (clone HIM3-4; BD Biosciences, Oxford, UK), HLA DR–phycoerythrin (clone G46-6; BD Biosciences), CD14–phycoerythrin–Cy7 (clone M5E2; BD Biosciences), and CD15–allophycocyanin (clone HI98; BioLegend, San Diego, CA, USA). 7-AAD viability dye (eBioscience, San Diego, CA, USA) was used to identify live cells. The cells were prepared for analyses and sorting as previously described (17, 18) Minimal sorter-induced cell stress was ensured following applicable measures, as previously described (19). FlowJo V10 software (FlowJo, Ashland, OR, USA) was used to perform data analyses.
Library Preparation
Study design and pipeline for bioinformatics analyses were performed, as we have previously described (18). Briefly, 1,000 I-MDSCs, M-MDSCs, PMN-MDSCs, and monocytic APCs cells were sorted with high purity from PBMCs of CRC patients. The cDNA libraries were prepared from sorted cells using QIAseq FX Single Cell RNA Library Kit (Qiagen, Hilden, Germany), as we have previously reported (20). The quality passed libraries were subjected to sequencing using Illumina HiSeq 4000 as previously described (20).
Transcriptomic Data Analyses
Raw data obtained from Illumina HiSeq 4000 in the form of FASTQ files were analyzed on CLC Genomics Workbench-12 (Qiagen), as previously described (18). Briefly, paired end reads were quality-trimmed and aligned to the hg19 human reference genome, and the read count was calculated as TPMs (transcripts per million) mapped reads. Default settings were applied to analyze the differential expression between the study subsets. The Z score was calculated for all the differentially expressed genes, with P < 0.05, and used for the construction of heat maps for data visualization.
Functional Annotation Analyses
The Gene Ontology Biological Process (GO BP), Kyoto Encyclopedia of Genes and Genomes (KEGG), and BioCarta network analyses (21, 22) were performed on Database for Annotation, Visualization and Integrated Discovery platform (v.6.8, https://david.ncifcrf.gov/), as previously described (18). We focused on functional networks in upregulated/downregulated genes. The gene data from functional analyses were presented as heat plots. Protein–protein interaction networks for selected signaling pathways were obtained from STRING, a web-based online tool for protein–protein interaction networks and functional enrichment analyses (https://string-db.org/) (23). Principal component analysis (PCA) plots were generated using TPMs of differentially expressed genes on iDEP.91 (integrated Differential Expression and Pathway analysis, http://bioinformatics.sdstate.edu/idep/), a web-based online analyses tool, using default settings.
Results
Myeloid Subsets in the Circulation of CRC Patients
We have previously reported that levels of PMN-MDSCs were higher in the circulation of CRC patients, compared with healthy donors (3). Additionally, these PMN-MDSCs showed an upregulation of ARG1, which is an indicator of their suppressive function (3). Furthermore, we have previously reported that the levels of PMN-MDSCs and I-MDSCs are higher in the CRC TME (3). Using monocytic APCs as controls, our recent study on the transcriptomic characteristics of the different MDSC subsets in the TME of CRC patients has provided novel insights into the epigenetic mechanisms including DNA methylation/posttranslational histone modifications and other signaling pathways regulating their transcriptional profile and function (18). Despite the phenotypic differences between the various MDSC subsets, including granulocytic (PMN-), monocytic (M-), and immature (I-) MDSCs, they all possess an immunosuppressive activity and lack the expression of HLA-DR. On the contrary, monocytic APCs express HLA-DR; therefore, they were used as controls for the other three MDSC subsets.
In this study, we sorted the different myeloid cell subpopulations including PMN-MDSCs (CD33+HLA-DR−/lowCD14−CD15+), I-MDSCs (CD33+HLA-DR−/lowCD14−CD15−), M-MDSCs (CD33+HLA-DR−/lowCD14+CD15−), and monocytic APCs (CD33+HLA-DR+CD14+) from the circulation of CRC patients to investigate their transcriptomic characteristics, which could potentially contribute to disease progression. The gating strategy for sorting these subsets is shown in Figure 1. Comparative analyses were then performed from the libraries generated from the different sorted myeloid cell subpopulations, including PMN-MDSCs vs. monocytic APCs, PMN-MDSCs vs. I-MDSCs, M-MDSCs vs. monocytic APCs and I-MDSCs vs. monocytic APCs.
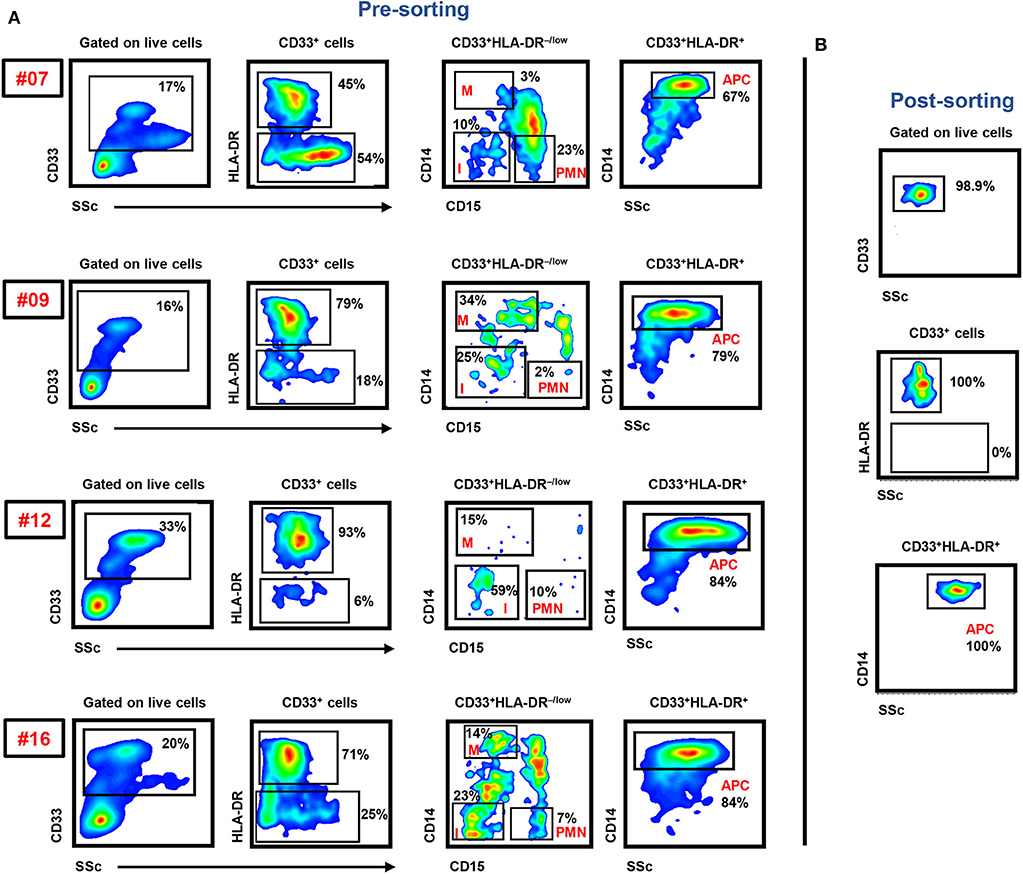
Figure 1. Gating strategy of I-MDSCs, M-MDSCs, PMN-MDSCs, and monocytic APCs. Peripheral blood mononuclear cells were isolated from four CRC patients (7, 9, 12, and 16). Flow cytometric plots show the levels of I-MDSCs (denoted as I), M-MDSCs (denoted as M), and PMN-MDSCs (denoted as PMN) gated on CD33+HLA-DR−/low and monocytic APCs gated on CD33+HLA-DR+ cells. Sorted pure myeloid cell subsets were used for RNA-Seq (A). Representative flow cytometric plots show the sorting purity of CD33+HLA-DR+CD14+ monocytic APCs (B).
Genes Associated With Janus Kinase–Signal Transducer and Activator of Transcription, Transcriptional Regulation, and Histone Acetylase Were Upregulated in Circulating PMN-MDSCs, Compared With Monocytic APCs of CRC Patients
We have previously reported that DNA methylation- and histone deacetylase (HDAC) binding-related genes were downregulated in tumor-infiltrating PMN-MDSCs, compared with PMN-MDSCs in normal colon tissues of CRC patients (18). Here, we analyzed the transcriptomic profiles of PMN-MDSCs, compared with monocytic APCs in the circulation of four CRC patients (No. 7, 9, 12, and 16). The hierarchal clustering of differentially expressed transcripts showed 1,912 upregulated and 2,412 downregulated transcripts in PMN-MDSCs, compared with monocytic APCs (fold of change >2 and P value cutoff < 0.05) (Figures 2A,B). The PCA from the TPMs showed that the PMN-MDSCs and monocytic APCs from four patient samples were clustered separately, representing the significant differences in the overall gene expression (Supplementary Figure 1A). The PCA plot also showed high variability in the expression of PMN-MDSCs among the individuals, but it should not affect the downstream analyses due to the cluster separation of PMN-MDSCs and monocytic-APCs (Supplementary Figure 1A). Functional annotation analyses revealed that upregulated pathways in PMN-MDSCs were related to DNA damage (4 genes), chemotaxis (4 genes), transcriptional regulation (114 genes), signal transduction (6 genes), cellular defense response (8 genes), and Histone H4 acetylation (7 genes) (Figures 2C,D; Table 2). Interestingly, the genes responsible for apoptosis (21 genes), mitogen-activated protein kinase (MAPK) activity (8 genes), myeloid differentiation (6 genes), negative regulation of transcription (54 genes), and Wnt signaling pathway (10 genes) were downregulated in PMN-MDSCs (Figures 2C,E; Table 2). Moreover, genes involved in Wnt signaling pathway formed a PPI enrichment with P value 0.116, including 10 nodes and 4 edges (Supplementary Figure 2A).
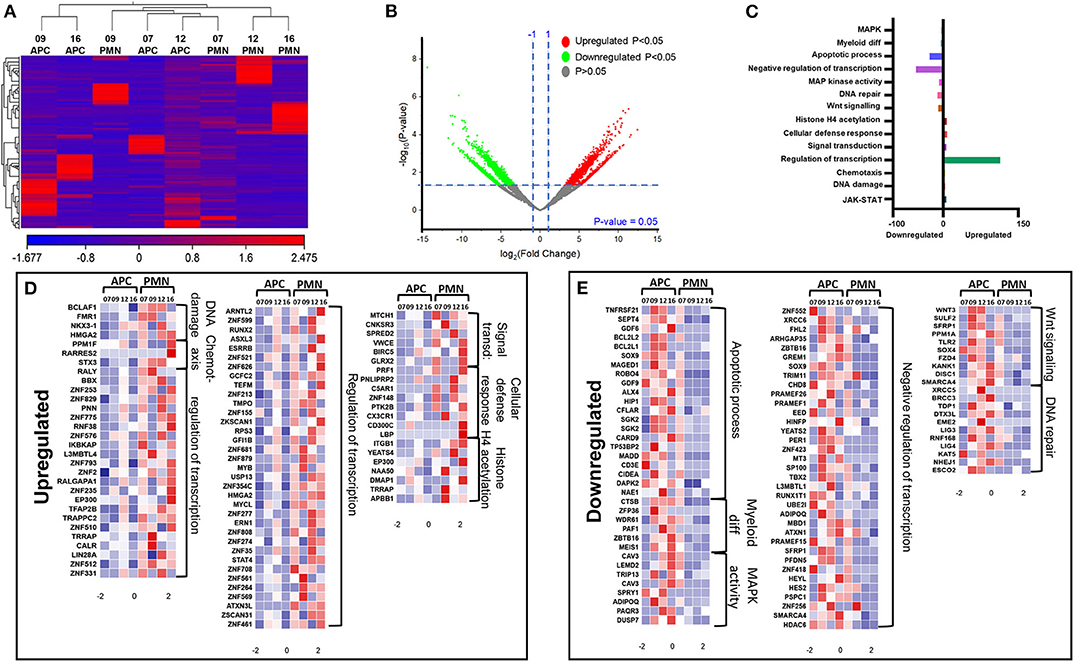
Figure 2. Comparative analyses of gene expression between PMN-MDSCs and monocytic APCs in the circulation of CRC patients. Hierarchical clustering of PMN-MDSCs and monocytic APCs from four patients (7, 9, 12, and 16) on differentially expressed RNA transcripts from RNA-Seq data. Each column represents a sample, and each row represents a transcript. The color gradient determines the expression level of each transcript (A). Volcano plot shows differentially expressed genes; log2 fold change is plotted on the x-axis, and the statistical impact is shown on the y-axis. Fold changes with significant P values (>0.05) are highlighted in red (for upregulated genes) and green (for downregulated genes) (B). Functional categorizations of significantly upregulated or downregulated genes were analyzed using DAVID platform. Bar diagram illustrates the percentage of genes in each functional category (C). Heat maps show the Z score of upregulated (D) and downregulated (E) transcripts in PMN-MDSCs, compared with monocytic APCs. Color codes are shown; red indicates upregulation, white indicates no change, and blue indicates downregulation.
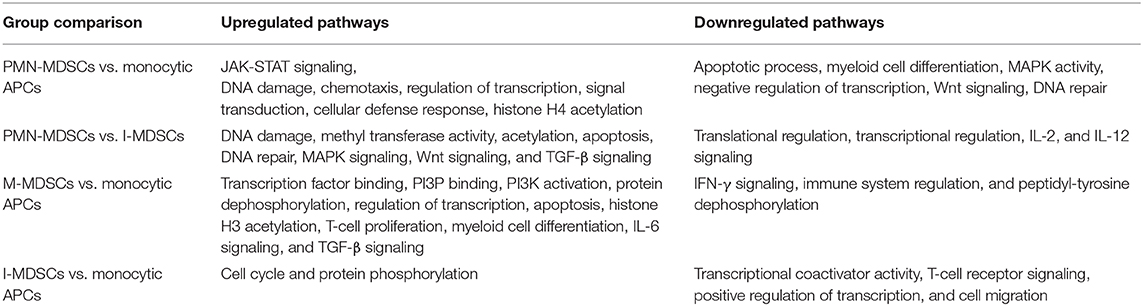
Table 2. Summary of differentially regulated pathways in each group comparisons.
Reports show that both leptin (LEP) (24) and growth hormone 1 (GH1) (25) could activate Janus kinase (JAK)–signal transducer and activator of transcription (STAT) cascade, which further induces angiogenesis, proliferation, and antiapoptotic pathways in normal cells and favors cancer progression. We found that both LEP and GH1 were upregulated in PMN-MDSCs, compared with monocytic APCs (Figure 3A). Furthermore, interleukin 5 (IL-5) and IL-22 were also upregulated in PMN-MDSCs, which are the potent activators of STAT-3 (26, 27). Protein tyrosine phosphatase nonreceptor type 2 (PTPN2 or TC-PTP), a known phosphorylation inhibitor of STAT1, STAT3, and STAT6 (28), was downregulated in PMN-MDSCs (Figures 3A,B). Moreover, IL-5/GH1, potent STAT3 activators, and STAT4 were upregulated in PMN-MDSCs (Figures 3A,B). In addition, the signal transducing adaptor molecule (STAM) gene, a known JAK signal accelerator (29), was upregulated in PMN-MDSCs (Figures 3A,B). Furthermore, PPI analysis showed that the vast majority of genes related to JAK-STAT pathway formed a network from 10 genes. STRING database identified 10 nodes and 14 edges with PPI enrichment P value 6.15e-07, average clustering coefficient of 0.69, and average node degree of 2.8 (Figure 3C). Collectively, these data suggest that the suppressive function and protumorigenic effects of circulating PMN-MDSCs in CRC could be associated with the upregulation of JAK-STAT pathway, activation of DNA damage cascade, and the downregulation of genes promoting tumor cell apoptosis and myeloid cell maturation. Moreover, our data imply that epigenetic modifications including histone acetylation could be involved in the transcriptional regulation of genes in circulating PMN-MDSCs of CRC patients.
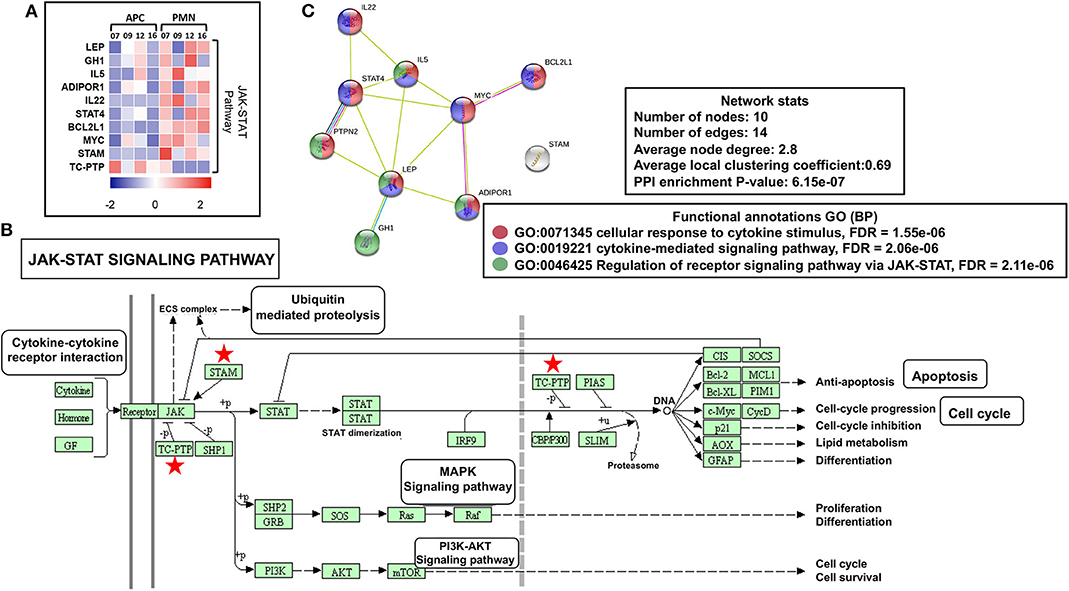
Figure 3. JAK-STAT modulating genes in PMN-MDSCs in the circulation of CRC patients. Heat map shows the Z score of JAK-STAT pathway-related transcripts that were downregulated/upregulated in PMN-MDSCs compared with monocytic APCs (A). KEGG pathway analysis, using DAVID, showed genes (marked with red stars) involved in the JAK-STAT pathway (B). PPI network analyses using the STRING database of genes from significantly deregulated genes related to JAK-STAT signaling pathway (C). GO ontologies (color coded), description, and false discovery rate (FDR) using the whole transcriptome as reference are stated for each subnetwork. The overall network statistics are shown in the boxes.
Genes Associated With Acetylation Were Upregulated in Circulating PMN-MDSCs, Compared With I-MDSCs
Next, we compared the transcriptomic profiles of PMN-MDSCs with I-MDSCs from three CRC patients (No. 7, 12, and 16). Sample 9 was not included in the analysis because of asymmetric clustering with other three samples. Hierarchical clustering of differentially expressed transcripts of PMN-MDSCs and I-MDSCs is shown in Figure 4A. There were 1,087 transcripts found to be upregulated and 861 downregulated in PMN-MDSCs, compared with I-MDSCs (FC >2 and P < 0.05) (Figures 4A,B). We found that 179 genes related to acetylation were upregulated in PMN-MDSCs, compared with I-MDSCs. Additionally, genes related to DNA damage (29 genes), apoptosis (14 genes), DNA repair (6 genes), MAPK signaling (11 genes), Wnt signaling (4 genes), and TGF-β signaling (6 genes) pathways were upregulated in PMN-MDSCs (Figures 4C,D; Table 2). It has been reported that TGF-β signaling pathway could activate MAPK signaling cascade and favors tumor progression (30). Interestingly, we found that TGF-β signaling–related genes including PDGFB, KLF10, and TGFB3 and MAPK-related genes including DUSP7, BRAF, CRBB3, and DAB2IP were significantly upregulated in PMN-MDSCs (Figure 4D). These data suggest that enhanced TGF-β signaling in PMN-MDSCs could activate MAPK signaling pathways for the survival and progression of CRC. On the other hand, 101 genes related to translational regulation were downregulated in PMN-MDSCs, compared with I-MDSCs (Figures 4C,E; Table 2). This latter finding suggests that genes involved in posttranslation modifications could be more important in PMN-MDSC function.
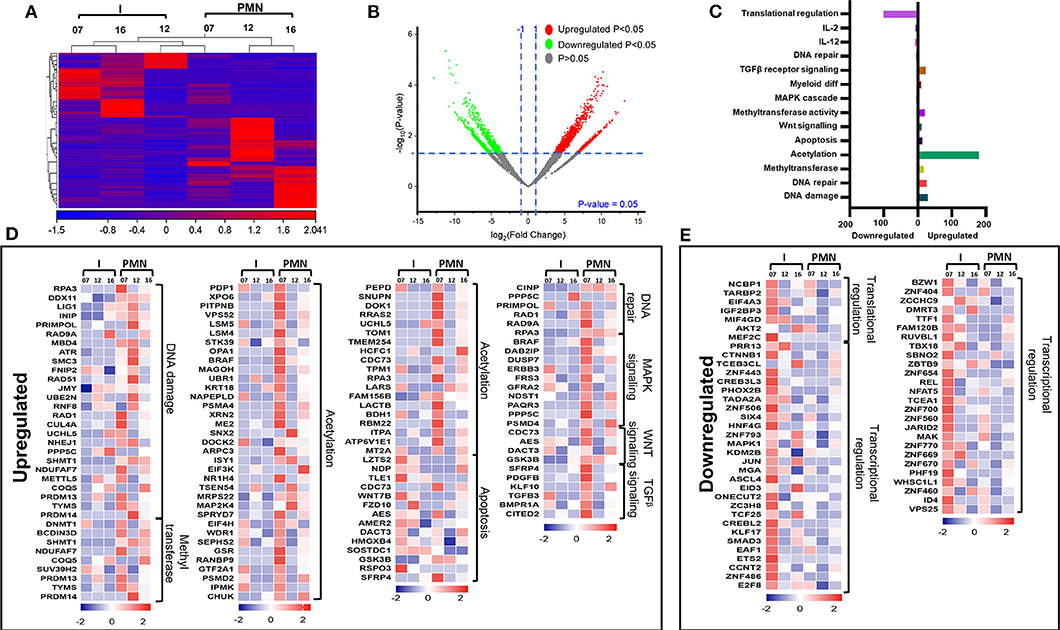
Figure 4. Comparative analyses of gene expression between PMN-MDSCs and I-MDSCs in the circulation of CRC patients. Hierarchical clustering of PMN-MDSCs and I-MDSCs from three patients (07, 12, and 16) on differentially expressed transcripts. Expression level of each gene is illustrated as a color code (A). Volcano plot illustrates the differential expression data, represented as log2 fold change on the x-axis, with the statistical impact on the y-axis. Fold changes with significant P values (>0.05) are highlighted in red (for upregulated genes) and green (for downregulated genes) (B). Functional categorizations for significantly upregulated and downregulated transcripts were analyzed on DAVID platform. Bar diagram illustrates the percentage of genes in each functional category (C). Heat maps show the Z score of the upregulated (D) and downregulated (E) transcripts in PMN-MDSCs, compared with I-MDSCs, based on their functional categorization.
Genes Associated With Apoptosis and Transcriptional Regulations Were Upregulated in Circulating M-MDSCs, Compared With Monocytic APCs of CRC Patients
Next, we compared the transcriptomic profiles of circulating M-MDSCs and monocytic APCs from two CRC patients (No. 7 and 16). The hierarchal clustering of differentially expressed transcripts of M-MDSCs and monocytic APCs is shown in Figure 5A. There were 1,719 transcripts found to be upregulated and 371 downregulated in M-MDSCs, compared with those found in monocytic APCs (FC >2 and P < 0.05) (Figures 5A,B). PCAs of the total data sets confirmed the close relativeness of biological replicates (Supplementary Figure 1B). Functional annotation analyses showed that transcription factor binding (35 genes)–, PI3P (7 genes)–, PI3K activation (3 genes)–, protein dephosphorylation (20 genes)–, transcriptional regulation (155 genes)–, apoptosis (59 genes)–, histone H3 acetylation (8 genes)–, and IL-6 pathway (5 genes)–related genes were upregulated in M-MDSCs, compared with monocytic APCs (Figures 5C,D; Table 2). Additionally, our PPI network analyses showed that there is a significant enrichment of genes related to IL-6 pathway including five nodes and three edges with PPI enrichment P = 0.000605 (Supplementary Figure 2B). Notably, genes related to interferon γ (IFN-γ) (SLC11A1, CD3E, IRF8, and CD226) and immune regulation (SIAE and GGT1) were downregulated in M-MDSCs (Figures 5C,E). It has been reported that STAT1/IFN-γ signaling pathway was regulated by a novel tumor suppressor protein, IRF8 (31). Moreover, downregulation of IRF8 was evident in breast tumor conditions leading to the progression of disease (31). In agreement with this, we found that IRF8 was significantly downregulated in M-MDSCs, which could be the potent rationale for the downregulation of immune regulation–related genes (Figure 5E). These results suggest that circulating M-MDSCs could contribute to CRC progression by suppressing the gene expression of immune-regulatory molecules involved in the activation of immune responses and upregulating genes involved in histone acetylation and transcriptional regulation.
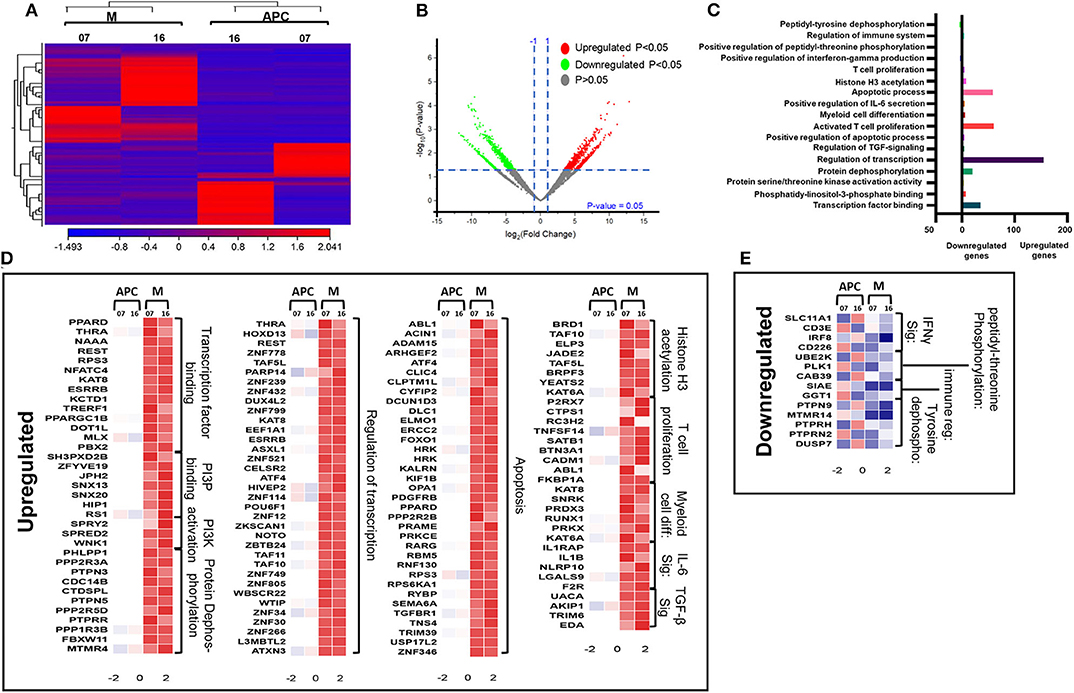
Figure 5. Comparative analyses of gene expression between M-MDSCs and monocytic APCs in the circulation of CRC patients. Hierarchical clustering of M-MDSCs and monocytic APCs from two patients (07 and 16) on differentially expressed transcripts. Gene expression level is illustrated as a color code (A). Volcano plot illustrates the differential expression data, represented as log2 fold change on the x-axis, with the statistical impact on the y-axis. Fold changes with significant P values (>0.05) are highlighted in red (for upregulated genes) and green (for downregulated genes) (B). Functional categorizations for significantly upregulated and downregulated transcripts were analyzed on DAVID platform. Bar diagram illustrates the percentage of genes in each functional category (C). Heat maps show the Z score of the upregulated (D) and downregulated (E) transcripts in M-MDSCs, compared with monocytic APCs, based on their functional categorization.
Genes Associated With Cell Migration and Transcriptional Regulations Were Downregulated in Circulating I-MDSCs, Compared With Monocytic APCs of CRC Patients
We then compared the transcriptomic profiles of I-MDSCs with monocytic APCs from two CRC patients (No. 7 and 16). The differentially expressed transcripts are shown as distinct cluster of I-MDSCs and monocytic APCs (Figure 6A). One hundred twenty-nine transcripts were found to be upregulated, and 275 were downregulated in I-MDSCs, compared with those found in monocytic APCs (FC >2 and P < 0.05) (Figures 6A,B). PCAs of the total data sets confirmed the close relativeness of biological replicates (Supplementary Figure 1C). Functional annotation analyses showed that cell cycle (8 genes)– and protein phosphorylation (8 genes)–related genes were upregulated (Figures 6C,D), and transcriptional (30 genes)– and cell migration (6 genes)–related genes were downregulated in I-MDSCs (Figures 6C,E; Table 2).

Figure 6. Comparative analyses of gene expression between I-MDSCs and monocytic APCs in the circulation of CRC patients. Hierarchical clustering of I-MDSCs and monocytic APCs from two patients (07 and 16) on differentially expressed transcripts. Expression level of each gene is illustrated as a color code (A). Volcano plot illustrates the differential expression data, represented as log2 fold change on the x-axis, with the statistical impact on the y-axis. Fold changes with significant P values (>0.05) are highlighted in red (for upregulated genes) and green (for downregulated genes) (B). Functional categorizations for significantly upregulated and downregulated transcripts were analyzed on DAVID platform. Bar diagram illustrates the percentage of genes in each functional category (C). Heat maps show Z score of the upregulated (D) and downregulated (E) transcripts in I-MDSCs, compared with monocytic APCs, based on their functional categorization.
Genes Associated With Acetylation Are Upregulated in PMN-MDSCs and M-MDSCs in the Circulation of CRC Patients
Finally, we compared the common pathways, which were upregulated/downregulated in PMN-MDSCs, M-MDSCs, and I-MDSCs in the circulation of CRC patients. We found that by comparing PMN-MDSCs vs. monocytic APCs, M-MDSCs vs. monocytic APCs, and PMN-MDSCs vs. I-MDSCs, genes related to acetylation were upregulated in PMN-MDSCs and M-MDSCs (Figure 7A), and also genes related to apoptosis and myeloid cell differentiation were upregulated in PMN-MDSCs and M-MDSCs (Figure 7A). Moreover, transcriptional regulation–related genes were upregulated in PMN-MDSCs and M-MDSCs; when comparing PMN-MDSCs vs. monocytic APCs and M-MDSCs vs. monocytic APCs (Figure 7A), DNA damage–related genes were upregulated in PMN-MDSCs, compared to monocytic APCs and I-MDSCs (Figure 7A). On the other hand, protein phosphorylation–related genes were upregulated in both I-MDSCs and M-MDSCs, compared to their controls (Figure 7A). In the downregulated pathways panel, genes related to transcription were downregulated in PMN-MDSCs and I-MDSCs, when comparing PMN-MDSCs vs. monocytic APCs, I-MDSCs vs. monocytic APCs, and PMN-MDSCs vs. I-MDSCs (Figure 7B).
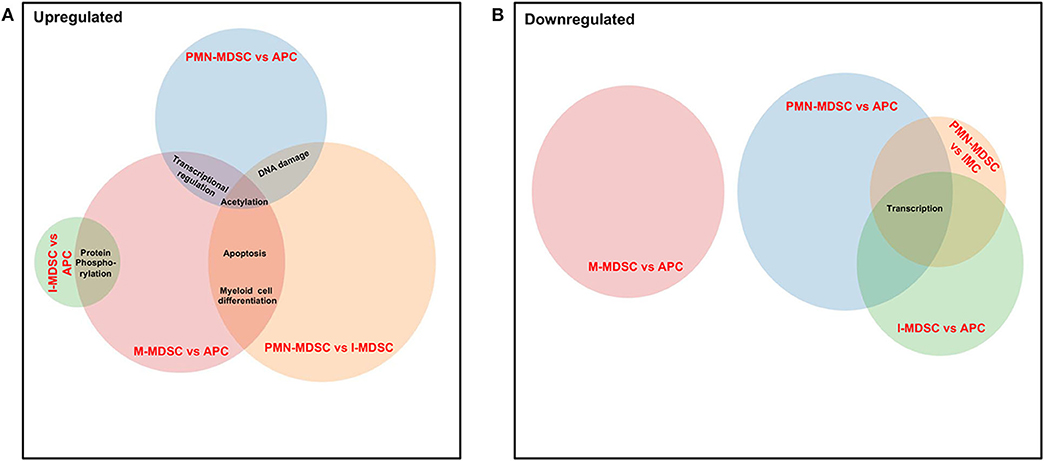
Figure 7. Analyses of overlapping functional pathways between PMN-MDSCs, I-MDSCs, and M-MDSCs. Venn diagram summarizing the overlap between functional pathways, which were upregulated (A) and downregulated (B) in the comparative analyses between PMN-MDSCs vs. monocytic APCs, PMN-MDSCs vs. I-MDSCs, M-MDSCs vs. monocytic APCs, and I-MDSCs vs. monocytic APCs. Shared pathways are indicated by the overlap between circles.
Discussion
In this study, we performed comparative analyses on transcriptomic profiles of different myeloid cell subsets in the circulation of CRC patients. We found that various signaling pathways, including JAK-STAT, chemotaxis, and histone acetylation, were upregulated in PMN-MDSCs compared with monocytic APC: PI3P kinase, PI3 kinase, apoptosis, H3 acetylation, IL-6, and TGF-β pathways were upregulated in M-MDSCs, and cell cycle–related pathways were upregulated in I-MDSCs compared with monocytic APCs.
Tumor-infiltrating inflammatory cells are reported to be associated with disease progression; however, the functional impact of particular subpopulations remains not evident (32). Recently, we have reported that in the CRC TME, levels of PMN-MDSCs, and I-MDSCs were higher compared with M-MDSCs (18). Other than CRC, in lung cancer patients, it has been reported that PMN-MDSCs accumulated in the advanced stages have predominant suppressive characteristics and favor tumor progression (33). We have previously shown that various epigenetic-related genes including DNA methylation and HDACs were upregulated, and acetylation-related genes were downregulated in colorectal tumor-infiltrating I-MDSCs, compared with monocytic APCs (18). Notably, in the present study, we found that acetylation-related genes were upregulated in PMN-MDSCs, compared with monocytic APCs, in circulation of CRC patients. Furthermore, in the CRC TME, DNA methylation and HDACs were downregulated in PMN-MDSCs, compared with monocytic APCs (18). In line with these data, we found that histone acetylation– and transcription regulation–related genes were upregulated in circulating PMN-MDSCs. These data show that transcriptional regulation of pivotal genes in circulating PMN-MDSCs might be regulated by posttranslational histone modifications. Moreover, our work showed that MAPK signaling and Wnt pathways were upregulated in PMN-MDSCs of both TME (18) and circulation, compared with I-MDSCs.
Tumor-infiltrating immune cells, including myeloid cells, provide an immune-subversive environment for tumor development and progression through the activation of various signaling cascades (34). It has been reported that the MDSC subset, I-MDSCs, favors tumor progression by expanding TH17 cells within the TME, rather than suppressing T cells (35). We found that critical pathways for tumor progression associated with DNA damage, MAPK, and Wnt signaling were upregulated in PMN-MDSCs, compared with I-MDSCs. Interestingly, JAK-STAT pathway was also found to be upregulated in PMN-MDSCs, compared with monocytic APCs. JAK-STAT pathway is one of the predominant signaling cascades, which can promote immune suppression and tumor cell survival (36). JAK-STAT signaling cascade has been implicated in the induction of chemotaxis, which in turn triggers migratory signals in epithelial cells causing cell transformation from being static epithelial cells to migratory cells (37). Interestingly, we found that STAT3- and STAT4-related genes were upregulated in circulating PMN-MDSCs, compared with monocytic APCs. Reports showed that growth hormone induces the activation of Hrs–STAM complex, which could enhance the formation of JAK–receptor complexes (29, 38). In agreement with these reports, we found that GH1 and STAM were upregulated in PMN-MDSCs, compared with monocytic APCs. Aberrant activation of JAK-STAT signaling pathway could also activate MAPK pathway, which controls various fundamental cellular processes that promote tumorigenesis, including cell proliferation, survival, differentiation, and migration (39, 40). Furthermore, components of the JAK-STAT signaling pathway and its downstream cascade MAPK pathway could induce regulatory T cell (Treg) and MDSC expansion and interfere with TH1 differentiation (41, 42). Collectively, these data imply that JAK-STAT signaling pathway in circulating PMN-MDSCs could be important for triggering their own proliferation and Treg expansion, contributing to malignant cell migration and metastasis, and possibly opposing TH1 differentiation and migration into the TME of CRC patients (43).
One of the most frequently altered pathways in human cancer is the PI3K pathway, which has a critical role in tumorigenesis and tumor progression (44). Here, we found that PI3K and PI3P pathways were upregulated in M-MDSCs, compared with monocytic APCs, which could activate multiple downstream pathways and favor malignant cell progression. It has been reported that the activation of PI3K could trigger PI3P signaling cascade and promote the survival of tumor cells (45). Additionally, genes related to IL-6 and TGF-β signaling pathways were found to be upregulated in M-MDSCs, compared to monocytic APCs. Overexpression of TGF-β has been reported to promote tumorigenesis as it induces multiple non-Smad pathways, which could reprogram epithelial cells and induce epithelial–mesenchymal transition (46). This overexpression of TGF-β was correlated with advanced disease stages, metastasis, and poor prognosis in many cancer types, including CRC (46–49). Moreover, TGF-β released by MDSCs can stimulate Treg expansion and survival and enhance their suppressive activity (50, 51). In turn, Tregs can trigger the induction of MDSCs, thereby creating a positive feedback loop, favoring immune suppression and T effector cell (Teff) apoptosis or inactivation (50, 52). Reports showed that several non-Smad signaling pathways could be activated by TGF-β, such as PI3K/AKT and IL-6 signaling, leading to resistance to various cancer treatments (47, 53, 54). These data suggest that M-MDSCs in the circulation of CRC patients upregulate multiple pathways, including TGF-β, IL-6, PI3P, and PI3K, which could promote tumorigenesis by supporting Treg expansion and suppressive activity and favoring immune suppression and therapy resistance.
Signaling cascades are regulated by protein kinases, which are activated or deactivated through phosphorylation and dephosphorylation. Here, we found that, in I-MDSCs, both cell cycle– and protein phosphorylation–related genes were upregulated, compared with monocytic APCs. These genes could be associated with the activation of signaling cascades, which govern cellular processes, such as cell proliferation, migration, differentiation, survival, and growth of immune-suppressive cells, and regulating Teff function and migration into the TME (55).
Epigenetic modifications via DNA methylation and histone methylation/acetylation have also a major impact on tumorigenesis, immunosuppression, and cancer progression (18, 56, 57). Additionally, acetylation and deacetylation of both histone and nonhistone marks have been reported to be closely associated with the transcriptomic regulation of genes associated with cell proliferation, cell cycle, and apoptosis in cancer. Here, we found that acetylation-related genes were upregulated in PMN-MDSCs and M-MDSCs, compared with monocytic APCs. Apart from acetylation, genes related to transcription, DNA damage, apoptosis, and myeloid differentiation were also found to be upregulated in PMN-MDSCs and M-MDSCs. These data suggest that elevated expression of acetylation-related genes in MDSCs could trigger multiple signaling cascades promoting the survival and progression of malignant cells. However, the suppressive function of these cells in human is not totally evident.
Some of the signaling pathways investigated in this study were exclusively upregulated in one myeloid suppressive subset, implicating the importance of their functions and contribution to CRC progression. Additionally, this study revealed some of the epigenetic mechanisms, which control the transcriptional profile of the different myeloid cell subsets. However, further studies are required to validate these findings using functional assays and in larger patient cohorts. Additionally, it would be interesting to compare the transcriptomic profiles of circulating MSDC subsets between CRC patients and healthy donors to identify distinct enrichment of transcripts/pathways in specific subsets favoring onset and progression of CRC.
Data Availability Statement
The datasets presented in this study can be found in the following online repository: Sequence Read Archive https://www.ncbi.nlm.nih.gov/sra/?term=PRJNA641527.
Ethics Statement
The studies involving human participants were reviewed and approved by Institutional Review Board, Hamad Medical Corporation, Doha, Qatar; and Institutional Review Board, Qatar Biomedical Research Institute, Hamad Bin Khalifa University, Qatar Foundation, Doha, Qatar.
Author Contributions
VS performed experimental work, data analyses and wrote the manuscript. RS and ST assisted in experimental work. NA performed bioinformatics and data analysis and reviewed the manuscript. EE conceived the idea, designed the study, supervised the project, analyzed and interpreted data, and wrote and revised the manuscript. All authors were involved in the final approval of the manuscript.
Funding
This work was supported by a start-up grant [VR04] for EE from Qatar Biomedical Research Institute, Qatar Foundation.
Conflict of Interest
The authors declare that the research was conducted in the absence of any commercial or financial relationships that could be construed as a potential conflict of interest.
Acknowledgments
We are grateful to all patients for donating their samples. We would also like to thank the genomics core facility at Qatar Biomedical Research Institute for performing RNA-Sequencing.
Supplementary Material
The Supplementary Material for this article can be found online at: https://www.frontiersin.org/articles/10.3389/fonc.2020.01530/full#supplementary-material
References
1. Bray F, Ferlay J, Soerjomataram I, Siegel RL, Torre LA, Jemal A. Global cancer statistics 2018: GLOBOCAN estimates of incidence and mortality worldwide for 36 cancers in 185 countries. CA Cancer J Clin. (2018) 68:394–424. doi: 10.3322/caac.21492
2. Leman JK, Sandford SK, Rhodes JL, Kemp RA. Multiparametric analysis of colorectal cancer immune responses. World J Gastroenterol. (2018) 24:2995–3005. doi: 10.3748/wjg.v24.i27.2995
3. Toor SM, Syed Khaja AS, El Salhat H, Bekdache O, Kanbar J, Jaloudi M, et al. Increased levels of circulating and tumor-infiltrating granulocytic myeloid cells in colorectal cancer patients. Front Immunol. (2016) 7:560. doi: 10.3389/fimmu.2016.00560
4. Swierczak A, Pollard JW. Myeloid cells in metastasis. Cold Spring Harb Perspect Med. (2019) 10:a038026. doi: 10.1101/cshperspect.a038026
5. Siret C, Collignon A, Silvy F, Robert S, Cheyrol T, Andre P, et al. Deciphering the crosstalk between myeloid-derived suppressor cells and regulatory T cells in pancreatic ductal adenocarcinoma. Front Immunol. (2019) 10:3070. doi: 10.3389/fimmu.2019.03070
6. Monteran L, Erez N. The dark side of fibroblasts: cancer-associated fibroblasts as mediators of immunosuppression in the tumor microenvironment. Front Immunol. (2019) 10:1835. doi: 10.3389/fimmu.2019.01835
7. Gonda K, Shibata M, Ohtake T, Matsumoto Y, Tachibana K, Abe N, et al. Myeloid-derived suppressor cells are increased and correlated with type 2 immune responses, malnutrition, inflammation, and poor prognosis in patients with breast cancer. Oncol Lett. (2017) 14:1766–74. doi: 10.3892/ol.2017.6305
8. Martens A, Wistuba-Hamprecht K, Geukes Foppen M, Yuan J, Postow MA, Wong P, et al. Baseline peripheral blood biomarkers associated with clinical outcome of advanced melanoma patients treated with ipilimumab. Clin Cancer Res. (2016) 22:2908–18. doi: 10.1158/1078-0432.CCR-15-2412
9. Wu L, Liu H, Guo H, Wu Q, Yu S, Qin Y, et al. Circulating and tumor-infiltrating myeloid-derived suppressor cells in cervical carcinoma patients. Oncol Lett. (2018) 15:9507–15. doi: 10.3892/ol.2018.8532
10. Law AMK, Valdes-Mora F, Gallego-Ortega D. Myeloid-derived suppressor cells as a therapeutic target for cancer. Cells. (2020) 9:3. doi: 10.3390/cells9030561
11. Fletcher M, Ramirez ME, Sierra RA, Raber P, Thevenot P, Al-Khami AA, et al. l-Arginine depletion blunts antitumor T-cell responses by inducing myeloid-derived suppressor cells. Cancer Res. (2015) 75:275–83. doi: 10.1158/0008-5472.CAN-14-1491
12. Gabrilovich DI, Ostrand-Rosenberg S, Bronte V. Coordinated regulation of myeloid cells by tumours. Nat Rev Immunol. (2012) 12:253–68. doi: 10.1038/nri3175
13. Nagaraj S, Gupta K, Pisarev V, Kinarsky L, Sherman S, Kang L, et al. Altered recognition of antigen is a mechanism of CD8+ T cell tolerance in cancer. Nat Med. (2007) 13:828–35. doi: 10.1038/nm1609
14. Kumar V, Patel S, Tcyganov E, Gabrilovich DI. The nature of myeloid-derived suppressor cells in the tumor microenvironment. Trends Immunol. (2016) 37:208–20. doi: 10.1016/j.it.2016.01.004
15. Marvel D, Gabrilovich DI. Myeloid-derived suppressor cells in the tumor microenvironment: expect the unexpected. J Clin Invest. (2015) 125:3356–64. doi: 10.1172/JCI80005
16. Musolino C, Allegra A, Pioggia G, Gangemi S. Immature myeloid-derived suppressor cells: a bridge between inflammation and cancer (Review). Oncol Rep. (2017) 37:671–83. doi: 10.3892/or.2016.5291
17. Toor SM, Murshed K, Al-Dhaheri M, Khawar M, Abu Nada M, Elkord E. Immune checkpoints in circulating and tumor-infiltrating CD4(+) T Cell subsets in colorectal cancer patients. Front Immunol. (2019) 10:2936. doi: 10.3389/fimmu.2019.02936
18. Sasidharan Nair V, Saleh R, Toor SM, Taha RZ, Ahmed AA, Kurer MA, et al. Transcriptomic profiling disclosed the role of DNA methylation and histone modifications in tumor-infiltrating myeloid-derived suppressor cell subsets in colorectal cancer. Clin Epigenetics. (2020) 12:13. doi: 10.1186/s13148-020-0808-9
19. Toor SM, Sasidharan Nair V, Pfister G, Elkord E. Effect of pembrolizumab on CD4(+) CD25(+), CD4(+) LAP(+) and CD4(+) TIM-3(+) T cell subsets. Clin Exp Immunol. (2019) 196:345–52. doi: 10.1111/cei.13264
20. Sasidharan Nair V, Toor SM, Taha RZ, Ahmed AA, Kurer MA, Murshed K, et al. Transcriptomic profiling of tumor-infiltrating CD4(+)TIM-3(+) T cells reveals their suppressive, exhausted, and metastatic characteristics in colorectal cancer patients. Vaccines. (2020) 8:1. doi: 10.3390/vaccines8010071
21. Huang da W, Sherman BT, Lempicki RA. Systematic and integrative analysis of large gene lists using DAVID bioinformatics resources. Nat Protoc. (2009) 4:44–57. doi: 10.1038/nprot.2008.211
22. Huang DW, Sherman BT, Tan Q, Kir J, Liu D, Bryant D, et al. DAVID bioinformatics resources: expanded annotation database and novel algorithms to better extract biology from large gene lists. Nucleic Acids Res. (2007) 35(Web Server issue):W169–75. doi: 10.1093/nar/gkm415
23. Szklarczyk D, Franceschini A, Wyder S, Forslund K, Heller D, Huerta-Cepas J, et al. STRING v10: protein-protein interaction networks, integrated over the tree of life. Nucleic Acids Res. (2015) 43(Database issue):D447–52. doi: 10.1093/nar/gku1003
24. Mullen M, Gonzalez-Perez RR. Leptin-Induced JAK/STAT signaling and cancer growth. Vaccines. (2016) 4:3. doi: 10.3390/vaccines4030026
25. Han Y, Leaman DW, Watling D, Rogers NC, Groner B, Kerr IM, et al. Participation of JAK and STAT proteins in growth hormone-induced signaling. J Biol Chem. (1996) 271:5947–52. doi: 10.1074/jbc.271.10.5947
26. Caldenhoven E, van Dijk T, Raaijmakers JA, Lammers JW, Koenderman L, De Groot RP. Activation of the STAT3/acute phase response factor transcription factor by interleukin-5. J Biol Chem. (1995) 270:25778–84. doi: 10.1074/jbc.270.43.25778
27. Lejeune D, Dumoutier L, Constantinescu S, Kruijer W, Schuringa JJ, Renauld JC. Interleukin-22 (IL-22) activates the JAK/STAT, ERK, JNK, and p38 MAP kinase pathways in a rat hepatoma cell line. Pathways that are shared with and distinct from IL-10. J Biol Chem. (2002) 277:33676–82. doi: 10.1074/jbc.M204204200
28. Bohmer FD, Friedrich K. Protein tyrosine phosphatases as wardens of STAT signaling. JaKSTaT. (2014) 3:e28087. doi: 10.4161/jkst.28087
29. Lohi O, Lehto VP. STAM/EAST/Hbp adapter proteins–integrators of signalling pathways. FEBS Lett. (2001) 508:287–90. doi: 10.1016/S0014-5793(01)03079-4
30. Lee MK, Pardoux C, Hall MC, Lee PS, Warburton D, Qing J, et al. TGF-beta activates Erk MAP kinase signalling through direct phosphorylation of ShcA. EMBO J. (2007) 26:3957–67. doi: 10.1038/sj.emboj.7601818
31. Luo X, Xiong X, Shao Q, Xiang T, Li L, Yin X, et al. The tumor suppressor interferon regulatory factor 8 inhibits beta-catenin signaling in breast cancers, but is frequently silenced by promoter methylation. Oncotarget. (2017) 8:48875–88. doi: 10.18632/oncotarget.16511
32. Eruslanov EB, Bhojnagarwala PS, Quatromoni JG, Stephen TL, Ranganathan A, Deshpande C, et al. Tumor-associated neutrophils stimulate T cell responses in early-stage human lung cancer. J Clin Invest. (2014) 124:5466–80. doi: 10.1172/JCI77053
33. Eruslanov EB. Phenotype and function of tumor-associated neutrophils and their subsets in early-stage human lung cancer. Cancer Immunol Immunother. (2017) 66:997–1006. doi: 10.1007/s00262-017-1976-0
34. Ma X, Wang M, Yin T, Zhao Y, Wei X. Myeloid-derived suppressor cells promote metastasis in breast cancer after the stress of operative removal of the primary cancer. Front Oncol. (2019) 9:855. doi: 10.3389/fonc.2019.00855
35. Jayakumar A, Bothwell ALM. RIPK3-induced inflammation by I-MDSCs promotes intestinal tumors. Cancer Res. (2019) 79:1587–99. doi: 10.1158/0008-5472.CAN-18-2153
36. Bromberg J, Darnell JE Jr. The role of STATs in transcriptional control and their impact on cellular function. Oncogene. (2000). 19:2468–73. doi: 10.1038/sj.onc.1203476
37. Soriano SF, Serrano A, Hernanz-Falcon P, Martin de Ana A, Monterrubio M, Martinez C, et al. Chemokines integrate JAK/STAT and G-protein pathways during chemotaxis and calcium flux responses. Eur J Immunol. (2003) 33:1328–33. doi: 10.1002/eji.200323897
38. Row PE, Clague MJ, Urbe S. Growth factors induce differential phosphorylation profiles of the Hrs-STAM complex: a common node in signalling networks with signal-specific properties. Biochem J. (2005) 389(Pt 3):629–36. doi: 10.1042/BJ20050067
39. Dhillon AS, Hagan S, Rath O, Kolch W. MAP kinase signalling pathways in cancer. Oncogene. (2007) 26:3279–90. doi: 10.1038/sj.onc.1210421
40. Seif F, Khoshmirsafa M, Aazami H, Mohsenzadegan M, Sedighi G, Bahar M. The role of JAK-STAT signaling pathway and its regulators in the fate of T helper cells. Cell Commun Signal. (2017) 15:23. doi: 10.1186/s12964-017-0177-y
41. Lee M, Rhee I. Cytokine signaling in tumor progression. Immune Netw. (2017) 17:214–27. doi: 10.4110/in.2017.17.4.214
42. Owen KL, Brockwell NK, Parker BS. JAK-STAT signaling: a double-edged sword of immune regulation and cancer progression. Cancers. (2019) 11:12. doi: 10.3390/cancers11122002
43. Gabitass RF, Annels NE, Stocken DD, Pandha HA, Middleton GW. Elevated myeloid-derived suppressor cells in pancreatic, esophageal and gastric cancer are an independent prognostic factor and are associated with significant elevation of the Th2 cytokine interleukin-13. Cancer Immunol Immunother. (2011) 60:1419–30. doi: 10.1007/s00262-011-1028-0
44. Lien EC, Dibble CC, Toker A. PI3K signaling in cancer: beyond AKT. Curr Opin Cell Biol. (2017) 45:62–71. doi: 10.1016/j.ceb.2017.02.007
45. Marat AL, Haucke V. Phosphatidylinositol 3-phosphates-at the interface between cell signalling and membrane traffic. EMBO J. (2016) 35:561–79. doi: 10.15252/embj.201593564
47. Zhang YE. Non-Smad pathways in TGF-beta signaling. Cell Res. (2009) 19:128–39. doi: 10.1038/cr.2008.328
48. Picon A, Gold LI, Wang J, Cohen A, Friedman E. A subset of metastatic human colon cancers expresses elevated levels of transforming growth factor beta1. Cancer Epidemiol Biomarkers Prev. (1998) 7:497–504.
49. Xu Y, Pasche B. TGF-beta signaling alterations and susceptibility to colorectal cancer. Hum Mol Genet. (2007) 16 Spec No 1:R14–20. doi: 10.1093/hmg/ddl486
50. Saleh R, Elkord E. Acquired resistance to cancer immunotherapy: Role of tumor-mediated immunosuppression. Semin Cancer Biol. (2019) doi: 10.1016/j.semcancer.2019.07.017
51. Hoechst B, Gamrekelashvili J, Manns MP, Greten TF, Korangy F. Plasticity of human Th17 cells and iTregs is orchestrated by different subsets of myeloid cells. Blood. (2011) 117:6532–41. doi: 10.1182/blood-2010-11-317321
52. Lee CR, Kwak Y, Yang T, Han JH, Park SH, Ye MB, et al. Myeloid-Derived suppressor cells are controlled by regulatory T cells via TGF-beta during murine colitis. Cell Rep. (2016) 17:3219–32. doi: 10.1016/j.celrep.2016.11.062
53. Levy L, Hill CS. Alterations in components of the TGF-beta superfamily signaling pathways in human cancer. Cytokine Growth Factor Rev. (2006) 17:41–58. doi: 10.1016/j.cytogfr.2005.09.009
54. Yao Z, Fenoglio S, Gao DC, Camiolo M, Stiles B, Lindsted T, et al. TGF-beta IL-6 axis mediates selective and adaptive mechanisms of resistance to molecular targeted therapy in lung cancer. Proc Natl Acad Sci USA. (2010) 107:15535–40. doi: 10.1073/pnas.1009472107
55. Ardito F, Giuliani M, Perrone D, Troiano G, Lo Muzio L. The crucial role of protein phosphorylation in cell signaling and its use as targeted therapy (Review). Int J Mol Med. (2017) 40:271–80. doi: 10.3892/ijmm.2017.3036
56. Sasidharan Nair V, El Salhat H, Taha RZ, John A, Ali BR, Elkord E. DNA methylation and repressive H3K9 and H3K27 trimethylation in the promoter regions of PD-1, CTLA-4, TIM-3, LAG-3, TIGIT, and PD-L1 genes in human primary breast cancer. Clin Epigenetics. (2018) 10:78. doi: 10.1186/s13148-018-0512-1
Keywords: colorectal cancer, RNASeq, myeloid-derived suppressor cells, JAK/STAT, histone acetylation
Citation: Sasidharan Nair V, Saleh R, Toor SM, Alajez NM and Elkord E (2020) Transcriptomic Analyses of Myeloid-Derived Suppressor Cell Subsets in the Circulation of Colorectal Cancer Patients. Front. Oncol. 10:1530. doi: 10.3389/fonc.2020.01530
Received: 10 June 2020; Accepted: 16 July 2020;
Published: 02 September 2020.
Edited by:
Panagiota S. Filippou, Teesside University, United KingdomReviewed by:
Jessy Deshane, University of Alabama at Birmingham, United StatesSabrin Albeituni, St. Jude Children's Research Hospital, United States
Copyright © 2020 Sasidharan Nair, Saleh, Toor, Alajez and Elkord. This is an open-access article distributed under the terms of the Creative Commons Attribution License (CC BY). The use, distribution or reproduction in other forums is permitted, provided the original author(s) and the copyright owner(s) are credited and that the original publication in this journal is cited, in accordance with accepted academic practice. No use, distribution or reproduction is permitted which does not comply with these terms.
*Correspondence: Eyad Elkord, eelkord@hbku.edu.qa; e.elkord@salford.ac.uk