 Christian O. de Groot1
 Judy E. Hsia1†
 John V. Anzola1†
 Amir Motamedi1†
 Michelle Yoon1†
 Yao Liang Wong2,3
 David Jenkins1
 Hyun J. Lee1
 Mallory B. Martinez1
 Robert L. Davis1
 Timothy C. Gahman1
 Arshad Desai2,3*
 Andrew K. Shiau1*
- 1Small Molecule Discovery Program, Ludwig Institute for Cancer Research, La Jolla, CA, USA
- 2Laboratory of Chromosome Biology, Ludwig Institute for Cancer Research, La Jolla, CA, USA
- 3Department of Cellular and Molecular Medicine, University of California San Diego, La Jolla, CA, USA
Aurora kinases are essential for cell division and are frequently misregulated in human cancers. Based on their potential as cancer therapeutics, a plethora of small molecule Aurora kinase inhibitors have been developed, with a subset having been adopted as tools in cell biology. Here, we fill a gap in the characterization of Aurora kinase inhibitors by using biochemical and cell-based assays to systematically profile a panel of 10 commercially available compounds with reported selectivity for Aurora A (MLN8054, MLN8237, MK-5108, MK-8745, Genentech Aurora Inhibitor 1), Aurora B (Hesperadin, ZM447439, AZD1152-HQPA, GSK1070916), or Aurora A/B (VX-680). We quantify the in vitro effect of each inhibitor on the activity of Aurora A alone, as well as Aurora A and Aurora B bound to fragments of their activators, TPX2 and INCENP, respectively. We also report kinome profiling results for a subset of these compounds to highlight potential off-target effects. In a cellular context, we demonstrate that immunofluorescence-based detection of LATS2 and histone H3 phospho-epitopes provides a facile and reliable means to assess potency and specificity of Aurora A versus Aurora B inhibition, and that G2 duration measured in a live imaging assay is a specific readout of Aurora A activity. Our analysis also highlights variation between HeLa, U2OS, and hTERT-RPE1 cells that impacts selective Aurora A inhibition. For Aurora B, all four tested compounds exhibit excellent selectivity and do not significantly inhibit Aurora A at effective doses. For Aurora A, MK-5108 and MK-8745 are significantly more selective than the commonly used inhibitors MLN8054 and MLN8237. A crystal structure of an Aurora A/MK-5108 complex that we determined suggests the chemical basis for this higher specificity. Taken together, our quantitative biochemical and cell-based analyses indicate that AZD1152-HQPA and MK-8745 are the best current tools for selectively inhibiting Aurora B and Aurora A, respectively. However, MK-8745 is not nearly as ideal as AZD1152-HQPA in that it requires high concentrations to achieve full inhibition in a cellular context, indicating a need for more potent Aurora A-selective inhibitors. We conclude with a set of “good practice” guidelines for the use of Aurora inhibitors in cell biology experiments.
Introduction
Aurora kinases were discovered in the mid-nineties in Drosophila and yeast (1, 2). Whereas yeasts only have one Aurora kinase, metazoans generally have two, named Aurora A and B. Mammals, but not other vertebrates, also have a third family member, Aurora C. Aurora A localizes to centrosomes and spindle microtubules and plays important roles in centrosome maturation, controlling spindle length and bipolarity, asymmetric cell division, and promoting mitotic entry both in unperturbed cells and following DNA damage (3, 4). Aurora B localizes to chromosomes/inner centromeres and the spindle midzone and is implicated in many processes including chromosome condensation, chromosome biorientation on the spindle, and cytokinesis (5–7). Aurora C is expressed in testis (8), where it exhibits tissue-specific functions (9, 10), and in oocytes, where it contributes to early embryonic divisions by providing functions associated with Aurora B in somatic cells (11–14). In addition, Aurora C is aberrantly expressed in cancer cells (15).
Due to their closely related kinase domains (72% identity for the human proteins), Aurora A and B exhibit similar protein substrate preferences in vitro (16–19). In vivo, their distinct substrate specificities, localization patterns, and functions arise from interactions with specialized binding partners (3, 4). Aurora B is largely found as part of the four-subunit chromosomal passenger complex (CPC) (5–7) whose three other members – INCENP, survivin, and borealin – localize the kinase to the centromere and the anaphase spindle. INCENP also activates Aurora B via a two-step mechanism (20–22). The IN box at the INCENP C-terminus first wraps around the N-terminal lobe of Aurora B, stimulating autophosphorylation of the activation loop residue Thr 232 (23). This event allows Aurora B to phosphorylate serines in the TSS motif adjacent to the IN box, which generates a feedforward loop by further augmenting INCENP’s ability to bind and activate Aurora B.
Aurora A has multiple regulators, with the best-studied one being TPX2, which activates the kinase and targets it to spindle microtubules (24–26). Structural studies have shown that the TPX2 N-terminus binds the N-terminal lobe of Aurora A, in a manner distinct from how the INCENP IN box binds Aurora B, facilitating the alignment of residues essential for substrate binding and catalysis (27–29). In biochemical assays, binding of the TPX2 N-terminus increases autophosphorylation of the activation loop residue Thr 288 (28, 30, 31). As in the case of Aurora B, phosphorylation of this threonine [which readily occurs in vitro even in the absence of TPX2 or other activators (16)] promotes high levels of kinase activity (16, 28, 32). However, recent studies have unexpectedly revealed that this autophosphorylation event is not essential for TPX2 stimulation of Aurora A kinase activity; fully dephosphorylated Aurora A bound to TPX2 exhibits robust enzymatic activity (28, 32). The relative contributions of TPX2 binding and Thr 288 phosphorylation to different cellular Aurora A functions is an active area of investigation.
Coincident with the delineation of their cellular roles, the Aurora kinases were also found to be amplified/overexpressed in cancer (33, 34). Functional studies of Aurora A revealed a potential role in tumor initiation and growth – increased expression of Aurora A transformed rodent fibroblasts (albeit weakly) and promoted their ability to form tumors in vivo (35, 36). In addition, elevated Aurora A activity was shown to confer resistance to taxol-mediated apoptosis in cancer cells (37). The Aurora kinases therefore emerged as attractive drug targets in cancer and became the focus of intense drug discovery efforts (38–41).
At least 30 Aurora kinase inhibitors have been evaluated preclinically or clinically as potential oncology therapeutics (38). The development of these inhibitors has typically involved high throughput biochemical assays using purified proteins, structure-based drug design, cellular biomarker assays (primarily Aurora A Thr 288 phosphorylation and Aurora B-mediated phosphorylation of its canonical substrate, histone H3), cellular proliferation/cytotoxicity assays, and xenograft models in mice (39). The products of the vast majority of these programs have been compounds that potently inhibit all three Aurora kinases (A, B and C), as best exemplified by the first clinically tested Aurora kinase inhibitor, the Vertex/Merck pyrazolo-pyrimidine compound VX-680 (MK-0457, tozasertib; Figure 1) (42, 43). However, compounds that exhibit preference for Aurora A or B/C have also been developed. In 2003, two pioneering academic-industrial collaborations described two distinct Aurora B inhibitors: the indolinone Hesperadin and the quinazoline ZM447439 [Figure 1; (44, 45)]. The latter compound was further optimized to produce the structurally related pro-drug AZD1152 (barasertib); barasertib is metabolized to the active form AZD1152-HQPA, which lacks the phosphate group present on AZD1152 and is the form typically used in biochemical and cell-based studies (Figure 1) (46, 47). In 2007, Millenium (now Takeda) described the first Aurora A-selective inhibitor, the benzazepine MLN8054 (48–51), which, due to central nervous system side effects (52, 53), was replaced as the lead clinical candidate by the derivative MLN8237 (alisertib; Figure 1) (49, 54, 55). In parallel, optimization of the VX-680 scaffold by Merck/Banyu/Vertex resulted in the Aurora A-selective inhibitors MK-5108 (VX-689) (56) and MK-8745 (57, 58) (Figure 1). More recently, other structurally unrelated Aurora A- and B-selective inhibitors have been described, such as the bisanilinopyrimidine inhibitor Genentech Aurora Inhibitor 1 (optimized to target Aurora A) (59) and the azaindole-based GSK1070916 (optimized to target Aurora B/C) (60–62) (Figure 1).
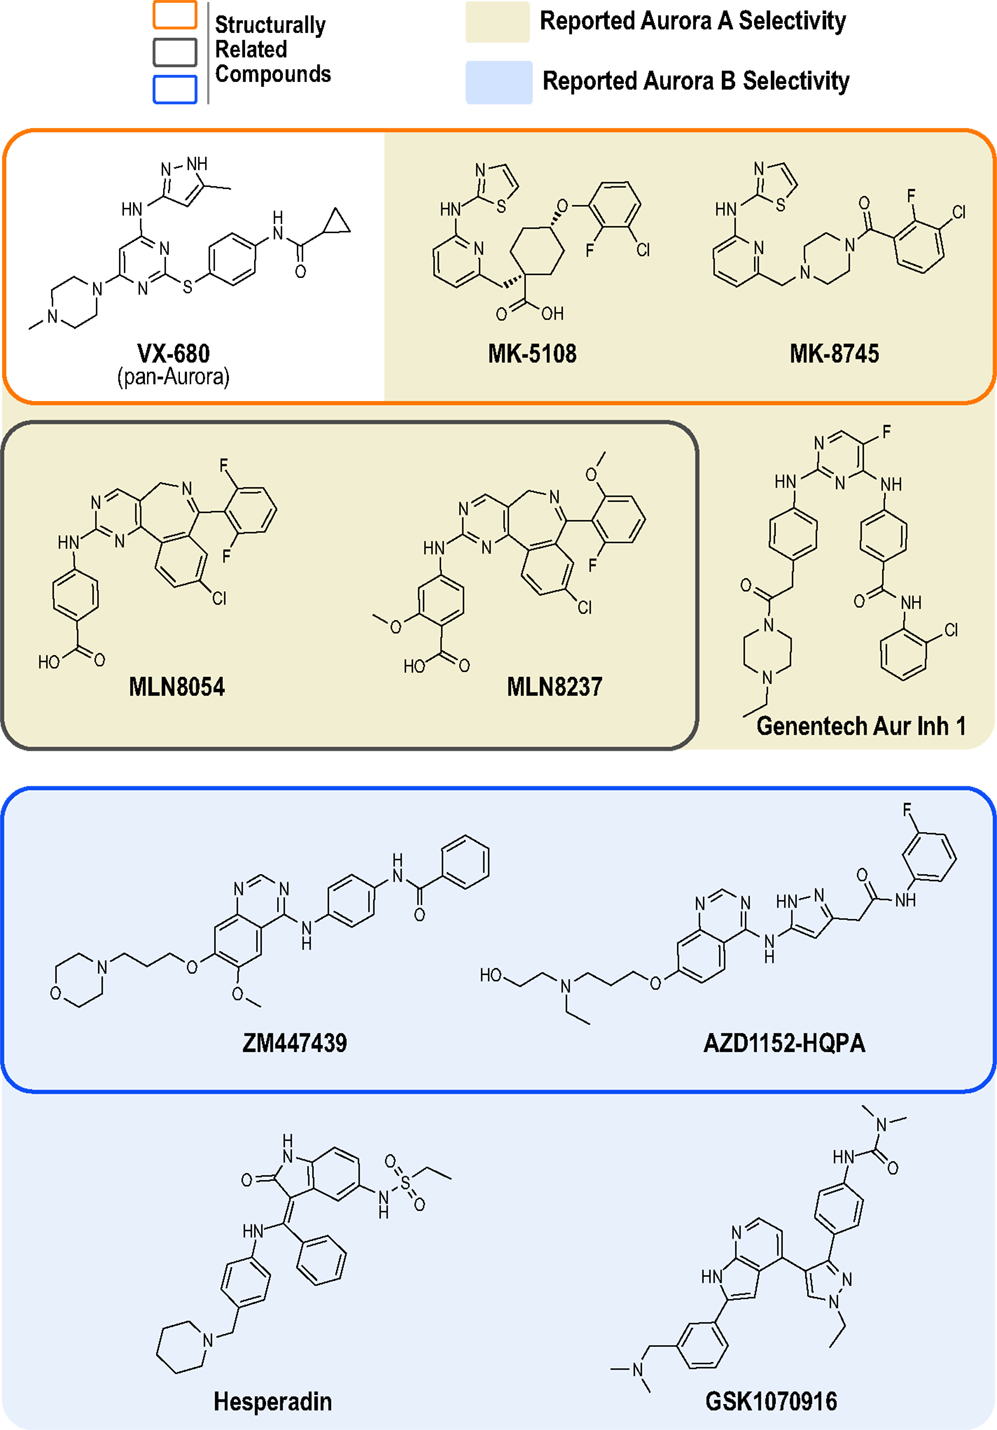
Figure 1. Chemical structures of Aurora kinase inhibitors analyzed in this study. The chemical structures of the 10 commercially available compounds characterized in this study are depicted (see Table S1 in Supplementary Material for suppliers). Outlined boxes group chemically related inhibitors: Pyrazolo-pyrimidine class (Vertex/Merck/Banyu) – MK-5108 and MK-8745 were derived from VX-680 (orange outlined box); Benzazepine class (Millenium/Takeda) – MLN8237 was derived from MLN8054 (gray outlined box); and Quinazoline class (Astra Zeneca) – AZD1152-HQPA was derived from ZM447439 (blue outlined box).
While these compounds were developed with a primary emphasis on therapeutic benefit, they were rapidly adopted by academic investigators as chemical tools for biochemical, structural, and cell biological studies (63). Application of these small molecules has complemented genetic knockdown and immunodepletion approaches because their inhibitory effects exhibit high penetrance/rapid onset and can be readily reversed. Their use has been wide ranging and influential, resulting in a large body of work defining Aurora kinase cellular functions, identifying potential substrates, and elucidating molecular mechanisms of kinase activation (63).
Despite the common use of several Aurora inhibitors by the cell biology community, a systematic comparison of these compounds in quantitative in vitro and cellular assays has been lacking. Further, it is presently unclear how the potencies, selectivities, off-target profiles, and cellular efficacies of the most frequently used inhibitors compare to those of more recently described, potentially improved molecules. Here, we fill this gap by profiling the 10 commercially available inhibitors shown in Figure 1 in biochemical and cell-based assays. Our results highlight significant challenges in the selective inhibition of Aurora A, identify the best compounds for specific and potent targeting of Aurora A and Aurora B, and lead us to present a set of recommendations for the experimental use of these compounds.
Results
Quantitative Biochemical Analysis of Inhibitor Potency and Specificity
We began by analyzing the inhibitory properties of the 10 compounds in Figure 1 (see Table S1 in Supplementary Material for suppliers) on the in vitro activities of full-length human Aurora A, alone or bound to an activating N-terminal peptide fragment of TPX2 (residues 1–43), and full-length human Aurora B bound to a C-terminal fragment of INCENP (residues 783–918, which includes both the IN box and TSS motifs; Figure 2A). As the large number of required measurements (3–11 independent sets of triplicate 12–36 point dose–response curves per compound) precluded the use of conventional radiometric substrate phosphorylation assays, we explored several recently developed high throughput methods for measuring kinase catalytic activity in multi-well microplate format (64). To allow comparison of Aurora A and B activity under similar reaction conditions (Figure 2A), we ultimately selected a sensitive assay format that monitors ADP production (ADP-Glo™ – see Materials and Methods). Briefly, kinase reactions (with or without inhibitors) were performed in 384-well plates with saturating amounts of a generic peptide substrate containing the Aurora kinase consensus phosphorylation motif (Kemptide – LRRASLG; Aurora kinase consensus RRXS/T). After a defined incubation period, an enzyme cocktail was added to terminate the reaction and convert any remaining ATP to cyclic AMP. This was followed by a second enzyme cocktail that converted the ADP produced by the kinase reaction to ATP and, in turn, the newly generated ATP to a luminescent signal via luciferase. The resulting luminescence was then quantified using a microplate reader (Figure 2A).
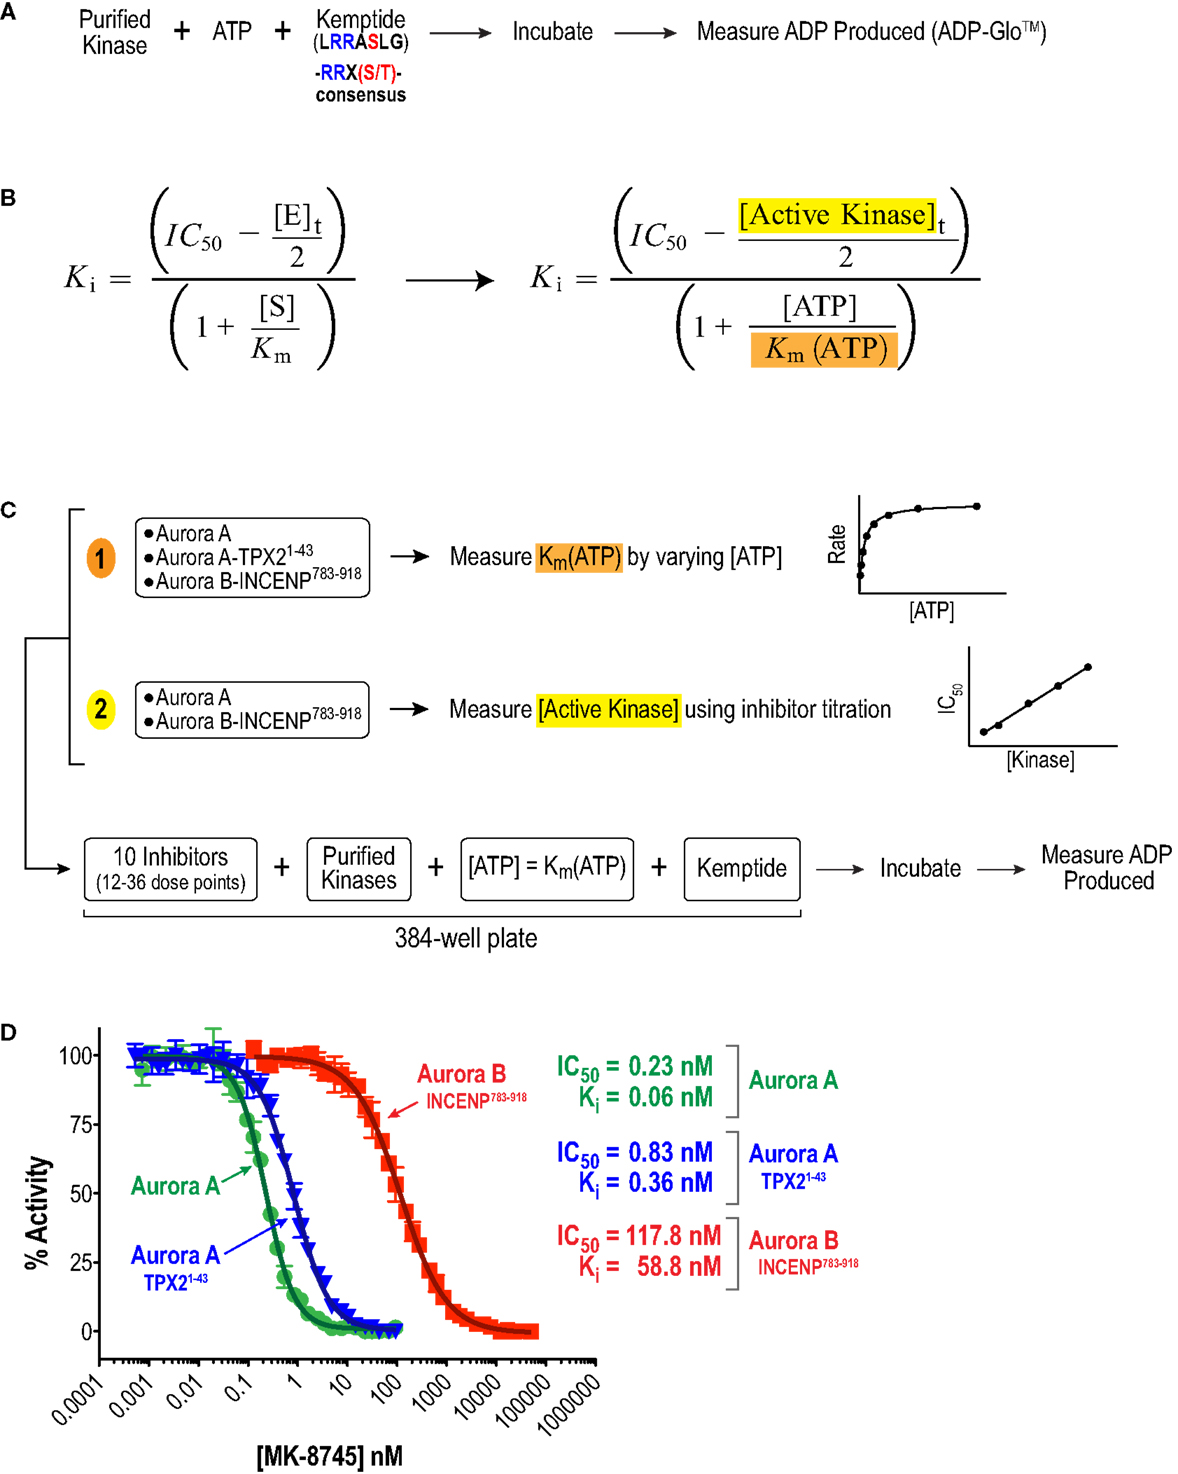
Figure 2. Approach used to quantify inhibitor potency and selectivity in vitro. (A) Schematic of protocol used to measure kinase activity by quantifying ADP production using the luminescence-based assay technology, ADP-Glo™ (Promega). (B) Equation used to convert measured IC50 values to Ki values. This equation simplifies to the more familiar Cheng and Prusoff approximation in cases where Ki >> [E]t (65). (C) Schematic of approach used to quantify inhibitor potencies. First, key variables, (1) Km(ATP) and (2) [E]t = [Active kinase]t, required for the IC50 conversion were measured. Second, a multi-point inhibitor dose titration was performed in 384-well plates under conditions where [ATP] = Km(ATP) to determine IC50 values. (D) Example datasets for MK-8745 showing the measured IC50s and the Kis calculated from them using the equation in (B).
Given the high affinities of the inhibitors and the enzyme concentrations required for sufficient signal-to-noise, some experiments were performed under “tight binding” conditions (66). Under these conditions, the total active enzyme concentration ([E]t) matches or exceeds the dissociation constant for the enzyme/inhibitor complex (Ki); therefore, the assumption that the concentration of free inhibitor is equivalent to that added to the reaction is not valid. The Ki was therefore calculated from the measured IC50 (concentration for half maximal inhibition) using the equation shown in Figure 2B (66–69). Use of this equation assumes that the compounds act through a direct competitive mechanism and requires that the substrate concentration [S], which in this case is [ATP], Km(ATP), and [E]t be precisely known. Therefore, for all three enzyme species employed in this analysis, we first measured Km(ATP) through an ATP titration (Figure 2C), and then performed all reactions at [ATP] = Km(ATP) so that the denominator simplified to two. We also measured [E]t using inhibitor titrations under conditions where [E]t and [I] >> Ki, which enables the approximation that IC50 ~ [E]t/2 (Figure 2C). Example dose–response curves for MK-8745, the measured IC50s, and the resulting Ki values are depicted in Figure 2D. Ki values for all 10 inhibitors for Aurora A, Aurora A/TPX21–43 and Aurora B/INCENP783–918 are reported in Table 1. The Ki values were used to calculate the selectivity ratios of each inhibitor for the three enzyme species (Table 2). Because of the extremely slow on-rate of GSK1070916 for Aurora B/INCENP, this Ki could not be accurately measured under our conditions, so the previously described value (61) was used for selectivity analysis. For reference, the published Aurora A/TPX21–43Ki for GSK1070916 is also presented in Table 1.
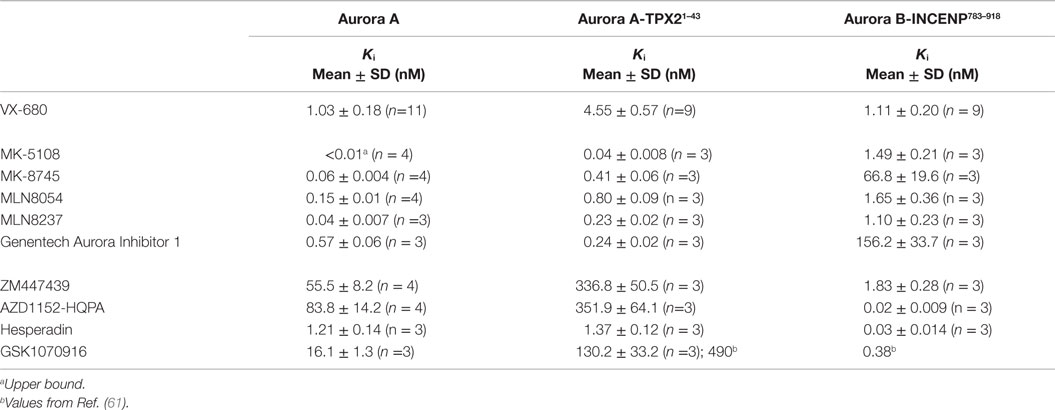
Table 1. Biochemical inhibition constants of the Aurora inhibitor panel.
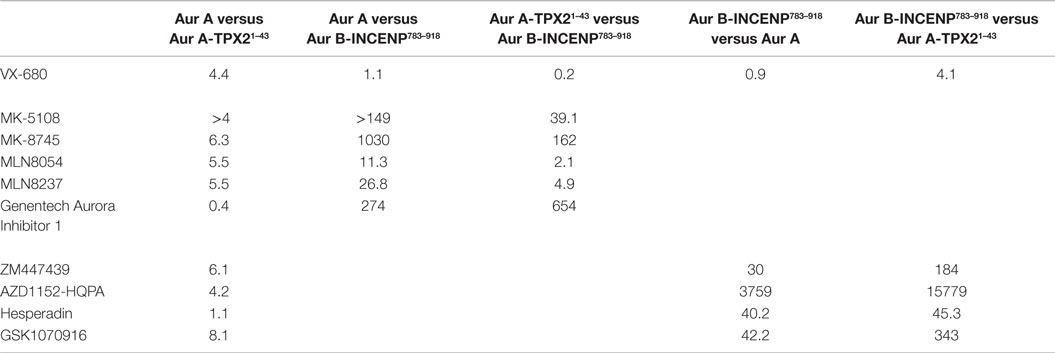
Table 2. In vitro selectivity ratios of the Aurora inhibitor panel (fold difference in potency calculated by dividing Ki values measured for each kinase).
Consistent with previously reported measurements [Table S2 in Supplementary Material; (42, 70)], the well-characterized pan-Aurora inhibitor VX-680 inhibited both Aurora A and Aurora B/INCENP783–918 with essentially identical potencies [(Ki=1.0 nM); Table 1]. This compound was therefore included as a reference in the assays for the remaining nine compounds. We note that, based on significant differences in enzyme construct design, sources, purification methods, as well as assay conditions/readouts, it is not straightforward to compare our Ki values to values in the literature (which are, in many cases, wide ranging). Therefore, for all compounds (beyond VX-680), we largely restrict our discussion of prior work to trends in potency and selectivity ratios.
As expected, all of the compounds reported to be Aurora B-selective were extremely potent Aurora B/INCENP783–918 inhibitors with a rank order of potency of AZD1152-HQPA > Hesperadin >> GSK1070916 (61) > ZM447439 (Table 1) and exhibited a high selectivity (minimum of 30-fold) for Aurora B/INCENP783–918 over Aurora A (Table 2). Although our mean Aurora B/INCENP783–918Ki value (0.02 nM) (Table 1) for AZD1152-HQPA is ~18-fold lower than that previously reported [0.36 nM; Table S2 in Supplementary Material; (46, 47)], this is also the case for the Aurora A Ki values [~16-fold; 84 nM in this study (Table 1) versus 1.4 µM from published work (Table S2 in Supplementary Material; (46, 47))]. Thus, the selectivity ratio calculated from our measurements is similar to that which can be derived from prior work (3760-fold versus 3890-fold) (Table 2 and Table S2 in Supplementary Material).
All of the described Aurora A-selective inhibitors had subnanomolar Kis for Aurora A, with a rank order of potency of MK-5108 > MLN8237 > MK-8745 > MLN8054 > Genentech Aurora Inhibitor I (Table 1). MK-5108 exhibited an inhibition constant below what we could accurately measure (≤10 pM). All of these compounds inhibited Aurora B/INCENP783–918 less potently than Aurora A, with MK-8745 exhibiting the highest selectivity for Aurora A (1,030-fold) and MLN8054 and MLN8237 the lowest (11- and 27-fold, respectively) (Table 2). The selectivity measured for MLN8054 was lower than the published value [Table S2 in Supplementary Material; 43-fold (48)], possibly in part because this previous calculation was based on IC50s, which can be highly dependent upon [ATP], Km(ATP), and potentially [E]t (Figure 2B). In agreement with this, the Ki-based selectivity ratio we report for MLN8054 (11-fold) (Table 2) is close to that described in a structural, biochemical, and mutational analysis of the Aurora A inhibitory properties of MLN8054 (6-fold) (71).
Given the importance of TPX2 as an Aurora A regulator, we also assessed the inhibitory activity of all 10 compounds on the Aurora A/TPX21–43 complex. Excluding Genentech Aurora Inhibitor I and Hesperadin, the presence of TPX21–43 weakened binding by 4- to 8.1-fold (Tables 1 and 2). Intriguingly, TPX21–43 increased the affinity of Genentech Aurora Inhibitor I for Aurora A 2.5-fold, whereas Hesperadin binding was unaffected (Tables 1 and 2). Decreased Aurora A Kis in the presence of TPX21–43 has been previously reported for VX-680, MK-5108, MLN8054, and MLN8237 [Table S2 in Supplementary Material; (70–72)].
Binding of the TPX2 N-terminus to Aurora A stabilizes a productive conformation of its substrate binding and catalytic elements [including the catalytic lysine (Lys 162), the αC helix which bears the glutamic acid (Glu 181) that interacts with Lys 162, the DFG motif, and the activation loop containing Thr 288] (20, 28). In contrast, inhibitors, such as VX-680, MLN8054, and quinazoline-class compounds, favor distorted inactive conformations of some or all of these elements (59, 71, 73–76). As suggested previously for VX-680 and a quinazoline resembling ZM447439 and AZD1152-HQPA (70), these opposing structural effects likely result in the decreased affinities of the majority of the inhibitors we characterized for the Aurora A/TPX21–43 complex (Table 2). Conversely, based on their respective positions in the Aurora A and Aurora B binding pockets, Genentech Aurora Inhibitor I (59) and Hesperadin (20) are predicted to make minimal contact with the active site elements that move upon TPX21–43 binding. This potentially explains the subtle changes in Aurora A Kis for these two compounds in the presence of TPX21–43 (Table 2).
From a biochemical selectivity perspective, the Ki shifts driven by TPX21–43 binding have important but different consequences for the Aurora A- and Aurora B-selective compounds. The selectivity ratios of GSK1070916, ZM447439, and AZD1152-HQPA (preference for Aurora B over A) increase to ≥184 in the presence of TPX21–43 (Table 2). Conversely, the selectivity ratios of the Aurora A-selective inhibitors diminish significantly, with MLN8054 and MLN8237 exhibiting only two- and fivefold preference, respectively, for Aurora A/TPX21–43 over Aurora B/INCENP783–918 (Table 2). Given the prevalent use of MLN8054 and MLN8237 as Aurora A-selective tools, these findings motivated us to analyze our inhibitor panel in a battery of cellular assays.
Substrate Phosphorylation-Based Profiling of Aurora Inhibitors in HeLa Cells
The critical parameters influencing inhibitor choice for cell biologists are efficacy and specificity in a cellular context. Thus, we next focused on identifying robust and reproducible cellular readouts for Aurora A and Aurora B kinase activity and employed them to systematically profile inhibitors in dose–response in three cell lines commonly used in cell biological studies: HeLa cervical carcinoma, hTERT-RPE1 retinal pigment epithelial (hereafter referred to as RPE1), and U2OS osteosarcoma cells. Based on previous biochemical studies, it is known that many of the inhibitors we tested can inhibit Aurora C. However, based on our qPCR analysis and previously published work (15), Aurora C mRNA is expressed at low levels in HeLa and RPE1 cells, and only present at ~20% of Aurora B mRNA levels in U2OS cells (Figure S1A in Supplementary Material). Thus, we believe that the biological effects we detect are predominantly, if not exclusively, mediated by Aurora A and B.
As a first approach, we performed immunofluorescence in fixed HeLa cells to detect phospho-epitopes associated with the activity of each kinase. Aurora A has multiple known substrates enriched at centrosomes/mitotic spindles, including the Hippo pathway kinase LATS2 (Ser 83) (77), TACC3 (Ser 558) (78–82), and Aurora A itself (Thr 288) (16, 17). We chose pLATS2(Ser 83) as a cellular readout for Aurora A activity because pilot experiments, guided by a prior study (83), indicated that robust, specific labeling could be obtained using a commercial monoclonal antibody (Clone ST-3B11) targeting this epitope (Figure 3A). Aurora B phosphorylates Ser 10 and Ser 28 in the N-terminal tail of histone H3 (84, 85) and reliable antibodies are commercially available for detecting these phospho-epitopes in cells (Figure 3A; Table S3 in Supplementary Material). We chose pH3(Ser 28) as the model substrate site because robust labeling could be achieved under fixation conditions compatible with pLATS2(Ser 83) labeling, allowing us to monitor activities of both Aurora A and B in the same cells in 96-well plates. We used RNAi (Figure 3B) to confirm that pH3(Ser 28) is sensitive to knockdown of Aurora B but not Aurora A, and that pLATS2(Ser 83) is significantly reduced by knockdown of Aurora A but not Aurora B (Figures 3B,C); the partiality of the RNAi likely accounts for the less-than-complete elimination of pLATS2 signal. pH3(Ser 10) behaved similarly to pH3(Ser 28) (Figure S1B in Supplementary Material), as expected (84, 85).
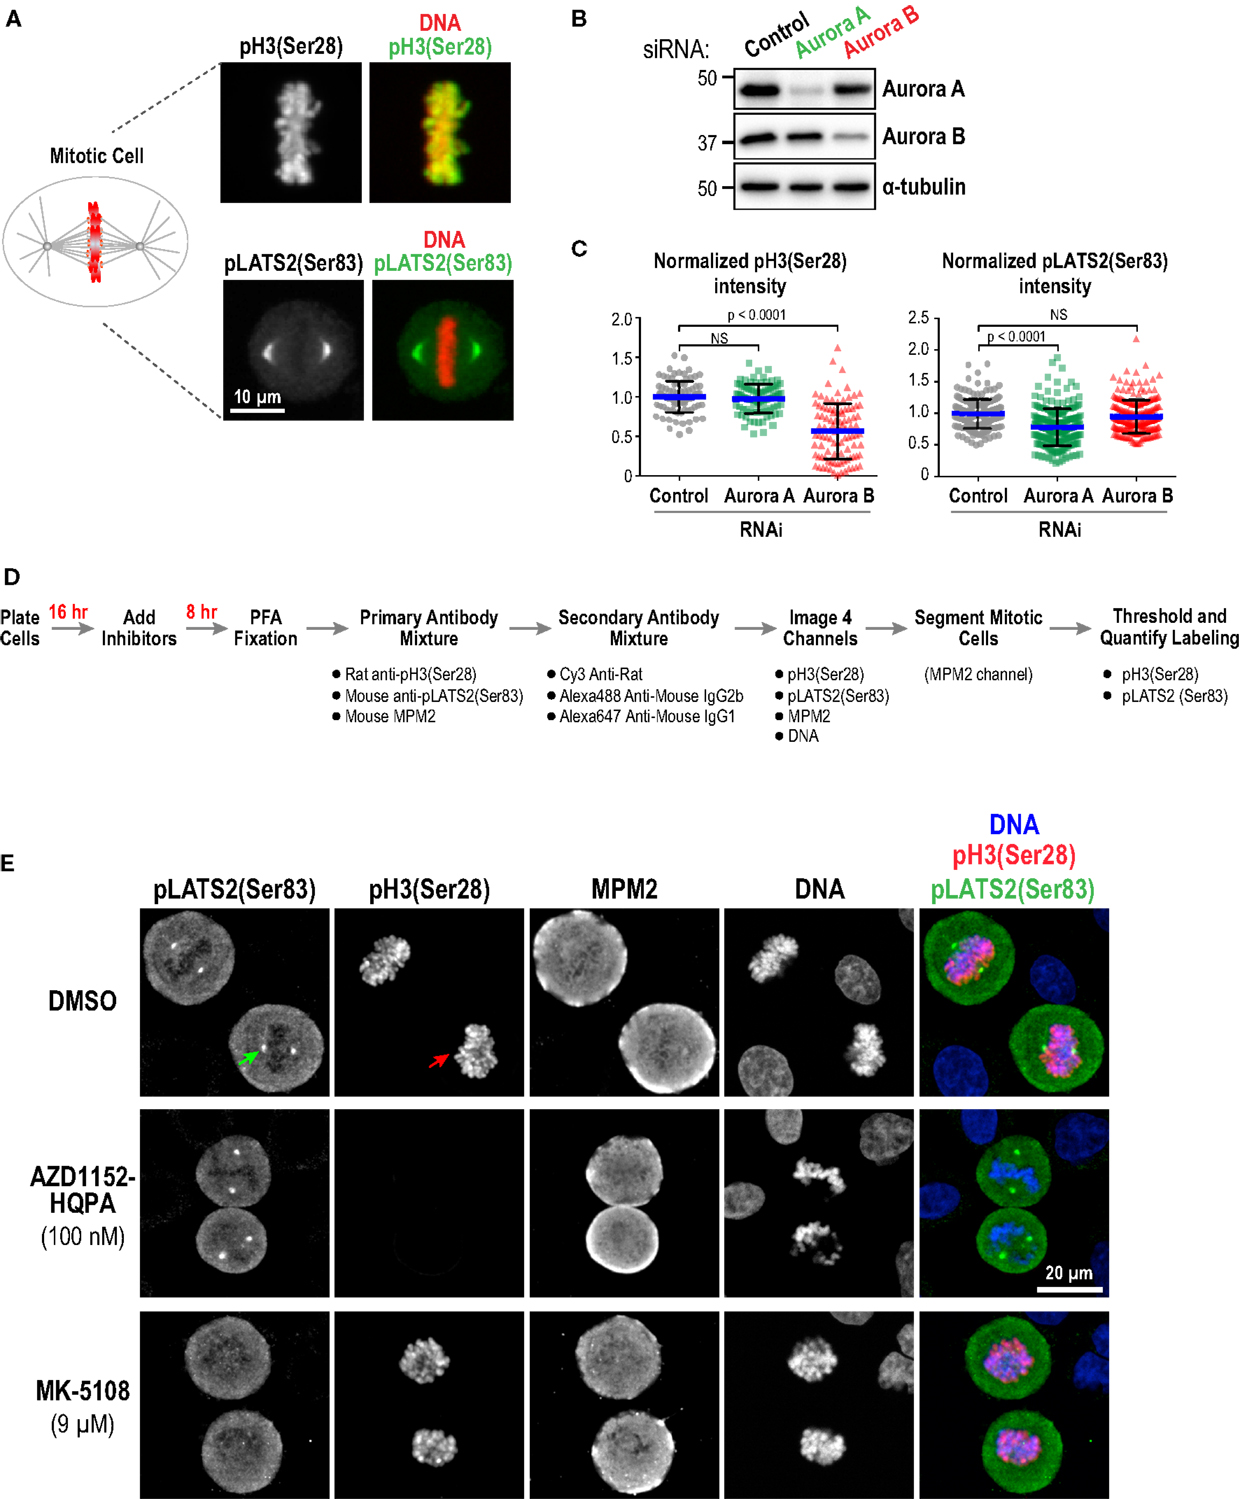
Figure 3. Substrate phosphorylation-based analysis of Aurora inhibitor specificity and potency in a cellular context: assay validation and example images. (A) Images of mitotic cells labeled for pH3(Ser 28) (top panels) and pLATS2(Ser 83) (bottom panels). Merges with DNA (red) are shown on the right. (B) Immunoblots of HeLa cells following Aurora A or Aurora B RNAi. α-tubulin serves as a loading control. Expression levels of Aurora A and B are reduced by ~90 and ~65%, respectively, under these conditions. (C) Quantification of pH3(Ser 28) (left graph) and pLATS2(Ser 83) (right graph) labeling for the indicated conditions. Blue lines indicate the mean; black error bars are the SD. p-values are from unpaired t-tests. (D) Schematic of procedure used to process cells for labeling and quantification of pH3(Ser 28) and pLATS2(Ser 83). (E) Example images of control DMSO-treated (top row) and inhibitor-treated (bottom two rows) cells. Arrows in the control DMSO-treated panels highlight pLATS2(Ser 83) labeling of spindle poles (green arrow) and pH3(Ser 28) labeling of mitotic chromatin (red arrow). The concentrations shown for AZD1152-HQPA and MK-5108 exemplify selective inhibition of Aurora B and Aurora A activity, respectively.
We employed the protocol described in Figure 3D to analyze substrate phosphorylation in HeLa cells following treatment with all 10 inhibitors in dose–response. Asynchronous cells were incubated with vehicle (DMSO) or different inhibitor doses for 8 h and then fixed and labeled with a mixture of three antibodies directed against pLATS2(Ser 83), pH3(Ser 28), and MPM2 [which detects mitotic phosphoepitopes; (86)]. While both the anti-pLATS2(Ser 83) and MPM2 antibodies are mouse monoclonals, they are of different IgG subclasses [IgG2b for anti-pLATS2(Ser 83) and IgG1 for MPM2], and can thus be detected with subclass-specific secondary antibodies (Table S3 in Supplementary Material).
In control mitotic cells, pLATS2(Ser 83) is concentrated in foci around the spindle poles (Figure 3E; top row – green arrow) and pH3(Ser 28) is on the mitotic chromatin (Figure 3E; top row – red arrow). Selective kinase inhibition should result in loss of one signal but not the other, as illustrated by the example images for specific conditions in Figure 3E (middle and bottom rows). Cells were imaged in 4 channels to visualize pLATS2(Ser 83), pH3(Ser 28), MPM2, and DNA (labeled with Hoechst) and mitotic cells were segmented based on their bright MPM2 labeling (Figure 3E). Intensity and area thresholds were set to select the pLATS2(Ser 83) foci and the pH3(Ser 28)-labeled chromatin in their respective channels in DMSO-treated control cells and the same thresholds were applied for inhibitor-treated cells. The mean fluorescence intensity per pixel was measured to assess the activities of the kinases targeting these two substrate phosphorylation sites. The results of this analysis for all 10 inhibitors in dose–response are shown in Figure 4A.
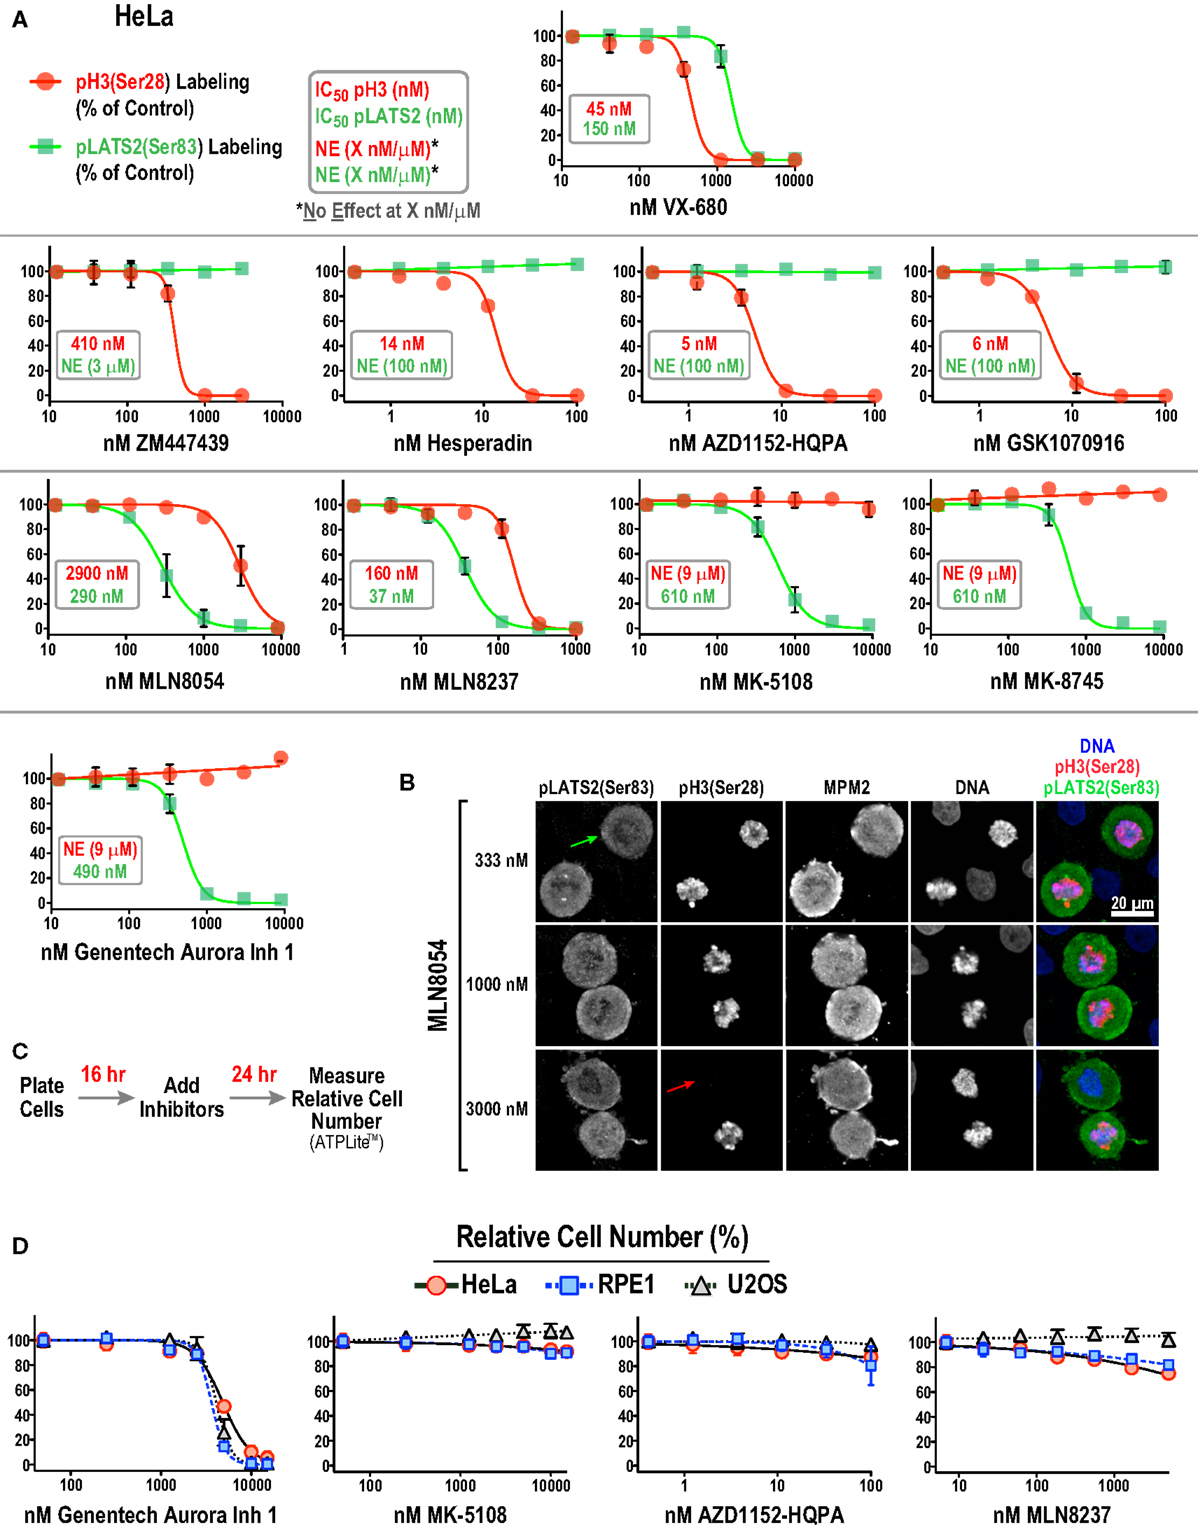
Figure 4. Substrate phosphorylation-based analysis of all 10 Aurora inhibitors in HeLa cells. (A) Dose–response curves measuring pH3(Ser 28) (red circles and line) and pLATS2(Ser 83) (green squares and line) labeling intensity for all 10 inhibitors in HeLa cells. Each point on the graphs represents the mean of measurements performed on four separate plates (average of 350 cells per point), normalized relative to control; the SD is plotted when larger than the symbol size. IC50 values are listed on graphs, when applicable, and were derived by computing dose–response curves using a 4-parameter, variable slope fit in GraphPad Prism. When there was no effect on labeling intensity at the highest tested concentration (X μM/nM), NE(X μM/nM) is indicated on the graphs, e.g., in AZD1152-HQPA graph (NE, 100 nM, green text) indicates no effect on pLATS2(Ser 83) labeling of 100 nM AZD1152-HQPA. (B) Example images of HeLa cells treated with MLN8054 at different doses highlighting partial (333 nM), selective (1000 nM) and non-selective (3000 nM) inhibition of pLATS2(Ser 83) labeling. Green and red arrows highlight cells lacking pLATS2(Ser 83) and pH3(Ser 28) labeling, respectively. (C) Protocol used to measure cellular proliferation after short-term (24 h) inhibitor exposure. Relative cell number was quantified by measuring ATP levels, using a luminescence-based assay (ATPLite™ from PerkinElmer). (D) Dose–response curves measuring cellular proliferation for the indicated four inhibitors in three cell lines: HeLa, RPE1, and U2OS. Each point represents the mean of six measurements from two independent experiments. Error bars are the SD. See Figure S2B in Supplementary Material for the graphs for the other six inhibitors.
Two major conclusions emerging from this dataset are:
(1) All four Aurora B-selective inhibitors can be used to specifically and potently inhibit H3(Ser 28) phosphorylation in cells. Consistent with the behavior of these compounds in the enzymatic assays described above, AZD1152-HQPA, Hesperadin, and GSK1070916 are extremely potent, completely eliminating pH3(Ser 28) labeling without affecting pLATS2(Ser 83) labeling at <100 nM concentrations.
(2) The inhibitors designed to target Aurora A require significantly higher concentrations for efficacy and exhibit greater variability with respect to specificity. MK-5108 and MK-8745, two related compounds (Figure 1), achieve specific Aurora A inhibition, as demonstrated by loss of pLATS2(Ser 83) labeling without reduction of pH3(Ser 28) labeling. However, both compounds require high micromolar concentrations for full efficacy (Figure 4A). In contrast, and consistent with the biochemical data, the commonly used MLN8054 and MLN8237 compounds have narrower specificity windows (10- and 4-fold, respectively), which makes it difficult to fully inhibit Aurora A without affecting Aurora B (Figure 4A). This point is illustrated by example images of MLN8054-treated HeLa cells at three different concentrations (Figure 4B). With careful optimization, these inhibitors can be employed for selective Aurora A inhibition, especially if the experimental goal is partial Aurora A inhibition. However, based on this dataset, MK-5108 and MK-8745 would be preferred for selectively targeting Aurora A.
Although similar to MK-5108 and MK-8745 in terms of Aurora A specificity, Genentech Aurora Inhibitor 1 led to significantly reduced proliferation and apoptotic cell death in HeLa cells within 24 h of treatment (Figures 4C,D; Figure S2A in Supplementary Material). This toxicity, which was also observed in U2OS and RPE1 cells (Figure 4D), is most likely due to off-target effects, as it is not observed with MK-5108, MLN8237, or AZD1152-HQPA (Figure 4D; Figure S2B in Supplementary Material). Therefore, the narrow window between efficacy and cytotoxicity of Genentech Aurora Inhibitor 1 suggests that it should not be used in routine cell culture experiments for Aurora A inhibition.
Analysis of Inhibitor Efficacy in RPE1 and U2OS Cells Highlights Variation in Potency and Specificity Across Cell Lines
We focused on additional characterization of the four inhibitors designed to target Aurora A that were not cytotoxic (MLN8054, MLN8237, MK-5108, MK-8745; Figure 4D; Figure S2B in Supplementary Material), and AZD1152-HQPA and GSK1070916, because they are chemically distinct (Figure 1) and the two most potent Aurora B inhibitors in the HeLa substrate phosphorylation assays (Figure 4A). As a first step, we analyzed substrate phosphorylation in RPE1 and U2OS cells for these six compounds (Figures 5A,B). This analysis revealed that the specificity window for certain inhibitors was significantly narrower in RPE1 and U2OS compared to HeLa cells, as best illustrated by MLN8054 and MLN8237 (compare Figure 5A with Figure 4A). In addition, inhibitor potency varied up to fourfold across the three cell lines (Figure 5B; Figure S2C in Supplementary Material). Regardless of the specific reasons for this variation (discussed below), our results underscore the technical importance of performing a dose–response analysis with the pLATS2(Ser 83) and pH3(Ser 28) labeling assay in all experimental cell lines in order to identify the minimum concentration required for selective and complete Aurora kinase inhibition. The results of this analysis confirm MK-5108 and MK-8745 as the current best Aurora A-specific inhibitors, with the latter exhibiting the least effect on pH3(Ser 28) at doses that eliminate pLATS2(Ser 83) labeling. We additionally note that H3(Ser 28) may be targeted by Aurora C in tissues/cell types where this kinase is expressed. As Aurora C mRNA is present at modest levels in U2OS cells and all pH3(Ser 28) signal is abolished by AZD1152-HQPA and GSK1070916 in this cell line, we believe any minor Aurora C activity that may be present is inhibited by these compounds, a conclusion that is consistent with published biochemical studies (46, 47, 61).
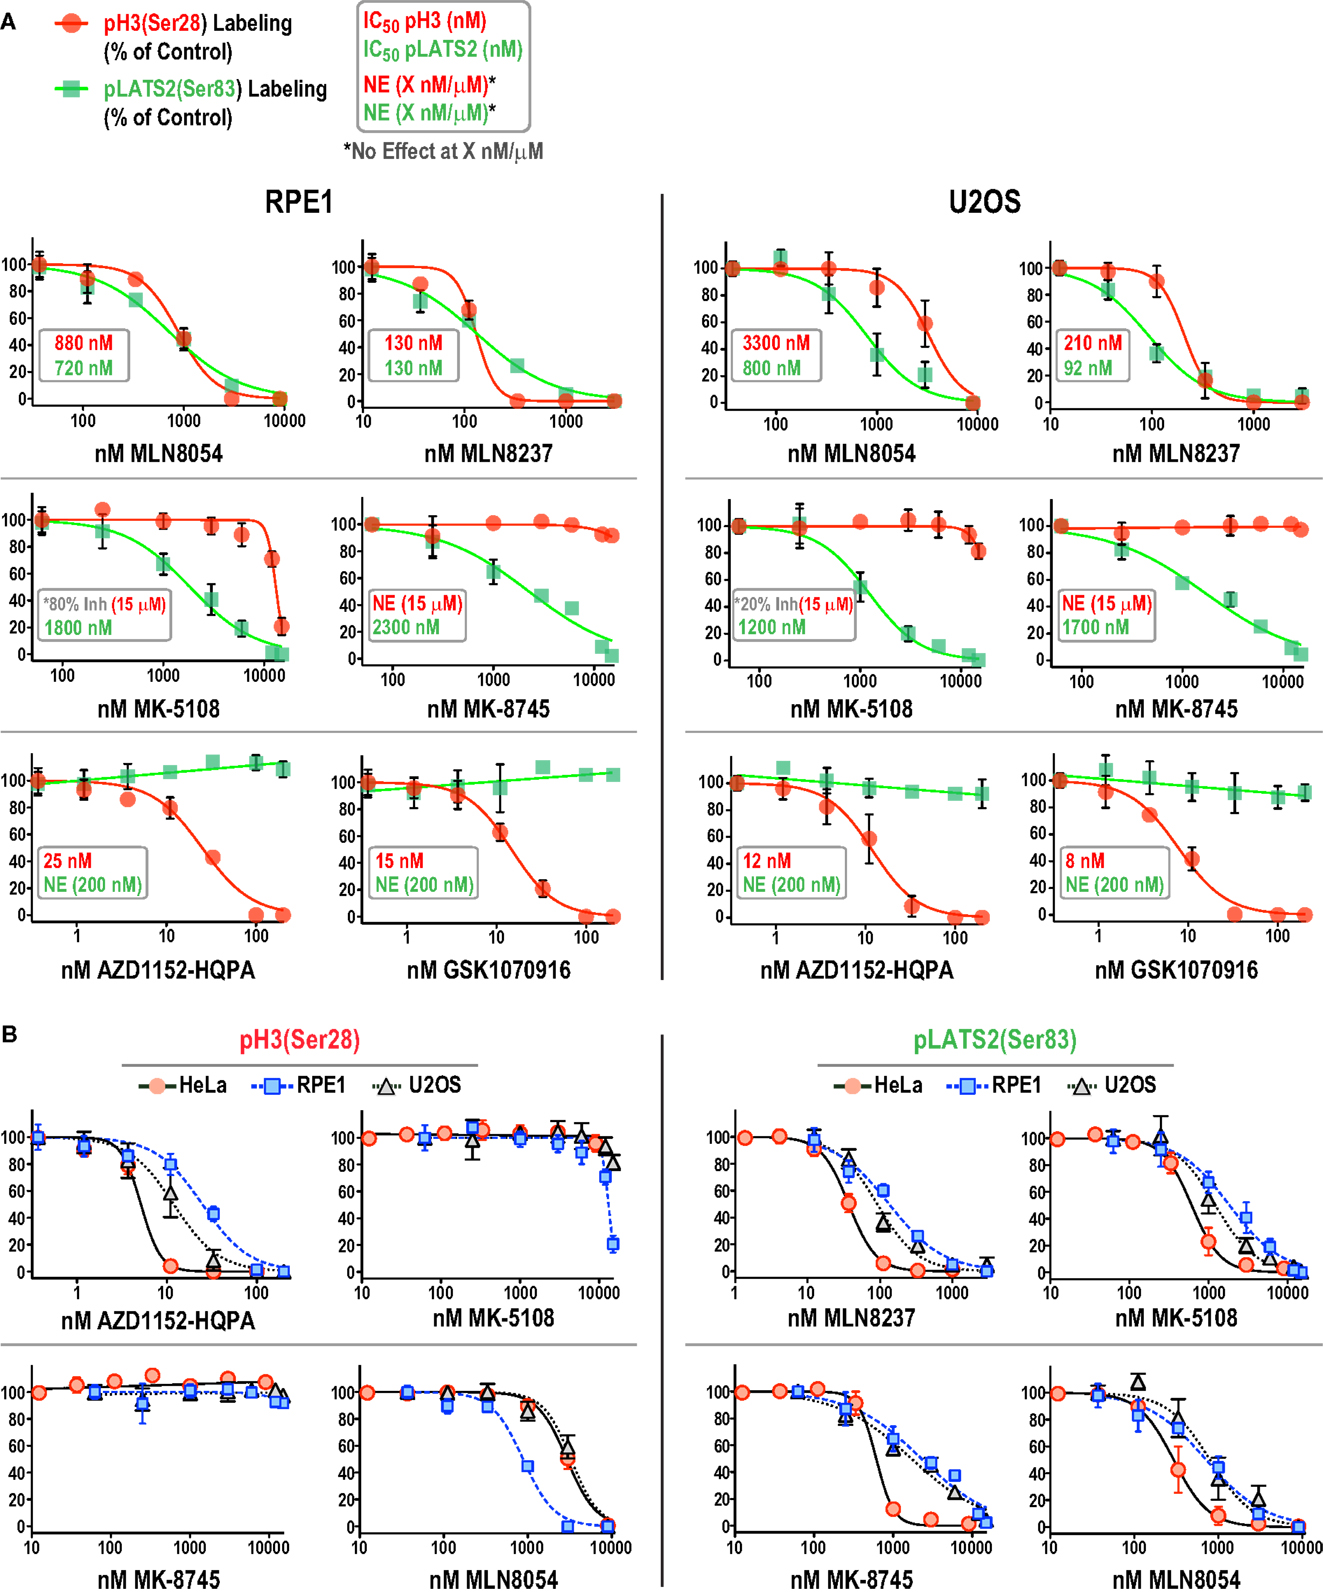
Figure 5. Comparison of inhibitor specificity and potency between HeLa, RPE1, and U2OS cells. (A) Dose–response curves measuring pH3(Ser 28) and pLATS2(Ser 83) labeling intensity for the six indicated inhibitors in RPE1 and U2OS cells, plotted and labeled as in Figure 4A. Note that for MK-5108 and pH3(Ser 28) labeling, where full inhibition was not achieved in the concentration range tested, the inhibition observed at the highest concentration tested is indicated on the graphs. Each point on the graphs represents the mean of measurements performed on four separate plates (average of 200 cells per point), normalized relative to control. (B) Dose–response data for pH3(Ser 28) (left set of graphs) and pLATS2(Ser 83) (right set of graphs) labeling intensity plotted for all three cell lines for the indicated inhibitors. Note that AZD1152-HQPA, which potently inhibits pH3(Ser 28) and is plotted on the left, has no effect on pLATS2(Ser 83) labeling in any cell line over the tested concentration range (0–200 nM), and is thus not plotted on the right; instead MLN8237 is plotted. See also Figure S2C in Supplementary Material.
Measurement of G2 Duration in a Live Imaging Assay Enables Assessment of Inhibitor Potency and Specificity for Aurora A
We next characterized the effect of selected inhibitors in single-cell live imaging assays, which provide high resolution, dynamic assessment of kinase function in a cellular context. For this purpose, the key challenge was to identify a specific readout for each kinase. For Aurora B, cytokinesis failure is a robust and well-established cellular phenotype of inhibition, which we confirmed with the four Aurora B-specific inhibitors (Figure S3 in Supplementary Material). However, for Aurora A, a specific quantifiable live imaging readout has been lacking. Prior work in Xenopus egg extracts (87), Caenorhabditis elegans embryos (88), and mammalian cells (89, 90) has suggested a role for Aurora A in controlling the kinetics of mitotic entry. Entry into mitosis, as defined by nuclear envelope breakdown (NEBD), is delayed in the absence of Aurora A. To quantitatively monitor this function of Aurora A in living cells, we employed an assay in which eGFP-tagged PCNA (GFP-PCNA) and mRFP-tagged histone H2B (H2B-RFP) are co-expressed and imaged in a cell population (91). PCNA concentrates in foci known as replication factories in S-phase (Figure 6A; Movie S1 in Supplementary Material) and the time interval from dissolution of PCNA foci to NEBD serves as a measure of G2 duration in living cells (Figure 6A; Movie S1 in Supplementary Material) (91–93). Using this assay in HeLa cells, we found that depletion of Aurora A, but not Aurora B, by RNAi significantly increased G2 duration (Figure 6B). We next measured G2 duration in HeLa cells following treatment with MK-5108 and AZD1152-HQPA, at concentrations that selectively eliminate labeling of pLATS2(Ser 83) or pH3(Ser 83), respectively (6 μM for MK-5108 and 100 nM for AZD1152-HQPA; Figure 4A). In agreement with the RNAi analysis, MK-5108, but not AZD1152-HQPA, significantly increased G2 duration (Figure 6C). Thus, measurement of G2 duration using the GFP-PCNA; H2B-RFP imaging assay provides a specific functional readout for Aurora A activity in living cells.
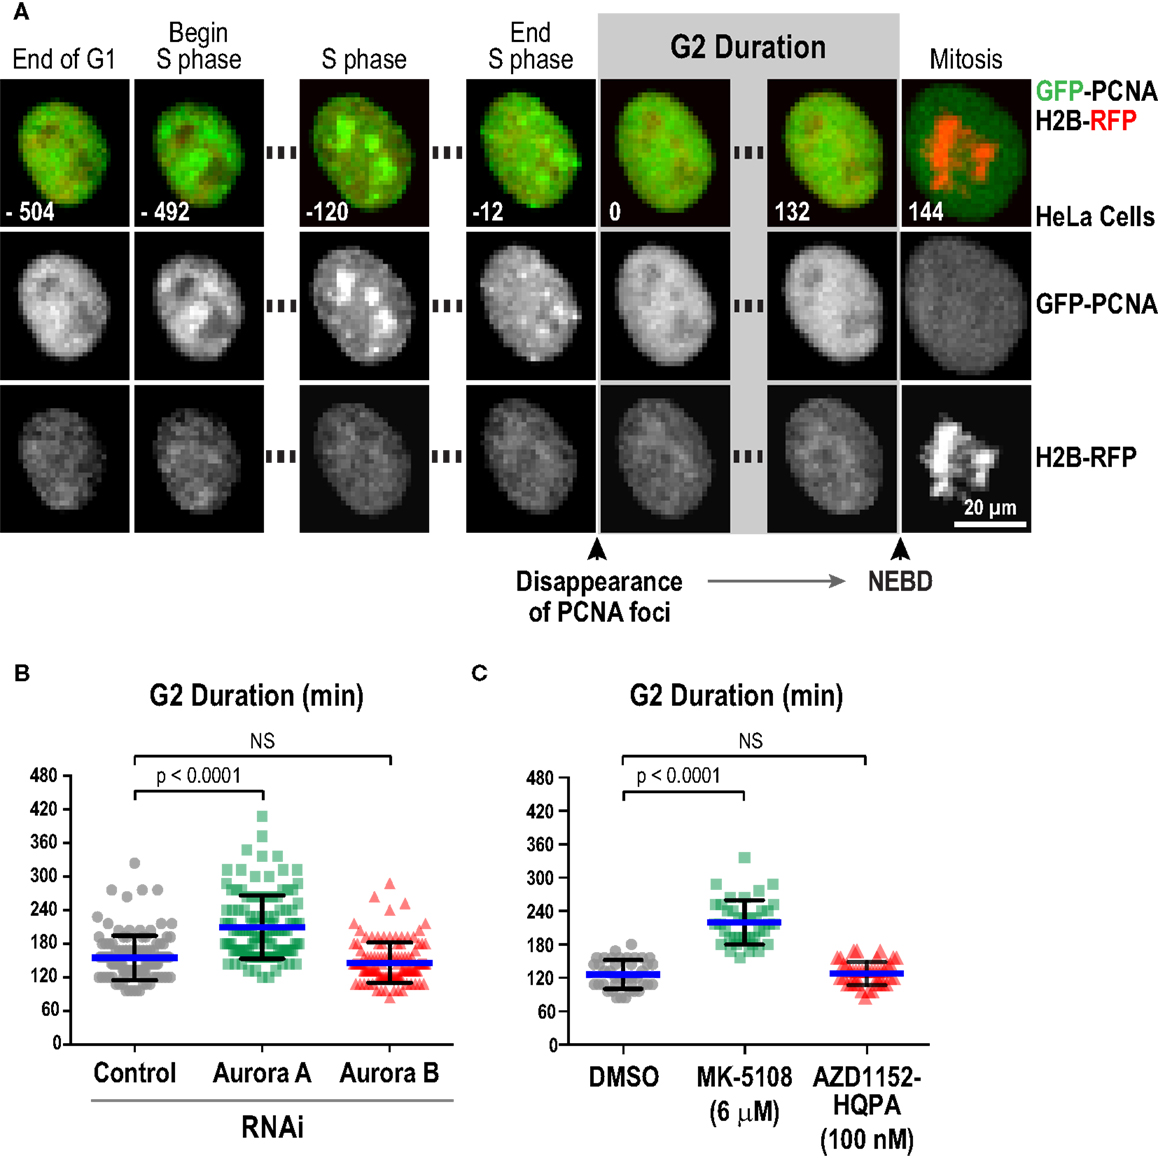
Figure 6. Measurement of G2 duration provides a specific readout for Aurora A kinase activity. (A) Images from a timelapse sequence of HeLa cells stably expressing GFP-PCNA; H2B-RFP. Gray scale images for the two separate channels are located below each colored merge. G2 duration is measured as the time from dissolution of PCNA foci to nuclear envelope breakdown (NEBD). See also Movie S1 in Supplementary Material.(B) Analysis of G2 duration in HeLa cells following knockdown of Aurora A or Aurora B by RNAi. Blue lines indicate the mean; black error bars are the SD. p-values are from unpaired t-tests. (C) Analysis of G2 duration in HeLa cells using selective Aurora A versus Aurora B inhibition, with MK-5108 (6 μM) and AZD1152-HQPA (100 nM), respectively. Blue lines indicate the mean; black error bars are the SD. p-values are from unpaired t-tests.
We next performed a dose–response analysis of the inhibitors developed to target Aurora A in the G2 duration assay in HeLa, RPE1, and U2OS. The results are shown in Figure 7 (and Figure S4 in Supplementary Material) and highlight that measurement of G2 duration with this assay provides a sensitive and dose-responsive measure for Aurora A activity in cells. The concentrations where G2 duration was maximally extended by Aurora A inhibitors tracked well with the concentrations at which pLATS2(Ser 83) labeling was eliminated (see Table 3 and text below). This concordance between distinct cell-based assays confirms that each assay specifically monitors Aurora A activity and gives us confidence that the inhibitor characterization performed using them is providing an accurate picture of efficacy in a cellular context.
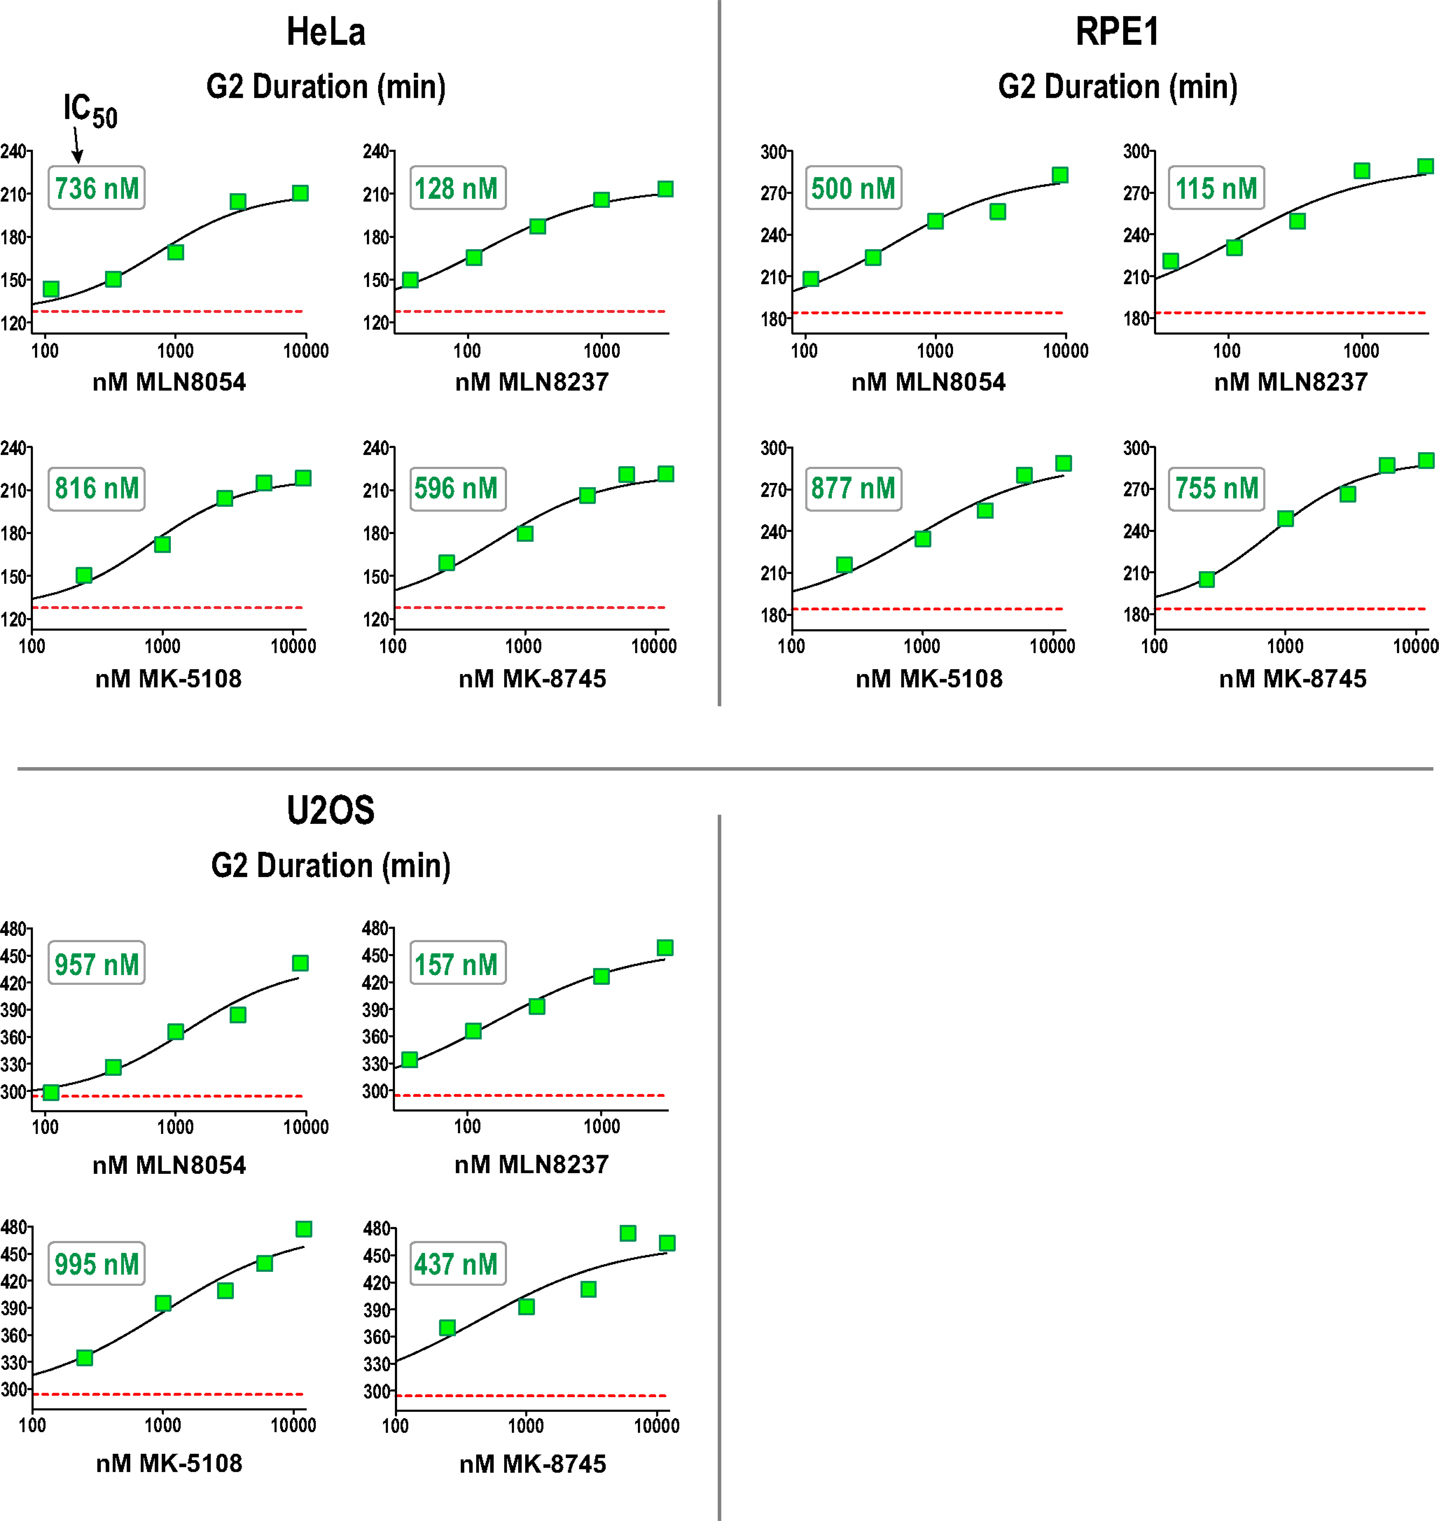
Figure 7. Dose–response analysis of G2 duration with inhibitors specifically targeting Aurora A in 3 cell lines. G2 duration (in minutes), measured as in Figure 6, for the indicated inhibitors and cell lines. Each point represents the mean of 40–100 cells from two sets of measurements. See Figure S4 in Supplementary Material for scatter plots showing all measurements. IC50 values shown on the graphs were determined by computing dose–response curves using a four-parameter, variable slope fit in GraphPad Prism.
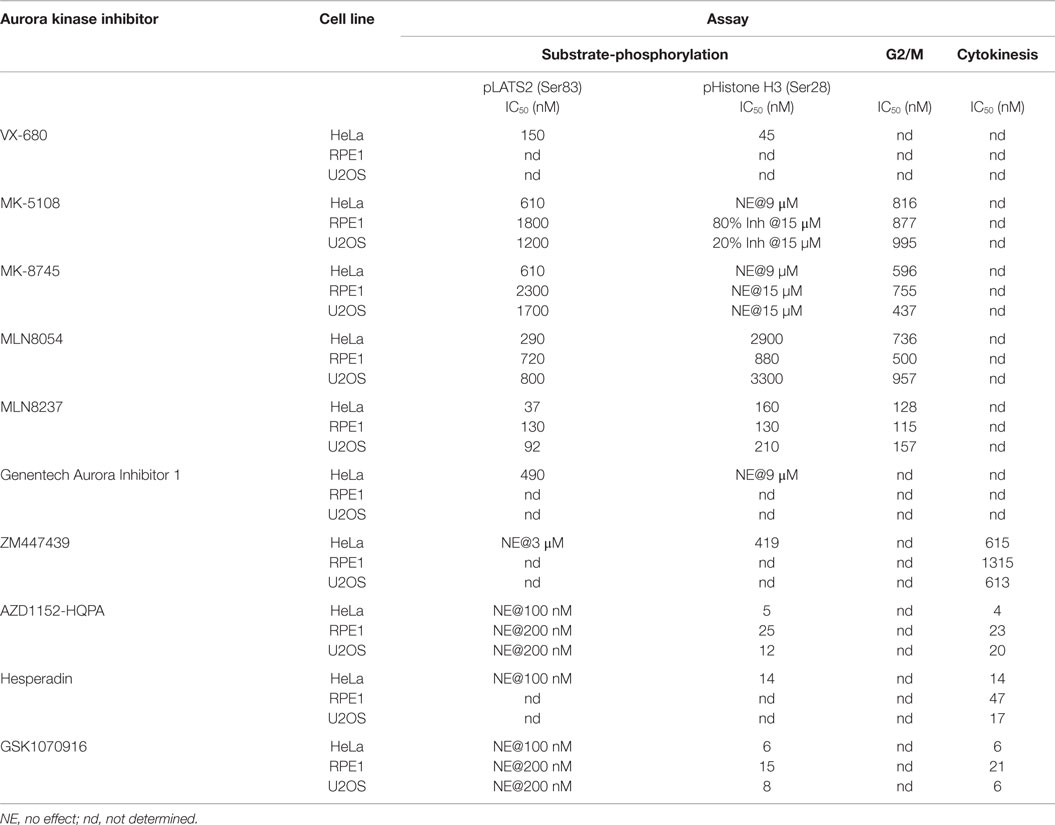
Table 3. Cellular inhibitory potencies of the Aurora inhibitor panel.
Immunoblotting-Based Assessment of Inhibitor Potency and Specificity
Next, we sought to compare the inhibitor potency and specificity measurements obtained using the cellular assays to more proximal markers of cellular activity – namely phosphorylation of Aurora A and Aurora B. We developed methods to monitor kinase phosphorylation by immunoblotting because we found it to have higher signal-to-noise and greater consistency than immunofluorescence. For this analysis, we focused on the four inhibitors with the best overall cellular profiles as Aurora A-selective (MK-5108, MK-8745) or Aurora B-selective (AZD1152-HQPA and GSK1070916). After treating cells with different concentrations of these inhibitors, we performed Western blotting for eight targets for which commercial antibodies are available – pAuroraA(Thr 288), pAuroraA(Thr 288)/pAuroraB(Thr 232)/pAuroraC(Thr 198), total Aurora A, total Aurora B, pH3(Ser 28), pH3(Ser 10), total H3, and Cyclin B. We did not assess pLATS2(Ser 83), because the antibody used for immunofluorescence did not work well for immunoblots. The specific antibodies used for immunoblotting were selected based on extensive testing, employing both siRNA depletion (to assess specificity; Figure 3A; Figure S5 in Supplementary Material) and inhibitor treatments (to confirm detection of phospho-epitopes; Figures 8A,B); see Table S3 in Supplementary Material for descriptions and supplier information.
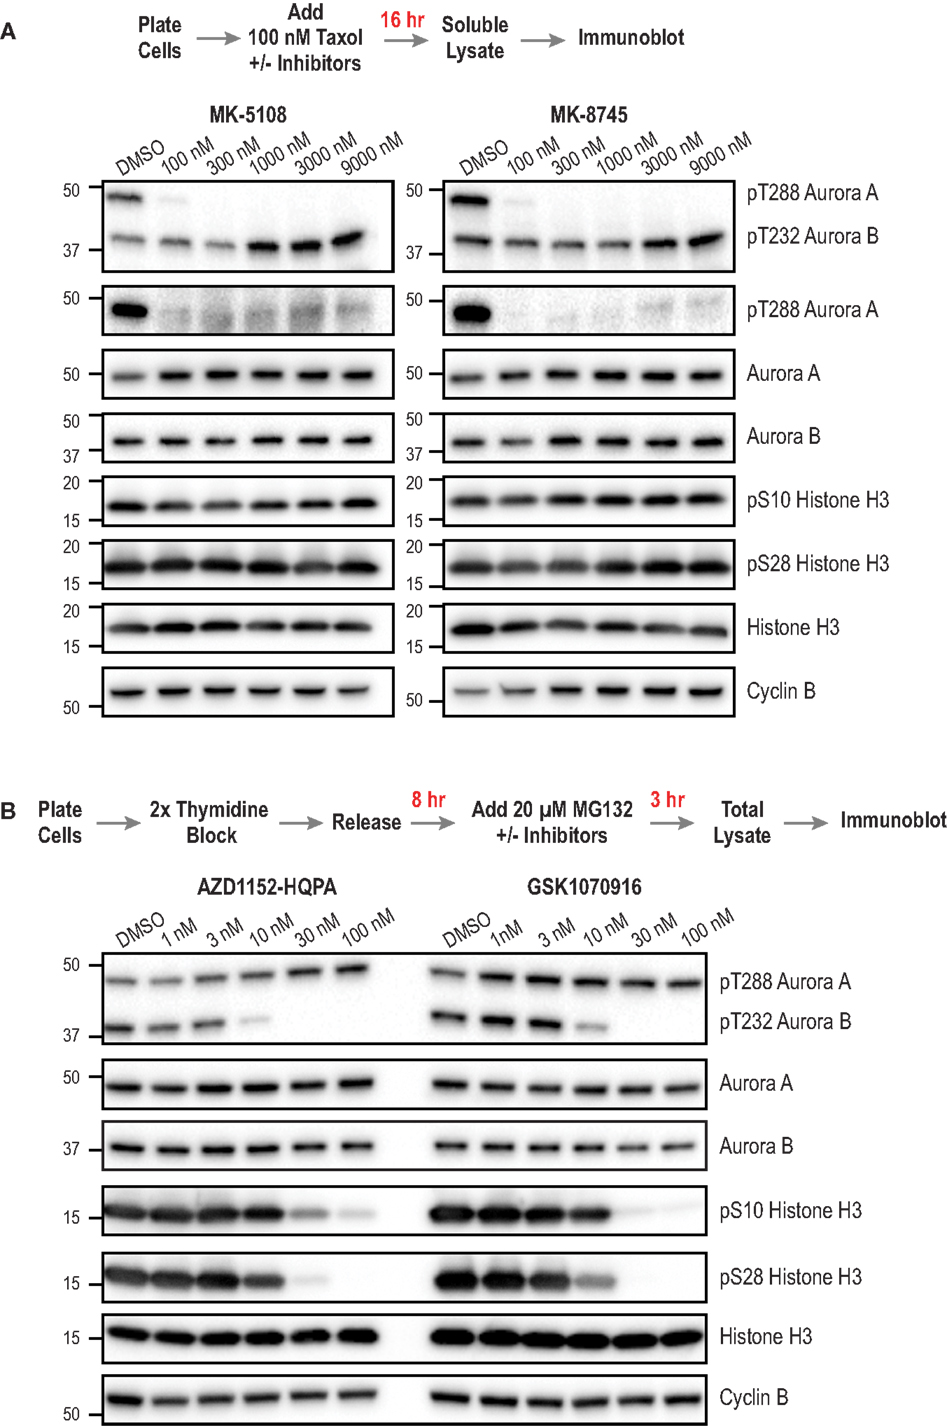
Figure 8. Immunoblotting of activation loop phosphorylation of Aurora A/B and of pH3(Ser 28) and pH3(Ser 10) in HeLa cells following inhibitor treatments. (A) Analysis of MK-5108 and MK-8745. The targets blotted are indicated on the right; MW markers (in kD) are on the left. The topmost blot is with an antibody that recognizes the phosphorylated activation loops of both Aurora A and Aurora B. The protocol used to prepare mitotic taxol-arrested lysates is summarized above the blots. (B) Analysis of AZD1152-HQPA and GSK1070916 as in (A). The only difference is the protocol used to prepare the mitotic lysate; as Aurora B inhibition overrides taxol-based mitotic arrest, a synchronization procedure followed by proteasome inhibition, schematized above the blots, was used. Blots were repeated in at least two independent experiments, which were highly consistent; blot sets from one representative experiment are shown. For (B), see Figure S6 in Supplementary Material for an independent experiment performed at a higher top dose (300 nM).
For analysis of the Aurora A-selective compounds, MK-5108 and MK-8745, we employed the protocol outlined in Figure 8A, based on taxol-induced mitotic checkpoint arrest. For analysis of Aurora B-selective inhibitors, AZD1152-HQPA and GSK1070916, we modified a previously described protocol [outlined in Figure 8B; (94)] whose design reflects the fact that Aurora B inhibition overrides taxol-induced arrest (44, 45). To ensure a fair comparison between different conditions, we immunoblotted Cyclin B to confirm that a similar number of mitotic cells were present in the analyzed lysates, in addition to blotting for total H3 as a general loading control. While optimizing the immuoblotting assays, we found that pAuroraA(Thr 288) exhibited low solubility compared to total Aurora A, pAuroraB(Thr 232), or total Aurora B in a typical cell lysis buffer containing non-ionic detergent; only with extensive sonication were we able to solubilize the pAuroraA(Thr 288) signal. This observation suggests that autophosphorylated Aurora A is associated with insoluble cytoskeletal elements, possibly microtubules or centrosomes. From a technical perspective, this observation highlights the importance of employing lysate preparation conditions that properly solubilize pAuroraA(Thr 288) in order to avoid false negative results and/or overestimates of inhibitor potencies. In situations where changes in cell number/viability are not expected (obviating the need to normalize loading by measuring lysate protein concentrations), samples could be prepared by lysing cells directly with SDS gel sample buffer.
The immunoblotting analysis of autophosphorylated Aurora A, pH3(Ser 28), and pH3(Ser 10), confirmed the specificity of MK-5108 and MK-8745 for Aurora A and AZD1152-HQPA and GSK1070916 for Aurora B. At concentrations of MK-5108 and MK-8745 that completely eliminate Thr 288 phosphorylation (and pLATS2(Ser 83) signal in the fixed immunofluorescence assay), there is no effect on pH3(Ser 10), pH3(Ser 28), or pAuroraB(Thr 232) (Figure 8A). Reciprocally, AZD1152-HQPA and GSK1070916 eliminated pH3(Ser 10), pH3(Ser 28), and pAuroraB(Thr 232) at concentrations that did not affect pAuroraA(Thr 288) (Figure 8B).
For AZD1152-HQPA and GSK1070916, there was strong correspondence between the concentration-dependent effects on H3 and Aurora B phosphorylation with those observed in the immunofluorescence and cytokinesis assays (Figures 4A and 8B; Figure S3 in Supplementary Material; Table 3). However, for MK-5108 and MK-8745, complete loss of Aurora A Thr 288 phosphorylation was observed at significantly lower inhibitor concentrations than those necessary for full efficacy in the LATS2 phosphorylation and G2 duration assays [(IC50 pAuroraA(Thr 288) <<100 nM versus IC50 pLATS2 (Ser 83) and G2 duration: ~ 600-800 nM)] (Figures 4A, 7 and 8A; Table 3). There are three potential explanations for this difference. First, the immunoblotting of activation loop phosphorylation, at least for Aurora A under the conditions employed here, may have a significantly lower dynamic range than the two cell-based assays. Second, the phosphatases that remove pAuroraA(Thr288) (27, 95, 96) may be more efficient than those that reverse pLATS2(Ser 83) and the Aurora A phosphorylation target(s) that contribute to G2 duration control. Third, this difference may arise from cellular Aurora A existing in multiple active but biochemically distinct forms, as proposed previously (28, 32). Recent biochemical data indicate that Thr 288 phosphorylation is not a prerequisite for Aurora A kinase activity if Aurora A is bound to TPX2 (28, 32). Further, our in vitro studies indicate that Aurora A/TPX2 is more difficult to inhibit than the free enzyme. Therefore, if LATS2 phosphorylation and mitotic entry kinetics are dependent upon Thr 288 unphosphorylated but active pools of Aurora A (bound to activators), sole assessment of Thr 288 phosphorylation may provide a misleading view of inhibitor potencies. Additional studies will be required to explore these possibilities.
Regardless of the underlying reasons, our data highlight that if a pAuroraA(Thr 288) immunoblot was employed with pH3 immunofluorescence/immunoblots to characterize inhibitor effects, one would conclude that MK-5108 and MK-8745 completely block cellular Aurora A activity at much lower concentrations than we measure for the pLATS2(Ser 83) immunofluorescence and live cell G2 duration assays, and that MK-5108 and MK-8745 have significantly greater selectivity in a cellular context than is actually the case. Thus, we caution on relying exclusively on immunoblotting, especially with activation loop phosphorylation antibodies for Aurora A, to measure inhibitor potency and specificity. Instead, we recommend performing quantitative fixed or live imaging-based analysis of kinase activity, and complementing with immunoblotting.
Synthesis of Biochemical and Cellular Profiling Data to Identify the Best Aurora A- and B-Selective Inhibitors
Differences in ATP concentrations (biochemical – micromolar; cellular milieu – millimolar) as well as compound solubility/stability, binding to serum proteins in media, and cellular penetration make direct correlation of biochemical and cellular inhibitor potencies difficult (97). However, the Aurora A/B selectivity ratios derived from our in vitro and in vivo data can be compared to prioritize inhibitors. In the biochemical assays, AZD1152-HQPA, ZM447439, Hesperadin, and GSK1070916 all exhibit >30-fold selectivity for Aurora B/INCENP783–918 over Aurora A and Aurora A/TPX21–43 (Table 2). This selectivity is recapitulated in the cellular analysis. Complete inhibition of Aurora B(Thr 232) and H3(Ser 28) phosphorylation (as well as blockade of cytokinesis) can be achieved with each of these compounds in the absence of any effect on Aurora A(Thr 288) or LATS2(Ser 83) phosphorylation (Table 3). So, which of these compounds is the best for cell biology experiments? Hesperadin is potent and specific but appears to be unstable under long-term live imaging conditions (see legend of Figure S3 in Supplementary Material). Within the quinazoline class of compounds (Figure 1), AZD1152-HQPA is preferable as it is approximately two orders of magnitude more potent in vitro and in vivo than ZM447439, from which it was derived. How then do AZD1152-HQPA and GSK1070916 compare? Although both are selective, AZD1152-HQPA exhibits significantly greater preference for Aurora B/INCENP783–918 when compared to either Aurora A or Aurora A/TPX21–43in vitro (Table 2). Consistent with this, immunoblotting revealed that, while both compounds eliminated Aurora B activity at <100 nM without affecting pAuroraA (Thr 288) (Figure 8), at 300 nM GSK1070916 inhibited Aurora A activity whereas AZD1152-HQPA did not (Figure S6 in Supplementary Material). In addition, when profiled against 363 human kinases (including Aurora A/B/C) at 100 nM concentration (Table S4 in Supplementary Material), both compounds exhibited high Aurora kinase-specificity but AZD1152-HQPA was slightly superior. Aurora B was the only enzyme inhibited ≥65% of control by AZD1152-HQPA whereas Aurora A and B as well as DDR1 are inhibited by GSK1070916 at or above this threshold (Table S4 in Supplementary Material). Therefore, we believe that AZD1152-HQPA is the current best choice for an Aurora B-selective inhibitor, and recommend use of GSK1070916 for confirmatory follow-up studies (see below).
In terms of the Aurora A inhibitors, MLN8054 and MLN8237 exhibit only modest selectivity in vitro and in vivo (Tables 2 and 3). Genentech Aurora Inhibitor I is cytotoxic within the range of concentrations required for full inhibition of Aurora A activity (Figure 4D). In the fixed and live imaging cell-based assays, the two Merck compounds were similar with MK-5108 being slightly more potent (Table 3) and MK-8745 being more selective in both RPE1 and U2OS cells (Figure 5; Table 3). By kinome profiling analysis, MK-8745 was significantly more Aurora kinase-specific. At 100 and 500 nM, MK-5108 inhibited 32 and 75 kinases (including the Aurora kinases), respectively, at >65% of control; Polo-like kinase 4 was the only cell cycle-related kinase affected (Table S4 in Supplementary Material). In contrast, MK-8745 at 500 nM only inhibited 16 kinases at >65% of control (Aurora A, AXL, BRK, DDR1, EphA6, GSK3α/β, IRAK1, JNK1, LKB1, ROS1, Trk A/B/C, TYRO3, YES). Thus, based on its Aurora and off-target selectivity, we believe that MK-8745 is the current best commercially available Aurora A-selective inhibitor for cellular studies.
The Structure of the Aurora A Kinase Domain Bound to MK-5108 Reveals Features Underlying Potency and Specificity
To gain insight into the remarkable biochemical potency and Aurora A-selective nature of the MK-8745/MK-5108 class of compounds, we determined the 2.2 Å X-ray crystal structure of the human Aurora A kinase domain bound to MK-5108 (Figure 9A; Table S5 and Figure S7 in Supplementary Material). In the inhibitor complex, the Aurora A kinase domain adopts an inactive conformation in which both the αC helix (orange; Figure 9A) and particularly the activation loop (yellow; Figure 9A) are improperly positioned for catalysis (Figure 9B – compare MK-5108-bound versus ADP-bound structures). Electron density maps indicate that both Thr 287 (which adopts two alternate conformations; only one is illustrated) and Thr 288 are phosphorylated, showing that the inhibitor is able to interact with the activated form of the enzyme (Figure 9A). Consistent with its action as an ATP-competitive inhibitor (56), MK-5108 inserts itself into the nucleotide-binding pocket between the two lobes of the kinase in the same orientation as its parent compound VX-680 (Figures 9A,B).
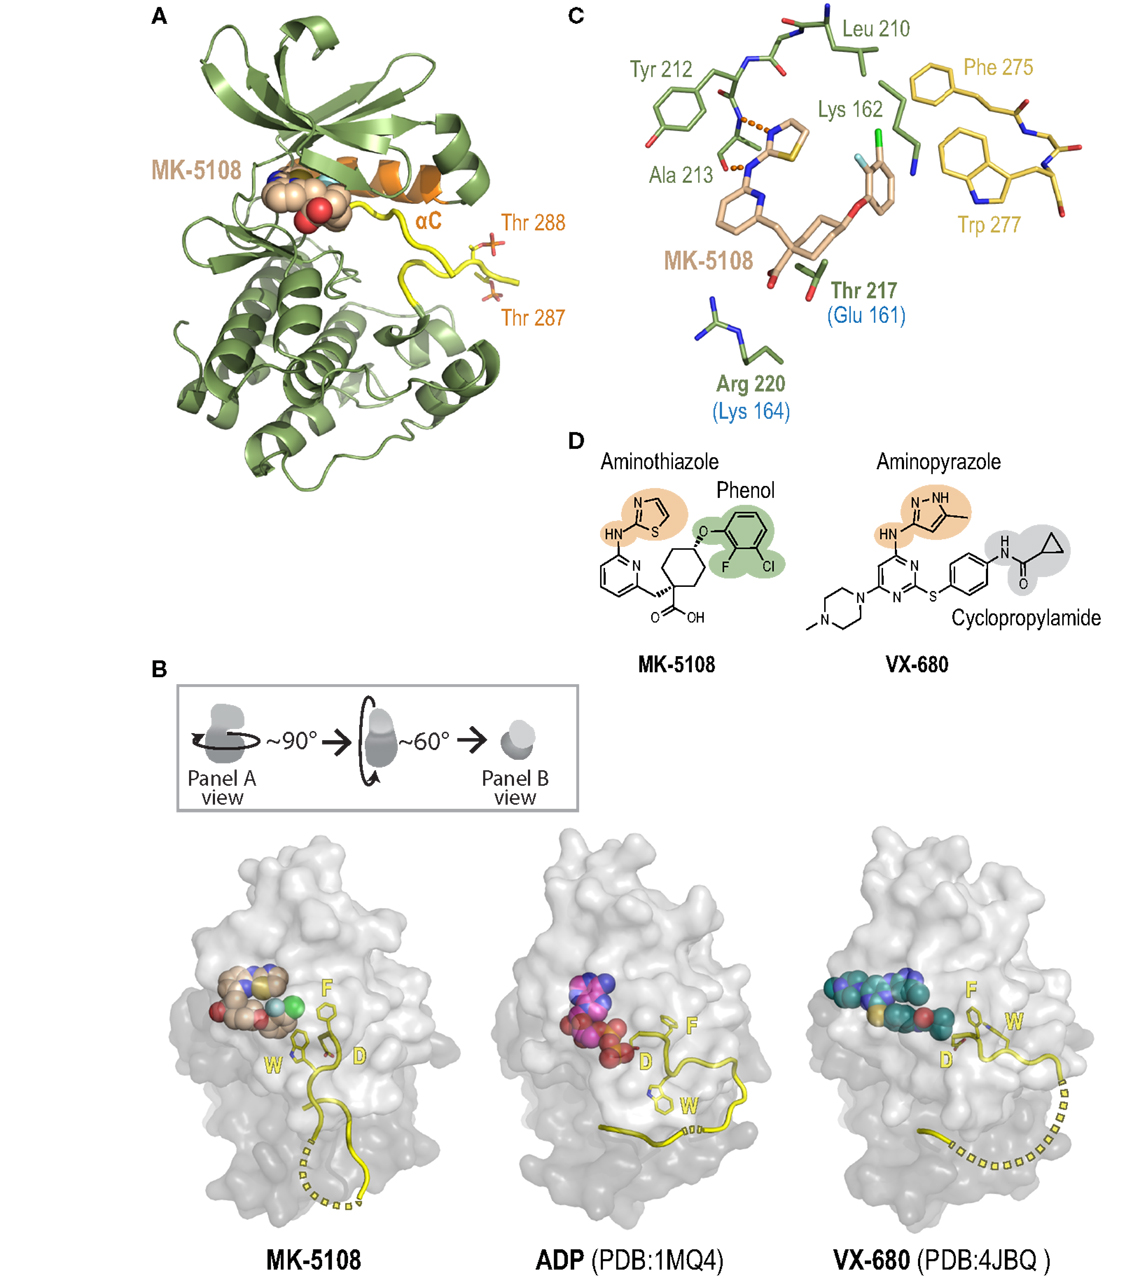
Figure 9. A crystal structure of the Aurora A/MK-5108 complex reveals unique features compared to previous Aurora A-inhibitor complex structures. (A) The complex structure with the Aurora A kinase domain depicted as a ribbon diagram and MK-5108 as a spacefilling model. The majority of the kinase domain is colored green except for the activation loop, which is colored yellow, and the αC helix, which is colored orange. The phosphate groups on Thr 288 and Thr 287 are highlighted. (B) Comparison of Aurora A/MK-5108 structure to previously determined ADP-bound (PDB:1MQ4) and VX-680-bound (PDB: 4JBQ) structures. The orientation of the kinase domains relative to that in (A) is described in the inset. For all three structures, beyond the activation loop (yellow cartoon – dashed lines indicate disordered regions) only the protein surface is shown (light gray – N-terminal lobe, dark gray – C-terminal lobe). Asp 274 (D) and Phe 275 (F) of the DFG motif, as well as Trp 277 (W) are depicted. (C) Detailed view of the key contacts between MK-5108 and Aurora A residues. Hydrogen bonds between the aminothiazole of MK-5108 and Ala 213 are shown as orange dashes. MK-5108 interacts with the side chains of two residues which are different between Aurora A and B (Aurora A: Thr 217 and Arg 220; Aurora B: Glu 161 and Lys 164; the Aurora B residues are indicated in blue text below the corresponding Aurora A ones in the figure). See also Table S6 in Supplementary Material. For clarity, the main chain atoms of Lys 162, Thr 217 and Arg 220 as well as the side chain atoms of Glu 211 are not shown. (D) The chemical structures of MK-5108 and VX-680 with specific moieties highlighted.
The picomolar affinity of MK-5108 for Aurora A is explained by the extensive polar and van der Waals interactions it forms with 22 residues throughout the active site (Figure 9C, Table S6 in Supplementary Material). The aminothiazole moiety (Figures 9C,D) is located adjacent to the gatekeeper residue Leu 210 enabling it to form two hydrogen bonds with the main chain amide nitrogen and carbonyl of Ala 213 within the hinge region (Figure 9C), thereby making it functionally analogous to the aminopyrazole moiety of VX-680 (Figure 9D). The 2-fluoro, 3-chlorophenol on the opposite end of the inhibitor (Figure 9D) packs against the side chains of the catalytic lysine (Lys 162), precluding its active conformation, as well as against Phe 275 of the DFG motif (Figure 9C). This interaction stabilizes a flipped, inactive conformation of the DFG motif that is intermediate between the active “DFG-in” state (Figure 9B – ADP-bound) (98) and the canonical “DFG-out” conformation (99). This conformation is distinct from the distorted conformation in the VX-680 Aurora A complex (Figure 9B – VX-680-bound) (74), and the “DFG-up” conformation linked to MLN8054 binding (59, 71, 75), and resembles that of Aurora A bound to adenosine (PDB: 1MUO) (100). Importantly, the 2-fluoro, 3-chlorophenol moiety of MK-5108 forms a likely highly energetically favorable edge-face aromatic pi stacking interaction with the indole of Trp 277 (Figures 9C,D). Because of the major differences in its chemical structure in this region (Figure 9D), VX-680 only forms hydrophobic contacts with Phe 275 (via its cyclopropylamide) and not Trp 277 (Figure 9B). The interaction between MK-5108 and the side chain of Trp 277 has the effect of “pinning down” the activation loop at its N-terminal end and disfavors its adoption of an active conformation (Figure 9B). We note that the phosphates on Thr 287 and Thr 288 form hydrogen bonds with the side chains of His 187 and Lys 250, respectively, from a symmetry-related molecule. However, since residues 281–285 are disordered (Figure 9B), we believe that residues 277–280 should not be constrained by these contacts, and that their positioning is a consequence of inhibitor binding. The inactive conformation of the activation loop that we describe here is, to our knowledge, unique among all known human Aurora A kinase domain – inhibitor complex structures. The conformations of the active site and activation loop residues stabilized by MK-5108 binding are distinct from those favored by TPX2 binding, which likely explains the reduced affinity of MK-5108 for the Aurora A/TPX21–43 complex.
The crystal structure of the MK-5108/Aurora A complex also suggests a potential explanation for the selectivity of this inhibitor. MK-5108 interacts with the side chains of two (Thr 217 and Arg 220) of the four residues in the vicinity of the active site that differ between Aurora A and B (Aurora A: Ala 141, Leu 215, Thr 217 and Arg 220; Aurora B: Lys 85, Arg 159, Glu 161, Lys 164) (Figure 9C; Table S6 in Supplementary Material). Although the electron density for Aurora A Arg 220 is weak (indicative of mobility), the positively charged guanidinium of this residue is located close enough to the negatively charged MK-5108 carboxylate to form favorable electrostatic interactions (Figures 9C,D). However, the equivalent Aurora B residue is a lysine (Lys 164), which should also be able to form the same types of interactions. In contrast, the side chain of Thr 217 is wedged in between the carboxylate and the cyclohexyl ring of MK-5108 (Figures 9C,D). This tight fit would not be possible with the equivalent Glu 161 in Aurora B, likely significantly reducing binding affinity. Integrated mutagenesis, biochemical and structural studies of MLN8054 and Genentech Aurora A Inhibitor I (which both pack against Thr 217) have indicated that Thr 217 contributes heavily to the selectivity of these compounds (59, 71, 75). Equivalent efforts with MK-5108 and MK-8745 (which, by modeling, is predicted to bind in a highly similar manner as MK-5108 to the Aurora A active site) will be necessary to test if Thr 217 is the central determinant of Aurora A/B selectivity for these compounds, as suggested by our structural analysis.
Discussion
The current tool chest of Aurora inhibitors is the product of extensive chemical optimization in the pursuit of suitable clinical candidates, rather than optimal inhibitors for cell biology studies. As a consequence, careful comparison of these inhibitors in parallel biochemical and cell-based assays has been lacking. The systematic profiling data presented here should provide a resource for future studies employing these compounds. Based on our results, we provide the following ‘good practice’ guidelines with respect to their use:
(1) pH3(Ser 28) and pLATS2(Ser 83) labeling, which we validate as specific cellular readouts for Aurora B and A, respectively, provides a convenient and robust means to characterize existing and newly developed Aurora kinase inhibitors, and should be used prior to any detailed functional analysis conducted with this class of compounds. Inhibitor sensitivity can be modulated by biological factors (such as kinase expression levels) or technical factors (such as changes in serum/media and growth conditions) (97). Hence, dose–response analysis employing the pH3(Ser 28)/pLATS2(Ser 83) labeling assay is particularly important when extending inhibitor use to new cell lines not analyzed here. While we present a large dataset for HeLa, RPE1, and U2OS cells that should serve as a benchmark for future studies, we still recommend performing a dose–response even when using these three lines given inter-lab variability. The goal of such preliminary analysis should be to identify the minimum concentration that achieves complete inhibition of the relevant marker without affecting the other. We strongly advise against the “more is better” urge as unnecessarily high doses will likely lead to loss of specificity and potential unanticipated off-target effects.
(2) AZD1152-HQPA is a highly potent, selective, and efficacious Aurora B inhibitor and the best current choice for targeting this kinase. While AZD1152-HQPA does not exhibit any obvious effects against any of the other kinases that we tested, this profiling exercise was not exhaustive. Further, there is relatively little published about binding of this compound to non-kinase proteins, and even very well-characterized molecules can have unexpected off-target effects. For example, recent studies have revealed that the commonly used Plk1 inhibitor, BI-2536, and several other known kinase inhibitors, are potent inhibitors of BET bromodomain proteins (101–103). Therefore, we highly recommend that any results from studies using AZD1152-HQPA be corroborated with GSK10701916, which likely has a different off-target profile based on its unrelated chemical structure. Indeed, this strategy of using structurally distinct compounds with common mechanisms should be applied when using any of the inhibitors analyzed here and when performing chemical cell biology studies in general.
(3) MK-8745 represents the best current commercially available option for selective and potent Aurora A inhibition. We note, however, that the lowest concentration of MK-8745 that is necessary to maximally inhibit Aurora A in cells is >100-fold higher than the lowest concentration of AZD1152-HQPA that is necessary to fully inhibit Aurora B. Hence, based on current chemical biology standards [on-target cellular activity <1 μM; (104, 105)], AZD1152-HQPA is an ideal chemical tool whereas MK-8745 is not. In addition, validation of any findings with MK-8745 with an orthogonal chemical scaffold is not currently straightforward. If only partial inhibition of Aurora A is required, MLN8054 (and possibly MLN8237) could be used but only under carefully controlled circumstances. Alternatively, MK-5108 could be used but this is also not optimal given its chemical similarity to MK-8745. In the recent literature, at least five classes of compounds with Aurora A-selective behavior (which are not commercially available or only became available near the end of this study) have been reported (106–110). Assessment of these inhibitors should reveal if one or more of them can be paired with MK-8745 for analysis of Aurora A function in cellular experiments.
(4) Immunoblotting of activation loop phosphorylation should not be used in isolation to estimate inhibitor potency and specificity. As we show here, immunoblotting with pAuroraA(Thr 288) antibodies suggests significantly higher Aurora A inhibitor potency than is observed in validated fixed and live imaging-based cellular assays. Consequently, if only immunoblotting were performed, one could overestimate not just potency but also selectivity for Aurora A versus Aurora B. We recommend that the fixed or live imaging-based cellular assays described here be employed first, with immunoblotting serving as confirmation. The imaging-based cellular assays also have the advantage of revealing potential off-target effects, such as the toxicity of the Genentech Aurora Inhibitor 1 reported here.
Our analysis highlights that, while highly selective and potent tools for Aurora B inhibition are readily available, there is significant room for improved small molecule inhibitors of Aurora A. Part of the challenge in targeting Aurora A likely arises from its multiple activation mechanisms, which makes uniformly inhibiting the different active states of the kinase difficult. A second limitation is the prior lack of a consistent and rigorous assay paradigm for Aurora A activity in a cellular context – as we show here, immunoblotting of activation loop phosphorylation can be misleading when compared to other kinase activity readouts – a fact that can be rationalized by recent findings that activation loop phosphorylation is not essential for high levels of kinase activity in the presence of an activator such as TPX2. Our findings suggest new avenues to help address the challenge of developing a more potent and highly selective Aurora A inhibitor. First, the pLATS2(Ser 83) and the G2 duration assays provide independent, robust, and dose-responsive cellular readouts that specifically report on Aurora A but not Aurora B activity. These assays could be used for optimization of novel classes of Aurora A inhibitors in a cell-based context, analogous to the strategy we employed recently to develop a Plk4 inhibitor, centrinone, that prevents centriole duplication (92). The target specificity of centrinone was confirmed through the extensive use of an engineered inhibitor-resistant mutant. Analogous approaches could also be applied using previously described inhibitor-resistant Aurora kinase mutants (75, 111, 112). Further, the crystal structure of the MK-5108/Aurora A kinase domain complex we determined, which revealed a previously unobserved protein conformation and active site interactions, could be used to generate more potent versions of MK-5108/MK-8745 and potentially design new molecules as well. Given the renewed interest in Aurora A as a drug target based on the recently discovered role of Aurora A in controlling c-Myc protein levels in cancers such as neuroblastoma (113, 114), new inhibitor discovery efforts leveraging the approaches described here could aid not only in developing better tools for cell biology experiments but also in fully realizing the therapeutic potential of inhibiting Aurora A.
Materials and Methods
Inhibitors and Antibodies
Inhibitors and antibodies used in this study are described in Table S1 and S3 in Supplementary Material, respectively.
Kinase Assays
For the Aurora A assays, purified full-length human Aurora A (Millipore) was diluted to ~0.8 nM (based on enzyme activity) in 7.5 μL of a buffer containing 50 mM Tris (pH 7.5), 150 mM NaCl, 270 mM sucrose, 0.03% Brij 35, and 1 mM DTT in Corning #4512 white 384-well plates. Inhibitors arrayed in dose–response were added from DMSO stocks using a V&P 384-pintool head mounted on a Beckman Multimek chassis. Reactions were then initiated via the addition of 7.5 μL of a buffer containing 50 mM Tris (pH 7.5), 20 mM MgCl2, 1 mM DTT, 0.2 mg/ml BSA, 70 μM ATP, and 800 μM Kemptide (amino acid sequence: LRRASLG (InnoPep)) using a NSX-384 384-channel liquid handler (Nanoscreen), and allowed to proceed for 2 h at 25°C. The final reaction buffer contained 50 mM Tris (pH 7.5), 10 mM MgCl2, 75 mM NaCl, 135 mM sucrose, 0.015% Brij 35, 1 mM DTT, 0.1 mg/mL BSA, 35 μM ATP, and 400 μM Kemptide. The final [ATP] in the reaction mix (35 μM) is at the Km(ATP) for Aurora A. Detection using a 5 μL aliquot of each reaction was performed with ADP-Glo™ reagents (Promega), following the manufacturer’s instructions, in PerkinElmer #6008281 plates. Luminescence was measured on an Infinite M1000 plate reader (Tecan). Data were fit using a 4-parameter, variable slope fit in Prism (GraphPad), and Kis were calculated from IC50 data using the equation in Figure 2B.
For the Aurora A/TPX21–43 assays, purified full-length human Aurora A (Millipore) was diluted to ~0.8 nM (based on enzyme activity) in 7.5 μL of a buffer containing 80 nM TPX21–43 (InnoPep), 50 mM Tris (pH 7.5), 150 mM NaCl, 270 mM sucrose, 0.03% Brij 35, and 1 mM DTT in Corning #4512 white 384-well plates. The TPX21–43 concentration was determined using a calculated molar extinction coefficient (280 nm) of 8480 M−1 cm−1. Inhibitors arrayed in dose–response were added from DMSO stocks using a V&P 384-pintool head mounted on a Beckman Multimek chassis. Reactions were then initiated via the addition of 7.5 μL of a buffer containing 50 mM Tris (pH 7.5), 20 mM MgCl2, 1 mM DTT, 0.2 mg/ml BSA, 6 μM ATP, and 1,200 μM Kemptide using a NSX-384 384-channel liquid handler (Nanoscreen), and allowed to proceed for 1 h at 25°C. The final reaction buffer contained 50 mM Tris (pH 7.5), 10 mM MgCl2, 75 mM NaCl, 135 mM sucrose, 0.015% Brij 35, 1 mM DTT, 0.1 mg/mL BSA, 3 μM ATP, and 600 μM Kemptide. The final [ATP] in the reaction mix (3 μM) is at the Km(ATP) for Aurora A/TPX21–43. At the final concentration of 40 nM, TPX21–43 is >10 times the concentration required to achieve half-maximal activation of Aurora A under these reaction conditions (3 nM) and the previously reported Kd of TPX21–43 [2.3 nM (70)]. Detection, measurement, and data analysis were performed as described above.
For the Aurora B/INCENP783–918 assays, purified full-length human Aurora B/INCENP783–918 (SignalChem) was diluted to ~0.5 nM (based on enzymatic activity) in 12 μL of a buffer containing 31.25 mM Tris (pH 7.5), 12.5 mM MgCl2, 93.75 mM NaCl, 168.75 mM sucrose, 0.0125% Tween 20, 0.625 mM DTT, 0.1875 mg/mL BSA, and 500 μM Kemptide in Corning #3657 clear 384-well plates. Inhibitors arrayed in dose–response were added from DMSO stocks using a V&P 384-pintool head mounted on a Beckman Multimek chassis. After 15 min at 25°C, reactions were initiated via the addition of 3 μL of 50 μM ATP using a NSX-384 384-channel liquid handler (Nanoscreen), and allowed to proceed for 1 h at 25°C. The final reaction buffer contained 25 mM Tris (pH 7.5), 10 mM MgCl2, 75 mM NaCl, 135 mM sucrose, 0.01% Tween 20, 0.5 mM DTT, 0.15 mg/mL BSA, 10 μM ATP, 400 μM Kemptide. The final [ATP] in the reaction mix (10 μM) is at the Km(ATP) for Aurora B/INCENP783–918. Detection, measurement and data analysis were performed as described above.
Radiometric assay-based kinome profiling of AZD1152-HQPA, GSK1070916, MK-5108 and MK-8745 was performed by Reaction Biology Corporation (Malvern, PA, USA) using [ATP] ~ Km(ATP) for all enzymes.
Cell Lines
RPE1 (hTERT-immortalized RPE cells) and U2OS osteosarcoma cells were obtained from ATCC. HeLa cervical carcinoma cells were from a laboratory stock. RPE1 cells were maintained in Dulbecco’s modified Eagle’s medium (DMEM)/F12 plus glutamine medium supplemented with 10% fetal bovine serum, 100 U/mL penicillin and 100 μg/mL streptomycin. U2OS and HeLa cells were maintained in DMEM + Glutamax supplemented with 10% fetal bovine serum, 100 U/mL penicillin and 100 μg/mL streptomycin.
For generation of HeLa, U2OS, and RPE1 lines co-expressing H2B-RFP and either GFP-PCNA or YFP-tubulin, cells were infected first with an H2B-RFP expressing retrovirus. A pBABE-puro vector, encoding human histone H2B with mRFP1.3 fused at its C-terminus (H2B-RFP) obtained from the laboratory of Don Cleveland, and pBSK-VSV-G were co-transfected into the packaging cell line GP2-293 (Clontech) using FuGENE HD (Promega). Virus-containing culture supernatant was collected 48 h after transfection and added to the growth medium of cells, followed by addition of Polybrene (Millipore) to 8 μg/ml.
An MGC collection human PCNA cDNA with eGFP fused at its N-terminus (GFP-PCNA) was cloned into pBABE-hygro. A pBABE-bla (blasticidin) vector encoding human alpha 1B tubulin with eYFP fused to its N-terminus (YFP-tubulin) was obtained from the laboratory of Don Cleveland. Virus production and infection of cells previously transduced with H2B-RFP was performed similarly. FACS was used to select cell populations expressing transgenes at moderate levels.
RNAi
HeLa cells co-expressing GFP-PCNA and H2B-RFP were used for all imaging-based RNAi experiments. ON-TARGETplus SMARTpool siRNAs (GE Healthcare) targeting Aurora A and Aurora B, as well as a non-targeting control pool, were transfected into cells using Lipofectamine RNAiMAX (Thermo Fisher Scientific) at a final concentration of 50 μM in 6-well plates. Five hours after transfection, cells were trypsinized and seeded into a 96-well cycloolefin plate (Greiner) at 10,000 cells/well in fresh medium supplemented with 2.5 mM thymidine. Cells were incubated in the presence of thymidine for 18–20 h, and then 300 ng/mL nocodazole for 6 h. Knockdown was confirmed by immunoblotting with the Aurora kinase antibodies specified in Table S3 in Supplementary Material and an anti-tubulin antibody (DM1A; 1:1000; Sigma).
For fixed analysis to quantify pLATS2(Ser 83), pH3(Ser 10), and pH3(Ser 28) intensities, plates were washed twice with fresh medium and returned to the incubator for 8 h. Cells were then fixed with either 4% PFA = paraformaldehyde (in phosphate-buffered saline, PBS) (for pH3 analysis) or 100% ice-cold methanol (for pLATS2 analysis). The following primary antibodies were used: pLATS2(Ser 83) (see Table S3 in Supplementary Material); pH3(Ser 10) (1:100; Cell Signaling); pH3(Ser 28) (see Table S3 in Supplementary Material). Cells were imaged on the CV7000 spinning disk confocal system (Yokogawa Electric Corporation) using a 40 × 0.95 NA U-PlanApo objective and 2560 × 2160 sCMOS camera with 2 × 2 binning. 5 μm × 2 μm z-sections of 50 fields/well were imaged, with replicate wells per RNAi condition.
For quantification, maximum intensity projections were generated by the CV7000 acquisition software and transferred to ImageJ for analysis. For pLATS2(Ser 83) measurements, the integrated signal from a 10 × 10 pixel box centered on each mitotic spindle pole was measured. For background subtraction, a 10 × 10 pixel box in the cytoplasm was used. Mean values of measurements were normalized to the control RNAi condition. A total of 186–230 measurements from two independent experiments were made. For pH3(Ser 10) and pH3(Ser 28), the DNA signal was used to threshold and define a binary mask, which was transferred to the pH3 channel. The mean intensity of this region was then measured in the pH3 channel. For background subtraction, the masked region was expanded by 20 pixels, and the mean intensity of the peripheral region was used. Mean values of measurements were normalized to the DMSO-treated condition. A total of 88–147 measurements from three independent experiments were made.
For live imaging experiments to measure G2 duration, plates were washed twice with fresh medium, and immediately mounted onto the CV1000 spinning disk confocal system (Yokogawa Electric Corporation). The imaging chamber was maintained at 37°C and 5% CO2. Cells were imaged using a 20 × 0.75 NA U-PlanApo objective and 512 × 512 EM-CCD camera with 2 × 2 binning. Twelve fields/well were imaged, with 4 replicate wells per RNAi condition. 3 μm × 2 μm z-sections in the GFP (25% power, 200 ms, 35% gain) and RFP (20% power, 200 ms, 35% gain) channels were captured in each field, at 12-min intervals for 24 h. Quantification was performed as described in the G2 duration assay section (see below).
Cellular Proliferation Analysis
Eight thousand HeLa cells, 8,000 U2OS cells or 4,000 RPE1 cells were seeded into white 96-well assay plates (Corning #3610) 16 h before inhibitor addition. All inhibitors were diluted in DMSO and added to cells in complete growth media (2× desired concentrations were prepared in complete growth medium and added to wells). After 24 h, relative cell number was measured using ATPLite™ reagent (PerkinElmer) following the manufacturer’s instructions. DMSO-treated cells were used as controls. Two independent experiments with triplicate measurements per condition were performed. Luminescence was measured on an Infinite M1000 plate reader (Tecan).
Live Cell-Activated Caspase 3/7 Assay
HeLa cells (6,000/well) were seeded in 96-well μCLEAR plates (Greiner) in 100 μL DMEM plus serum, and incubated for 16 h at 37°C and 5% CO2. MK-5108 and Genentech Aurora Inhibitor 1 were diluted 1:100 from DMSO stocks into serum-free DMEM and 11 μL of the diluted compound was added to cells. After 24 h 2 μM CellEvent Caspase-3/7 Green Reagent (Life Technologies), and NucBlue Live ReadyProbes Reagent (Hoechst 33342; Life Technologies) were added. Cells were imaged after 60 min on a CV7000 spinning disk confocal system (Yokogawa Electric Corporation) with a 20 × 0.75 NA U-PlanApo objective and 2560 × 2160 sCMOS camera with 2 × 2 binning. The imaging chamber was maintained at 37°C and 5% CO2. Six to eight fields/well were imaged, with duplicate wells for each condition. 3 μm × 2 μm z-sections in the blue (40% power, 300 ms, 35% gain) and green (40% power, 300 ms, 35% gain) channels were captured in each field. The apoptotic fraction was calculated by dividing the number of cells fluorescing at 530 nm (corresponding to the cleaved caspase reporter reagent) by the number of nuclei (Hoechst staining). Image analysis was done using the CV7000 image analysis software (Yokogawa Electric Corporation).
Substrate Phosphorylation Assay
Twelve thousand HeLa cells, 10,000 U2OS cells, or 8,000 RPE1 cells were seeded into 96-well glass-bottom Sensoplates (Greiner) 16 h before inhibitor addition. Prior to seeding, the glass-bottom plates were coated with poly-l-lysine (Sigma). All inhibitors were diluted in DMSO and added to cells in complete growth media (2× desired concentrations were prepared in complete growth medium and added to wells). After 8 h cells were fixed with 4% PFA for 20 min at room temperature. The fixed cells were washed with PBS. For immunostaining, cells were permeabilized and blocked with PBS containing 10% normal donkey serum (Jackson ImmunoResearch) and 0.1% Triton-X100 for 1 h at room temperature. Primary antibodies against phospho-LATS2 (Ser 83), phospho-histone H3(Ser 28), and anti-phospho-MPM2 (see Table S3 in Supplementary Material) were incubated for 1 h at room temperature. Cells were stained with Cy3-conjugated goat anti-rat, Alexa Fluor 488-conjugated goat anti-mouse IgG2b, and Alexa Fluor 647-conjugated goat anti-mouse IgG1 secondary antibodies (see Table S3 in Supplementary Material) and Hoechst 33342 for 1 h at room temperature. Cells were then washed twice with PBS containing 0.1% Triton-X100. Image acquisition in four channels was performed using a CV7000 spinning disk confocal system (Yokogawa Electric Corporation) with a 40 × 0.95 NA U-PlanApo objective and 2560 × 2160 pixel sCMOS camera. Fluorophores (Hoechst 33342, Alexa Fluor 488, Cy3 and Alexa Fluor 647) were excited with 50% laser power for 300 ms and maximum projections of 8–14 μm × 1 μm z-sections were recorded. Fifty fields per well were imaged with quadruplicate wells for each condition. Image analysis was done using the CV7000 image analysis software (Yokogawa Electric Corporation). Between 100 and 1,000 mitotic cells per condition were segmented applying object identification parameters to select for bright MPM2 labeling. Using a nuclear identifier protocol, minimum intensity thresholds were set for pLATS2(Ser 83) and the pH3(Ser 28) signals, and the resulting identified objects were eroded, dilated, and filtered for size by user-defined thresholds. For only the MPM2-positive mitotic cells, the mean fluorescence intensity of the identified pLATS2(Ser 83) and pH3(Ser 28) objects was measured, and the average intensity per cell per well was calculated. The same thresholds were applied for all of the inhibitor-treated samples, which were processed, imaged, and analyzed in parallel with control DMSO-treated cells. Data were fit using a four-parameter, variable slope fit in Prism (GraphPad). Primary and secondary antibody dilutions can be found in Table S3 in Supplementary Material.
G2 Duration Assay
HeLa, U2OS, and RPE1 cells co-expressing GFP-PCNA and H2B-RFP were seeded into 96-well glass bottom Sensoplates (Greiner) at 10,000 cells/well 16 h before inhibitor addition. Prior to seeding, glass-bottom plates were coated with poly-l-lysine (Sigma). All inhibitors were diluted in DMSO and added to cells in complete growth media (2× desired concentrations were prepared in complete growth medium and added to wells). Movies were acquired on a CV1000 spinning disk confocal system (Yokogawa Electric Corporation) with a 20× U-PlanApo 0.75 NA objective and 512 × 512 EM-CCD camera with 2 × 2 binning. The humidity controlled imaging chamber was maintained at 37°C and 5% CO2. Three fields per well were imaged, with duplicate wells for each condition. 3 μm × 2 μm z-sections in the GFP (25% power, 100 ms, 20% gain) and RFP (20% power, 100 ms, 20% gain) channels were captured in each field at 12-min intervals for 24 h. Cells were manually tracked from appearance of GFP-PCNA foci to the beginning of the next mitosis (NEBD). GFP-PCNA foci appear in the nucleus during mid to late S-phase, and the first frame in which these foci are no longer visible was defined as the beginning of G2 phase. Results represent combined measurements of 40-100 cells per condition from two independent experiments. Data were fit using a 4-parameter, variable slope fit in Prism (GraphPad).
Cytokinesis Assay
HeLa, U2OS, and RPE1 cells co-expressing YFP-α-tubulin and H2B-RFP were seeded into 96-well glass-bottom Sensoplates (Greiner) at 8,000 cells/well 16 h before inhibitor addition. Prior to seeding, glass-bottom plates were coated with poly-l-lysine (Sigma). All inhibitors were diluted in DMSO and added to cells in complete growth media (2× desired concentrations were prepared in complete growth medium and added to wells). Movies were acquired on a CV1000 spinning disk confocal system (Yokogawa Electric Corporation) with a 40× U-PlanApo 0.95 NA objective and 512 × 512 EM-CCD camera. The humidity controlled imaging chamber was maintained at 37°C and 5% CO2. Eight fields per well were imaged, with duplicate wells for each condition. 5 μm × 2 μm z-sections in the YFP (25% power, 100 ms, 20% gain) and RFP (20% power, 100 ms, 20% gain) channels were captured in each field at 5-min intervals for 24 h. Cells were manually tracked from mitosis to G1, and the appearance of microtubule midbodies and mono/binucleated daughter cells were analyzed to assess cytokinesis success. Results represent combined measurements of 50-100 cells per condition from two independent experiments. Data were fit using a 4-parameter, variable slope fit in Prism (GraphPad).
Western Blot Analysis
For Aurora A inhibitors, HeLa cells were seeded into 10 cm dishes and treated with 100 nM taxol and DMSO or compounds in dose–response for 16 h. Cells were harvested at 50–80% confluence and lysed in RIPA buffer supplemented with a protease/phosphatase inhibitor cocktail (Thermo Fisher Scientific) using a Qsonica Q800R sonicator (10 min, 50% amplitude, 15 s on/15 s off). Before loading, concentrations of cleared extracts were normalized using a Bio-Rad Protein Assay (Bio-Rad). For every sample, 25–50 μg protein per lane was run on Mini-PROTEAN gels (Bio-Rad) and transferred to PVDF membranes using a TransBlot Turbo system (Bio-Rad). For primary anti-phospho-Histone H3(Ser 10), anti-phospho-Histone H3(Ser 28), anti-Aurora A, anti-Aurora B, anti-phospho-Aurora A(Thr 288)/Aurora B(Thr 232)/Aurora C(Thr 198), anti-Histone H3, anti-Cyclin B1, and anti-phospho-Aurora A (Thr 288) antibodies (see Table S3 in Supplementary Material), blocking and incubations were performed in TBS-Tween with 5% BSA or non-fat dry milk. Detection was performed using HRP-conjugated secondary antibodies (see Table S3 in Supplementary Material), with SuperSignal West Femto (Thermo Fisher Scientific) substrates. Membranes were imaged on a ChemiDoc MP system (Bio-Rad).
Aurora B inhibitor analysis was done as described above with the following adaptations: seeded HeLa cells were synchronized using a 2.5 mM double-thymidine block. Eight hours after release, cells were treated with 10 μM MG132 and DMSO or compound in dose–response for 3 h. After PBS washing, treated cells were harvested with sample buffer, and the total cell lysate was heated for 5 min at 95°C before sonication. Primary anti-phospho Histone H3(Ser 10), anti-phospho-Histone H3 (Ser 28), anti-Histone H3, anti-phospho-Aurora A(Thr 288)/Aurora B(Thr 232)/Aurora C(Thr 198), anti-Aurora B, and anti-Cyclin B1 antibodies were incubated and detected as described above. Primary and secondary antibody dilutions can be found in Table S3 in Supplementary Material.
Aurora B Transcript Variant Analysis
HeLa total cellular RNA was prepared using RNeasy (Qiagen) according to the manufacturer’s instructions. Random primer-based cDNA synthesis was performed with MultiScribe reverse transcriptase (Applied Biosystems) from 500 ng RNA (20 μL reaction volume, 10 min at 25°C, 120 min at 37°C, 5 min at 85°C). The cDNA was diluted 1:5, and 10 μl was used in a 50 μl PCR reaction with Q5 DNA polymerase (New England Biolabs) and the following primers: GGTCATTTGTAGCCACATCCTGTC (specific to human Aurora B transcript 5; nucleotides 108–131 of RefSeq NM_001313951) and GCATCTGCCAACTCCTCCATGATC (universal primer for human Aurora B transcripts; nucleotides 687–664 of RefSeq NM_001313951). The PCR amplification conditions were (10 s at 98°C, 30 s at 69°C, 30 s at 72°C, 35 cycles). Reaction products were visualized by fluorescence on a 3% NuSieve GTG agarose gel. Identical PCR conditions were used for amplification with T7 and SP6 promoter sequences appended to the primers for direct sequencing after gel purification.
Crystal Structure of Aurora A Bound to MK-5108
The kinase domain of human Aurora A (amino acids 123-390) was cloned into pET28a with an N-terminal 6XHis tag and an intervening rhinovirus 3C protease cleavage site. The protein was expressed in E. coli BL21 Rosetta 2(DE3) cells (Novagen) at 16°C overnight. Cells were harvested by centrifugation, resuspended in a buffer containing 50 mM Tris (pH 8.0), 300 mM NaCl, 40 mM imidazole, 20 mM MgCl2, 10% glycerol, 0.5 mM TCEP, and an EDTA-free protease inhibitor cocktail, and lysed using a microfluidizer. After clarification via centrifugation, the lysate was loaded onto a HisTrap HP column (GE Healthcare), and the bound protein was eluted in a buffer containing 50 mM Tris (pH 8.0), 300 mM NaCl, 200 mM imidazole, 20 mM MgCl2, 10% glycerol, and 0.5 mM TCEP. The tag was cleaved with Turbo3C protease (ETON) overnight at 4°C while being dialyzed against a buffer containing 20 mM Tris (pH 7.0), 200 mM NaCl, 20 mM MgCl2, 10% glycerol, and 0.5 mM TCEP. Since both the 6× His-tagged and untagged species bind metal affinity resins in this buffer, the cleavage reaction was loaded onto a HisTrap HP column and the untagged protein was selectively eluted in a buffer containing 20 mM Tris (pH 7.0), 200 mM NaCl, 40 mM imidazole, 20 mM MgCl2, 10% glycerol, and 0.5 mM TCEP. Trace amounts of the Turbo3C protease were removed using a GSTrap HP column (GE Healthcare). The untagged protein was further purified using size exclusion chromatography on a Superdex 75 16/600 column (GE Healthcare). The final eluate [in 20 mM Tris (pH 7.0), 200 mM NaCl, 20 mM MgCl2, 10% glycerol, and 0.5 mM TCEP] was concentrated to 6.2 mg/mL using Amicon Ultra 10K MWCO concentrators (Millipore), and MK-5108 was added from a 50 mM DMSO stock to a final concentration of 500 μM.
The inhibitor bound protein was crystallized by hanging drop vapor diffusion using a reservoir buffer consisting of 100 mM BisTris (pH 6.5), 30% PEG3350 at 21°C. A total of 1.5 μL protein solution was mixed with 1.5 μL reservoir buffer and sealed in a chamber containing 400 μL of reservoir solution. After 1 week, a rod-shaped crystal (~100 μm × 5 μm × 5 μm) was transferred to a cryoprotectant containing 100 mM BisTris (pH 6.5), 200 mM NaCl, 20 mM MgCl2, 25% PEG3350, 10% glycerol, 30 μM MK-5108, and flash-frozen in liquid nitrogen.
X-ray diffraction data were measured using Beamline 7-1 at the Stanford Synchrotron Radiation Lightsource and processed with HKL2000 (115). The structure was determined by molecular replacement using PHASER (116) and sequential searches with the large and then the small lobes of an ensemble model (PDB: 1MQ4, 2J4Z, 3FDN, 3LAU, 4UYN). Refinement was performed using PHENIX (117) interspersed with iterative cycles of rebuilding using Moloc (118). Figures were made using PyMol (Schrödinger).
Author Contributions
JH, MY, and HL performed biochemical experiments to determine inhibitor potencies and selectivities. CdG, JA, YW, and RD performed cell-based experiments to determine inhibitor potencies and selectivities. CdG and DJ assessed inhibitor effects on cellular proliferation and apoptosis. DJ performed Aurora B and C expression analysis. MM and RD performed PCR analysis of Aurora B transcript variants. AM and AS determined the structure of Aurora A bound to MK-5108. TG supplied the inhibitors and arranged for kinome profiling. CdG, YW, AD, TG, and AS conceived and designed experiments. AD and AS wrote the manuscript with input from CdG and all other authors.
Conflict of Interest Statement
The authors declare that the research was conducted in the absence of any commercial or financial relationships that could be construed as a potential conflict of interest.
Acknowledgments
We thank Karen Oegema and Pablo Lara-Gonzalez, for helpful comments on the manuscript, Heather Deacon for assistance with figures, and Don Cleveland for providing the tubulin and histone H2B constructs.
Funding
This work was supported in part by a grant from the NIH to AD (GM074215). AD and AS receive salary and other support from the Ludwig Institute for Cancer Research.
Supplementary Material
The Supplementary Material for this article can be found online at http://journal.frontiersin.org/article/10.3389/fonc.2015.00285
Movie S1. Timelapse imaging of HeLa cells stably expressing GFP-PCNA; H2B-RFP. Images were acquired at 12-min intervals; playback rate is 10 frames per second (7200 × real time).
References
1. Francisco L, Wang W, Chan CS. Type 1 protein phosphatase acts in opposition to IpL1 protein kinase in regulating yeast chromosome segregation. Mol Cell Biol (1994) 14:4731–40. doi:10.1128/MCB.14.7.4731
2. Glover DM, Leibowitz MH, McLean DA, Parry H. Mutations in Aurora prevent centrosome separation leading to the formation of monopolar spindles. Cell (1995) 81:95–105. doi:10.1016/0092-8674(95)90374-7
3. Carmena M, Ruchaud S, Earnshaw WC. Making the Auroras glow: regulation of Aurora A and B kinase function by interacting proteins. Curr Opin Cell Biol (2009) 21:796–805. doi:10.1016/j.ceb.2009.09.008
4. Nikonova AS, Astsaturov I, Serebriiskii IG, Dunbrack RL Jr, Golemis EA. Aurora A kinase (AURKA) in normal and pathological cell division. Cell Mol Life Sci (2013) 70:661–87. doi:10.1007/s00018-012-1073-7
5. Ruchaud S, Carmena M, Earnshaw WC. Chromosomal passengers: conducting cell division. Nat Rev Mol Cell Biol (2007) 8:798–812. doi:10.1038/nrm2257
6. van der Waal MS, Hengeveld RC, van der Horst A, Lens SM. Cell division control by the chromosomal passenger complex. Exp Cell Res (2012) 318:1407–20. doi:10.1016/j.yexcr.2012.03.015
7. Carmena M, Wheelock M, Funabiki H, Earnshaw WC. The chromosomal passenger complex (CPC): from easy rider to the godfather of mitosis. Nat Rev Mol Cell Biol (2012) 13:789–803. doi:10.1038/nrm3474
8. Quartuccio SM, Schindler K. Functions of Aurora kinase C in meiosis and cancer. Front Cell Dev Biol (2015) 3:50. doi:10.3389/fcell.2015.00050
9. Dieterich K, Soto Rifo R, Faure AK, Hennebicq S, Ben Amar B, Zahi M, et al. Homozygous mutation of AURKC yields large-headed polyploid spermatozoa and causes male infertility. Nat Genet (2007) 39:661–5. doi:10.1038/ng2027
10. Kimmins S, Crosio C, Kotaja N, Hirayama J, Monaco L, Hoog C, et al. Differential functions of the Aurora-B and Aurora-C kinases in mammalian spermatogenesis. Mol Endocrinol (2007) 21:726–39. doi:10.1210/me.2006-0332
11. Fernandez-Miranda G, Trakala M, Martin J, Escobar B, Gonzalez A, Ghyselinck NB, et al. Genetic disruption of Aurora B uncovers an essential role for Aurora C during early mammalian development. Development (2011) 138:2661–72. doi:10.1242/dev.066381
12. Sharif B, Na J, Lykke-Hartmann K, McLaughlin SH, Laue E, Glover DM, et al. The chromosome passenger complex is required for fidelity of chromosome transmission and cytokinesis in meiosis of mouse oocytes. J Cell Sci (2010) 123:4292–300. doi:10.1242/jcs.067447
13. Yang KT, Li SK, Chang CC, Tang CJ, Lin YN, Lee SC, et al. Aurora-C kinase deficiency causes cytokinesis failure in meiosis I and production of large polyploid oocytes in mice. Mol Biol Cell (2010) 21:2371–83. doi:10.1091/mbc.E10-02-0170
14. Santos MA, Teklenburg G, Macklon NS, Van Opstal D, Schuring-Blom GH, Krijtenburg PJ, et al. The fate of the mosaic embryo: chromosomal constitution and development of day 4, 5 and 8 human embryos. Hum Reprod (2010) 25:1916–26. doi:10.1093/humrep/deq139
15. Lin YS, Su LJ, Yu CT, Wong FH, Yeh HH, Chen SL, et al. Gene expression profiles of the Aurora family kinases. Gene Expr (2006) 13:15–26. doi:10.3727/000000006783991962
16. Ferrari S, Marin O, Pagano MA, Meggio F, Hess D, El-Shemerly M, et al. Aurora-A site specificity: a study with synthetic peptide substrates. Biochem J (2005) 390:293–302. doi:10.1042/BJ20050343
17. Ohashi S, Sakashita G, Ban R, Nagasawa M, Matsuzaki H, Murata Y, et al. Phospho-regulation of human protein kinase Aurora-A: analysis using anti-phospho-Thr288 monoclonal antibodies. Oncogene (2006) 25:7691–702. doi:10.1038/sj.onc.1209754
18. Cheeseman IM, Anderson S, Jwa M, Green EM, Kang J, Yates JR III, et al. Phospho-regulation of kinetochore-microtubule attachments by the Aurora kinase Ipl1p. Cell (2002) 111:163–72. doi:10.1016/S0092-8674(02)00973-X
19. Alexander J, Lim D, Joughin BA, Hegemann B, Hutchins JR, Ehrenberger T, et al. Spatial exclusivity combined with positive and negative selection of phosphorylation motifs is the basis for context-dependent mitotic signaling. Sci Signal (2011) 4:ra42. doi:10.1126/scisignal.2001796
20. Sessa F, Mapelli M, Ciferri C, Tarricone C, Areces LB, Schneider TR, et al. Mechanism of Aurora B activation by INCENP and inhibition by hesperadin. Mol Cell (2005) 18:379–91. doi:10.1016/j.molcel.2005.03.031
21. Yang J, Zappacosta F, Annan RS, Nurse K, Tummino PJ, Copeland RA, et al. The catalytic role of INCENP in Aurora B activation and the kinetic mechanism of Aurora B/INCENP. Biochem J (2009) 417:355–60. doi:10.1042/BJ20081365
22. Honda R, Korner R, Nigg EA. Exploring the functional interactions between Aurora B, INCENP, and survivin in mitosis. Mol Biol Cell (2003) 14:3325–41. doi:10.1091/mbc.E02-11-0769
23. Yasui Y, Urano T, Kawajiri A, Nagata K, Tatsuka M, Saya H, et al. Autophosphorylation of a newly identified site of Aurora-B is indispensable for cytokinesis. J Biol Chem (2004) 279:12997–3003. doi:10.1074/jbc.M311128200
24. Kufer TA, Sillje HH, Korner R, Gruss OJ, Meraldi P, Nigg EA. Human TPX2 is required for targeting Aurora-A kinase to the spindle. J Cell Biol (2002) 158:617–23. doi:10.1083/jcb.200204155
25. Ozlu N, Srayko M, Kinoshita K, Habermann B, O’Toole ET, Muller-Reichert T, et al. An essential function of the C. elegans ortholog of TPX2 is to localize activated Aurora A kinase to mitotic spindles. Dev Cell (2005) 9:237–48. doi:10.1016/j.devcel.2005.07.002
26. Bird AW, Hyman AA. Building a spindle of the correct length in human cells requires the interaction between TPX2 and Aurora A. J Cell Biol (2008) 182:289–300. doi:10.1083/jcb.200802005
27. Bayliss R, Sardon T, Vernos I, Conti E. Structural basis of Aurora-A activation by TPX2 at the mitotic spindle. Mol Cell (2003) 12:851–62. doi:10.1016/S1097-2765(03)00392-7
28. Zorba A, Buosi V, Kutter S, Kern N, Pontiggia F, Cho YJ, et al. Molecular mechanism of Aurora A kinase autophosphorylation and its allosteric activation by TPX2. Elife (2014) 3:e02667. doi:10.7554/eLife.02667
29. Dodson CA, Haq T, Yeoh S, Fry AM, Bayliss R. The structural mechanisms that underpin mitotic kinase activation. Biochem Soc Trans (2013) 41:1037–41. doi:10.1042/BST20130066
30. Dodson CA, Yeoh S, Haq T, Bayliss R. A kinetic test characterizes kinase intramolecular and intermolecular autophosphorylation mechanisms. Sci Signal (2013) 6:ra54. doi:10.1126/scisignal.2003910
31. Eyers PA, Maller JL. Regulation of Xenopus Aurora A activation by TPX2. J Biol Chem (2004) 279:9008–15. doi:10.1074/jbc.M312424200
32. Dodson CA, Bayliss R. Activation of Aurora-A kinase by protein partner binding and phosphorylation are independent and synergistic. J Biol Chem (2012) 287:1150–7. doi:10.1074/jbc.M111.312090
33. Sen S, Zhou H, White RA. A putative serine/threonine kinase encoding gene BTAK on chromosome 20q13 is amplified and overexpressed in human breast cancer cell lines. Oncogene (1997) 14:2195–200. doi:10.1038/sj.onc.1201065
34. Katayama H, Ota T, Jisaki F, Ueda Y, Tanaka T, Odashima S, et al. Mitotic kinase expression and colorectal cancer progression. J Natl Cancer Inst (1999) 91:1160–2. doi:10.1093/jnci/91.13.1160
35. Bischoff JR, Anderson L, Zhu Y, Mossie K, Ng L, Souza B, et al. A homologue of Drosophila Aurora kinase is oncogenic and amplified in human colorectal cancers. EMBO J (1998) 17:3052–65. doi:10.1093/emboj/17.11.3052
36. Zhou H, Kuang J, Zhong L, Kuo WL, Gray JW, Sahin A, et al. Tumour amplified kinase STK15/BTAK induces centrosome amplification, aneuploidy and transformation. Nat Genet (1998) 20:189–93. doi:10.1038/2496
37. Anand S, Penrhyn-Lowe S, Venkitaraman AR. AURORA-A amplification overrides the mitotic spindle assembly checkpoint, inducing resistance to taxol. Cancer Cell (2003) 3:51–62. doi:10.1016/S1535-6108(02)00235-0
38. Kollareddy M, Zheleva D, Dzubak P, Brahmkshatriya PS, Lepsik M, Hajduch M. Aurora kinase inhibitors: progress towards the clinic. Invest New Drugs (2012) 30:2411–32. doi:10.1007/s10637-012-9798-6
39. Pollard JR, Mortimore M. Discovery and development of Aurora kinase inhibitors as anticancer agents. J Med Chem (2009) 52:2629–51. doi:10.1021/jm8012129
40. Goldenson B, Crispino JD. The Aurora kinases in cell cycle and leukemia. Oncogene (2015) 34:537–45. doi:10.1038/onc.2014.14
41. Malumbres M, Perez de Castro I. Aurora kinase A inhibitors: promising agents in antitumoral therapy. Expert Opin Ther Targets (2014) 18:1377–93. doi:10.1517/14728222.2014.956085
42. Bebbington D, Binch H, Charrier JD, Everitt S, Fraysse D, Golec J, et al. The discovery of the potent Aurora inhibitor MK-0457 (VX-680). Bioorg Med Chem Lett (2009) 19:3586–92. doi:10.1016/j.bmcl.2009.04.136
43. Harrington EA, Bebbington D, Moore J, Rasmussen RK, Ajose-Adeogun AO, Nakayama T, et al. VX-680, a potent and selective small-molecule inhibitor of the Aurora kinases, suppresses tumor growth in vivo. Nat Med (2004) 10:262–7. doi:10.1038/nm1003
44. Ditchfield C, Johnson VL, Tighe A, Ellston R, Haworth C, Johnson T, et al. Aurora B couples chromosome alignment with anaphase by targeting BubR1, Mad2, and Cenp-E to kinetochores. J Cell Biol (2003) 161:267–80. doi:10.1083/jcb.200208091
45. Hauf S, Cole RW, LaTerra S, Zimmer C, Schnapp G, Walter R, et al. The small molecule Hesperadin reveals a role for Aurora B in correcting kinetochore-microtubule attachment and in maintaining the spindle assembly checkpoint. J Cell Biol (2003) 161:281–94. doi:10.1083/jcb.200208092
46. Mortlock AA, Foote KM, Heron NM, Jung FH, Pasquet G, Lohmann JJ, et al. Discovery, synthesis, and in vivo activity of a new class of pyrazoloquinazolines as selective inhibitors of Aurora B kinase. J Med Chem (2007) 50:2213–24. doi:10.1021/jm061335f
47. Wilkinson RW, Odedra R, Heaton SP, Wedge SR, Keen NJ, Crafter C, et al. AZD1152, a selective inhibitor of Aurora B kinase, inhibits human tumor xenograft growth by inducing apoptosis. Clin Cancer Res (2007) 13:3682–8. doi:10.1158/1078-0432.CCR-06-2979
48. Manfredi MG, Ecsedy JA, Meetze KA, Balani SK, Burenkova O, Chen W, et al. Antitumor activity of MLN8054, an orally active small-molecule inhibitor of Aurora A kinase. Proc Natl Acad Sci U S A (2007) 104:4106–11. doi:10.1073/pnas.0608798104
49. Sells TB, Chau R, Ecsedy JA, Gershman RE, Hoar K, Huck J, et al. MLN8054 and alisertib (MLN8237): discovery of selective oral Aurora A inhibitors. ACS Med Chem Lett (2015) 6:630–4. doi:10.1021/ml500409n
50. Huck JJ, Zhang M, McDonald A, Bowman D, Hoar KM, Stringer B, et al. MLN8054, an inhibitor of Aurora A kinase, induces senescence in human tumor cells both in vitro and in vivo. Mol Cancer Res (2010) 8:373–84. doi:10.1158/1541-7786.MCR-09-0300
51. Hoar K, Chakravarty A, Rabino C, Wysong D, Bowman D, Roy N, et al. MLN8054, a small-molecule inhibitor of Aurora A, causes spindle pole and chromosome congression defects leading to aneuploidy. Mol Cell Biol (2007) 27:4513–25. doi:10.1128/MCB.02364-06
52. Chakravarty A, Shinde V, Tabernero J, Cervantes A, Cohen RB, Dees EC, et al. Phase I assessment of new mechanism-based pharmacodynamic biomarkers for MLN8054, a small-molecule inhibitor of Aurora A kinase. Cancer Res (2011) 71:675–85. doi:10.1158/0008-5472.CAN-10-1030
53. Dees EC, Infante JR, Cohen RB, O’Neil BH, Jones S, von Mehren M, et al. Phase 1 study of MLN8054, a selective inhibitor of Aurora A kinase in patients with advanced solid tumors. Cancer Chemother Pharmacol (2011) 67:945–54. doi:10.1007/s00280-010-1377-y
54. Dees EC, Cohen RB, von Mehren M, Stinchcombe TE, Liu H, Venkatakrishnan K, et al. Phase I study of Aurora A kinase inhibitor MLN8237 in advanced solid tumors: safety, pharmacokinetics, pharmacodynamics, and bioavailability of two oral formulations. Clin Cancer Res (2012) 18:4775–84. doi:10.1158/1078-0432.CCR-12-0589
55. Manfredi MG, Ecsedy JA, Chakravarty A, Silverman L, Zhang M, Hoar KM, et al. Characterization of alisertib (MLN8237), an investigational small-molecule inhibitor of Aurora A kinase using novel in vivo pharmacodynamic assays. Clin Cancer Res (2011) 17:7614–24. doi:10.1158/1078-0432.CCR-11-1536
56. Shimomura T, Hasako S, Nakatsuru Y, Mita T, Ichikawa K, Kodera T, et al. MK-5108, a highly selective Aurora-A kinase inhibitor, shows antitumor activity alone and in combination with docetaxel. Mol Cancer Ther (2010) 9:157–66. doi:10.1158/1535-7163.MCT-09-0609
57. Nair JS, Ho AL, Schwartz GK. The induction of polyploidy or apoptosis by the Aurora A kinase inhibitor MK8745 is p53-dependent. Cell Cycle (2012) 11:807–17. doi:10.4161/cc.11.4.19323
58. Ohkubo M, Kato T, Kawanishi N, Shimomura T. Aminopyridine Derivatives Having Aurora A Selective Inhibitory Action. Chiyoda-Ku Tokyo, Japan: Banyu Pharmaceutical Co., Ltd (2010).
59. Aliagas-Martin I, Burdick D, Corson L, Dotson J, Drummond J, Fields C, et al. A class of 2,4-bisanilinopyrimidine Aurora A inhibitors with unusually high selectivity against Aurora B. J Med Chem (2009) 52:3300–7. doi:10.1021/jm9000314
60. Adams ND, Adams JL, Burgess JL, Chaudhari AM, Copeland RA, Donatelli CA, et al. Discovery of GSK1070916, a potent and selective inhibitor of Aurora B/C kinase. J Med Chem (2010) 53:3973–4001. doi:10.1021/jm901870q
61. Anderson K, Lai Z, McDonald OB, Stuart JD, Nartey EN, Hardwicke MA, et al. Biochemical characterization of GSK1070916, a potent and selective inhibitor of Aurora B and Aurora C kinases with an extremely long residence time1. Biochem J (2009) 420:259–65. doi:10.1042/BJ20090121
62. Hardwicke MA, Oleykowski CA, Plant R, Wang J, Liao Q, Moss K, et al. GSK1070916, a potent Aurora B/C kinase inhibitor with broad antitumor activity in tissue culture cells and human tumor xenograft models. Mol Cancer Ther (2009) 8:1808–17. doi:10.1158/1535-7163.MCT-09-0041
63. Taylor S, Peters JM. Polo and Aurora kinases: lessons derived from chemical biology. Curr Opin Cell Biol (2008) 20:77–84. doi:10.1016/j.ceb.2007.11.008
64. Ma H, Deacon S, Horiuchi K. The challenge of selecting protein kinase assays for lead discovery optimization. Expert Opin Drug Discov (2008) 3:607–21. doi:10.1517/17460441.3.6.607
65. Cheng Y, Prusoff WH. Relationship between the inhibition constant (K1) and the concentration of inhibitor which causes 50 per cent inhibition (I50) of an enzymatic reaction. Biochem Pharmacol (1973) 22:3099–108. doi:10.1016/0006-2952(73)90196-2
66. Copeland RA, Lombardo D, Giannaras J, Decicco CP. Estimating Ki values for tight binding inhibitors from dose-response plots. Bioorg Med Chem Lett (1995) 5:1947–52. doi:10.1016/0960-894X(95)00330-V
67. Cha S, Agarwal RP, Parks RE Jr. Tight-binding inhibitors-II. Non-steady state nature of inhibition of milk xanthine oxidase by allopurinol and alloxanthine and of human erythrocytic adenosine deaminase by coformycin. Biochem Pharmacol (1975) 24:2187–97. doi:10.1016/0006-2952(75)90051-9
68. Greco WR, Hakala MT. Evaluation of methods for estimating the dissociation constant of tight binding enzyme inhibitors. J Biol Chem (1979) 254:12104–9.
69. Myers DK. [Studies on cholinesterase. 7. Determination of the molar concentration of pseudo-cholinesterase in serum]. Biochem J (1952) 51:303–11. doi:10.1042/bj0510303
70. Anderson K, Yang J, Koretke K, Nurse K, Calamari A, Kirkpatrick RB, et al. Binding of TPX2 to Aurora A alters substrate and inhibitor interactions. Biochemistry (2007) 46:10287–95. doi:10.1021/bi7011355
71. Dodson CA, Kosmopoulou M, Richards MW, Atrash B, Bavetsias V, Blagg J, et al. Crystal structure of an Aurora-A mutant that mimics Aurora-B bound to MLN8054: insights into selectivity and drug design. Biochem J (2010) 427:19–28. doi:10.1042/BJ20091530
72. Lavogina D, Enkvist E, Viht K, Uri A. Long residence times revealed by Aurora A kinase-targeting fluorescent probes derived from inhibitors MLN8237 and VX-689. Chembiochem (2014) 15:443–50. doi:10.1002/cbic.201300613
73. Zhao B, Smallwood A, Yang J, Koretke K, Nurse K, Calamari A, et al. Modulation of kinase-inhibitor interactions by auxiliary protein binding: crystallography studies on Aurora A interactions with VX-680 and with TPX2. Protein Sci (2008) 17:1791–7. doi:10.1110/ps.036590.108
74. Wu JM, Chen CT, Coumar MS, Lin WH, Chen ZJ, Hsu JT, et al. Aurora kinase inhibitors reveal mechanisms of HURP in nucleation of centrosomal and kinetochore microtubules. Proc Natl Acad Sci U S A (2013) 110:E1779–87. doi:10.1073/pnas.1220523110
75. Sloane DA, Trikic MZ, Chu ML, Lamers MB, Mason CS, Mueller I, et al. Drug-resistant Aurora A mutants for cellular target validation of the small molecule kinase inhibitors MLN8054 and MLN8237. ACS Chem Biol (2010) 5:563–76. doi:10.1021/cb100053q
76. Heron NM, Anderson M, Blowers DP, Breed J, Eden JM, Green S, et al. SAR and inhibitor complex structure determination of a novel class of potent and specific Aurora kinase inhibitors. Bioorg Med Chem Lett (2006) 16:1320–3. doi:10.1016/j.bmcl.2005.11.053
77. Toji S, Yabuta N, Hosomi T, Nishihara S, Kobayashi T, Suzuki S, et al. The centrosomal protein Lats2 is a phosphorylation target of Aurora-A kinase. Genes Cells (2004) 9:383–97. doi:10.1111/j.1356-9597.2004.00732.x
78. Kinoshita K, Noetzel TL, Pelletier L, Mechtler K, Drechsel DN, Schwager A, et al. Aurora A phosphorylation of TACC3/maskin is required for centrosome-dependent microtubule assembly in mitosis. J Cell Biol (2005) 170:1047–55. doi:10.1083/jcb.200503023
79. Barros TP, Kinoshita K, Hyman AA, Raff JW. Aurora A activates D-TACC-Msps complexes exclusively at centrosomes to stabilize centrosomal microtubules. J Cell Biol (2005) 170:1039–46. doi:10.1083/jcb.200504097
80. Peset I, Seiler J, Sardon T, Bejarano LA, Rybina S, Vernos I. Function and regulation of Maskin, a TACC family protein, in microtubule growth during mitosis. J Cell Biol (2005) 170:1057–66. doi:10.1083/jcb.200504037
81. Pascreau G, Delcros JG, Cremet JY, Prigent C, Arlot-Bonnemains Y. Phosphorylation of maskin by Aurora-A participates in the control of sequential protein synthesis during Xenopus laevis oocyte maturation. J Biol Chem (2005) 280:13415–23. doi:10.1074/jbc.M410584200
82. LeRoy PJ, Hunter JJ, Hoar KM, Burke KE, Shinde V, Ruan J, et al. Localization of human TACC3 to mitotic spindles is mediated by phosphorylation on Ser558 by Aurora A: a novel pharmacodynamic method for measuring Aurora A activity. Cancer Res (2007) 67:5362–70. doi:10.1158/0008-5472.CAN-07-0122
83. Emery A, Sorrell DA, Lawrence S, Easthope E, Stockdale M, Jones DO, et al. A novel cell-based, high-content assay for phosphorylation of Lats2 by Aurora A. J Biomol Screen (2011) 16:925–31. doi:10.1177/1087057111413923
84. Goto H, Tomono Y, Ajiro K, Kosako H, Fujita M, Sakurai M, et al. Identification of a novel phosphorylation site on histone H3 coupled with mitotic chromosome condensation. J Biol Chem (1999) 274:25543–9. doi:10.1074/jbc.274.36.25543
85. Hendzel MJ, Wei Y, Mancini MA, Van Hooser A, Ranalli T, Brinkley BR, et al. Mitosis-specific phosphorylation of histone H3 initiates primarily within pericentromeric heterochromatin during G2 and spreads in an ordered fashion coincident with mitotic chromosome condensation. Chromosoma (1997) 106:348–60. doi:10.1007/s004120050256
86. Davis FM, Tsao TY, Fowler SK, Rao PN. Monoclonal antibodies to mitotic cells. Proc Natl Acad Sci U S A (1983) 80:2926–30. doi:10.1073/pnas.80.10.2926
87. Liu Q, Ruderman JV. Aurora A, mitotic entry, and spindle bipolarity. Proc Natl Acad Sci U S A (2006) 103:5811–6. doi:10.1073/pnas.0601425103
88. Portier N, Audhya A, Maddox PS, Green RA, Dammermann A, Desai A, et al. A microtubule-independent role for centrosomes and Aurora A in nuclear envelope breakdown. Dev Cell (2007) 12:515–29. doi:10.1016/j.devcel.2007.01.019
89. Marumoto T, Hirota T, Morisaki T, Kunitoku N, Zhang D, Ichikawa Y, et al. Roles of Aurora-A kinase in mitotic entry and G2 checkpoint in mammalian cells. Genes Cells (2002) 7:1173–82. doi:10.1046/j.1365-2443.2002.00592.x
90. Hirota T, Kunitoku N, Sasayama T, Marumoto T, Zhang D, Nitta M, et al. Aurora-A and an interacting activator, the LIM protein Ajuba, are required for mitotic commitment in human cells. Cell (2003) 114:585–98. doi:10.1016/S0092-8674(03)00642-1
91. Leonhardt H, Rahn HP, Weinzierl P, Sporbert A, Cremer T, Zink D, et al. Dynamics of DNA replication factories in living cells. J Cell Biol (2000) 149:271–80. doi:10.1083/jcb.149.2.271
92. Wong YL, Anzola JV, Davis RL, Yoon M, Motamedi A, Kroll A, et al. Cell biology. Reversible centriole depletion with an inhibitor of polo-like kinase 4. Science (2015) 348:1155–60. doi:10.1126/science.aaa5111
93. Hahn AT, Jones JT, Meyer T. Quantitative analysis of cell cycle phase durations and PC12 differentiation using fluorescent biosensors. Cell Cycle (2009) 8:1044–52. doi:10.4161/cc.8.7.8042
94. Kwiatkowski N, Deng X, Wang J, Tan L, Villa F, Santaguida S, et al. Selective Aurora kinase inhibitors identified using a taxol-induced checkpoint sensitivity screen. ACS Chem Biol (2012) 7:185–96. doi:10.1021/cb200305u
95. Eyers PA, Erikson E, Chen LG, Maller JL. A novel mechanism for activation of the protein kinase Aurora A. Curr Biol (2003) 13:691–7. doi:10.1016/S0960-9822(03)00166-0
96. Zeng K, Bastos RN, Barr FA, Gruneberg U. Protein phosphatase 6 regulates mitotic spindle formation by controlling the T-loop phosphorylation state of Aurora A bound to its activator TPX2. J Cell Biol (2010) 191:1315–32. doi:10.1083/jcb.201008106
97. Knight ZA, Shokat KM. Features of selective kinase inhibitors. Chem Biol (2005) 12:621–37. doi:10.1016/j.chembiol.2005.04.011
98. Nowakowski J, Cronin CN, McRee DE, Knuth MW, Nelson CG, Pavletich NP, et al. Structures of the cancer-related Aurora-A, FAK, and EphA2 protein kinases from nanovolume crystallography. Structure (2002) 10:1659–67. doi:10.1016/S0969-2126(02)00907-3
99. Mobitz H. The ABC of protein kinase conformations. Biochim Biophys Acta (2015) 1854(10 Pt B):1555–66. doi:10.1016/j.bbapap.2015.03.009
100. Cheetham GM, Knegtel RM, Coll JT, Renwick SB, Swenson L, Weber P, et al. Crystal structure of Aurora-2, an oncogenic serine/threonine kinase. J Biol Chem (2002) 277:42419–22. doi:10.1074/jbc.C200426200
101. Chen L, Yap JL, Yoshioka M, Lanning ME, Fountain RN, Raje M, et al. BRD4 structure-activity relationships of dual PLK1 kinase/BRD4 bromodomain inhibitor BI-2536. ACS Med Chem Lett (2015) 6:764–9. doi:10.1021/acsmedchemlett.5b00084
102. Ciceri P, Muller S, O’Mahony A, Fedorov O, Filippakopoulos P, Hunt JP, et al. Dual kinase-bromodomain inhibitors for rationally designed polypharmacology. Nat Chem Biol (2014) 10:305–12. doi:10.1038/nchembio.1471
103. Ember SW, Zhu JY, Olesen SH, Martin MP, Becker A, Berndt N, et al. Acetyl-lysine binding site of bromodomain-containing protein 4 (BRD4) interacts with diverse kinase inhibitors. ACS Chem Biol (2014) 9:1160–71. doi:10.1021/cb500072z
104. Workman P, Collins I. Probing the probes: fitness factors for small molecule tools. Chem Biol (2010) 17:561–77. doi:10.1016/j.chembiol.2010.05.013
105. Arrowsmith CH, Audia JE, Austin C, Baell J, Bennett J, Blagg J, et al. The promise and peril of chemical probes. Nat Chem Biol (2015) 11:536–41. doi:10.1038/nchembio1115-887c
106. Bavetsias V, Faisal A, Crumpler S, Brown N, Kosmopoulou M, Joshi A, et al. Aurora isoform selectivity: design and synthesis of imidazo[4,5-b]pyridine derivatives as highly selective inhibitors of Aurora-A kinase in cells. J Med Chem (2013) 56:9122–35. doi:10.1021/jm401115g
107. Ando R, Ikegami H, Sakiyama M, Ooike S, Hayashi M, Fujino Y, et al. 3-Cyano-6-(5-methyl-3-pyrazoloamino)pyridines: selective Aurora A kinase inhibitors. Bioorg Med Chem Lett (2010) 20:4709–11. doi:10.1016/j.bmcl.2010.04.119
108. Bouloc N, Large JM, Kosmopoulou M, Sun C, Faisal A, Matteucci M, et al. Structure-based design of imidazo[1,2-a]pyrazine derivatives as selective inhibitors of Aurora-A kinase in cells. Bioorg Med Chem Lett (2010) 20:5988–93. doi:10.1016/j.bmcl.2010.08.091
109. Coumar MS, Leou JS, Shukla P, Wu JS, Dixit AK, Lin WH, et al. Structure-based drug design of novel Aurora kinase A inhibitors: structural basis for potency and specificity. J Med Chem (2009) 52:1050–62. doi:10.1021/jm801270e
110. Prime ME, Courtney SM, Brookfield FA, Marston RW, Walker V, Warne J, et al. Phthalazinone pyrazoles as potent, selective, and orally bioavailable inhibitors of Aurora-A kinase. J Med Chem (2011) 54:312–9. doi:10.1021/jm101346r
111. Girdler F, Sessa F, Patercoli S, Villa F, Musacchio A, Taylor S. Molecular basis of drug resistance in Aurora kinases. Chem Biol (2008) 15:552–62. doi:10.1016/j.chembiol.2008.04.013
112. Scutt PJ, Chu ML, Sloane DA, Cherry M, Bignell CR, Williams DH, et al. Discovery and exploitation of inhibitor-resistant Aurora and polo kinase mutants for the analysis of mitotic networks. J Biol Chem (2009) 284:15880–93. doi:10.1074/jbc.M109.005694
113. Brockmann M, Poon E, Berry T, Carstensen A, Deubzer HE, Rycak L, et al. Small molecule inhibitors of Aurora-A induce proteasomal degradation of N-myc in childhood neuroblastoma. Cancer Cell (2013) 24:75–89. doi:10.1016/j.ccr.2013.05.005
114. Gustafson WC, Meyerowitz JG, Nekritz EA, Chen J, Benes C, Charron E, et al. Drugging MYCN through an allosteric transition in Aurora kinase A. Cancer Cell (2014) 26:414–27. doi:10.1016/j.ccr.2014.07.015
115. Otwinowski Z, Minor W. Processing of X-ray diffraction data collected in oscillation mode. Methods Enzymol (1997) 276:307–26. doi:10.1016/S0076-6879(97)76066-X
116. McCoy AJ, Grosse-Kunstleve RW, Adams PD, Winn MD, Storoni LC, Read RJ. Phaser crystallographic software. J Appl Crystallogr (2007) 40:658–74. doi:10.1107/S0021889807021206
117. Adams PD, Afonine PV, Bunkoczi G, Chen VB, Davis IW, Echols N, et al. PHENIX: a comprehensive python-based system for macromolecular structure solution. Acta Crystallogr D Biol Crystallogr (2010) 66:213–21. doi:10.1107/S0907444909052925
Keywords: Aurora kinase inhibitors, AZD1152, ZM447439, Hesperadin, MLN8237, MLN8054, MK-5108, MK-8745
Citation: de Groot CO, Hsia JE, Anzola JV, Motamedi A, Yoon M, Wong YL, Jenkins D, Lee HJ, Martinez MB, Davis RL, Gahman TC, Desai A and Shiau AK (2015) A Cell Biologist’s Field Guide to Aurora Kinase Inhibitors. Front. Oncol. 5:285. doi: 10.3389/fonc.2015.00285
Received: 01 October 2015; Accepted: 03 December 2015;
Published: 21 December 2015
Edited by:
Mar Carmena, The University of Edinburgh, UKReviewed by:
Susanne Lens, University Medical Center Utrecht, NetherlandsA. Arockia Jeyaprakash, The University of Edinburgh, UK
Copyright: © 2015 de Groot, Hsia, Anzola, Motamedi, Yoon, Wong, Jenkins, Lee, Martinez, Davis, Gahman, Desai and Shiau. This is an open-access article distributed under the terms of the Creative Commons Attribution License (CC BY). The use, distribution or reproduction in other forums is permitted, provided the original author(s) or licensor are credited and that the original publication in this journal is cited, in accordance with accepted academic practice. No use, distribution or reproduction is permitted which does not comply with these terms.
*Correspondence: Arshad Desai, abdesai@ucsd.edu;
Andrew K. Shiau, ashiau@ucsd.edu
†Judy E. Hsia, John V. Anzola, Amir Motamedi and Michelle Yoon have contributed equally to this work.