Extended and replicated white matter changes in obesity: Voxel-based and region of interest meta-analyses of diffusion tensor imaging studies
 Lorielle M. F. Dietze
 Sean R. McWhinney1
  Joaquim Radua
 Tomas Hajek
- 1Department of Psychiatry, Dalhousie University, Halifax, NS, Canada
- 2Department of Medical Neuroscience, Dalhousie University, Halifax, NS, Canada
- 3Institut d'Investigacions Biomèdiques August Pi i Sunyer (IDIBAPS), University of Barcelona, Barcelona, Spain
- 4Mental Health Research Networking Center (CIBERSAM), Madrid, Spain
- 5Department of Psychosis Studies, Institute of Psychiatry, Psychology, and Neuroscience, King's College London, London, United Kingdom
- 6Department of Clinical Neuroscience, Center for Psychiatric Research and Education, Karolinska Institutet, Stockholm, Sweden
- 7National Institute of Mental Health, Prague, Czechia
Introduction: Obesity has become a global public health issue, which impacts general health and the brain. Associations between obesity and white matter microstructure measured using diffusion tensor imaging have been under reviewed, despite a relatively large number of individual studies. Our objective was to determine the association between obesity and white matter microstructure in a large general population sample.
Methods: We analyzed location of brain white matter changes in obesity using the Anisotropic Effect Size Seed-based d Mapping (AES-SDM) method in a voxel-based meta-analysis, with validation in a region of interest (ROI) effect size meta-analysis. Our sample included 21 742 individuals from 51 studies.
Results: The voxel-based spatial meta-analysis demonstrated reduced fractional anisotropy (FA) with obesity in the genu and splenium of the corpus callosum, middle cerebellar peduncles, anterior thalamic radiation, cortico-spinal projections, and cerebellum. The ROI effect size meta-analysis replicated associations between obesity and lower FA in the genu and splenium of the corpus callosum, middle cerebellar peduncles. Effect size of obesity related brain changes was small to medium.
Discussion: Our findings demonstrate obesity related brain white matter changes are localized rather than diffuse. Better understanding the brain correlates of obesity could help identify risk factors, and targets for prevention or treatment of brain changes.
1. Introduction
Obesity has become a major public health issue due to its extremely high prevalence. For instance, 63.1% of the population in Canada and 52% of adult population worldwide can be classified as overweight or obese (1, 2). Obesity is an established health risk factor for hypertension, type 2 diabetes, cardiovascular disorders, metabolic syndrome, and cancer among others (3–8) and is associated with massive health care costs and human suffering. It is less well recognized that the brain is one of the targets of obesity related damage (9, 10), and consequently, obesity is also associated with a range of brain disorders, including psychiatric (11), and neurodegenerative disorders/dementia (12–14).
It is important to map and better understand the brain correlates of obesity. Such studies could help identify risk factors for brain alterations, targets, and possibly new mechanisms of action for prevention or treatment of brain changes and associated cognitive or mental health outcomes. For instance, deterring obesity could prevent about 3% of depressive disorders, deterring maternal pre-pregnancy obesity would prevent about 9% of ADHD, and deterring maternal overweight pre/during pregnancy would prevent about 6% of both ADHD and autism spectrum disorders (15). Preliminary evidence suggests that weight loss is associated with improvements in brain structure (16).
Obesity is associated with diffuse changes in gray matter, including the medial prefrontal cortex, temporal pole, precentral gyrus, inferior parietal cortex and the cerebellum (17). The associations between obesity and brain gray matter are supported by several large studies (18–20). Some studies have documented an association between obesity and white matter integrity, but these findings are much less diffuse, less replicated, and under reviewed. A previous narrative review mentions links with obesity and alterations of white matter integrity in the genu, body, and splenium of the corpus callosum, fornix, cingulum, corona radiata, corticospinal tracts, uncinate fasciculus, and cerebellar peduncles (21). However, considering the heterogeneity of these findings, a meta-analysis is needed to quantitatively review the available evidence. Whole brain DTI studies can be analyzed using spatial meta-analysis, which identifies the most replicated location of obesity related alterations (22, 23). Region of interest studies can be used in a traditional effect size meta-analysis to establish the regional extent of obesity related alterations (24). Furthermore, focusing on replications among the two meta-analyses minimizes the risk of false positives (25).
A single previous spatial meta-analysis investigated the location of obesity related white matter alterations. However, this study had restrictive inclusion criteria and contained only one half of the available studies in the literature (26). Furthermore, regions of interest studies were not included in this meta-analysis, thus representing less than a third of the reviewed literature. There are no prior effect size meta-analyses quantifying the extent of obesity related alterations and no studies combining a spatial and effect size meta-analysis.
Thus, we present the first study that analyzes the location of white matter changes in obesity using a voxel-based spatial meta-analysis and then validates the results and estimates the extent of obesity-related alterations with a region of interest (ROI) effect size meta-analysis. This approach allowed us to review the entire available literature on this topic, maximize sample size, minimize false negatives and by focusing on replications to also minimize the risk of false positives.
2. Materials and methods
2.1. Search strategy
We followed the Preferred Reporting Items for Systematic Reviews and Meta-Analyses (PRISMA) statement (27) and performed a systematic search of articles until January 15, 2023 in PubMed database,1 using the following keywords: (1) “obesity AND white matter”; and (2) “obesity AND anisotropy.” We excluded animal studies and also searched references of downloaded articles and previous reviews (see Figure 1; Tables 1 and 2) and meta-analyses (26) for additional studies.
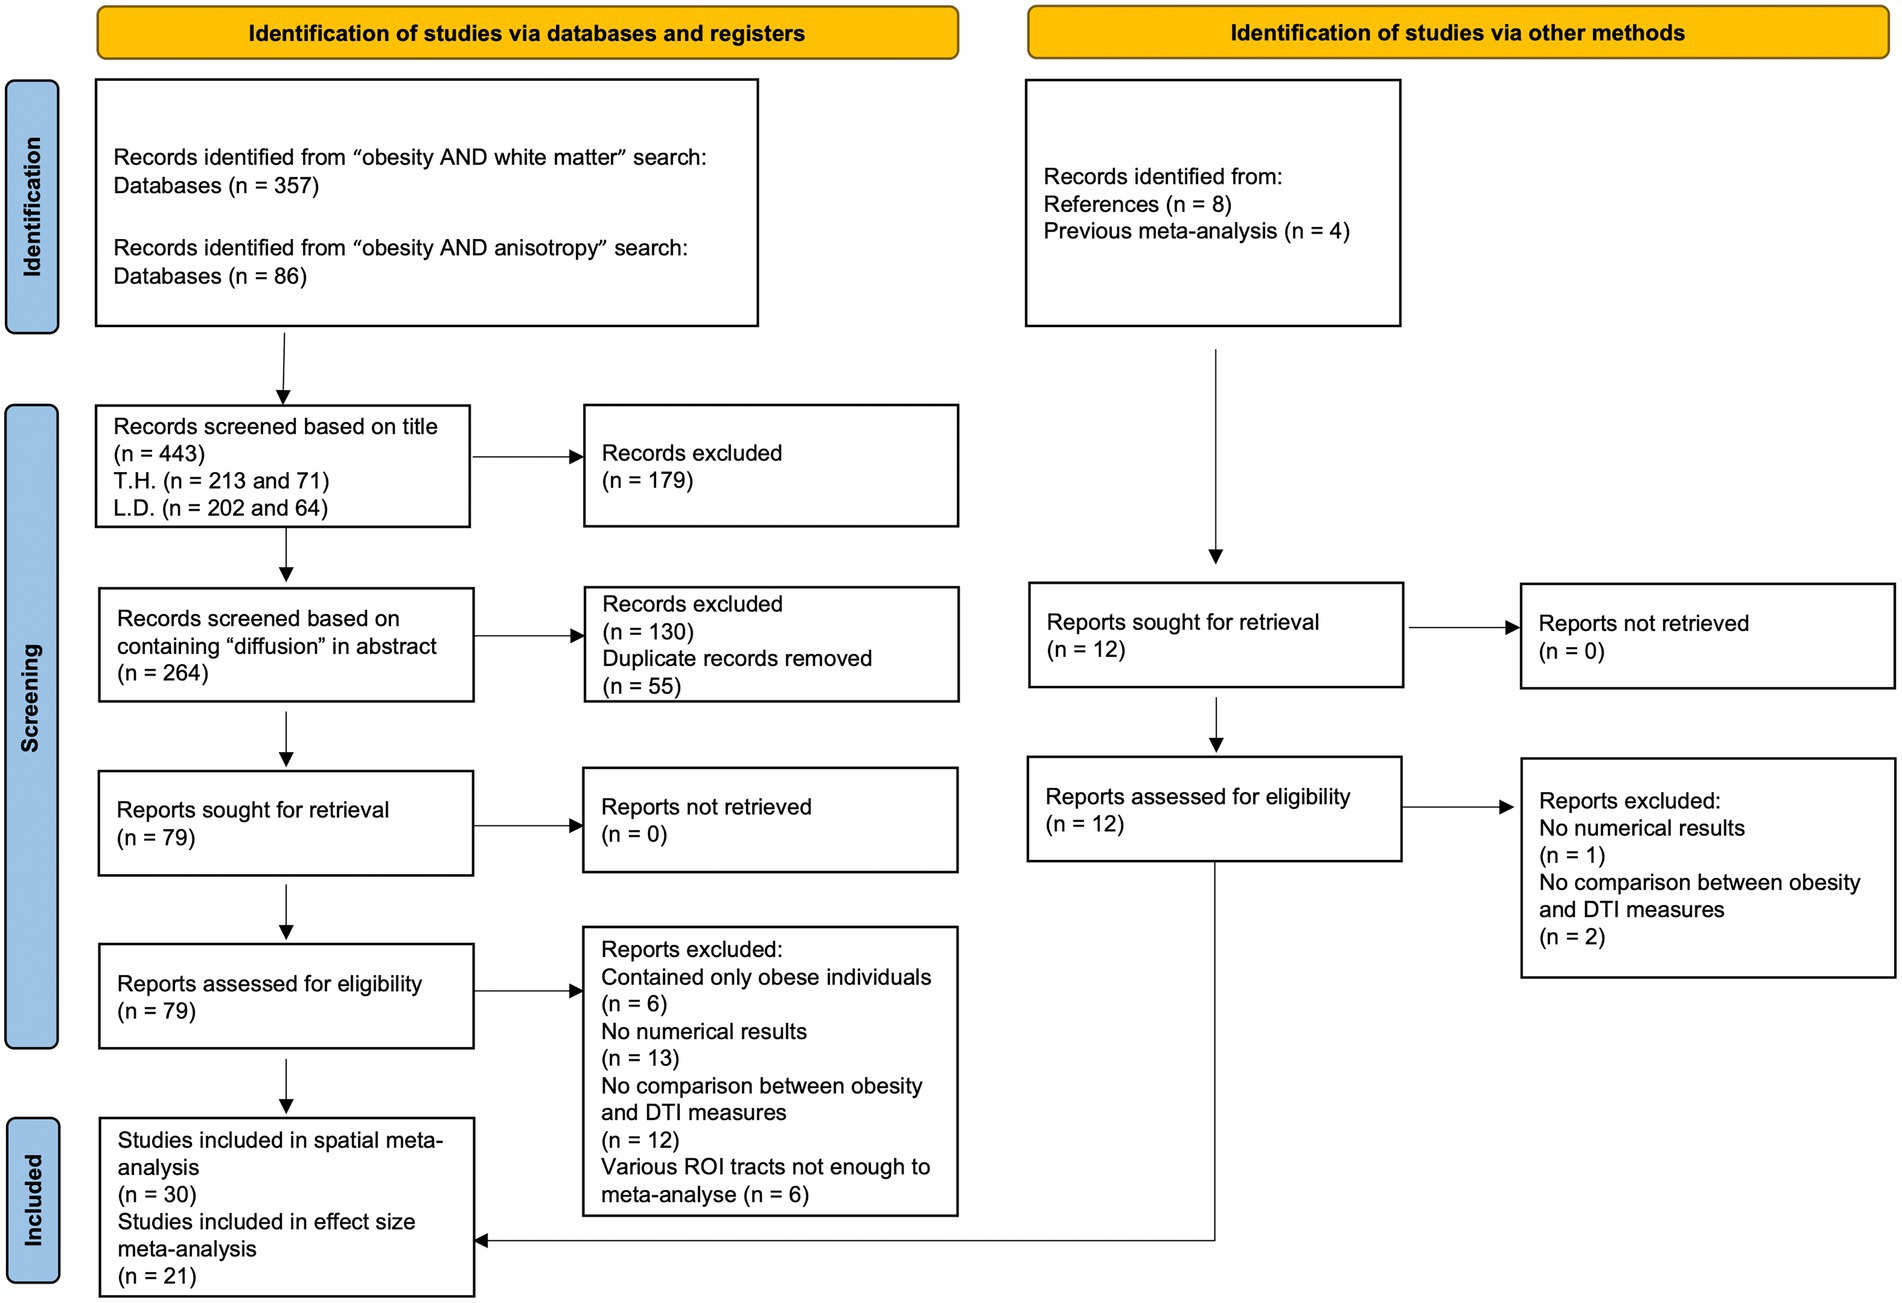
Figure 1. Study selection flow chart. Template adapted from Page et al. (27).
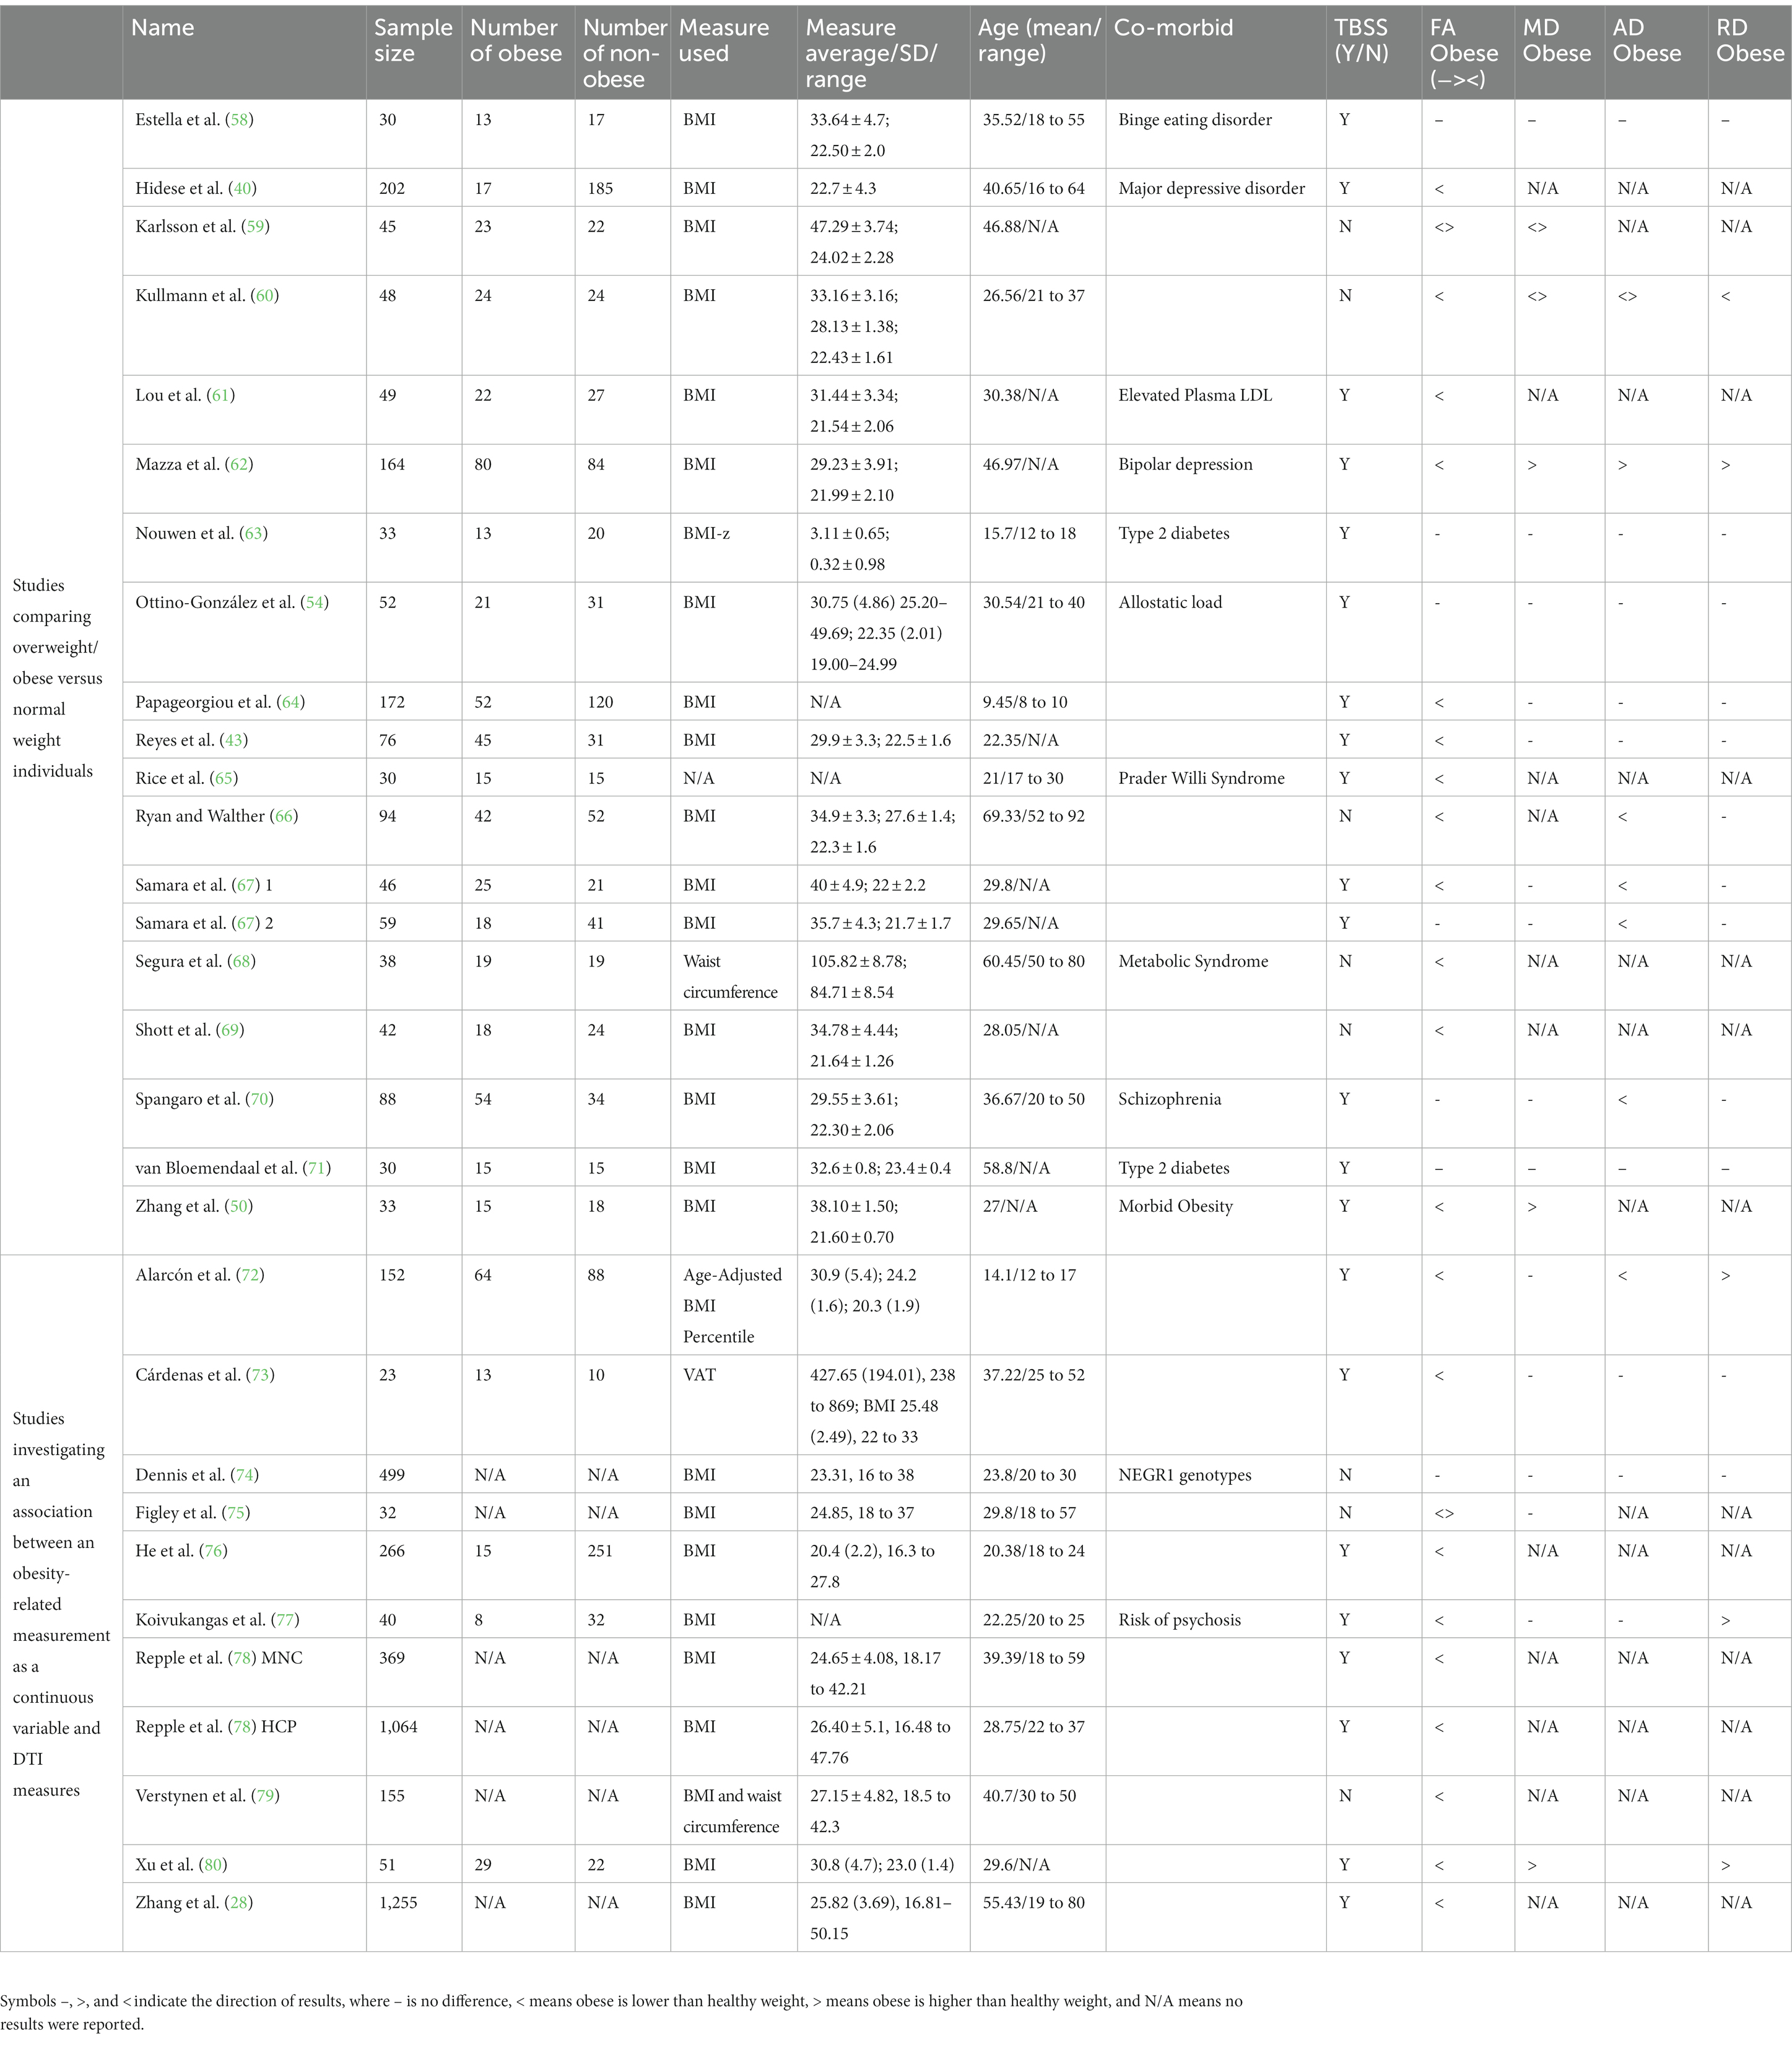
Table 1. Summary of the studies included in the spatial voxel-based meta-analysis.
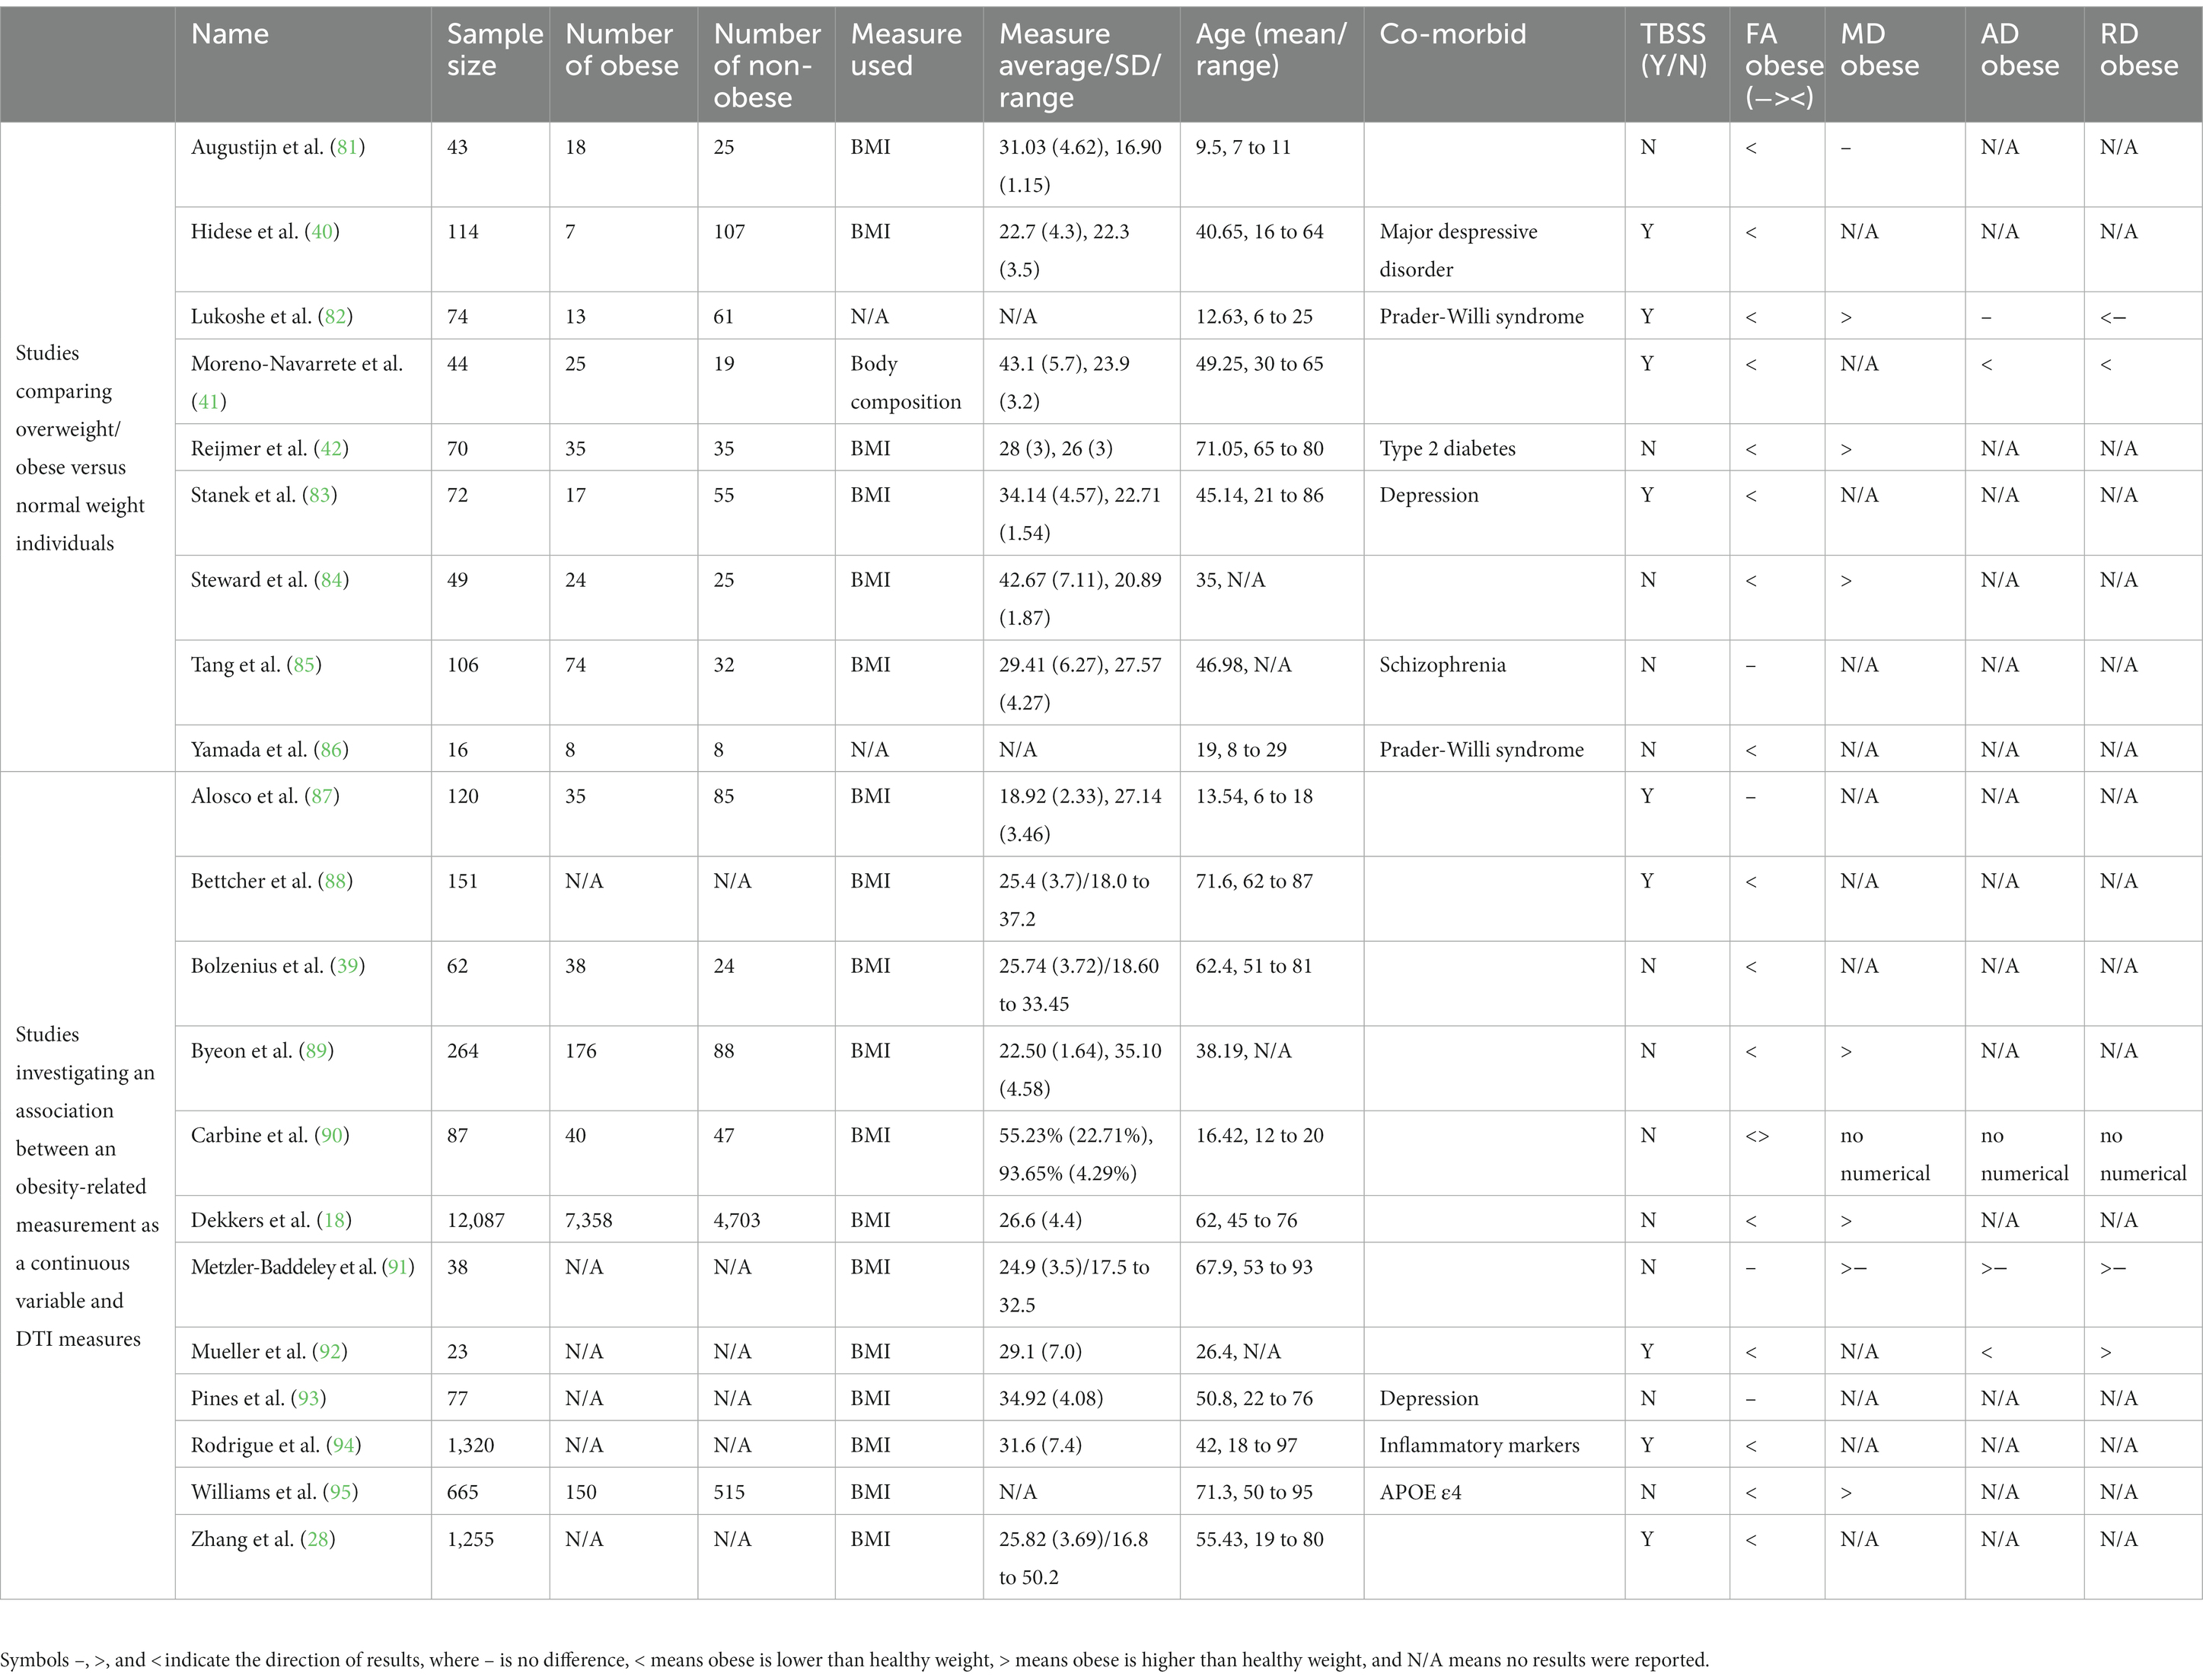
Table 2. Summary of the studies included in the region of interest effect size meta-analysis.
2.2. Eligibility criteria
Only studies that included either whole brain analyses using voxel-based morphometry (VBM) or tract based spatial statistics (TBSS) were used for the voxel-based spatial meta-analysis, while studies providing numerical estimates of effect sizes of fractional anisotropy (FA) from region of interest (ROI) analyses were used for the ROI effect size meta-analysis. We originally planned to additionally look at mean diffusivity (MD), axial diffusivity (AD), and radial diffusivity (RD) but there were too few studies to analyze.
We included studies which analyzed associations between FA and a measure of obesity, including body mass index (BMI), waist-to-hip ratio, waist circumference, body composition (total fat mass or body fat percentage), and body fat distribution as measured by abdominal MRI scans. Some studies compared groups of people with overweight or obesity and normal weight individuals, while others investigated an association between an obesity-related measurement (e.g., BMI, waist circumference, waist-to-hip ratio, total body fat mass, percentage of body fat mass, visceral adipose tissue) as a continuous variable and diffusion tensor imaging (DTI) measures. We jointly analyzed results from both types of analyses.
Our objective was to maximize the scope of literature included in the analyses, and so we set minimum exclusion criteria. Exclusion criteria were set to studies that did not age-match participants, did not test for association between obesity and DTI measures, did not provide numeric results, or did not respond to email requests for data availability. All the whole brain studies provided corrected results.
The initial search identified 443 studies, and two raters, TH and LD independently screened the list of titles and abstracts for inclusion, see Figure 1 for an overview of the study selection.
2.3. Spatial voxel-based meta-analysis
We used the Anisotropic Effect Size Seed-based d Mapping (AES-SDM) method2 (22, 23) for the spatial voxel-based meta-analysis and extracted peak coordinates (x, y, z) and corresponding t-statistics from each study. If the study included a different measure of effect size like a value of p or z-score, these were converted to t-statistics using the SDM software. We contacted the authors of studies that met our inclusion criteria for additional information. With this strategy, we obtained one full t-map (28), and used it jointly with the peak coordinates and t-values from other studies. Inclusion of t-maps improves precision of the results (22). See Table 1 for additional information about each study.
The AES-SDM method uses the peak coordinates and effect size from individual studies, to recreate, for each study, a map of the effect sizes of the statistical associations, and then conduct a standard random-effects variance-weighted meta-analysis in each voxel. This version uses anisotropic kernels, which assign different values to surrounding voxels of a peak coordinate based on spatial correlations between them (23). We assessed potential publication bias via AES-SDM software and used jack-knife analysis to determine the robustness of the results after removing individual studies from the meta-analysis. We preprocessed all data files with the TBSS template based on the FA skeleton (29) included in AES-SDM as it allows combination of VBM and TBSS studies (30). We set all statistical parameters as recommended (anisotropy 1.0, FWHM 20, mask TBSS, voxels 2 mm) and performed a 500-permutation randomization. After calculating meta-analytic means, we applied a combined threshold (p < 0.001, peak threshold > 1) as suggested by Radua et al. (22) but more conservative and discarded clusters comprising fewer than 15 voxels. This method showed an adequate sensitivity and an excellent control of false positives (31). Unlike other methods of coordinate based meta-analyses, the AES-SDM allows for inclusion of studies which showed no statistically significant results and models the relative increases and decreases in the same map. We used FSLeyes software3 to visualize effect sizes by overlaying our results with brain and FA skeleton templates (32). See Table 1. for a description of the studies included in the meta-analysis.
2.4. Effect size ROI meta-analysis
To validate the spatial voxel-based meta-analysis results we conducted an ROI effect size meta-analysis investigating ROI from the spatial meta-analysis and regions most explored in the literature (see Supplementary Table S1 online for a full list of ROI). We manually recorded Cohen’s d (standardized mean difference) effect size measures from individual studies (33). When studies included a different measure of effect size, this was converted to Cohen’s d by standard formula (24). We also recorded other relevant information like confidence intervals and measures of significance, along with sample descriptive statistics, see Table 2.
We used Comprehensive Meta-Analysis Software (CMA) version 3.3.0704 to conduct the ROI meta-analysis. The CMA software can convert different individual study information including effect size, variability, and significance variables of both categorical and continuous studies into one meta-analysis. We performed analyses for regions of interest that had four or more viable studies. Only three studies investigated the anterior thalamic radiation, but we analyzed this region to test for replication of the spatial meta-analysis results. To assess whether results may be driven by a few studies reporting very large effect sizes, we repeated the analyses excluding studies with effect sizes > 1. We Assessed potential publication bias using R 4.0.3 and the metaphor package (v3.0-2; https://www.metafor-project.org/doku.php/metafor). See Table 2 for a description of the studies used in this meta-analysis.
3. Results
3.1. Study characteristics
We included 30 studies in the voxel-based meta-analysis, and 21 in the ROI meta-analysis, see Tables 1 and 2. The spatial meta-analysis included 5,237 participants 8–92 years old, while there were 16,505 participants in the effect size meta-analysis (age range 6–95 years). Most studies reported a negative correlation between FA and obesity, i.e., decreased FA in overweight or obese individuals, in both the voxel-based (23 out of 30 studies) and ROI datasets (17 out of 21 studies). Obesity was mainly measured using BMI, or adjusted BMI measures, but other weight measures were not excluded. See Supplementary Tables S2 and S3 online for detailed description of the included studies.
3.2. Spatial voxel-based meta-analysis results
The AES-SDM meta-analysis indicated that obesity measures were related to reduced FA values in several white matter regions, including the right and left genu of the corpus callosum (MNI = 22, 32, 12; MNI = −18, 30, 16), left splenium of the corpus callosum (MNI = −8, −28, 16), middle cerebellar peduncles (MNI = −38, −56, −38), anterior thalamic radiation (MNI = 14, −26, 12), right cortico-spinal projections (MNI = 4, −30, −24), and the left cerebellum (MNI = −16, −60, −40) see Table 3; Figure 2 for details. We did not find any region with increased FA in obesity. Jack-knife analysis reliably reproduced each cluster except the left cerebellum, which was present only in 8 out of 30 iterations (see Table 3). We did a subgroup analysis in adults where the corpus callosum (MNI = 22, 32, 12; p > 0.001), and middle cerebellar peduncles (MNI = −24, −66, −36; p > 0.001) clusters were replicated. No potential publication bias was detected except for the left cerebellum, where the Egger test was statistically significant (p = 0.042; see Table 3).
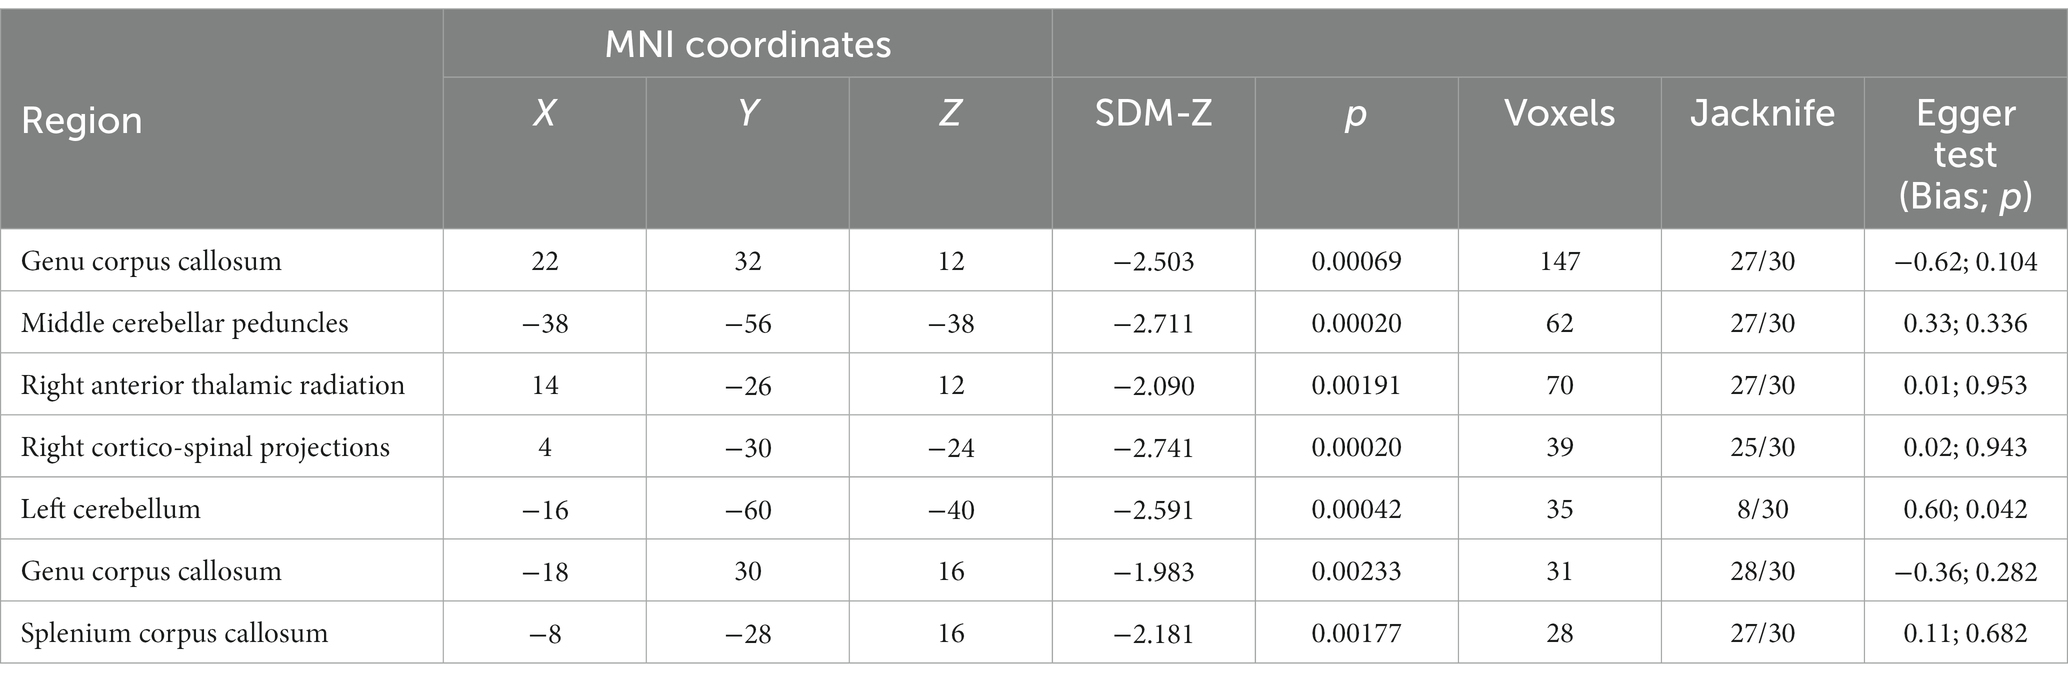
Table 3. Results of SDM spatial voxel-based meta-analysis.
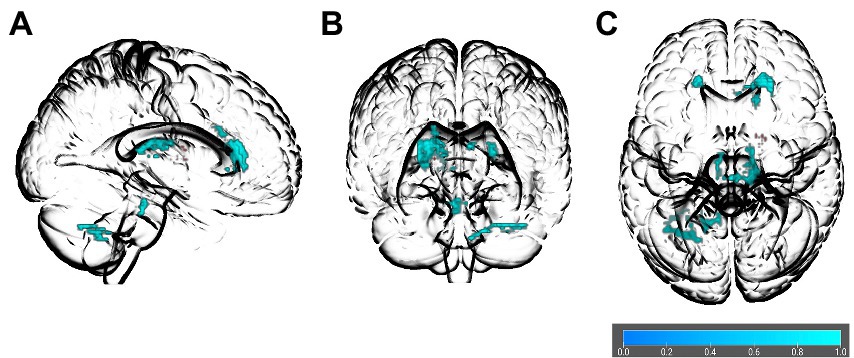
Figure 2. Glass brain of association between obesity and FA in the spatial voxel-based meta-analysis results. The orientations are (A) right sagittal, (B) anterior coronal, and (C) superior axial. Colored bar indicates values of 1–p.
3.3. Region of interest meta-analysis results and validation of spatial meta-analysis findings
Relative to controls, obese individuals had lower FA in some of the same regions as those identified in the spatial voxel-based meta-analysis, including the genu of the corpus callosum (Cohen’s d = −0.263, 95% Confidence Interval –0.423 to –0.103, p = 0.001; see Figure 3A), splenium of the corpus callosum (Cohen’s d = −0.380, 95% Confidence Interval –0.560 to –0.200, p < 0.001; see Figure 3B), and middle cerebellar peduncles (Cohen’s d = −0.157, 95% Confidence Interval-0.174 to-0.139, p < 0.001; see Figure 3C). We found two other ROIs, which showed significantly lower FA in obese individuals as compared to controls of a healthy weight and were not represented in the spatial voxel-based meta-analysis. These included the superior longitudinal fasciculus (Cohen’s d = −0.135, 95% Confidence Interval –0.227 to –0.044, p = 0.004; see Figure 3D), and the fornix which was not significant after removal of a study with a large effect size. Some regions which showed significant associations in spatial meta-analysis, including body of the corpus callosum, uncinate fasciculus, cingulum, parahippocampal cingulum, cortico-spinal tracts, anterior thalamic radiation, showed comparable FA values between people with overweight and obesity and controls in the ROI studies. We did not detect potential publication bias in any region except the splenium of the corpus callosum where the test for funnel plot asymmetry was significant (z = −2.175, p = 0.03).
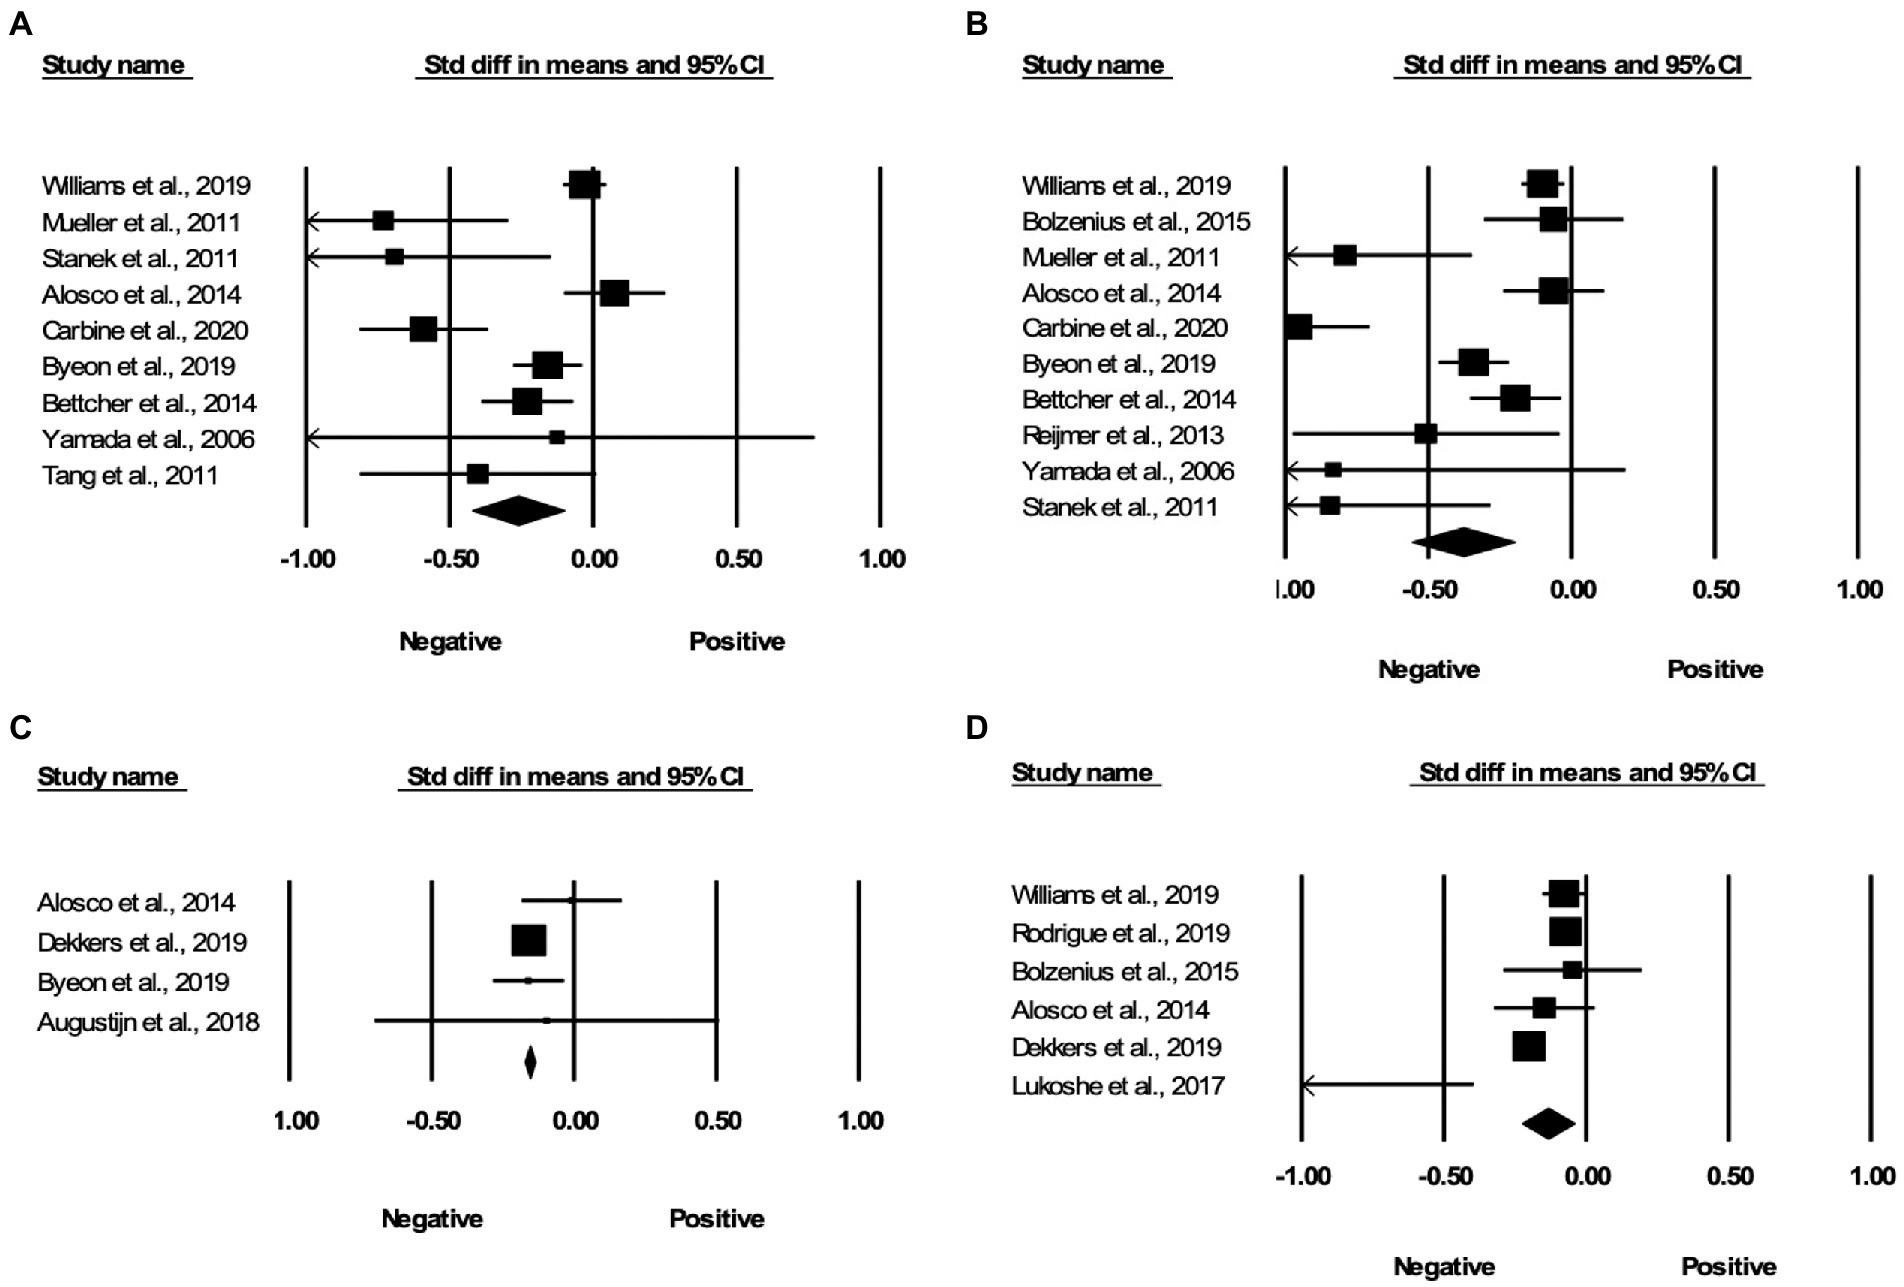
Figure 3. Associations between obesity and FA in the region of interest effect size meta-analyses. Forest plots of the significant findings from the effect size meta-analysis within the regions of (A) genu of the corpus callosum, (B) splenium of the corpus callosum, (C) middle cerebellar peduncles, and (D) superior longitudinal fasciculus.
4. Discussion
In this study, we conducted a spatial voxel-based meta-analysis on obesity and DTI from 30 individual studies to determine which white matter tracts were most frequently associated with obesity. We further validated the spatial voxel-based meta-analysis results in a ROI effect size meta-analysis of an additional 21 studies. The spatial meta-analysis suggested that overweight and obesity were associated with lower FA in the left and right genu of the corpus callosum, left splenium, middle cerebellar peduncles, anterior thalamic radiation, right cortico-spinal projections, and the left cerebellum. However, the left cerebellum changes were only reproduced in 8/30 iterations in the jack-knife analysis (see Table 3). The effect size meta-analysis results replicated the negative associations between overweight and obesity and FA in the genu and splenium of the corpus callosum, as well as the middle cerebellar peduncles. Additionally, we found that the superior longitudinal fasciculus, which was not represented in the spatial meta-analysis results, also showed reduced FA in people with overweight and obesity. The effect size of overweight and obesity related changes in these regions ranged from –0.135 to –0.38 (see Figure 3).
A recent spatial meta-analysis also investigated the association between obesity and white matter microstructure, however there were some differences between the present study and the previous meta-analysis. Our meta-analysis contained 30 studies, while the previous study contained 16 studies due to restrictive exclusion criteria limiting studies including children or individuals with psychiatric conditions (26). Obesity in the developed world typically starts early in childhood or adolescence (34, 35). Also, many patients who are overweight or obese will have co-morbid conditions such as anxiety, depression, diabetes, or metabolic syndrome (3, 4, 8–10), and excluding these individuals is not representative of the general population. In addition, the previous study performed a spatial voxel-based meta-analysis, whereas for the first time we performed a ROI effect size meta-analysis for validation of the spatial voxel-based meta-analysis results. The ROI effect size meta-analysis contained an additional 21 studies with a range of regions including a breakdown of the corpus callosum and other regions not shown in the spatial analysis, with a combined total of 16,505 participants. We replicated the results of the previous spatial meta-analysis, finding reduced FA values for the genu of the corpus callosum in people with overweight or obesity as compared to healthy weight individuals, and expanded these findings to the splenium of the corpus callosum, and middle cerebellar peduncles which were both validated in the ROI effect size meta-analysis.
If we overlay the white matter changes found in this study with the obesity related gray matter changes from the previous meta-analysis, they fall in three distinct networks (17). The corticospinal tract from our spatial voxel-based meta-analysis, passes through the middle cerebellar peduncles as a part of the corticopontocerebellar pathway, (36) which may be linked to reduced exercise or mobility in obesity (37, 38). The splenium of the corpus callosum is implicated in the default mode network (39), which is involved at rest in self-referential processes (40). We also found significant association between obesity and reduced FA in the genu of the corpus callosum, which has afferent projections to the prefrontal cortex (41, 42) and is a part of the executive control network (17). The default mode network and the executive control network may be implicated in the cognitive deficits in obesity (37, 38, 43–45).
We cannot infer causality from cross-sectional studies. Reduced FA in specific regions of the brain may either predispose an individual to obesity, or the changes could be a consequence of obesity. The spatial location of changes could help us infer the direction of association. If obesity damages the brain, we would expect to find diffuse alterations. The white matter correlates of obesity in this meta-analysis were not diffuse, but rather localized to only a few tracts and a few specific networks. This may indicate that white matter changes in specific circuits involving executive functioning or default mode network predispose to obesity.
Evidence of reduced FA generally suggests water diffusion is isotropic, or the fiber bundles are less organized (46), but there are many other theories including a decrease in myelination of axons in white matter (47, 48) or edema, although this is unclear and mean diffusivity is a better predictor (49, 50). The mechanisms through which obesity contributes to these changes are unknown, and maybe multifold instead of a singular mechanism, but some plausible candidates include systemic inflammation (51), the overactivation of microglia (52, 53), stress (54), microvascular changes, insulin resistance, hyperglycemia, plasticity related to lower mobility, or genetic predisposition to brain changes which increase the risk of obesity.
The present study was a starting point to establish the location of brain changes in overweight and obesity and associated effect sizes of these differences. Due to the cross-sectional nature of this study, we cannot determine causality between brain changes and obesity or the underlying mechanisms. However, to determine causality, future studies should either employ a longitudinal design or a mendelian randomization study. An alternative is studying obesity in animals due to the ability to control their environment throughout the lifespan.
As with any meta-analysis, we are limited by the information provided in published studies and cannot control the reporting of results including those that might be negative and not published. We were not able to analyze MD, AD, and RD associations with overweight and obesity as these measures were reported only in a minority of studies. Of the 79 studies originally read to determine suitability for inclusion in this study, many articles did not meet the criteria for inclusion by not reporting the respective statistics, including the peak coordinates, t-values, or sample sizes. It is very important for future studies to maintain a high standard for reporting results and follow reporting guidelines (55, 56). There is an argument after seeing much variability in the pre-processing and processing of DTI data around the world for a standardizing pipeline as in the Enhancing NeuroImaging Genetics through Meta-Analysis (ENIGMA) consortium studies (57), which would remove some methodological variability. The methods of scanning had heterogeneity due to different magnet strengths, although many were 3.0 T, and different MRI manufacturers. Our meta-analyses contained varying ages from children to the elderly. Although FA is not reliable when comparing across wide age spans, this was less of a problem for this study as the studies were age matched, containing children with overweight or obesity comparing FA with children of a healthy weight, and other studies with older adults comparing similar age ranges. Most studies in the present meta-analyses primarily used BMI as a measure of obesity, however, a few studies used body composition, waist circumference, or visceral adipose tissue. It would be preferable to compare measures of obesity using the same metric, but we are limited to the methodology provided in previous studies. The clusters we found were small, but the highly localized nature of the findings could have interesting implications. We provided some plausible explanations for the results of these meta-analyses, but the underlying mechanisms of obesity, and inferring causality for specific FA differences are questions that cannot be answered via a cross-sectional design as in this study, as this would require a prospective study to look at changes over time.
A strength of this study is our replication and extension of the previous meta-analysis (26) results indicating association between overweight and obesity and lower FA in the genu of the corpus callosum in a larger sampling of studies, which was also extended to the middle cerebellar peduncles and splenium of the corpus callosum in our voxel-based meta-analysis and validated in the ROI effect size meta-analysis. Our combination of spatial voxel-based and ROI effect size meta-analysis allowed us to obtain information about location and extent of any changes, as well as to check for replication among different sets of studies. The replication of exploratory findings in the spatial voxel-based meta-analysis by ROI effect size meta-analysis suggested that some of our findings were robust and not false positive.
To conclude, we found replicated associations of lower FA in the genu and splenium of the corpus callosum as well as the middle cerebellar peduncles with overweight and obesity. The extent of these obesity related alterations was a small to medium effect, but the main findings were highly replicated across different studies and meta-analyses. Since we currently do not know the mechanism behind brain changes in overweight and obesity, future studies should determine whether lower FA in these regions are a consequence or cause of obesity. Ultimately, we would need prospective longitudinal designs to clarify this question.
Data availability statement
The original contributions presented in the study are included in the article/Supplementary material, further inquiries can be directed to the corresponding author.
Author contributions
LD and TH were responsible for designing the search strategy for relevant literature, identifying relevant articles, and screening articles based on title and abstract. LD was responsible for assessing articles for eligibility, extracting, and analyzing the data, interpreting results, creating the figures and tables, and writing the manuscript. SM was responsible for assisting in the data analysis. JR was responsible for assisting in the data analysis and interpretation. TH and JR contributed to the manuscript and provided feedback. All authors contributed to the article and approved the submitted version.
Funding
This study was supported by funding from the Canadian Institutes of Health Research (142255 and 180449).
Conflict of interest
The authors declare that the research was conducted in the absence of any commercial or financial relationships that could be construed as a potential conflict of interest.
Publisher’s note
All claims expressed in this article are solely those of the authors and do not necessarily represent those of their affiliated organizations, or those of the publisher, the editors and the reviewers. Any product that may be evaluated in this article, or claim that may be made by its manufacturer, is not guaranteed or endorsed by the publisher.
Supplementary material
The Supplementary material for this article can be found online at: https://www.frontiersin.org/articles/10.3389/fnut.2023.1108360/full#supplementary-material
Footnotes
References
1. Statistics Canada. Overweight and obese adults, 2018. Stat Canada. (2019) Available at: https://www150.statcan.gc.ca/n1/pub/82-625-x/2019001/article/00005-eng.htm
2. World Health Organization. Obesity and Overweight (2021) Available at: https://www.who.int/news-room/fact-sheets/detail/obesity-and-overweight
3. Mc Auley, MT. Effects of obesity on cholesterol metabolism and its implications for healthy ageing. Nutr Res Rev. (2020) 33:121–33. doi: 10.1017/S0954422419000258
4. Lazar, MA. How obesity causes diabetes: not a tall tale. Science. (2005) 307:373–5. doi: 10.1126/SCIENCE.1104342
5. Lu, Y, Hajifathalian, K, Ezzati, M, Woodward, M, Rimm, EB, Danaei, G, et al. Metabolic mediators of the effects of body-mass index, overweight, and obesity on coronary heart disease and stroke: a pooled analysis of 97 prospective cohorts with 1·8 million participants. Lancet. (2013) 383:970–83. doi: 10.1016/S0140-6736(13)61836-X
6. Kotsis, V, Stabouli, S, Papakatsika, S, Rizos, Z, and Parati, G. Mechanisms of obesity-induced hypertension. Hypertens Res. (2010) 33:386–93. doi: 10.1038/hr.2010.9
7. Van Gaal, LF, Mertens, IL, and De Block, CE. Mechanisms linking obesity with cardiovascular disease. Nat. (2006) 444:875–80. doi: 10.1038/nature05487
8. Després, JP, and Lemieux, I. Abdominal obesity and metabolic syndrome. Nature. (2006) 444:881–7. doi: 10.1038/nature05488
9. Amiri, S, and Behnezhad, S. Obesity and anxiety symptoms: a systematic review and meta-analysis. Neuropsychiatr. (2019) 33:72–89. doi: 10.1007/S40211-019-0302-9
10. Milaneschi, Y, Simmons, WK, van Rossum, EFC, and Penninx, BW. Depression and obesity: evidence of shared biological mechanisms. Mol Psychiatry. (2018) 24:18–33. doi: 10.1038/s41380-018-0017-5
11. Avila, C, Holloway, AC, Hahn, MK, Morrison, KM, Restivo, M, Anglin, R, et al. An overview of links between obesity and mental health. Curr Obes Rep. (2015) 4:303–10. doi: 10.1007/S13679-015-0164-9/FIGURES/1
12. Razay, G, Vreugdenhil, A, and Wilcock, G. Obesity, abdominal obesity and Alzheimer disease. Dement Geriatr Cogn Disord. (2006) 22:173–6. doi: 10.1159/000094586
13. Moroz, N, Tong, M, Longato, L, Xu, H, and De La Monte, SM. Limited Alzheimer-type Neurodegeneration in experimental obesity and type 2 diabetes mellitus. J Alzheimers Dis. (2008) 15:29–44. doi: 10.3233/JAD-2008-15103
14. Rodriguez-Casado, A, Toledano-Díaz, A, and Toledano, A. Defective insulin Signalling, mediated by inflammation, connects obesity to Alzheimer disease; relevant pharmacological therapies and preventive dietary interventions. Curr Alzheimer Res. (2017) 14:894–911. doi: 10.2174/1567205014666170316161848
15. Dragioti, E, Radua, J, Solmi, M, Arango, C, Oliver, D, Cortese, S, et al. Global population attributable fraction of potentially modifiable risk factors for mental disorders: a meta-umbrella systematic review. Mol Psychiatry. (2022) 27:3510–9. doi: 10.1038/s41380-022-01586-8
16. Zhang, Y, Ji, G, Xu, M, Cai, W, Zhu, Q, Qian, L, et al. Recovery of brain structural abnormalities in morbidly obese patients after bariatric surgery. Int J Obes. (2016) 40:1558–65. doi: 10.1038/IJO.2016.98
17. García-García, I, Michaud, A, Dadar, M, Zeighami, Y, Neseliler, S, Collins, DL, et al. Neuroanatomical differences in obesity: meta-analytic findings and their validation in an independent dataset. Int J Obes. (2019) 43:943–51. doi: 10.1038/s41366-018-0164-4
18. Dekkers, IA, Jansen, PR, and Lamb, HJ. Obesity, brain volume, and White matter microstructure at MRI: a Cross-sectional UK biobank study. Radiology. (2019) 291:763–71. doi: 10.1148/RADIOL.2019181012
19. Janowitz, D, Wittfeld, K, Terock, J, Freyberger, HJ, Hegenscheid, K, Völzke, H, et al. Association between waist circumference and gray matter volume in 2344 individuals from two adult community-based samples. NeuroImage. (2015) 122:149–57. doi: 10.1016/J.NEUROIMAGE.2015.07.086
20. McWhinney, SR, Abé, C, Alda, M, Benedetti, F, Bøen, E, del Mar, BC, et al. Association between body mass index and subcortical brain volumes in bipolar disorders–ENIGMA study in 2735 individuals. Mol Psychiatry. (2021) Epub ahead:) 26:6806–19. doi: 10.1038/s41380-021-01098-x
21. Kullmann, S, Schweizer, F, Veit, R, Fritsche, A, and Preissl, H. Compromised white matter integrity in obesity. Obes Rev. (2015) 16:273–81. doi: 10.1111/obr.12248
22. Radua, J, Mataix-Cols, D, Phillips, ML, El-Hage, W, Kronhaus, DM, Cardoner, N, et al. A new meta-analytic method for neuroimaging studies that combines reported peak coordinates and statistical parametric maps. Eur Psychiatry. (2012) 27:605–11. doi: 10.1016/J.EURPSY.2011.04.001
23. Radua, J, Rubia, K, Canales-Rodríguez, EJ, Pomarol-Clotet, E, Fusar-Poli, P, and Mataix-Cols, D. Anisotropic kernels for coordinate-based meta-analyses of neuroimaging studies. Front Psych. (2014) 5:13. doi: 10.3389/FPSYT.2014.00013/BIBTEX
24. Borenstein, M, and Hedges, L V. Higgins, JPT, and Rothstein, HR. Introduction to Meta-Analysis. John Wiley & Sons. (2009).
25. Murayama, K, Pekrun, R, and Fiedler, K. Research Practices That can Prevent an Inflation of False-Positive Rates. Pers Soc Psychol Rev. (2013) 18:107–18. doi: 10.1177/1088868313496330
26. Daoust, J, Schaffer, J, Zeighami, Y, Dagher, A, García-García, I, and Michaud, A. White matter integrity differences in obesity: a meta-analysis of diffusion tensor imaging studies. Neurosci Biobehav Rev. (2021) 129:133–41. doi: 10.1016/J.NEUBIOREV.2021.07.020
27. Page, MJ, McKenzie, JE, Bossuyt, PM, Boutron, I, Hoffmann, TC, Mulrow, CD, et al. The PRISMA 2020 statement: an updated guideline for reporting systematic reviews. BMJ. (2021) 372:n71. doi: 10.1136/BMJ.N71
28. Zhang, R, Beyer, F, Lampe, L, Luck, T, Riedel-Heller, SG, Loeffler, M, et al. White matter microstructural variability mediates the relation between obesity and cognition in healthy adults. NeuroImage. (2018) 172:239–49. doi: 10.1016/J.NEUROIMAGE.2018.01.028
29. Jenkinson, M, Beckmann, CF, Behrens, TEJ, Woolrich, MW, and Smith, SM. FSL. NeuroImage. (2012) 62:782–90. doi: 10.1016/J.NEUROIMAGE.2011.09.015
30. Peters, BD, Szeszko, PR, Radua, J, Ikuta, T, Gruner, P, Derosse, P, et al. White matter development in adolescence: diffusion tensor imaging and meta-analytic results. Schizophr Bull. (2012) 38:1308–17. doi: 10.1093/SCHBUL/SBS054
31. Radua, J, Borgwardt, S, Crescini, A, Mataix-Cols, D, Meyer-Lindenberg, A, McGuire, PK, et al. Multimodal meta-analysis of structural and functional brain changes in first episode psychosis and the effects of antipsychotic medication. Neurosci Biobehav Rev. (2012) 36:2325–33. doi: 10.1016/J.NEUBIOREV.2012.07.012
33. Hajek, T, Alda, M, Hajek, E, and Ivanoff, J. Functional neuroanatomy of response inhibition in bipolar disorders–combined voxel based and cognitive performance meta-analysis. J Psychiatr Res. (2013) 47:1955–66. doi: 10.1016/j.jpsychires.2013.08.015
34. Kansra, AR, Lakkunarajah, S, and Jay, MS. Childhood and adolescent obesity: a review. Front Pediatr. (2021) 8:581461. doi: 10.3389/FPED.2020.581461
35. Sahoo, K, Sahoo, B, Choudhury, AK, Sofi, NY, Kumar, R, and Bhadoria, AS. Childhood obesity: causes and consequences. J Fam Med Prim Care. (2015) 4:187–92. doi: 10.4103/2249-4863.154628
36. Palesi, F, De Rinaldis, A, Castellazzi, G, Calamante, F, Muhlert, N, Chard, D, et al. Contralateral cortico-ponto-cerebellar pathways reconstruction in humans in vivo: implications for reciprocal cerebro-cerebellar structural connectivity in motor and non-motor areas. Sci Rep. (2017) 7:12841–13. doi: 10.1038/s41598-017-13079-8
37. Hidese, S, Ota, M, Matsuo, J, Ishida, I, Hiraishi, M, Yoshida, S, et al. Association of obesity with cognitive function and brain structure in patients with major depressive disorder. J Affect Disord. (2018) 225:188–94. doi: 10.1016/J.JAD.2017.08.028
38. Moreno-Navarrete, JM, Blasco, G, Puig, J, Biarnés, C, Rivero, M, Gich, J, et al. Neuroinflammation in obesity: circulating lipopolysaccharide-binding protein associates with brain structure and cognitive performance. Int J Obes. (2017) 41:1627–35. doi: 10.1038/IJO.2017.162
39. Skandalakis, GP, Komaitis, S, Kalyvas, A, Lani, E, Kontrafouri, C, Drosos, E, et al. Dissecting the default mode network: direct structural evidence on the morphology and axonal connectivity of the fifth component of the cingulum bundle. J Neurosurg. (2020) 134:1–12. doi: 10.3171/2020.2.JNS193177
40. Raichle, ME. The Brain’s default mode network. Annu Rev Neurosci. (2015) 38:433–47. doi: 10.1146/ANNUREV-NEURO-071013-014030
41. Hofer, S, and Frahm, J. Topography of the human corpus callosum revisited--comprehensive fiber tractography using diffusion tensor magnetic resonance imaging. NeuroImage. (2006) 32:989–94. doi: 10.1016/J.NEUROIMAGE.2006.05.044
42. Fabri, M, Pierpaoli, C, Barbaresi, P, and Polonara, G. Functional topography of the corpus callosum investigated by DTI and fMRI. World J Radiol. (2014) 6:895–906. doi: 10.4329/WJR.V6.I12.895
43. Bolzenius, JD, Laidlaw, DH, Cabeen, RP, Conturo, TE, McMichael, AR, Lane, EM, et al. Brain structure and cognitive correlates of body mass index in healthy older adults. Behav Brain Res. (2015) 278:342–7. doi: 10.1016/J.BBR.2014.10.010
44. Reijmer, YD, Brundel, M, De Bresser, J, Kappelle, LJ, Leemans, A, and Biessels, GJ. Microstructural white matter abnormalities and cognitive functioning in type 2 diabetes: a diffusion tensor imaging study. Diabetes Care. (2013) 36:137–44. doi: 10.2337/DC12-0493
45. Reyes, S, de Medeiros, RC, Lozoff, B, Biswal, BB, Peirano, P, and Algarin, C. Assessing cognitive control and the reward system in overweight young adults using sensitivity to incentives and white matter integrity. PLoS One. (2020) 15:e0233915. doi: 10.1371/JOURNAL.PONE.0233915
46. Alba-Ferrara, LM, and de Erausquin, GA. What does anisotropy measure? Insights from increased and decreased anisotropy in selective fiber tracts in schizophrenia. Front Integr Neurosci. (2013) 7:9. doi: 10.3389/FNINT.2013.00009/BIBTEX
47. Song, SK, Sun, SW, Ramsbottom, MJ, Chang, C, Russell, J, and Cross, AH. Dysmyelination revealed through MRI as increased radial (but unchanged axial) diffusion of water. NeuroImage. (2002) 17:1429–36. doi: 10.1006/NIMG.2002.1267
48. Nair, G, Tanahashi, Y, Hoi, PL, Billings-Gagliardi, S, Schwartz, WJ, and Duong, TQ. Myelination and long diffusion times alter diffusion-tensor-imaging contrast in myelin-deficient shiverer mice. NeuroImage. (2005) 28:165–74. doi: 10.1016/J.NEUROIMAGE.2005.05.049
49. Kimura-Ohba, S, Yang, Y, Thompson, J, Kimura, T, Salayandia, VM, Cosse, M, et al. Transient increase of fractional anisotropy in reversible vasogenic edema. J Cereb Blood Flow Metab. (2016) 36:1731–43. doi: 10.1177/0271678X16630556
50. Zhang, LJ, Zhong, J, and Lu, GM. Multimodality MR imaging findings of low-grade brain edema in hepatic encephalopathy. Am J Neuroradiol. (2013) 34:707–15. doi: 10.3174/AJNR.A2968
51. Stȩpień, M, Stȩpień, A, Wlazeł, RN, Paradowski, M, Banach, M, and Rysz, J. Obesity indices and inflammatory markers in obese non-diabetic normo-and hypertensive patients: a comparative pilot study. Lipids Health Dis. (2014) 13:29. doi: 10.1186/1476-511X-13-29
52. De Souza, CT, Araujo, EP, Bordin, S, Ashimine, R, Zollner, RL, Boschero, AC, et al. Consumption of a fat-rich diet activates a Proinflammatory response and induces insulin resistance in the hypothalamus. Endocrinology. (2005) 146:4192–9. doi: 10.1210/EN.2004-1520
53. Baufeld, C, Osterloh, A, Prokop, S, Miller, KR, and Heppner, FL. High-fat diet-induced brain region-specific phenotypic spectrum of CNS resident microglia. Acta Neuropathol. (2016) 132:361–75. doi: 10.1007/S00401-016-1595-4/FIGURES/7
54. Ottino-González, J, Jurado, MA, García-García, I, Segura, B, Marqués-Iturria, I, Sender-Palacios, MJ, et al. Allostatic load and disordered white matter microstructure in overweight adults. Sci Rep. (2018) 8:15898. doi: 10.1038/S41598-018-34219-8
55. Reddan, MC, Lindquist, MA, and Wager, TD. Effect size estimation in neuroimaging. JAMA Psychiat. (2017) 74:207–8. doi: 10.1001/JAMAPSYCHIATRY.2016.3356
56. Soares, JM, Marques, P, Alves, V, and Sousa, N. A hitchhiker’s guide to diffusion tensor imaging. Front Neurosci. (2013) 7:31. doi: 10.3389/FNINS.2013.00031/BIBTEX
57. Favre, P, Pauling, M, Stout, J, Hozer, F, Sarrazin, S, Abé, C, et al. Widespread white matter microstructural abnormalities in bipolar disorder: evidence from mega-and meta-analyses across 3033 individuals. Neuropsychopharmacology. (2019) 44:2285–93. doi: 10.1038/s41386-019-0485-6
58. Estella, NM, Sanches, LG, Maranhão, MF, Hoexter, MQ, Schmidt, U, Campbell, IC, et al. Brain white matter microstructure in obese women with binge eating disorder. Eur Eat Disord Rev. (2020) 28:525–35. doi: 10.1002/ERV.2758
59. Karlsson, HK, Tuulari, JJ, Hirvonen, J, Lepomäki, V, Parkkola, R, Hiltunen, J, et al. Obesity is associated with white matter atrophy: a combined diffusion tensor imaging and voxel-based morphometric study. Obesity (Silver Spring). (2013) 21:2530–7. doi: 10.1002/OBY.20386
60. Kullmann, S, Callaghan, MF, Heni, M, Weiskopf, N, Scheffler, K, Häring, HU, et al. Specific white matter tissue microstructure changes associated with obesity. NeuroImage. (2016) 125:36–44. doi: 10.1016/J.NEUROIMAGE.2015.10.006
61. Lou, B, Chen, M, Luo, X, and Dai, Y. Reduced right frontal fractional anisotropy correlated with early elevated plasma LDL levels in obese young adults. PLoS One. (2014) 9:e108180. doi: 10.1371/JOURNAL.PONE.0108180
62. Mazza, E, Poletti, S, Bollettini, I, Locatelli, C, Falini, A, Colombo, C, et al. Body mass index associates with white matter microstructure in bipolar depression. Bipolar Disord. (2017) 19:116–27. doi: 10.1111/BDI.12484
63. Nouwen, A, Chambers, A, Chechlacz, M, Higgs, S, Blissett, J, Barrett, TG, et al. Microstructural abnormalities in white and gray matter in obese adolescents with and without type 2 diabetes. NeuroImage Clin. (2017) 16:43–51. doi: 10.1016/J.NICL.2017.07.004
64. Papageorgiou, I, Astrakas, LG, Xydis, V, Alexiou, GA, Bargiotas, P, Tzarouchi, L, et al. Abnormalities of brain neural circuits related to obesity: a diffusion tensor imaging study. Magn Reson Imaging. (2017) 37:116–21. doi: 10.1016/J.MRI.2016.11.018
65. Rice, LJ, Lagopoulos, J, Brammer, M, and Einfeld, SL. Microstructural white matter tract alteration in Prader-Willi syndrome: a diffusion tensor imaging study. Am J Med Genet C Semin Med Genet. (2017) 175:362–7. doi: 10.1002/AJMG.C.31572
66. Ryan, L, and Walther, K. White matter integrity in older females is altered by increased body fat. Obesity (Silver Spring). (2014) 22:2039–46. doi: 10.1002/OBY.20815
67. Samara, A, Murphy, T, Strain, J, Rutlin, J, Sun, P, Neyman, O, et al. Neuroinflammation and white matter alterations in obesity assessed by diffusion basis spectrum imaging. Front Hum Neurosci. (2020) 13:464. doi: 10.3389/FNHUM.2019.00464/BIBTEX
68. Segura, B, Jurado, MA, Freixenet, N, Falcón, C, Junqué, C, and Arboix, A. Microstructural white matter changes in metabolic syndrome: a diffusion tensor imaging study. Neurology. (2009) 73:438–44. doi: 10.1212/WNL.0B013E3181B163CD
69. Shott, ME, Cornier, MA, Mittal, VA, Pryor, TL, Orr, JM, Brown, MS, et al. Orbitofrontal cortex volume and brain reward response in obesity. Int J Obes. (2015) 39:214–21. doi: 10.1038/IJO.2014.121
70. Spangaro, M, Mazza, E, Poletti, S, Cavallaro, R, and Benedetti, F. Obesity influences white matter integrity in schizophrenia. Psychoneuroendocrinology. (2018) 97:135–42. doi: 10.1016/J.PSYNEUEN.2018.07.017
71. van Bloemendaal, L, Ijzerman, RG, ten Kulve, JS, Barkhof, F, Diamant, M, Veltman, DJ, et al. Alterations in white matter volume and integrity in obesity and type 2 diabetes. Metab Brain Dis. (2016) 31:621–9. doi: 10.1007/S11011-016-9792-3
72. Alarcón, G, Ray, S, and Nagel, BJ. Lower working memory performance in overweight and obese adolescents is mediated by White matter microstructure. J Int Neuropsychol Soc. (2016) 22:281–92. doi: 10.1017/S1355617715001265
73. Cárdenas, D, Madinabeitia, I, Vera, J, de Teresa, C, Alarcón, F, Jiménez, R, et al. Better brain connectivity is associated with higher total fat mass and lower visceral adipose tissue in military pilots. Sci Rep. (2020) 10:610–7. doi: 10.1038/s41598-019-57345-3
74. Dennis, EL, Jahanshad, N, Braskie, MN, Warstadt, NM, Hibar, DP, Kohannim, O, et al. Obesity gene NEGR1 associated with White matter integrity in healthy young adults. NeuroImage. (2014) 102:548–57. doi: 10.1016/J.NEUROIMAGE.2014.07.041
75. Figley, CR, Asem, JSA, Levenbaum, EL, and Courtney, SM. Effects of body mass index and body fat percent on default mode, executive control, and salience network structure and function. Front Neurosci. (2016) 10:234. doi: 10.3389/FNINS.2016.00234/BIBTEX
76. He, Q, Chen, C, Dong, Q, Xue, G, Chen, C, Lu, ZL, et al. Gray and white matter structures in the midcingulate cortex region contribute to body mass index in Chinese young adults. Brain Struct Funct. (2015) 220:319–29. doi: 10.1007/S00429-013-0657-9
77. Koivukangas, J, Björnholm, L, Tervonen, O, Miettunen, J, Nordström, T, Kiviniemi, V, et al. Body mass index and brain white matter structure in young adults at risk for psychosis–the Oulu brain and mind study. Psychiatry Res Neuroimaging. (2016) 254:169–76. doi: 10.1016/J.PSCYCHRESNS.2016.06.016
78. Repple, J, Opel, N, Meinert, S, Redlich, R, Hahn, T, Winter, NR, et al. Elevated body-mass index is associated with reduced white matter integrity in two large independent cohorts. Psychoneuroendocrinology. (2018) 91:179–85. doi: 10.1016/J.PSYNEUEN.2018.03.007
79. Verstynen, TD, Weinstein, A, Erickson, KI, Sheu, LK, Marsland, AL, and Gianaros, PJ. Competing physiological pathways link individual differences in weight and abdominal adiposity to white matter microstructure. NeuroImage. (2013) 79:129–37. doi: 10.1016/J.NEUROIMAGE.2013.04.075
80. Xu, J, Li, Y, Lin, H, Sinha, R, and Potenza, MN. Body mass index correlates negatively with white matter integrity in the fornix and corpus callosum: a diffusion tensor imaging study. Hum Brain Mapp. (2013) 34:1044–52. doi: 10.1002/HBM.21491
81. Augustijn, MJCM, Deconinck, FJA, D’Hondt, E, Van Acker, L, De Guchtenaere, A, Lenoir, M, et al. Reduced motor competence in children with obesity is associated with structural differences in the cerebellar peduncles. Brain Imaging Behav. (2018) 12:1000–10. doi: 10.1007/S11682-017-9760-5
82. Lukoshe, A, Van Den Bosch, GE, Van Der Lugt, A, Kushner, SA, Hokken-Koelega, AC, and White, T. Aberrant White matter microstructure in children and adolescents with the subtype of Prader-Willi syndrome at high risk for psychosis. Schizophr Bull. (2017) 43:1090–9. doi: 10.1093/SCHBUL/SBX052
83. Stanek, KM, Grieve, SM, Brickman, AM, Korgaonkar, MS, Paul, RH, Cohen, RA, et al. Obesity is associated with reduced white matter integrity in otherwise healthy adults. Obesity (Silver Spring). (2011) 19:500–4. doi: 10.1038/OBY.2010.312
84. Steward, T, Picó-Pérez, M, Mestre-Bach, G, Martínez-Zalacaín, I, Suñol, M, Jiménez-Murcia, S, et al. A multimodal MRI study of the neural mechanisms of emotion regulation impairment in women with obesity. Transl. Psychiatry. (2019) 9:194. doi: 10.1038/s41398-019-0533-3
85. Tang, CY, Friedman, JI, Carpenter, DM, Novakovic, V, Eaves, E, Ng, J, et al. The effects of hypertension and body mass index on diffusion tensor imaging in schizophrenia. Schizophr Res. (2011) 130:94–100. doi: 10.1016/J.SCHRES.2011.05.002
86. Yamada, K, Matsuzawa, H, Uchiyama, M, Kwee, IL, and Nakada, T. Brain developmental abnormalities in Prader-Willi syndrome detected by diffusion tensor imaging. Pediatrics. (2006) 118:e442–8. doi: 10.1542/PEDS.2006-0637
87. Alosco, ML, Stanek, KM, Galioto, R, Korgaonkar, MS, Grieve, SM, Brickman, AM, et al. Body mass index and brain structure in healthy children and adolescents. Int J Neurosci. (2014) 124:49–55. doi: 10.3109/00207454.2013.817408
88. Bettcher, BM, Watson, CL, Walsh, CM, Lobach, IV, Neuhaus, J, Miller, JW, et al. Interleukin-6, age, and corpus callosum integrity. PLoS One. (2014) 9:e106521. doi: 10.1371/JOURNAL.PONE.0106521
89. Byeon, K, Park, BY, and Park, H. Spatially guided functional correlation tensor: a new method to associate body mass index and white matter neuroimaging. Comput Biol Med. (2019) 107:137–44. doi: 10.1016/J.COMPBIOMED.2019.02.010
90. Carbine, KA, Duraccio, KM, Hedges-Muncy, A, Barnett, KA, Kirwan, CB, and Jensen, CD. White matter integrity disparities between normal-weight and overweight/obese adolescents: an automated fiber quantification tractography study. Brain Imaging Behav. (2020) 14:308–19. doi: 10.1007/S11682-019-00036-4
91. Metzler-Baddeley, C, Baddeley, RJ, Jones, DK, Aggleton, JP, and O’Sullivan, MJ. Individual differences in fornix microstructure and body mass index. PLoS One. (2013) 8:e59849. doi: 10.1371/JOURNAL.PONE.0059849
92. Mueller, K, Anwander, A, Möller, HE, Horstmann, A, Lepsien, J, Busse, F, et al. Sex-dependent influences of obesity on cerebral white matter investigated by diffusion-tensor imaging. PLoS One. (2011) 6:e18544. doi: 10.1371/JOURNAL.PONE.0018544
93. Pines, AR, Sacchet, MD, Kullar, M, Ma, J, and Williams, LM. Multi-unit relations among neural, self-report, and behavioral correlates of emotion regulation in comorbid depression and obesity. Sci Rep. (2018) 8:14032. doi: 10.1038/s41598-018-32394-2
94. Rodrigue, AL, Knowles, EEM, Mollon, J, Mathias, SR, Koenis, MMG, Peralta, JM, et al. Evidence for genetic correlation between human cerebral white matter microstructure and inflammation. Hum Brain Mapp. (2019) 40:4180–91. doi: 10.1002/HBM.24694
Keywords: obesity, white matter microstructure, fractional anisotropy, diffusion tensor imaging, magnetic resonance imaging, meta-analysis
Citation: Dietze LMF, McWhinney SR, Radua J and Hajek T (2023) Extended and replicated white matter changes in obesity: Voxel-based and region of interest meta-analyses of diffusion tensor imaging studies. Front. Nutr. 10:1108360. doi: 10.3389/fnut.2023.1108360
Edited by:
Michael Berk, Deakin University, AustraliaCopyright © 2023 Dietze, McWhinney, Radua and Hajek. This is an open-access article distributed under the terms of the Creative Commons Attribution License (CC BY). The use, distribution or reproduction in other forums is permitted, provided the original author(s) and the copyright owner(s) are credited and that the original publication in this journal is cited, in accordance with accepted academic practice. No use, distribution or reproduction is permitted which does not comply with these terms.
*Correspondence: Tomas Hajek, tomas.hajek@dal.ca