Normal weight and waist obesity indicated by increased total body fat associated with all-cause mortality in stage 3–5 chronic kidney disease
 Feng-Ching Shen1
  Mei-En Chen2 Wei-Tsung Wu3,4 I-Ching Kuo5
  Sheng-Wen Niu5 Jia-Jung Lee1,6
  Chi-Chih Hung1,6*
  Jer-Ming Chang1,7
  Shang-Jyh Hwang1,7
- 1Division of Nephrology, Department of Internal Medicine, Kaohsiung Medical University Hospital, Kaohsiung Medical University, Kaohsiung, Taiwan
- 2Department of Nutrition and Dietetics, Kaohsiung Medical University Hospital, Kaohsiung, Taiwan
- 3Division of Cardiology, Department of Internal Medicine, Kaohsiung Medical University Hospital, Kaohsiung, Taiwan
- 4Graduate Institute of Clinical Medicine, College of Medicine, Kaohsiung Medical University, Kaohsiung, Taiwan
- 5Department of Internal Medicine, Kaohsiung Municipal Ta-Tung Hospital, Kaohsiung Medical University, Kaohsiung, Taiwan
- 6Regenerative Medicine and Cell Therapy Research Center, Kaohsiung Medical University, Kaohsiung, Taiwan
- 7Faculty of Renal Care, College of Medicine, Kaohsiung Medical University, Kaohsiung, Taiwan
Patients with chronic kidney disease (CKD) demonstrate a survival benefit with a high body mass index (BMI); this is the obesity paradox. Central obesity has a higher prognostic value than BMI, even in those with normal weight. Whether total body fat percentage (TBF%) provides more information than BMI and waist circumference (WC) remains unknown. We included 3,262 Asian patients with stage 3–5 CKD and divided these patients by TBF% and waist-to-height ratio (WHtR) quartiles (Q1–Q4). TBF% was associated with BMI, WC, nutritional markers, and C-reactive protein. In all patients, BMI but not TBF% or WHtR demonstrated a survival paradox. In patients with BMI < 25 kg/m2, but not in those with BMI ≥ 25 kg/m2, TBF% Q4 and WHtR Q4 were associated with all-cause mortality, with hazard ratios [HRs; 95% confidence intervals (CIs)] of 2.35 (1.31–4.22) and 1.38 (1.06–1.80), respectively. The HRs of TBF% Q4 for all-cause mortality were 2.90 (1.50–5.58) in patients with a normal WC and 3.81 (1.93–7.50) in patients with normal weight and normal WC (All P for interaction < 0.05). In conclusion, TBF% can predict all-cause mortality in patients with advanced CKD and a normal weight, normal WC, or both.
Introduction
The obesity epidemic is growing worldwide and thus has received major attention (1); a high body mass index (BMI) has been associated with various comorbidities including type II diabetes mellitus, cardiovascular diseases (2), and a reduction in life expectancy (3). BMI is a compelling predictor for all-cause mortality in the general population; studies have demonstrated a J-shaped relationship between BMI and all-cause mortality in 1.46 million Caucasian adults (4) and a U-shaped relationship in 850 thousand East Asian adults (5). By contrast, high BMI is associated with low all-cause mortality in dialysis (6) and advance chronic kidney disease (CKD) (7) populations; this is called the obesity paradox or reverse epidemiology. Interestingly, obesity protects against the negative effect of weight loss on mortality in the CKD population (8). Many hypotheses of the obesity paradox, including the involvement of body structure, body composition, lipid metabolism, and cytokine production, have been proposed (9).
BMI may not be correlated with fat mass; in the CKD population, its use in adiposity assessment can be affected by factors such as fluid overload (10) and sarcopenia (11). Central obesity is associated with metabolic syndrome (MS), particularly among those with a normal body weight (12). Visceral fat accumulation leads to metabolic and cardiovascular disorders through the proinflammatory, atherogenic, and diabetogenic adipokine secretion (13). Compared with BMI, central obesity may afford different diagnostic power in predicting all-cause mortality in the presence of the obesity paradox (14–17). Our previous studies have revealed an association between central obesity and all-cause mortality in the presence of the obesity paradox in patients with stage 3–5 CKD (18, 19).
Central obesity is associated with visceral fat but not directly correlated with total body fat (TBF) percentage (TBF%). Studies have demonstrated that high TBF% is independently associated with high all-cause mortality in the general population (20) and patients with CKD (21, 22). Differentiating fat mass from fat-free mass (23), particularly in patients with sarcopenic obesity or normal weight obesity (NWO) (21), may be difficult. Increased TBF% is positively associated with muscle weakness and related to mortality in CKD patients (24). NWO, defined as normal BMI with high body fat mass, is associated with increased cardiometabolic disease and all-cause mortality risks (25). Whether NWO, indicated by TBF%, is associated with all-cause mortality in the presence of the obesity paradox in advanced CKD populations remains unknown. Moreover, whether this association can be used to differentiate the effects of visceral fat and TBF warrants investigation.
In this study, we hypothesized that TBF% would predict all-cause mortality in a CKD cohort with the obesity paradox and that the effect would be modified by obesity. We tested this hypothesis in patients with stage 3–5 CKD divided into TBF% and waist-to-height ratio (WHtR) quartiles. We also studied the prognostic value of TBF% and WHtR for all-cause mortality in patients with CKD and normal or high BMI and normal or high waist circumference.
Materials and methods
Study design and participants
This prospective observational study, the Integrated CKD Care Program in Kaohsiung for Delaying Dialysis, involving two affiliated hospitals of Kaohsiung Medical University in Southern Taiwan, was conducted between November 11, 2002, and May 31, 2009, as described previously (18). Here, we extended the follow-up period to December 31, 2014. The inclusion criterion was stage 1–5 CKD without the receipt of any renal replacement therapy. The exclusion criterion was acute kidney injury, defined as a >50% decrease in glomerular filtration rate (eGFR; calculated using the Modification of Diet in Renal Disease equation) within 3 months. To study the impact of TBF% and BMI on all-cause mortality, the included patients were divided into two BMI groups (cutoff: 25 kg/m2) and TBF% quartiles (cutoff: 22.2, 27.4, and 31.9% in men and 27.7, 33.6, and 39.0% in women). Moreover, 65 patients with an extreme BMI (<14.9 or >35.1 kg/m2) were excluded, as in our previous study (18). We included 3,262 patients with stage 3–5 CKD and a BMI of 15.0–35.0 kg/m2.
All patients provided informed consent to participate. The study protocol was approved by the Institutional Review Board of Kaohsiung Medical University Hospital.
Collection of demographic, medical, and laboratory data
The baseline variables comprised demographic features (i.e., age, BMI, waist circumference, and sex), medical history [i.e., cardiovascular disease, hypertension, mean blood pressure (BP), diabetes, Charlson comorbidity index, and MS], and laboratory data [i.e., eGFR; urine protein-to-creatinine ratio (Upcr); and hemoglobin, albumin, C-reactive protein (CRP), total cholesterol, and triglyceride levels]. The demographic features formed the baseline record, and the medical history was obtained through a doctor's chart review and interview with patients. BMI was calculated by dividing weight (in kilograms) by the square of height (in square meters). Waist and hip measurements were performed in accordance with the World Health Organization protocol (26). The WHtR is the waist circumference (in centimeters) divided by height (in centimeters). Multiple frequencies bioelectrical impedance analysis measures the change in impedance of alternating low and high-frequency electrical currents, which travel more rapidly through water and lean body mass than through fat body mass. The impedance is used to determine body compositions. The device used in this study was the InBody 230 (Biospace Co Ltd., Korea) with 2 frequencies (20 k and 100 kHz), which was also validated in our previous study (27). The MS components comprised a waist circumference of ≥90 cm in men or ≥80 cm in women; systolic BP of ≥130 mmHg or diastolic BP of ≥85 mmHg or hypertension; high density lipoprotein (HDL) cholesterol of >40 mg/dL in men or >50 mg/dL in women; triglyceride of ≥150 mg/dL; and fasting blood glucose of ≥100 mg/dL or diabetes. We used the Charlson comorbidity index to predict mortality in patients for 17 comorbidities: acute myocardial infarction, congestive heart failure, peripheral vascular disease, cerebral vascular accident, dementia, pulmonary disease, connective tissue disorder, peptic ulcer, liver disease, diabetes, diabetes complications, paraplegia, renal disease, cancer, metastatic cancer, severe liver disease, and human immunodeficiency virus (28). The mean arterial pressure was one-third of averaged systolic BP plus two-thirds of averaged diastolic BP, which were measured 3 months before and after enrollment. Upcr was calculated by dividing urine protein (in milligrams) by urine creatinine (in grams) from a random spot urine sample. Biochemistry measurements were performed during screening and baseline visits and then every 3 months, as per the protocol. The laboratory data from 3 months before baseline to 3 months after baseline were averaged and analyzed.
Outcomes
All-cause mortality was ascertained by reviewing death certificates, patient charts, or the National Death Index. The models of all-cause mortality included patients who had undergone renal replacement therapy and were censored only at death or the end of follow-up.
Statistical analysis
The baseline characteristics of all the patients were stratified on the basis of their TBF% and BMI. We used percentages to present categorical variables. Means ± standard deviations denote continuous variables with an approximate normal distribution, and medians and their interquartile ranges indicate continuous variables with a skewed distribution. The differences between groups were examined using the chi-square test for categorical variables and one-way analysis of variance for continuous variables. Cox proportional hazards analysis was used to investigate the relationship of TBF% and BMI with all-cause mortality. Skew-distributed continuous variables were log transformed to attain a normal distribution. Covariates were selected on the basis of their clinical relevance, consistent with our previous study (29). The adjusted covariates were age, sex, eGFR, Upcr log, diabetes, cardiovascular disease, smoking, cancer, severe liver disease, hypertension, hemoglobin, BMI, cholesterol log, glycosylated hemoglobin, albumin, CRP ln, and phosphorus.
All statistical analyses were performed on SPSS for Windows (version 20.0; IBM, Chicago, IL, USA).
Results
Baseline characteristics of patients with stage 3–5 CKD stratified by BMI and TBF%
The 3,262 included patients were divided into two BMI groups: <25 and ≥25 kg/m2 (Table 1). Of these patients, 42% were women, 44.4% had cardiovascular disease, 66.1% had hypertension, 50.3% had diabetes, and 49.5% had MS. The mean age was 63.5 ± 13.4 years, mean eGFR was 22.4 ± 11.2 mL/min/1.73 m2, and mean Upcr was 1,110 (interquartile range: 405–2,541) mg/g. Compared with patients with BMI <25 kg/m2, more patients with BMI ≥ 25 kg/m2 had diabetes, MS, and a higher BMI, waist circumference, mean BP, eGFR, hemoglobin level, CRP level, and triglyceride level. At follow-up, 43% of patients developed end-stage renal disease (ESRD), and 27.6% patients died. Compared with patients with BMI <25 kg/m2, more patients with BMI ≥ 25 kg/m2 progressed to ESRD and all-cause mortality.
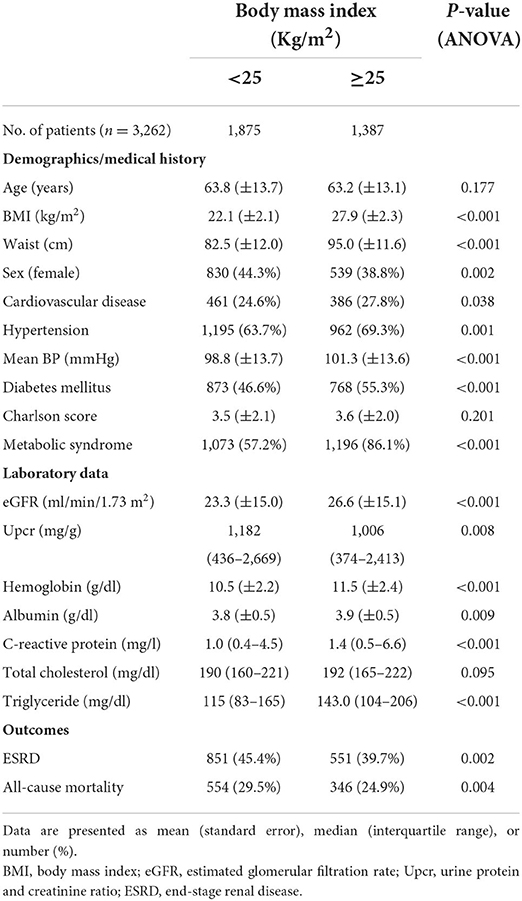
Table 1. Baseline characteristics of patients with stage 3–5 chronic kidney disease stratified by body mass index.
Of all 3,262 patients with stage 3–5 CKD, 1,237 received simultaneous body composition analysis with bioelectrical impedance spectroscopy. The participants were divided into TBF% quartiles on the basis of their BMI (<25 and ≥25 kg/m2; Table 2). In the <25 kg/m2 BMI group, age, BMI, WHtR, cardiovascular disease, MS, eGFR, hemoglobin level, albumin level, CRP level, triglyceride level, and all-cause mortality increased with TBF%, but progression to ESRD and Upcr decreased. In the ≥25 kg/m2 BMI group, age, BMI, WHtR, DM, eGFR, hemoglobin level, and albumin level increased with TBF%, but progression to ESRD and Upcr decreased; however, all-cause mortality did not reach statistical significance.
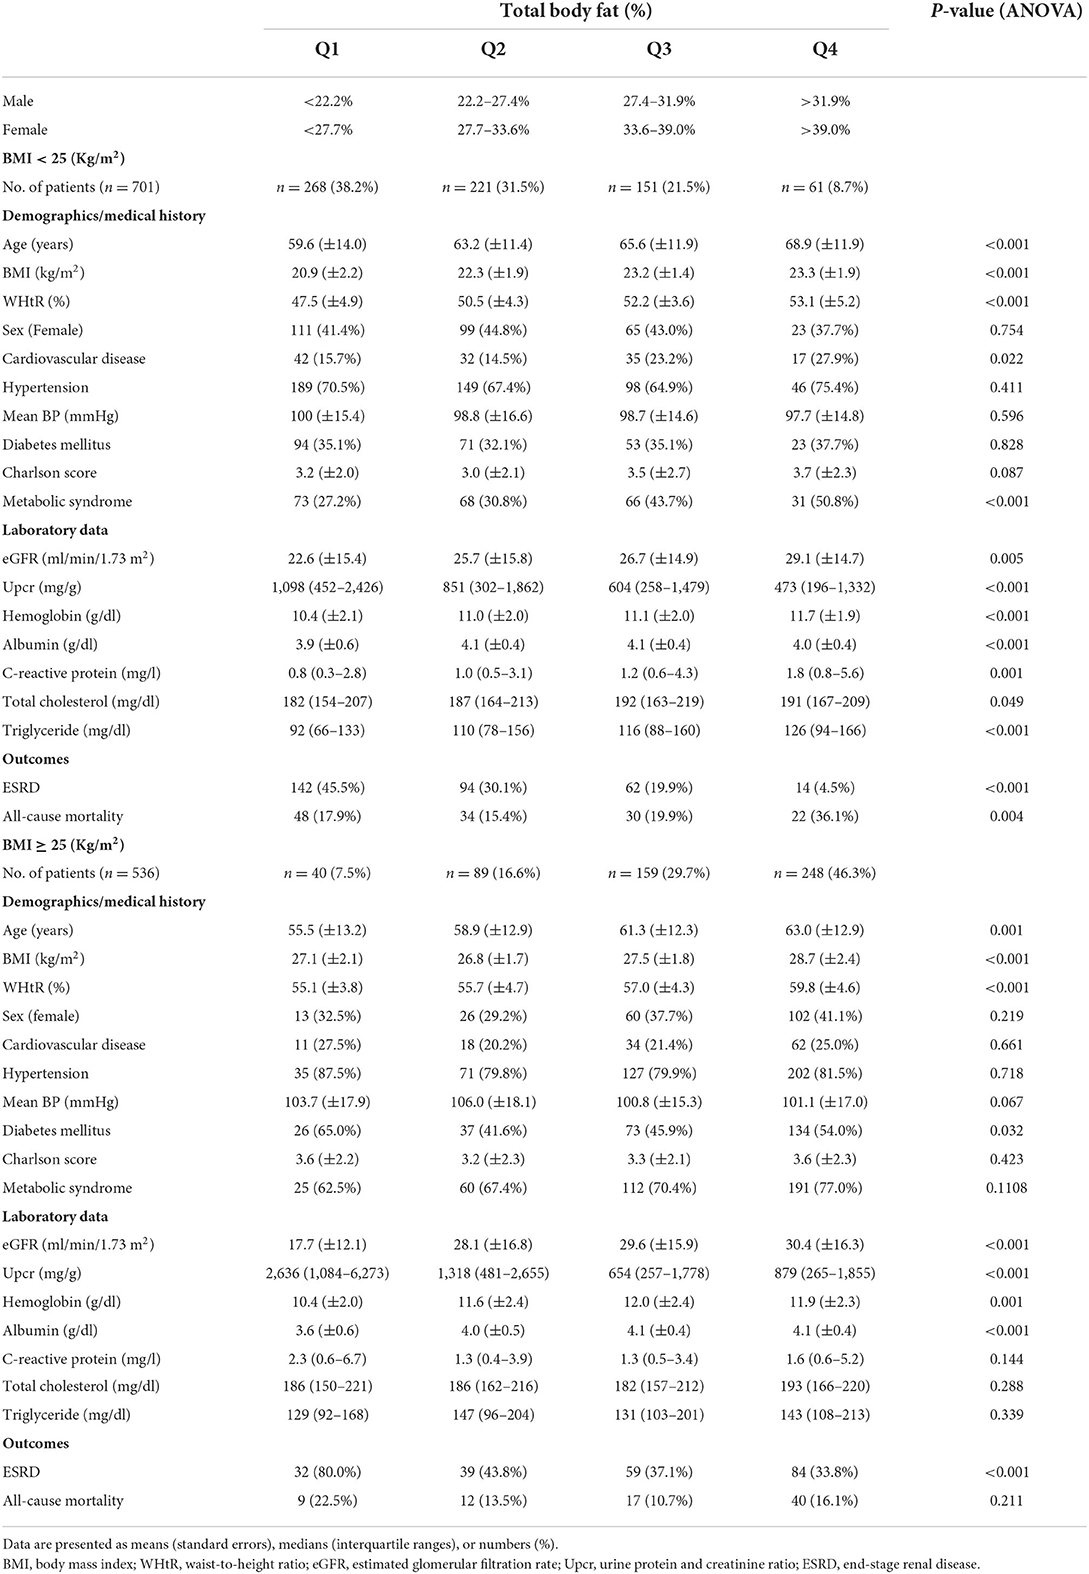
Table 2. Baseline characteristics of patients with stage 3–5 chronic kidney disease stratified by total body fat and body mass index.
Linear regression for total body fat percentage by BMI
The univariate linear regression for TBF% (Supplementary Table 1) and multivariate linear regression for TBF% (Supplementary Table 2) revealed a significant relationship between TBF% and age, gender, Upcr log, BMI, waist, hemoglobin, triglyceride log, albumin, and CRP ln. We further analyzed the association between TBF% and variants according to BMI subgroups (BMI <25 kg/m2 and BMI ≥ 25 kg/m2) (Table 3). Our results showed that TBF% is significantly associated with age, gender, BMI, albumin, hemoglobin, triglyceride log, and CRP ln in normal weight (BMI <25 kg/m2) patients; TBF% is significantly associated with age, gender, BMI, albumin, and Upcr log in preobese-obese (BMI ≥ 25 kg/m2) patients.
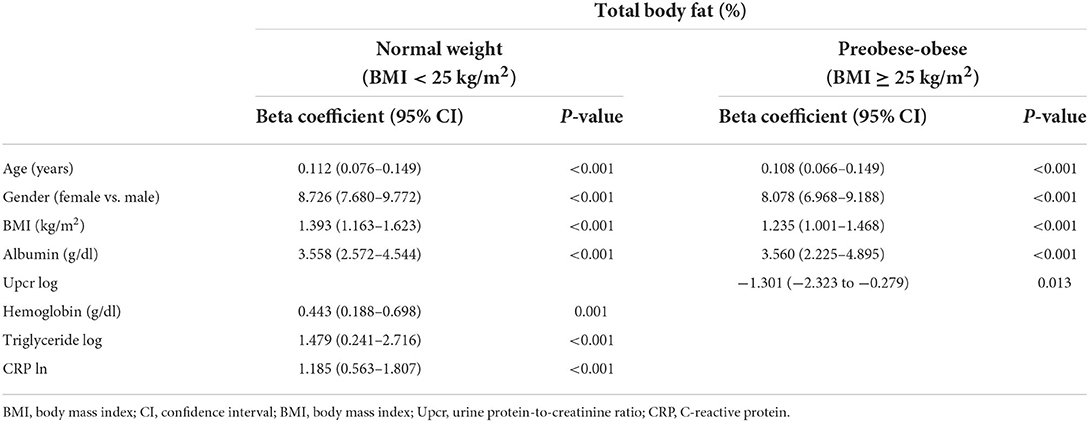
Table 3. Linear regression for total body fat percentage by BMI <25 kg/m2 and BMI ≥ 25 kg/m2 (per 10% increase).
Association between TBF%, WHtR, and all-cause mortality stratified by BMI
In the entire cohort, we noted the BMI paradox but not the TBF% or WHtR paradoxes for all-cause mortality in our fully adjusted Cox regression model. High BMI was associated with low all-cause mortality (Figure 1A), whereas high TBF% (Figure 1B) and WHtR (Figure 1C) were associated with high all-cause mortality in our patients with stage 3–5 CKD. Therefore, TBF% and WHtR might be better indicators for obesity.
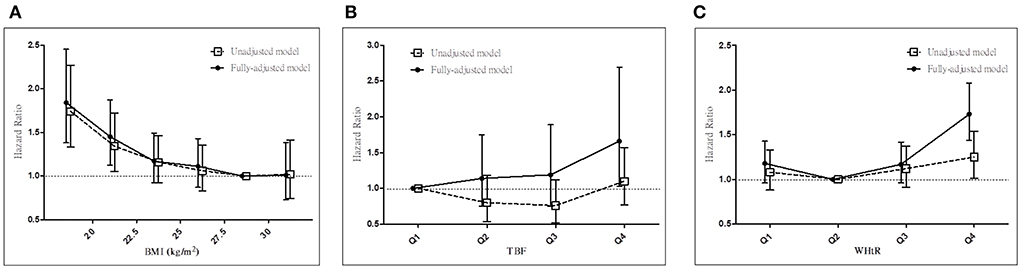
Figure 1. Associations between anthropometric markers and all-cause mortality in all patients with stage 3–5 CKD. Hazard ratios for all-cause mortality based on (A) BMI, (B) total body fat percentage, and (C) WHtR before and after adjustments. CKD, chronic kidney disease; BMI, body mass index; WHtR, waist-to-height ratio.
We next determined whether the prognostic effect of TBF% on all-cause mortality differs between the <25 and ≥25 kg/m2 BMI groups (Table 4A; Figures 2A,B). In the <25 kg/m2 BMI group, HRs (95% CI) for all-cause mortality increased significantly in the TBF% Q4 group [2.35 (1.31–4.22)] and marginally in the TBF% Q2 [1.20 (0.74–1.95)] and Q3 [1.27 (0.73–2.22)] groups compared with the reference group (TBF% Q1). In the ≥25 kg/m2 BMI group, HRs (95% CI) for all-cause mortality non-significantly decreased in the TBF% Q2 [0.61 (0.24–1.58)], Q3 [0.58 (0.23–1.46)], and Q4 [0.69 (0.29–1.64)] groups compared with the reference group (TBF% Q1; P for interaction = 0.009).
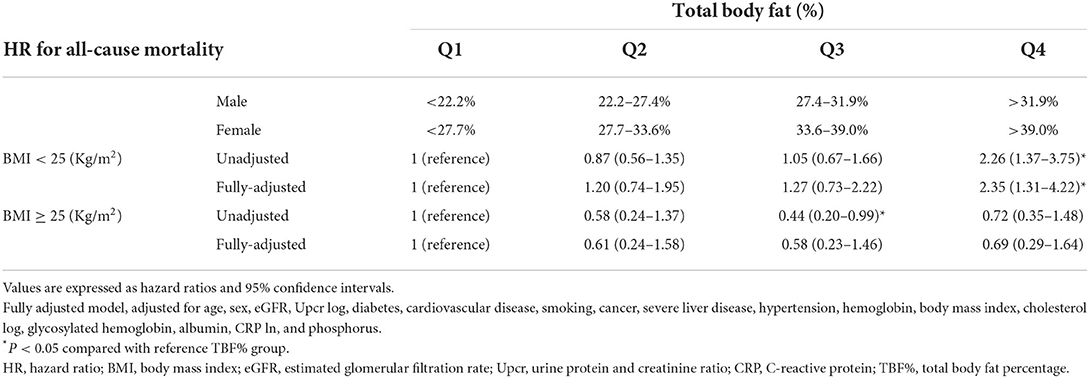
Table 4A. Hazard ratios for all-cause mortality based on total body fat percentage and body mass index.
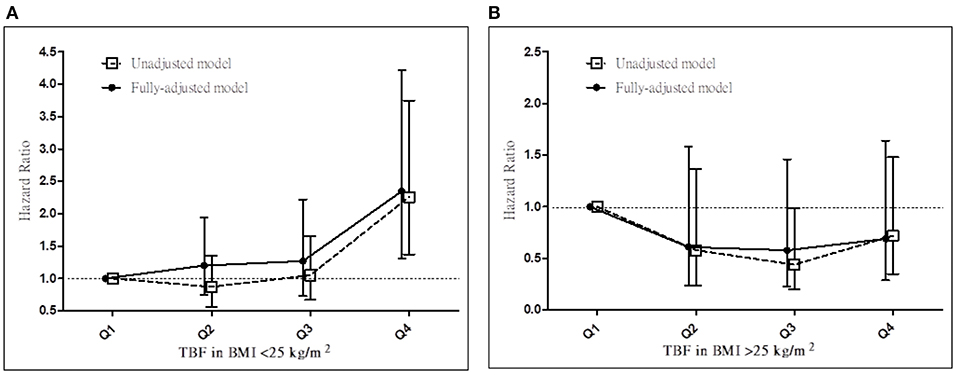
Figure 2. Hazard ratios for all-cause mortality based on total body fat percentage in patients with a BMI of (A) <25 and (B) ≥25 kg/m2 before and after adjustments. TBF%, total body fat percentage; BMI, body mass index.
We also determined whether the prognostic effect of WHtR on all-cause mortality differs between the <25 and ≥25 kg/m2 BMI groups (Table 4B). In the <25 kg/m2 BMI group, HRs (95% CIs) for all-cause mortality increased significantly in the WHtR Q3 [1.31 (1.02–1.68)] and Q4 [1.38 (1.06–1.80)] groups compared with the reference group (WHtR Q2). In the ≥25 kg/m2 BMI group, HRs (95% CIs) for all-cause mortality increased significantly in the WHtR Q1 group [1.68 (1.10–2.57)] and marginally in the WHtR Q4 [1.24 (0.95–1.63)] and Q2 [1.28 (0.88–1.86)] groups compared with the reference group (WHtR Q3; P for interaction = 0.206).
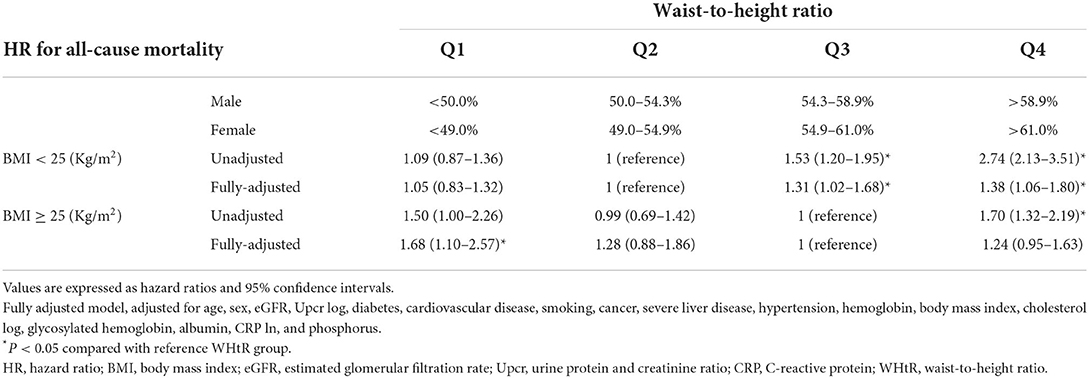
Table 4B. Hazard ratios for all-cause mortality based on waist-to-height ratio and body mass index.
Association between TBF% and all-cause mortality stratified by WHtR
Both TBF% and WHtR were noted to be indicators for NWO according to our results in the <25 kg/m2 BMI group. To explore the prognostic value of TBF% in patients with CKD, we determined whether HRs of TBF% for all-cause mortality differ between the high– and low–waist circumference groups (Table 5). In the normal–waist circumference group (waist circumference < MS criteria), the HRs (95% CI) for all-cause mortality increased significantly in the TBF% Q4 group [2.90 (1.50–5.58)] but marginally in the TBF% Q2 group [1.24 (0.73–2.10)] compared with the reference group (TBF% Q1). In the high–waist circumference group (waist circumference ≥ MS criteria), the HRs (95% CIs) for all-cause mortality decreased marginally in the TBF% Q3 [1.60 (0.70–3.67)] and Q4 [1.44 (0.63–3.28)] groups compared with the reference group (TBF% Q1; P for interaction = 0.038).
Table 5. Hazard ratios for all-cause mortality based on total body fat percentage and waist circumference.
Association between TBF% and all-cause mortality stratified by BMI and WHtR
Because TBF% is an indicator for normal waist obesity in the normal–waist circumference group and because BMI and waist circumference are closely related, we explored the prognostic value of TBF% in patients with or without normal BMI and normal waist circumference (Table 6). In the <25 kg/m2 BMI and normal–waist circumference group, the HRs (95% CIs) for all-cause mortality increased significantly in the TBF% Q4 group [3.81 (1.93–7.50)] and marginally in the TBF% Q2 [1.22 (0.70–2.13)] and Q3 [1.21 (0.62–2.36)] groups compared with the reference group (TBF% Q1). In the ≥25 kg/m2 BMI or increased–waist circumference group, the HR for all-cause mortality was not associated with any of the TBF% groups compared with the reference group (TBF% Q1; P for interaction = 0.012).
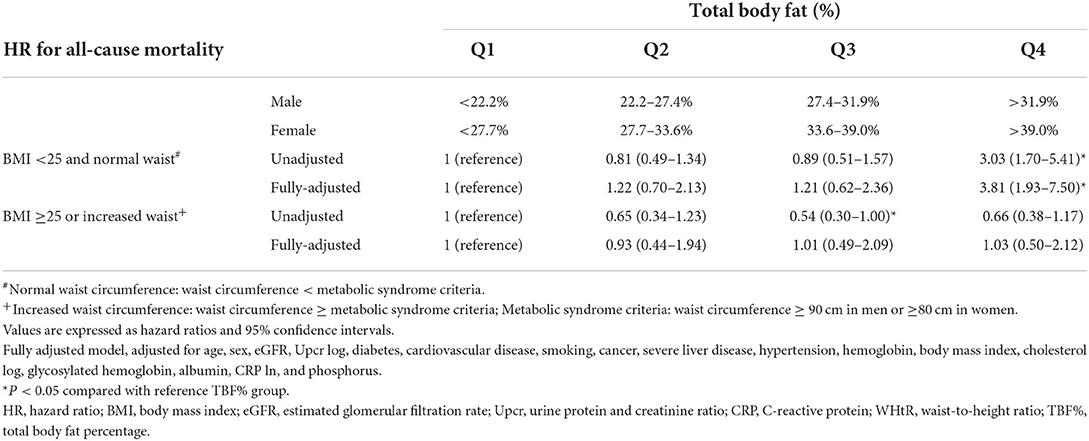
Table 6. Hazard ratios for all-cause mortality based on total body fat percentage, body mass index and waist circumference.
HR of NWO for all-cause mortality based on TBF% and WHtR
We determined the cutoff for NWO and non-NWO on the basis of TBF% or WHtR (Supplementary Table 3). When defined by TBF% Q3 and WHtR Q3, the HRs (95% CIs) of NWO for all-cause mortality compared with preobese obesity were 1.73 (1.14–2.64) and 1.34 (1.13–1.59), respectively.
Association between TBF% and MS stratified by BMI
We determined the association between MS prevalence and TBF% by using a fully adjusted logistic regression model (Supplementary Table 4). Compared with the reference group (TBF% Q1), MS prevalence increased with TBF% significantly in the <25 kg/m2 BMI group {odds ratios [ORs; 95% confidence intervals (CIs)] of TBF% Q3 and TBF% Q4: 2.01 (1.25–3.22) and 2.33 (1.24–4.37), respectively} and marginally in the ≥25 kg/m2 BMI group [ORs (95% CIs) of TBF% Q3 and TBF% Q4: 1.57 (0.69–3.59) and 2.01 (0.90–4.52), respectively; P for interaction = 0.359].
Discussion
In our advanced CKD cohort, we noted the obesity paradox (Figure 1A) but not the TBF% (Figure 1B) or WHtR (Figure 1C) paradoxes. Moreover, TBF% predicted all-cause mortality in our patients with normal BMI (Table 4A; Figure 2A) but not in those with high BMI (Table 4A; Figure 2B), whereas WHtR predicted all-cause mortality in the obesity group (Table 4B). Notably, TBF% predicted all-cause mortality not only in patients with normal weight but also in those with normal waist circumference (Table 5). We observed that TBF% predicted all-cause mortality in patients with normal weight and waist circumference (Table 6). Therefore, TBF% is a potential indicator for obesity in patients with advanced CKD, especially in those with normal weight, normal waist circumference, or both.
BMI is a strong predictor for all-cause mortality in the general population. Both high and low BMI are associated with increased all-cause mortality; the lowest all-cause mortality has been noted in Caucasian adults with a BMI of 20.0–24.9 kg/m2 (4) and East Asian adults with a BMI of 22.6–27.5 kg/m2 (5). Evidence has demonstrated that all-cause mortality is low in obese and overweight groups of specific populations; this is the obesity paradox (30). The relationship was initially reported by Gruberg et al. in patients with coronary artery disease after percutaneous coronary intervention (31); many studies thereafter have revealed a protective effect due to high BMI in patients under maintenance dialysis (32), with chronic heart failure (33), after acute myocardial infarction (34), with a chronic obstructive lung disease (35), and who are nursing home residents (36). The current study revealed the obesity paradox for all-cause mortality; high BMI was associated with low all-cause mortality in our advanced CKD population—consistent with the results of other studies (16, 17), including those of a metanalysis including 484,906 patients with stage 3–5 CKD (37).
Evidence has suggested that BMI is inadequate for body composition measurement and that additional anthropometric markers should be used for determining body fat mass (38), particularly in CKD populations (23). The association between excess visceral fat accumulation and MS has been observed, and several hypothesis have been proposed (12). Increased visceral fat levels can enhance the delivery of free fatty acids to the liver and contribute to insulin resistance in the liver and subsequently to muscular tissues (39). Studies have suggested that visceral fat alters the secretion of various adipokines, including adiponectin, interleukin 6, tumor necrosis factor alpha, CRP, plasminogen activator inhibitor 1, and resistin, which have a potent effect on adipose tissue metabolism (40, 41). MS, also known as syndrome X or insulin resistance syndrome, is associated with increased cardiovascular disease risks (42). Studies have demonstrated that central obesity, indicated by waist circumference (14, 17), waist-to-hip ratio (14–16, 43), WHtR (44, 45), and conicity index (19, 46), provides higher diagnostic power than does BMI alone for the evaluation of all-cause mortality in CKD populations. Our study revealed that central obesity is associated with all-cause mortality in both high- and low-WHtR groups (Figure 1C).
NWO is associated with a high prevalence of cardiometabolic dysregulation, MS, and cardiovascular risks (47). Individuals with metabolically NWO, first described in the late 1990s, have been noted to be insulin resistant and predisposed to type 2 diabetes mellitus, hypertriglyceridemia, and premature coronary heart disease (48). Low lean mass and high fat mass are common among patients with CKD (49) and associated with increased all-cause mortality (50, 51). Body fat distribution and high levels of body fat are both strongly related to morbidity and all-cause mortality in CKD populations (52). Misclassification of obese populations as non-obese based on TBF% and BMI is common in both non–dialysis-dependent (21, 23) and dialysis-dependent (53) patients with CKD.
Whether the metabolic derangement in individuals with NWO arises from increased TBF% or a centralized body fat distribution in CKD populations remains unknown. Indexes of central fatness including waist circumference, waist-to-hip ratio, and WHtR are positively and significantly associated with increased all-cause mortality risk (54). In adults, WHtR demonstrates superiority over waist circumference and BMI for cardiometabolic risk factor detection (55). The current results reveal that high WHtR is significantly associated with all-cause mortality in patients with normal body weight. By contrast, high TBF% is associated with elevated all-cause mortality in patients with CKD (21); this relationship has been noted to be J shaped in the general population (22). Muscle weakness, measured by hand grip strength and pinch strength, are associated with increased mortality in CKD population and weaker hand grip strength is noticed in CKD patients with increased fat mass (24). Lin et al. reported a significantly higher all-cause mortality on the basis of TBF% and lower all-cause mortality on the basis of BMI in an obese CKD population (21). Studies have also demonstrated that ~25% of non–dialysis-dependent patients with CKD (23) and 55% of dialysis-dependent patients with CKD (53) receive misdiagnoses of non-obesity when BMI is used as the anthropometric marker rather than TBF%. Furthermore, weight loss is associated with mortality in the CKD population (56) and confounded the association between obesity and mortality. Sarcopenic patients were protected by adiposity due to its ability to maintain weight; therefore, CKD patients with higher fat mass have greater survival benefit among those with lower muscle mass (8). Our results demonstrate that high TBF% is strongly associated with MS and all-cause mortality in patients with normal body weight—corroborating previous results (47, 57).
To evaluate the prognostic value of TBF% for all-cause mortality, we analyzed the results on the basis of the different waist circumference and weight groups. NWO is a well-recognized predictor for all-cause mortality; however, the effects of normal waist obesity on all-cause mortality remain unknown. Individuals with normal waist circumference have a low MS risk (58) as well as low all-cause mortality (17, 59), independent of BMI, compared with those with increased waist circumference. The association of decreased all-cause mortality with normal waist circumference has also been reported in CKD populations (15). Several studies have focused on the effects of NWO on all-cause mortality, but only a few have discussed the effects of excess body fat in individuals with normal waist circumference. BMI cannot differentiate TBF from lean mass and central fat from peripheral fat (60). Although waist circumference can predict abdominal obesity (61), it has a limited effect on TBF prediction. Our results reveal a significantly increased all-cause mortality in high-TBF% patients with normal weight, normal waist circumference, or both. Therefore, these results demonstrate the prognostic value of TBF%.
No consensus regarding the method of defining obesity by TBF% is available. The American Society of Endocrinologists defines obesity as TBF% of >35% in women and >25% in men (62). De Lorenzo et al. (63) described the relationship between body fat distribution and cardiovascular disease risk in individuals with NWO, defined as normal BMI (<25 kg/m2) with increased TBF% (>30%). Healthy TBF% may be defined on the basis of BMI, sex, and age (64). A study reported that the TBF% cutoff for NWO is 20.2–28.2% in men and 29.9–39.6% in women on the basis of age (65); another study defined NWO to be the highest tertile of TBF% Q4 (>23.1% in men and >33.3% in women) (47). Our results provide clinical reference for NWO based on TBF% in advanced CKD populations. Here, the highest quartile of TBF% (>30.5% in men and >37.1% in women) was labeled as NWO. The cutoff was higher than that reported previously, probably because of the obesity paradox and ethnic differences.
The main strength of this study is the large sample size (N = 3,262) as well as the enrollment of patients with stage 3–5 CKD and BMI of 15.0–35.0 kg/m2. To the best of our knowledge, this is the first study focusing on the all-cause mortality of advance-stage CKD populations with normal weights and normal waist circumferences stratified by TBF%. This study also has several limitations. First, the baseline anthropometric measurements were used for analysis, and we did not estimate the time-dependent changes. Second, the Integrated CKD Care Program Kaohsiung for Delaying Dialysis is a sample of an East Asian population; therefore, we could not address the importance of ethnicity in body composition or outcome. Third, we did not include dietary and medication factors in our study, and the importance of their effects on obesity and CKD incidence should be considered. Fourth, our patients only had advanced CKD; thus, the current results may not be applicable to all CKD populations. Additional studies clarifying the nature of the obesity paradox and focusing on different anthropometric markers in the prediction of all-cause mortality, particularly in advanced CKD patients with normal weight and normal waist circumference, are warranted.
Conclusion
This study revealed that patients with advanced CKD demonstrate the BMI paradox but not the WHtR or TBF% paradoxes. High TBF% is associated with increased all-cause mortality in those with normal weight, normal waist circumference, or both. TBF% is a good indicator for NWO, normal waist obesity, or both in the advanced CKD population.
Data availability statement
The original contributions presented in the study are included in the article/Supplementary material, further inquiries can be directed to the corresponding author/s.
Ethics statement
The studies involving human participants were reviewed and approved by Institutional Review Board of Kaohsiung Medical University Hospital. The patients/participants provided their written informed consent to participate in this study.
Author contributions
F-CS and C-CH: conceptualization, formal analysis, methodology, and writing—original draft. J-MC and S-JH: supervision. M-EC, W-TW, I-CK, S-WN, and J-JL: writing—review and editing. All authors have read and agreed to the published version of the manuscript.
Acknowledgments
We thank the Integrated CKD Care Program in Kaohsiung for Delaying Dialysis participants and staff for their contributions of the data and data collection. This manuscript was edited by Wallace Academic Editing.
Conflict of interest
The authors declare that the research was conducted in the absence of any commercial or financial relationships that could be construed as a potential conflict of interest.
Publisher's note
All claims expressed in this article are solely those of the authors and do not necessarily represent those of their affiliated organizations, or those of the publisher, the editors and the reviewers. Any product that may be evaluated in this article, or claim that may be made by its manufacturer, is not guaranteed or endorsed by the publisher.
Supplementary material
The Supplementary Material for this article can be found online at: https://www.frontiersin.org/articles/10.3389/fnut.2022.982519/full#supplementary-material
References
1. Afshin A, Forouzanfar MH, Reitsma MB, Sur P, Estep K, Lee A, et al. Health effects of overweight and obesity in 195 countries over 25 years. N Engl J Med. (2017) 377:13–27. Epub 20170612. doi: 10.1056/NEJMoa1614362
2. Guh DP, Zhang W, Bansback N, Amarsi Z, Birmingham CL, Anis AH. The incidence of co-morbidities related to obesity and overweight: a systematic review and meta-analysis. BMC Public Health. (2009) 9:88. doi: 10.1186/1471-2458-9-88
3. Prospective Studies Collaboration. Body-mass index and cause-specific mortality in 900 000 adults: collaborative analyses of 57 prospective studies. Lancet. (2009) 373:1083–96. doi: 10.1016/S0140-6736(09)60318-4
4. Berrington de Gonzalez A, Hartge P, Cerhan JR, Flint AJ, Hannan L, MacInnis RJ, et al. Body-mass index and mortality among 1.46 million white adults. N Engl J Med. (2010) 363:2211–9. doi: 10.1056/NEJMoa1000367
5. Zheng W, McLerran DF, Rolland B, Zhang X, Inoue M, Matsuo K, et al. Association between body-mass index and risk of death in more than 1 million Asians. N Engl J Med. (2011) 364:719–29. doi: 10.1056/NEJMoa1010679
6. Kalantar-Zadeh K, Abbott KC, Salahudeen AK, Kilpatrick RD, Horwich TB. Survival advantages of obesity in dialysis patients. Am J Clin Nutr. (2005) 81:543–54. doi: 10.1093/ajcn/81.3.543
7. Kovesdy CP, Anderson JE, Kalantar-Zadeh K. Paradoxical association between body mass index and mortality in men with ckd not yet on dialysis. Am J Kidney Dis. (2007) 49:581–91. doi: 10.1053/j.ajkd.2007.02.277
8. Ziolkowski SL, Long J, Baker JF, Chertow GM, Leonard MB. Chronic kidney disease and the adiposity paradox: valid or confounded? J Renal Nutr. (2019) 29:521–8. doi: 10.1053/j.jrn.2018.11.011
9. Donini LM, Pinto A, Giusti AM, Lenzi A, Poggiogalle E. Obesity or BMI paradox? Beneath the tip of the iceberg. Front Nutr. (2020) 7:53. doi: 10.3389/fnut.2020.00053
10. Antlanger M, Hecking M, Haidinger M, Werzowa J, Kovarik JJ, Paul G, et al. Fluid overload in hemodialysis patients: a cross-sectional study to determine its association with cardiac biomarkers and nutritional status. BMC Nephrol. (2013) 14:266. doi: 10.1186/1471-2369-14-266
11. Sharma D, Hawkins M, Abramowitz MK. Association of sarcopenia with EGFR and misclassification of obesity in adults with CKD in the United States. Clin J Am Soc Nephrol. (2014) 9:2079–88. Epub 20141112. doi: 10.2215/CJN.02140214
12. Goodpaster BH, Krishnaswami S, Harris TB, Katsiaras A, Kritchevsky SB, Simonsick EM, et al. Obesity, regional body fat distribution, and the metabolic syndrome in older men and women. Arch Intern Med. (2005) 165:777–83. doi: 10.1001/archinte.165.7.777
13. Blüher M. Adipose tissue dysfunction in obesity. Exp Clin Endocrinol Diabetes. (2009) 117:241–50. doi: 10.1055/s-0029-1192044
14. Postorino M, Marino C, Tripepi G, Zoccali C. Abdominal obesity and all-cause and cardiovascular mortality in end-stage renal disease. J Am Coll Cardiol. (2009) 53:1265–72. doi: 10.1016/j.jacc.2008.12.040
15. Kim CS, Han K-D, Choi HS, Bae EH, Ma SK, Kim SW. Association of body mass index and waist circumference with all-cause mortality in hemodialysis patients. J Clin Med. (2020) 9:1289. doi: 10.3390/jcm9051289
16. Elsayed EF, Tighiouart H, Weiner DE, Griffith J, Salem D, Levey AS, et al. Waist-to-hip ratio and body mass index as risk factors for cardiovascular events in CKD. Am J Kidney Dis. (2008) 52:49–57. doi: 10.1053/j.ajkd.2008.04.002
17. Kramer H, Shoham D, McClure LA, Durazo-Arvizu R, Howard G, Judd S, et al. Association of waist circumference and body mass index with all-cause mortality in CKD: the regards (reasons for geographic and racial differences in stroke) study. Am J Kidney Dis. (2011) 58:177–85. doi: 10.1053/j.ajkd.2011.02.390
18. Huang JC, Lin HY, Lim LM, Chen SC, Chang JM, Hwang SJ, et al. Body mass index, mortality, and gender difference in advanced chronic kidney disease. PLoS ONE. (2015) 10:e0126668. doi: 10.1371/journal.pone.0126668
19. Shen FC, Chiu YW, Kuo MC, Lin MY, Lee JJ, Hwang SJ, et al. U-shaped association between waist-to-hip ratio and all-cause mortality in stage 3-5 chronic kidney disease patients with body mass index paradox. J Pers Med. (2021) 11:1355. doi: 10.3390/jpm11121355
20. Padwal R, Leslie WD, Lix LM, Majumdar SR. Relationship among body fat percentage, body mass index, and all-cause mortality: a cohort study. Ann Intern Med. (2016) 164:532–41. doi: 10.7326/M15-1181
21. Lin TY, Lim PS, Hung SC. Impact of misclassification of obesity by body mass index on mortality in patients with CKD. Kidney Int Rep. (2018) 3:447–55. doi: 10.1016/j.ekir.2017.12.009
22. Sedlmeier AM, Baumeister SE, Weber A, Fischer B, Thorand B, Ittermann T, et al. Relation of body fat mass and fat-free mass to total mortality: results from 7 prospective cohort studies. Am J Clin Nutr. (2021) 113:639–46. doi: 10.1093/ajcn/nqaa339
23. Agarwal R, Bills JE, Light RP. Diagnosing obesity by body mass index in chronic kidney disease. Hypertension. (2010) 56:893–900. doi: 10.1161/HYPERTENSIONAHA.110.160747
24. Jiang K, Slee A, Davenport A. Body composition and weakness of hand grip strength and pinch strength in patients with chronic kidney disease from different ethnic backgrounds. J Hum Nutr Diet. (2021) 34:450–5. doi: 10.1111/jhn.12825
25. Wijayatunga NN, Dhurandhar EJ. Normal weight obesity and unaddressed cardiometabolic health risk-a narrative review. Int J Obes. (2021) 45:2141–55. Epub 20210518. doi: 10.1038/s41366-021-00858-7
26. Consultation W. Waist Circumference and Waist-Hip Ratio. Report of a WHO Expert Consultation. Geneva: World Health Organization (2008). p. 8–11.
27. Lim LM, Tsai N-C, Lin M-Y, Hwang D-Y, Lin HY-H, Lee J-J, et al. Hyponatremia is associated with fluid imbalance and adverse renal outcome in chronic kidney disease patients treated with diuretics. Sci Rep. (2016) 6:36817. doi: 10.1038/srep36817
28. Sundararajan V, Henderson T, Perry C, Muggivan A, Quan H, Ghali WA. New ICD-10 version of the charlson comorbidity index predicted in-hospital mortality. J Clin Epidemiol. (2004) 57:1288–94. doi: 10.1016/j.jclinepi.2004.03.012
29. Chiang HP, Chiu YW, Lee JJ, Hung CC, Hwang SJ, Chen HC. Blood pressure modifies outcomes in patients with stage 3 to 5 chronic kidney disease. Kidney Int. (2020) 97:402–13. doi: 10.1016/j.kint.2019.10.021
30. Hainer V, Aldhoon-Hainerová I. Obesity paradox does exist. Diabetes Care. (2013) 36:S276–81. doi: 10.2337/dcS13-2023
31. Gruberg L, Weissman NJ, Waksman R, Fuchs S, Deible R, Pinnow EE, et al. The impact of obesity on the short-term and long-term outcomes after percutaneous coronary intervention: the obesity paradox? J Am Coll Cardiol. (2002) 39:578–84. doi: 10.1016/S0735-1097(01)01802-2
32. Kalantar-Zadeh K, Block G, Humphreys MH, Kopple JD. Reverse epidemiology of cardiovascular risk factors in maintenance dialysis patients. Kidney Int. (2003) 63:793–808. doi: 10.1046/j.1523-1755.2003.00803.x
33. Kalantar-Zadeh K, Block G, Horwich T, Fonarow Gregg C. Reverse epidemiology of conventional cardiovascular risk factors in patients with chronic heart failure. J Am Coll Cardiol. (2004) 43:1439–44. doi: 10.1016/j.jacc.2003.11.039
34. Wang L, Liu W, He X, Chen Y, Lu J, Liu K, et al. Association of overweight and obesity with patient mortality after acute myocardial infarction: a meta-analysis of prospective studies. Int J Obesity. (2016) 40:220–8. doi: 10.1038/ijo.2015.176
35. Cao C, Wang R, Wang J, Bunjhoo H, Xu Y, Xiong W. Body mass index and mortality in chronic obstructive pulmonary disease: a meta-analysis. PLoS ONE. (2012) 7:e43892. doi: 10.1371/journal.pone.0043892
36. Veronese N, Cereda E, Solmi M, Fowler SA, Manzato E, Maggi S, et al. Inverse relationship between body mass index and mortality in older nursing home residents: a meta-analysis of 19,538 elderly subjects. Obesity Rev. (2015) 16:1001–15. doi: 10.1111/obr.12309
37. Ahmadi S-F, Zahmatkesh G, Ahmadi E, Streja E, Rhee CM, Gillen DL, et al. Association of body mass index with clinical outcomes in non-dialysis-dependent chronic kidney disease: a systematic review and meta-analysis. Cardiorenal Med. (2015) 6:37–49. doi: 10.1159/000437277
38. Nuttall FQ. Body mass index: obesity, BMI, and health: a critical review. Nutr Today. (2015) 50:117–28. doi: 10.1097/NT.0000000000000092
39. Bergman RN, Van Citters GW, Mittelman SD, Dea MK, Hamilton-Wessler M, Kim SP, et al. Central role of the adipocyte in the metabolic syndrome. J Investig Med. (2001) 49:119–26. doi: 10.2310/6650.2001.34108
40. Després J-P. Abdominal obesity: the most prevalent cause of the metabolic syndrome and related cardiometabolic risk. Eur Heart J Suppl. (2006) 8:B4–12. doi: 10.1093/eurheartj/sul002
41. Fried SK, Bunkin DA, Greenberg AS. Omental and subcutaneous adipose tissues of obese subjects release interleukin-6: depot difference and regulation by glucocorticoid. J Clin Endocrinol Metab. (1998) 83:847–50. doi: 10.1210/jc.83.3.847
42. Eckel RH, Grundy SM, Zimmet PZ. The metabolic syndrome. Lancet. (2005) 365:1415–28. doi: 10.1016/S0140-6736(05)66378-7
43. Elsayed EF, Sarnak MJ, Tighiouart H, Griffith JL, Kurth T, Salem DN, et al. Waist-to-hip ratio, body mass index, and subsequent kidney disease and death. Am J Kidney Dis. (2008) 52:29–38. doi: 10.1053/j.ajkd.2008.02.363
44. Rost S, Freuer D, Peters A, Thorand B, Holle R, Linseisen J, et al. New indexes of body fat distribution and sex-specific risk of total and cause-specific mortality: a prospective cohort study. BMC Public Health. (2018) 18:427. doi: 10.1186/s12889-018-5350-8
45. He Y, Li F, Wang F, Ma X, Zhao X, Zeng Q. The association of chronic kidney disease and waist circumference and waist-to-height ratio in chinese urban adults. Medicine. (2016) 95:e3769. doi: 10.1097/MD.0000000000003769
46. Evans PD, McIntyre NJ, Fluck RJ, McIntyre CW, Taal MW. Anthropomorphic measurements that include central fat distribution are more closely related with key risk factors than BMI in CKD stage 3. PLoS ONE. (2012) 7:e34699. doi: 10.1371/journal.pone.0034699
47. Romero-Corral A, Somers VK, Sierra-Johnson J, Korenfeld Y, Boarin S, Korinek J, et al. Normal weight obesity: a risk factor for cardiometabolic dysregulation and cardiovascular mortality. Eur Heart J. (2009) 31:737–46. doi: 10.1093/eurheartj/ehp487
48. Ruderman N, Chisholm D, Pi-Sunyer X, Schneider S. The metabolically obese, normal-weight individual revisited. Diabetes. (1998) 47:699–713. doi: 10.2337/diabetes.47.5.699
49. Koefoed M, Kromann CB, Juliussen SR, Hvidtfeldt D, Ekelund B, Frandsen NE, et al. Nutritional status of maintenance dialysis patients: low lean body mass index and obesity are common, protein-energy wasting is uncommon. PLoS ONE. (2016) 11:e0150012. doi: 10.1371/journal.pone.0150012
50. Lin TY, Peng CH, Hung SC, Tarng DC. Body composition is associated with clinical outcomes in patients with non-dialysis-dependent chronic kidney disease. Kidney Int. (2018) 93:733–40. doi: 10.1016/j.kint.2017.08.025
51. Moorthi RN, Avin KG. Clinical relevance of sarcopenia in chronic kidney disease. Curr Opin Nephrol Hypertens. (2017) 26:219–28. doi: 10.1097/MNH.0000000000000318
52. Pommer W. Preventive nephrology: the role of obesity in different stages of chronic kidney disease. Kidney Dis. (2018) 4:199–204. doi: 10.1159/000490247
53. Gracia-Iguacel C, Qureshi AR, Avesani CM, Heimbürger O, Huang X, Lindholm B, et al. Subclinical versus overt obesity in dialysis patients: more than meets the eye. Nephrol Dialysis Trans. (2013) 28:iv175–iv81. doi: 10.1093/ndt/gft024
54. Jayedi A, Soltani S, Zargar MS, Khan TA, Shab-Bidar S. Central fatness and risk of all cause mortality: systematic review and dose-response meta-analysis of 72 prospective cohort studies. BMJ. (2020) 370:m3324. doi: 10.1136/bmj.m3324
55. Ashwell M, Gunn P, Gibson S. Waist-to-height ratio is a better screening tool than waist circumference and BMI for adult cardiometabolic risk factors: systematic review and meta-analysis. Obes Rev. (2012) 13:275–86. doi: 10.1111/j.1467-789X.2011.00952.x
56. Ku E, Kopple JD, Johansen KL, McCulloch CE, Go AS, Xie D, et al. Longitudinal weight change during CKD progression and its association with subsequent mortality. Am J Kidney Dis. (2018) 71:657–65. doi: 10.1053/j.ajkd.2017.09.015
57. Xu T, Liu J, Liu J, Zhu G, Han S. Relation between metabolic syndrome and body compositions among chinese adolescents and adults from a large-scale population survey. BMC Public Health. (2017) 17:337. doi: 10.1186/s12889-017-4238-3
58. Janssen I, Katzmarzyk PT, Ross R. Body mass index, waist circumference, and health risk: evidence in support of current national institutes of health guidelines. Arch Intern Med. (2002) 162:2074–9. doi: 10.1001/archinte.162.18.2074
59. Jacobs EJ, Newton CC, Wang Y, Patel AV, McCullough ML, Campbell PT, et al. Waist circumference and all-cause mortality in a large us cohort. Arch Internal Med. (2010) 170:1293–301. doi: 10.1001/archinternmed.2010.201
60. Oliveros E, Somers VK, Sochor O, Goel K, Lopez-Jimenez F. The concept of normal weight obesity. Prog Cardiovasc Dis. (2014) 56:426–33. doi: 10.1016/j.pcad.2013.10.003
61. Ross R, Neeland IJ, Yamashita S, Shai I, Seidell J, Magni P, et al. Waist circumference as a vital sign in clinical practice: a consensus statement from the ias and iccr working group on visceral obesity. Nat Rev Endocrinol. (2020) 16:177–89. doi: 10.1038/s41574-019-0310-7
62. Dickey RA, Bartuska D, Bray GW, Callaway CW, Davidson ET, Feld S, et al. Aace/Ace position statement on the prevention, diagnosis, and treatment of obesity (1998 revision). Endocr Pract. (1998) 4:297–350.
63. De Lorenzo A, Martinoli R, Vaia F, Di Renzo L. Normal weight obese (nwo) women: an evaluation of a candidate new syndrome. Nutr Metab Cardiovasc Dis. (2006) 16:513–23. doi: 10.1016/j.numecd.2005.10.010
64. Gallagher D, Heymsfield SB, Heo M, Jebb SA, Murgatroyd PR, Sakamoto Y. Healthy percentage body fat ranges: an approach for developing guidelines based on body mass index. Am J Clin Nutr. (2000) 72:694–701. doi: 10.1093/ajcn/72.3.694
Keywords: obesity paradox, all-cause mortality, chronic kidney diseases, normal weight, normal waist, total body fat, body mass index, waist circumference
Citation: Shen F-C, Chen M-E, Wu W-T, Kuo I-C, Niu S-W, Lee J-J, Hung C-C, Chang J-M and Hwang S-J (2022) Normal weight and waist obesity indicated by increased total body fat associated with all-cause mortality in stage 3–5 chronic kidney disease. Front. Nutr. 9:982519. doi: 10.3389/fnut.2022.982519
Received: 30 June 2022; Accepted: 25 August 2022;
Published: 16 September 2022.
Edited by:
Caterina Conte, Università Telematica San Raffaele, ItalyReviewed by:
Abraham Wall-Medrano, Universidad Autónoma de Ciudad Juárez, MexicoYongcheng Ren, Huanghuai University, China
Copyright © 2022 Shen, Chen, Wu, Kuo, Niu, Lee, Hung, Chang and Hwang. This is an open-access article distributed under the terms of the Creative Commons Attribution License (CC BY). The use, distribution or reproduction in other forums is permitted, provided the original author(s) and the copyright owner(s) are credited and that the original publication in this journal is cited, in accordance with accepted academic practice. No use, distribution or reproduction is permitted which does not comply with these terms.
*Correspondence: Chi-Chih Hung, chichi@kmu.edu.tw