Dietary Patterns in Association With Hypertension: A Community-Based Study in Eastern China
 Cuicui Wang
 Yanmin Zheng3†
  Ya Zhang
 Dong Liu
 Hui Zuo
- 1School of Public Health, Medical College of Soochow University, Suzhou, China
- 2Jiangsu Key Laboratory of Preventive and Translational Medicine for Geriatric Diseases, Medical College of Soochow University, Suzhou, China
- 3Department of Nutrition and Food Hygiene, Suzhou Center for Disease Control and Prevention, Suzhou, China
- 4Department of Disease Prevention and Health Care, Soochow University Hospital, Soochow University, Suzhou, China
Objective: This study aimed to explore the association between dietary patterns and hypertension based on a community–based survey in Suzhou, Eastern China.
Methods: This cross–sectional analysis was undertaken from the subset of the Suzhou Food Consumption and Health State Survey in 2018–2019. Adults aged ≥ 18 years were invited to participate in this survey. Dietary intake was collected by a 24–h dietary recall and a weighing method over three consecutive days (including two weekdays and one weekend day). Dietary patterns were defined using factor analysis. Association between the dietary patterns and hypertension was examined by multivariable logistic regression models with adjustment for covariates. Moreover, sensitivity analysis was used to reinforce our findings.
Results: A total of 2,718 participants were included in the final analysis. Rice-vegetable pattern, fast food pattern, fruit-dairy pattern, and wheat-meat pattern were identified. We observed that the fruit-dairy pattern was inversely associated with hypertension after adjustment for all the covariates (OR = 0.55; 95% CI: 0.40, 0.75; P = 0.002). The association between the wheat-meat pattern and hypertension was attenuated and became statistically nonsignificant in sensitivity analyses. The other two patterns were not significantly associated with hypertension (P > 0.05).
Conclusion: The fruit-dairy pattern was inversely associated with the risk of hypertension among Chinese adults. Our findings further emphasize the important role of optimal diet combination in the prevention of hypertension.
Introduction
Hypertension is one of the major risk factors affecting the global burden of disease and is one of the most important risk factors for cardiovascular disease (1). It was reported that a 10 mmHg reduction in systolic blood pressure (BP) could lower the risk of major stroke by 27%, heart failure by 28%, and cardiovascular disease events by 20% (2). Therefore, the primary prevention of hypertension has now become a top priority for global public health. Furthermore, hypertension is the leading modifiable risk factor for cardiovascular disease, the top cause of death in China (3). In China, five waves of nationwide hypertension surveys have been conducted since the 1950s (1959, 1979, 1991, 2002, and 2012, respectively). Based on the survey data, the prevalence of hypertension continuously increased from 5.11% in 1959 to 23.2% in 2012 among adults (4).
Accumulating evidence has suggested that diet plays a significant role in the development and progression of hypertension (5–7). Dietary pattern was more comprehensive to reflect the synthesized effect of foods or nutrients compared with individual food or nutrient (8). It has been widely used as an alternative method to assess the relationship between whole diet and hypertension (9). Over the past few decades, dietary patterns, such as Dietary Approaches to Stop Hypertension (DASH) (10) and Mediterranean Dietary Pattern (MDP) (11), have been suggested to have a protective effect on hypertension.
With the rapid development of China's economy in recent years, China has undergone a rapid nutritional transition. Meanwhile, due to China's vast territory and rich food variety, dietary patterns may vary between different regions and cultural environments. For example, in North China, the diet in Inner Mongolia was characterized by “high protein,” “traditional northern,” “modern,” and “condiments” patterns (12). In Southwest China, Diqing of Yunnan Province, three dietary patterns were identified, namely, “Grassland healthy,” “Tuber and meat,” and “Fruit and vegetable” (13). In Yangtze River Delta region, people tended to adhere to a healthy diet pattern named as “Southern River-style dietary pattern,” including high consumption of vegetables and fruits in season, freshwater fish and shrimp, and legumes, and moderate consumption of whole-grain rice, plant oils (mainly rapeseed oil), and red meat (14). However, there were limited studies on the association between dietary patterns and hypertension in Eastern China (15). Moreover, high economic development in Eastern China may be accompanied by high levels of environmental pollution and corresponding food contaminants (16, 17). Hence, the aim of this study was, therefore, to provide the latest evidence on the association between dietary patterns and hypertension among community residents in Eastern China.
Methods
Participants and Setting
The subset of the Suzhou Food Consumption and Health State Survey was a cross-sectional study conducted in Suzhou, Eastern China, in 2018–2019. A multistage stratified cluster random sampling method was used to recruit potential participants. A total of 3,595 participants were invited. Among them, 112 participants did not complete the dietary survey. We excluded 599 participants under the age of 18 years and those with implausible dietary data (energy intake <800 or > 6,000 kcal in males, energy intake <600 or >4,000 kcal in females) (n = 13). In addition, we excluded those participants with BMI <14 kg/m2 or BMI > 45 kg/m2 (n = 153). A total of 2,718 participants (males =1,288, females = 1,430) were included in the final analysis (Figure 1).
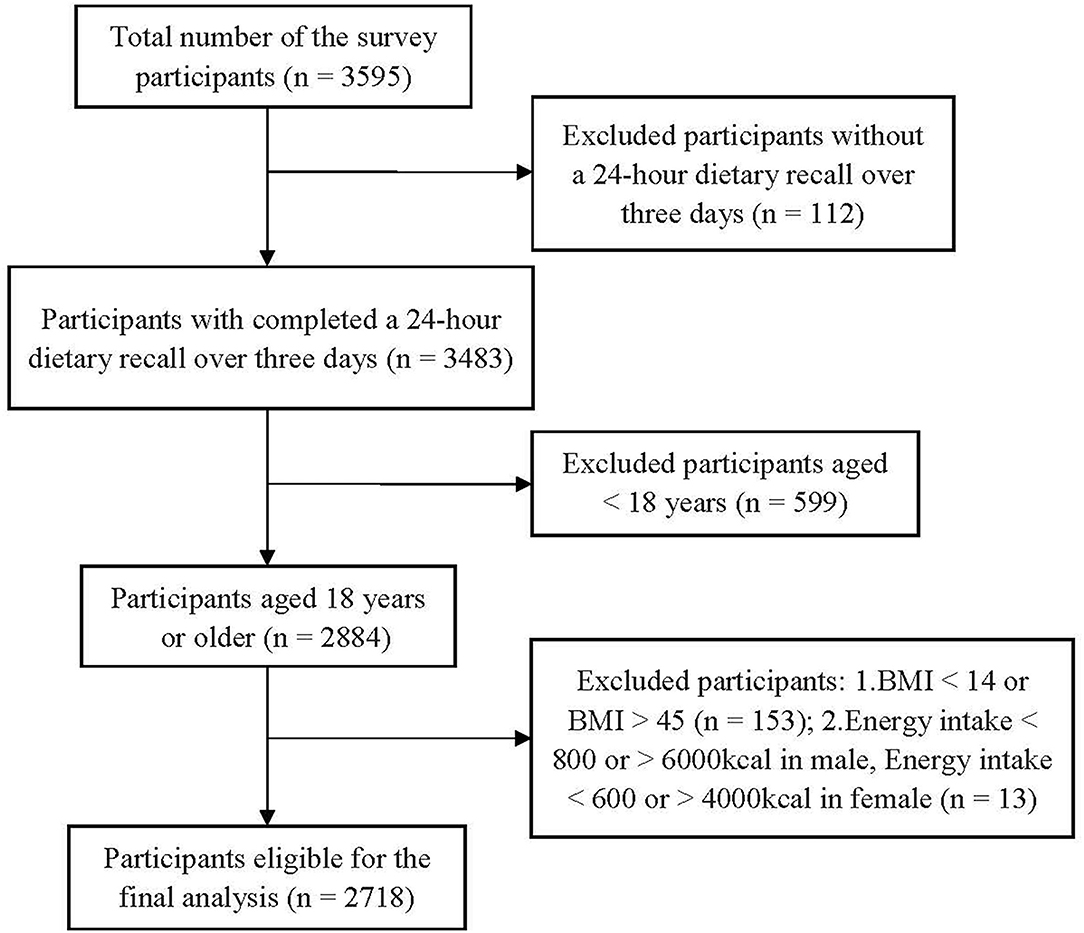
Figure 1. Flowchart of study selection.
Dietary Assessment
Dietary data were collected using a 24-h dietary recall and a weighing method over 3 consecutive days (including 2 weekdays and 1 weekend day) by trained investigators. Participants were asked to recall the types and quantities of food consumed during a 24-h dietary recall via a face-to-face interview. A weighing method was used to collect the information on daily consumption of major seasonings, including cooking oil, salt, sugar, monosodium glutamate, soy sauce, and vinegar. This method has been used in the China National Nutrition Surveys and is widely accepted by international researchers (18). This was done by interviewers at the participants' homes after dinner at night. Consumption of condiments was obtained by weighing condiments purchased and wasted. The survey was conducted following a standardized protocol.
Definition of Hypertension
Data on hypertension was based on a measurement of BP and self-report via a questionnaire. BP was measured using an electronic sphygmomanometer (Omron Hp-1300, OMRON Corporation, Japan) on the right arm positioned at heart level after a 5-min rest period in a sitting position following standard procedures. BP was measured two times at 2-min intervals, and the mean value of two measurements was used for data analysis. Meanwhile, participants were asked the following questions: “Have you been diagnosed with hypertension by a qualified doctor in a township or higher level hospital?” and “Have you taken any antihypertensive medicine within the last 2 weeks?” Participants were considered as hypertensive if they had a systolic BP ≥ 140 mmHg, diastolic BP ≥ 90 mmHg, diagnosis of hypertension, or antihypertensive medication.
Covariates
The participants' information, including age, gender, education, smoking status, alcohol drinking, sleeping disorders, and family history of hypertension, were collected by a reviewer-administrated questionnaire at enrollment. Education was classified into three categories, namely, low: illiterate/primary school; medium: junior middle school; and high: senior middle school/university. Smoking status was categorized into three groups, namely, non-smokers, ex-smokers, and current smokers. Participants were defined as drinking alcohol if the average drinking frequency was ≥ once a month in the last 12 months (19). Participants were considered as having sleep disorders if they had self-reported sleep-disordered breathing or insomnia (20). Participants were asked the following question: “How much time do you usually spend sitting every day? (including all sedentary time, such as working, studying, reading, watching TV, using computer, and taking rest whenever sitting). Sedentary time was divided into tertiles. The weighing method over 3 consecutive days (including 2 weekdays and 1 weekend day) in the population was performed to estimate the salt intake as described in a recent study (21). Daily salt intake was divided into three categories, namely, <4 g/day, 4–6 g/day, and >6 g/day.
Self-reported history of diabetes, dyslipidemia, coronary heart disease, stroke (ischemic and hemorrhagic stroke), and other chronic diseases [including chronic obstructive pulmonary disease, asthma, bone and joint disease, and neck or waist diseases (such as cervical spondylopathy, lumbar strain, and spinal disc herniation), chronic digestive system disease, chronic urinary system disease, and malignant tumor] ever diagnosed in a township or higher-level hospital by a qualified doctor were recorded.
Waist circumference (WC) was measured midway between the lowest rib and the iliac crest or 1 cm above the umbilicus, against bare skin, but subtracting 1 cm if on top of undergarments (22). WC was continuously measured two times to the nearest 0.1 cm using a soft non-stretchable tape, and the average of two measurements was used for data analysis. The waist circumference threshold for abdominal obesity was ≥ 85 cm in women and ≥ 90 cm in men, respectively (23).
Statistical Analysis
The sociodemographic and lifestyle characteristics were described as medians (interquartile ranges) for continuous variables and frequencies with percentages for categorical variables. The chi-square test was used to compare the characteristics of participants with and without hypertension for categorical variables, and Kruskal-Wallis tests were used for continuous variables.
We grouped food items according to similar nutrient contents. Accordingly, all of the foods were classified into 21 groups, including rice and products, vegetables (fresh leafy and non-leafy vegetables), aquatic products, red meat, other crops and potatoes, eggs, soybeans and products, phycomycetes (mushroom, Auricularia auricula, Porphyra, and kelp), nuts, poultry, fast food, snacks, beverages, dairy, fruit, yogurt, sweets, desserts, pickles, wheat and wheat products, and alcohol. Dietary patterns were identified by factor analysis. The number of factors retained was determined using the scree plot (eigenvalues > 1) and the interpretability of every factor. Orthogonal (varimax) rotation was applied to improve interpretability and minimize the correlation between the factors. As a result, four dietary patterns were extracted, and dietary pattern scores were categorized into quartiles.
Association between each dietary pattern and hypertension was tested by binary logistic regression with adjustment for potential confounding factors. Three sensitivity analyses were performed to determine the robustness of findings in the primary analysis. First, we restricted the risk-association analyses to those participants without self-reported diabetes, dyslipidemia, coronary heart disease, stroke, and other chronic diseases. Second, we analyzed the risk associations among participants without self-reported hypertension to minimize the possibility of reverse causation. Third, we further examined the risk associations by taking the participants with prehypertension [defined as systolic BP ≥ 120 mmHg and <140 mmHg or diastolic BP ≥ 80 mmHg and <90 mmHg (24)] as a separate group using ordinal logistic regression models. All statistical tests were two-tailed, and a P-value <0.05 was considered statistically significant. All statistical analyses were performed using SAS statistical software (version 9.4; SAS Institute, Inc.).
Results
Participant Characteristics
Of the 2,718 eligible participants, 727 participants reported with hypertension. Compared to those without hypertension, individuals with hypertension were generally older and had abdominal obesity (P <0.001). The participants with hypertension were more likely to be men, current smoker, alcohol drinker, and have high education level (P <0.001). In addition, there were significant differences in energy intake, sleeping disorders, family history of hypertension, daily salt intake, and sedentary time (P <0.05) between the participants with and without hypertension (Table 1).
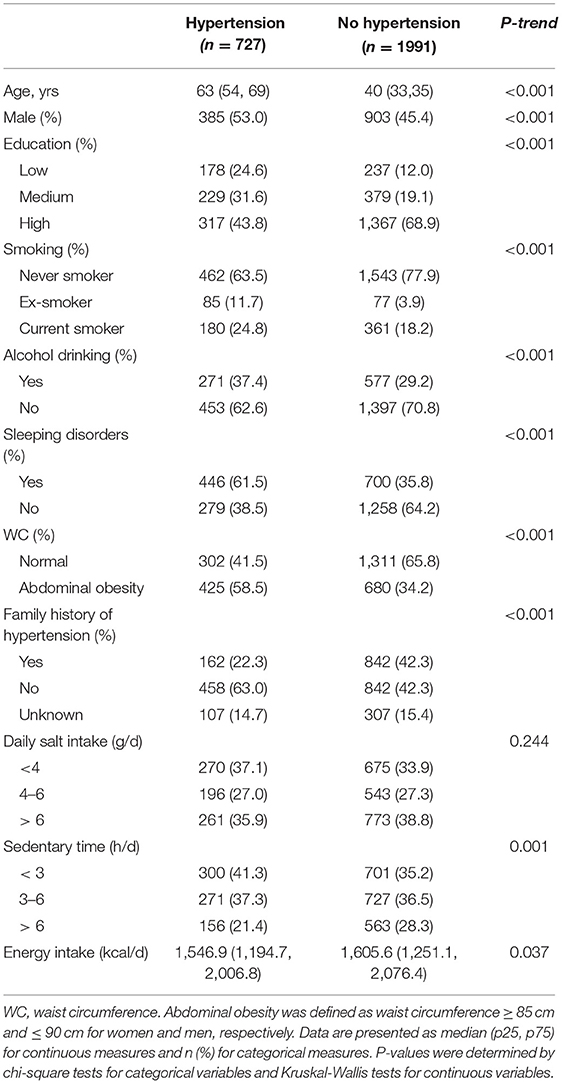
Table 1. Sociodemographic and lifestyle characteristics between participants with and without hypertension: The Suzhou Food Consumption and Health Survey.
Dietary Patterns
Four dietary patterns were identified, namely, the rice-vegetable pattern, the fast food pattern, the fruit-dairy pattern, and the wheat-meat pattern, respectively, based on their main food components. The rice-vegetable pattern was characterized by a high intake of vegetables, rice and products, and aquatic products. The fast food dietary pattern was highly correlated with intakes of fast food, beverages, soybean, and products. The fruit-dairy dietary pattern was related to high intakes of fruits, yogurt, and milk. The wheat-meat pattern was distinguished by high intakes of wheat, red meat, and desserts. The four dietary patterns accounted for 28.5% of the variance in the total food intake, as shown in Table 2.
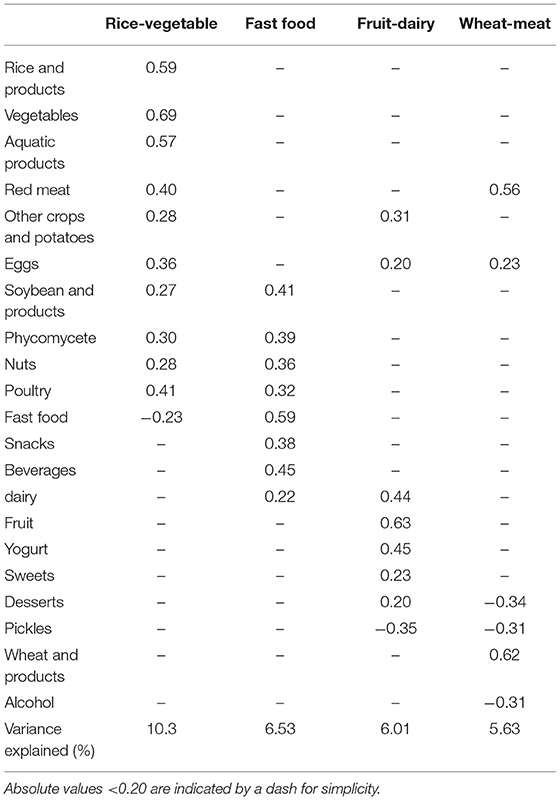
Table 2. Factor loading of dietary patterns.
Characteristics According to Dietary Patterns
The characteristics of the participants across the quartile of the four dietary patterns are presented in Table 3. Participants in the highest quartile of the rice-vegetable pattern were more likely to be older, male, current smoker, and alcohol drinker; have lower level of education; and exhibit a higher proportion of sleeping disorders, higher energy intake, abdominal obesity, and higher intake of salt than those in the lowest quartile (P <0.05). Participants with higher adherence to the fast food pattern tended to be younger, had higher levels of education; and had more sedentary time (P <0.001). In addition, there were also significant differences in the family history of hypertension and sleeping disorders across the fast food pattern (P <0.05). Participants in the highest quartile of the fruit-dairy pattern were more likely to be younger, female, have higher level of education, never smoker, no drinking, and exhibit significantly lower WC and prevalence of hypertension than those in the lowest quartile (P <0.05). Participants in the highest quartile of the wheat-meat pattern were more likely to be younger, male, and without hypertension than their counterparts in the lowest quartiles (P <0.001). Moreover, there were significant differences in sleeping disorders, level of education, and family history of hypertension across the quartile of the wheat-meat pattern (P <0.05).
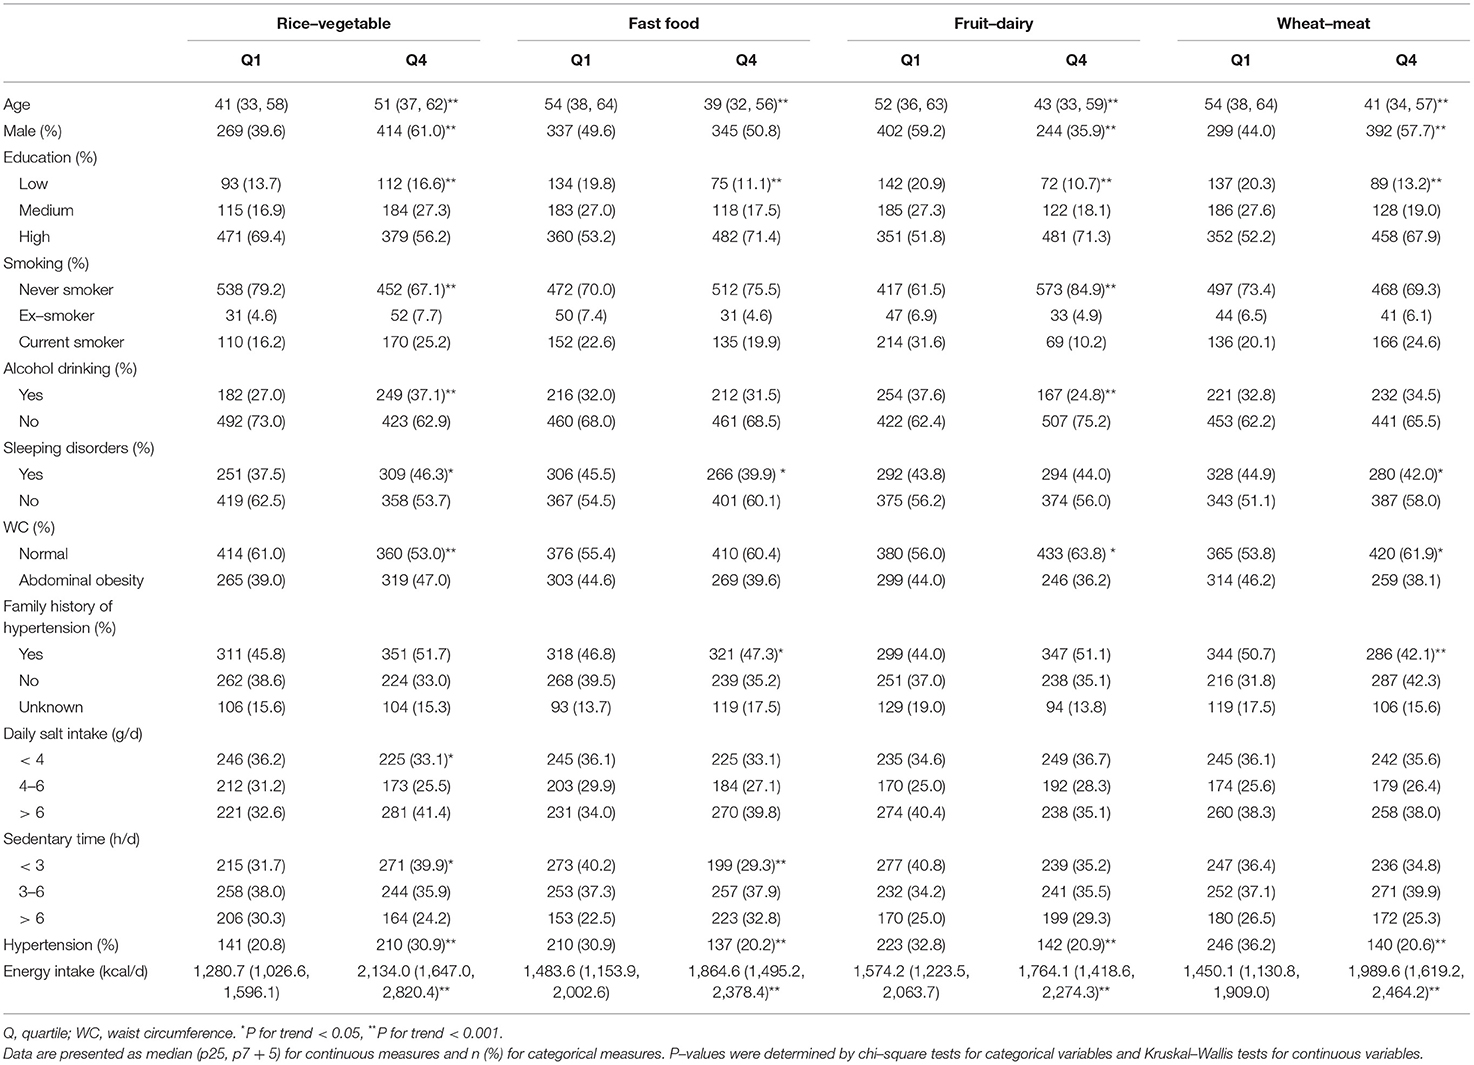
Table 3. Sociodemographic, lifestyle, and anthropometric characteristics of the study participants across quartiles of the dietary patterns scores (n = 2,718).
Associations Between Dietary Patterns and Hypertension
As shown in Table 4, the fruit-dairy pattern was inversely associated with hypertension both in the crude model (P for trend = 0.029) and in the model adjusted for age, sex, energy, education, smoking, alcohol drinking, sleeping disorders, daily salt intake, sedentary time, WC, and family history of hypertension (P for trend = 0.002). Compared with the lowest quartile of the pattern, participants at the highest quartile had lower odds of hypertension (OR = 0.55; 95% CI: 0.40, 0.75; P = 0.002). Meanwhile, the wheat-meat pattern was also inversely associated with hypertension prevalence in crude model and model adjusted confounders (OR = 0.70; 95% CI: 0.51, 0.97; P = 0.049). In contrast, we did not observe significant associations between the other two patterns with hypertension (P trend > 0.05). In the first two sensitivity analyses, the association between the fruit-dairy pattern and hypertension remained consistently significant. However, this risk association was rendered statistically non-significant between the wheat-meat pattern and hypertension (data not shown). As shown in Supplementary Table S1, the association between the fruit-dairy pattern and hypertension remained significant if the participants with prehypertension were regarded as a separate group (OR = 0.67; 95% CI: 0.53, 0.84; P = 0.001).
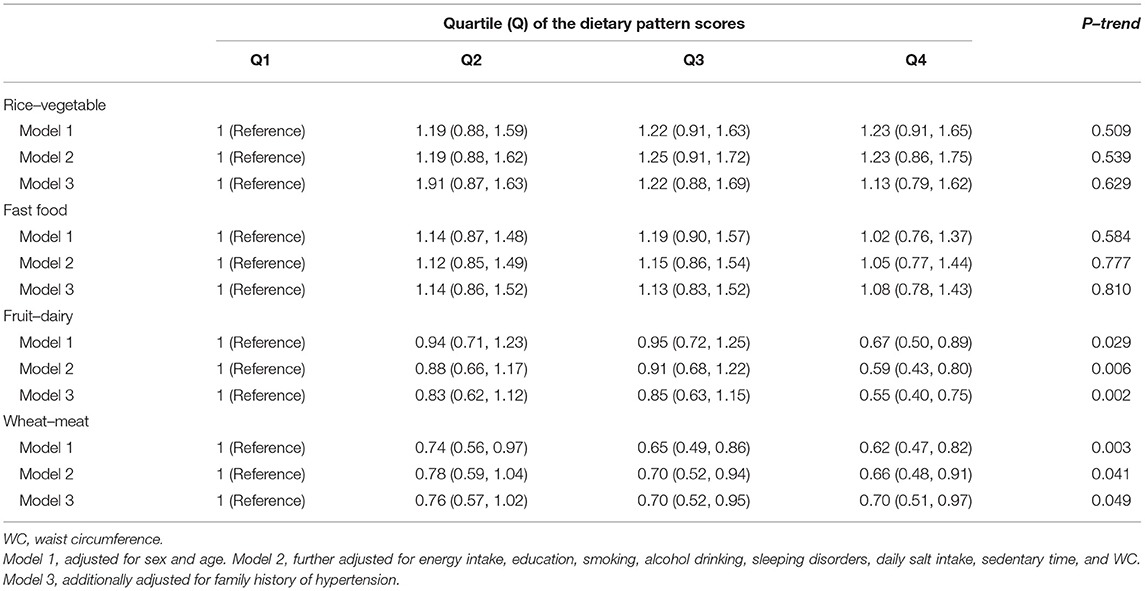
Table 4. Adjusted odds ratio (95% CI) for the association between dietary patterns and hypertension (n = 2,718).
Discussion
In this study, we observed that the fruit-dairy pattern was independently and inversely correlated with hypertension. No significant associations were found for the other three dietary patterns identified after multivariable adjustments and by sensitivity analyses. The crude prevalence of hypertension in our study was 26.7%, which was at an intermediate level compared with the rates in other areas in China (estimated range: 18.0–44.7%) (25, 26).
Factor analysis deriving dietary patterns in our study yielded simple structure and great interpretability (27). It has been widely used to explore the association between multiple dietary components and chronic diseases, which allows for comparisons in different regions (28).
The Four Dietary Patterns and Hypertension
The fruit-dairy pattern was associated with a lower risk of hypertension, which was consistent with the previous studies (29, 30). A cohort study conducted in Shanghai suggested that more adherence to a fruit and milk pattern characterized by fruit and milk was associated with a decreased prevalence of both pre-hypertension and hypertension (31). The fruit and milk pattern was similar to the fruit-dairy pattern identified in our study in that fruit and yogurt were the primary components of the pattern. A number of mechanisms may explain this finding.
First, nutrients included in fruits and dairy have been reported to be effective in lowering BP (32, 33). Marques et al. (34) found that a high intake of dietary fiber from fruit has a protective effect on hypertension and other cardiovascular diseases via changing gut microbiota. Second, when we examined each individual fruit in the fruit-dairy pattern, a strong positive association was observed for apples and citrus fruits. It has been reported that the consumption of apples and citrus fruits may help to regulate BP (35). Nutrients, including vitamin C, potassium, and magnesium, rich in apples and citrus fruits, may play important roles in BP regulation pathways (36). Indeed, we observed that the participants in the highest quartile of the fruit-dairy pattern were more likely to have higher intakes of vitamin C, potassium, and magnesium than those in the lowest quartile (P <0.01). Third, milk and yogurt are rich sources of both calcium and vitamin D, which have been shown to work together in vascular smooth muscle cells to regulate BP through the regulation of intracellular calcium concentrations (37). Fourth, the fruit-dairy pattern can indirectly lower BP via body weight regulation, whereas overweight/obese is one of the major risk factors for hypertension (38). A study comprising two cohorts showed that increased intake of fruit was beneficial to mitigate body weight (39). Panahi et al. (40) demonstrated that frequent yogurt consumption meant a healthier diet quality, as consumption of yogurt can effectively control body weight, energy homeostasis, and glycemic level, thus contributing to better metabolic health. Fifth, our study indicates that subjects who belonged to the highest quartile of the fruit-dairy pattern were more likely to be alcohol abstainers and have a normal WC, compared with those in the lowest quartile. Emerging evidence has shown that alcohol drinking and abdominal obesity were closely related to the elevation of BP (41–43).
In our study, the fruit-dairy pattern was a new pattern compared with a previous study conducted in Eastern China in 2016 (15), which implies that the eating habits have been in transition in this area (44). Meanwhile, the fruit-dairy pattern was inversely associated with hypertension, which provides a new direction to prevent and control hypertension among community residents in Eastern China.
The other three patterns were not significantly associated with hypertension in our study. The null association of the rice-vegetable observed in our study was inconsistent with a previous report (15). The potential antihypertensive effect of vegetable consumption may be offset by the detrimental effect of polished rice, oil, and salt use (when stir-frying vegetables in Chinese cuisine) (45). Another explanation is that rice and vegetable in the region may have relatively high levels of lead and cadmium (16, 17), which were related to BP. For the fast food pattern, our finding was supported by a cross-sectional study, including 2,560 Chinese participants, which showed that Western fast food patterns were not associated with hypertension (46). The fast food pattern was similar to the high fast food pattern, which was reported as a risk factor for cardiovascular disease (47), but participants with better adherence to the fast food pattern tended to be younger and had fewer sleeping disorders in our study. Younger and better sleeping quality has been considered as protective factors for BP (48, 49). Moreover, participants in the highest quartile of the fast food pattern were more likely to have higher nuts intake than those in the lowest quartile (P <0.001). Nuts are potentially protective against hypertension because of their complex compositional characteristics, such as high amounts of beneficial minerals (calcium, magnesium, and potassium) and low level of sodium (50). The wheat-meat pattern was somewhat comparable with the modern pattern reported by the China Health and Nutrition Survey (51). Although red meat intake was recognized as a risk factor for hypertension, this pattern was inversely associated with the consumption of desserts, another risk factor for BP (52). The participants in the highest quartile of the wheat-meat pattern were more likely to avoid dessert intake than those in the lowest quartile (P <0.05).
Strengths and Limitations
The main strengths of this study include its representative sample of the residents in Suzhou, Eastern China, and the latest evidence on dietary patterns and hypertension, which could provide new insight into the prevention of hypertension in this area. However, limitations also need to be considered in the interpretation of our findings. First, bias may exist for dietary data collected by a 24-h dietary recall. A 24-h dietary recall may not be able to well reflect long-term eating habits among the participants (53). Second, we were unable to assess the salt intake using 24-h urine sodium excretion considered as the least biased method, since urine samples were not collected (54). Third, although a wide range of sociodemographic and health-related variables were included as potential covariates in this study, residual confounding may still exist. Fourth, the cross-sectional design of this study limited causal inference, and reverse causation cannot be completely precluded.
Conclusion
This study provided the latest evidence on the association between dietary patterns and hypertension among community residents in Eastern China. Four dietary patterns were derived in this study by using factor analysis. We observed that the fruit-dairy pattern was inversely associated with the risk of hypertension among the study participants. We suggest that it is necessary to consider the whole diet when making hypertension prevention recommendations for policy-makers. Also, more prospective studies are warranted to determine the relationship between dietary quality and hypertension in different areas in China.
Data Availability Statement
The raw data supporting the conclusions of this article will be made available by the authors, without undue reservation.
Ethics Statement
The studies involving human participants were reviewed and approved by Ethics Committee of Suzhou Center for Disease Control and Prevention (SZJK2018-YY001). The patients/participants provided their written informed consent to participate in this study.
Author Contributions
CW formulated the research questions. YZhe and CW analyzed the data, interpreted the findings, and wrote the manuscript. YZha, DL, and LG compiled the drawings, proofread, and corrected the original manuscript. BW and HZ designed the study, supervised the work, critically revised the manuscript, and approved the final manuscript. All authors contributed to the article and approved the submitted version.
Conflict of Interest
The authors declare that the research was conducted in the absence of any commercial or financial relationships that could be construed as a potential conflict of interest.
Publisher's Note
All claims expressed in this article are solely those of the authors and do not necessarily represent those of their affiliated organizations, or those of the publisher, the editors and the reviewers. Any product that may be evaluated in this article, or claim that may be made by its manufacturer, is not guaranteed or endorsed by the publisher.
Supplementary Material
The Supplementary Material for this article can be found online at: https://www.frontiersin.org/articles/10.3389/fnut.2022.926390/full#supplementary-material
References
1. Zhou B, Danaei G, Stevens GA, Bixby H, Taddei C, Carrillo-Larco RM. Long-term and recent trends in hypertension awareness, treatment, and control in 12 high-income countries: an analysis of 123 nationally representative surveys. Lancet. (2019) 394:639–51. doi: 10.1016/S0140-6736(19)31145-6
2. Ettehad D, Emdin CA, Kiran A, Anderson SG, Callender T, Emberson J, et al. Blood pressure lowering for prevention of cardiovascular disease and death: a systematic review and meta-analysis. Lancet. (2016) 387:957–67. doi: 10.1016/S0140-6736(15)01225-8
3. Bundy J D, He J. Hypertension and related cardiovascular disease burden in China. Ann Glob Health. (2016) 82:227–33. doi: 10.1016/j.aogh.2016.02.002
4. Wang Z, Chen Z, Zhang L, Wang X, Hao G, Zhang Z, et al. Status of hypertension in China: results from the china hypertension survey, 2012-2015. Circulation. (2018) 137:2344–56. doi: 10.1161/CIRCULATIONAHA.117.032380
5. Htun NC, Suga H, Imai S, Shimizu W, Ishikawa-Takata K, Takimoto H. Dietary pattern and its association with blood pressure and blood lipid profiles among Japanese adults in the 2012 Japan National Health and Nutrition Survey. Asia Pac J Clin Nutr. (2018) 27:1048–61. doi: 10.6133/apjcn.072018.04
6. Ndanuko RN, Tapsell LC, Charlton KE, Neale EP, Batterham MJ. Dietary patterns and blood pressure in adults: a systematic review and meta-analysis of randomized controlled trials. Adv Nutr. (2016) 7:76–89. doi: 10.3945/an.115.009753
7. Gay HC, Rao SG, Vaccarino V, Ali MK. Effects of different dietary interventions on blood pressure: systematic review and meta-analysis of randomized controlled trials. Hypertension. (2016) 67:733–9. doi: 10.1161/HYPERTENSIONAHA.115.06853
8. Jaalouk D, Matar Boumosleh J, Helou L, Abou Jaoude M. Dietary patterns, their covariates, and associations with severity of depressive symptoms among university students in Lebanon: a cross-sectional study. Eur J Nutr. (2019) 58:997–1008. doi: 10.1007/s00394-018-1614-4
9. Hu FB. Dietary pattern analysis: a new direction in nutritional epidemiology. Curr Opin Lipidol. (2002) 13:3–9. doi: 10.1097/00041433-200202000-00002
10. Sacks FM, Obarzanek E, Windhauser MM, Svetkey LP, Vollmer WM, McCullough M, et al. Rationale and design of the Dietary Approaches to Stop Hypertension trial (DASH). A multicenter controlled-feeding study of dietary patterns to lower blood pressure. Ann Epidemiol. (1995) 5:108–18. doi: 10.1016/1047-2797(94)00055-X
11. Panagiotakos DB, Pitsavos C, Arvaniti F, Stefanadis C. Adherence to the Mediterranean food pattern predicts the prevalence of hypertension, hypercholesterolemia, diabetes and obesity, among healthy adults; the accuracy of the MedDietScore. Prev Med. (2007) 44:335–40. doi: 10.1016/j.ypmed.2006.12.009
12. Wang X, Liu A, Du M, Wu J, Wang W, Qian Y, et al. Diet quality is associated with reduced risk of hypertension among Inner Mongolia adults in northern China. Public Health Nutr. (2020) 23:1543–54. doi: 10.1017/S136898001900301X
13. Ruan Y, Huang Y, Zhang Q, Qin S, Du X, Sun Y. Association between dietary patterns and hypertension among Han and multi-ethnic population in southwest China. BMC Public Health. (2018) 18:1106. doi: 10.1186/s12889-018-6003-7
14. He Y, Ma G, Zhai F, Li Y, Hu Y, Feskens EJ, et al. Dietary patterns and glucose tolerance abnormalities in Chinese adults. Diabetes Care. (2009) 32:1972–6. doi: 10.2337/dc09-0714
15. Zheng PF, Shu L, Zhang XY Si CJ Yu XL, Gao W, et al. Association between dietary patterns and the risk of hypertension among chinese: a cross-sectional study. Nutrients. (2016) 8:239. doi: 10.3390/nu8040239
16. Dudarev AA, Yamin-Pasternak S, Pasternak I, Chupakhin VS. Traditional diet and environmental contaminants in coastal chukotka iv: recommended intake criteria. Int J Environ Res Public Health. (2019) 16:696. doi: 10.3390/ijerph16050696
17. Shi Z, El-Obeid T, Li M, Xu X, Liu J. Iron-related dietary pattern increases the risk of poor cognition. Nutr J. (2019) 18:48. doi: 10.1186/s12937-019-0476-9
18. Zhu Q, Yu L, Li Y, Man Q, Jia S, Zhou Y, et al. Association between dietary fiber intake and hyperuricemia among Chinese adults: analysis of the China adult chronic disease and nutrition surveillance 2015. Nutrients. (2022) 14:1433. doi: 10.3390/nu14071433
19. Zhang H, Zhao X, Li Y, Mao Z, Huo W, Jiang J, et al. Night sleep duration and sleep initiation time with hypertension in Chinese rural population: the Henan Rural Cohort. Eur J Public Health. (2020) 30:164–70. doi: 10.1093/eurpub/ckz142
20. Xie Z, Chen F, Li WA, Geng X, Li C, Meng X, et al. A review of sleep disorders and melatonin. Neurol Res. (2017) 39:559–65. doi: 10.1080/01616412.2017.1315864
21. Li Y, Wang DD, Ley SH, Vasanti M, Howard AG, He Y, et al. Time trends of dietary and lifestyle factors and their potential impact on diabetes burden in China. Diabetes Care. (2017) 40:1685–94. doi: 10.2337/dc17-0571
22. Chen Z, Smith M, Du H, Guo Y, Clarke R, Bian Z, et al. Blood pressure in relation to general and central adiposity among 500 000 adult Chinese men and women. Int J Epidemiol. (2015) 44:1305–19. doi: 10.1093/ije/dyv012
23. Seo MH, Lee WY, Kim SS, Kang JH, Kang JH, Kim KK, et al. 2018 Korean Society for the study of obesity guideline for the management of obesity in Korea. J Obes Metab Syndr. (2019) 28:40–5. doi: 10.7570/jomes.2019.28.1.40
24. Chobanian AV, Bakris GL, Black HR, Cushman WC, Green LA, Izzo JL Jr, et al. The seventh report of the Joint National Committee on prevention, detection, evaluation, and treatment of high blood pressure: the JNC 7 report. Jama. (2003) 289:2560–72. doi: 10.1001/jama.289.19.2560
25. Yin R, Yin L, Li L, Silva-Nash J, Tan J, Pan Z, et al. Hypertension in China: burdens, guidelines and policy responses: a state-of-the-art review. J Hum Hypertens. (2022) 36:126–34. doi: 10.1038/s41371-021-00570-z
26. Wang Y, Peng X, Nie X, Chen L, Weldon R, Zhang W, et al. Burden of hypertension in China over the past decades: systematic analysis of prevalence, treatment and control of hypertension. Eur J Prev Cardiol. (2016) 23:792–800. doi: 10.1177/2047487315617105
27. Ambrosini GL, Fritschi L, de Klerk NH, Mackerras D, Leavy J. Dietary patterns identified using factor analysis and prostate cancer risk: a case control study in Western Australia. Ann Epidemiol. (2008) 18:364–70. doi: 10.1016/j.annepidem.2007.11.010
28. Mohammadifard N, Sarrafzadegan N, Nouri F, Sajjadi F, Alikhasi H, Maghroun M, et al. Using factor analysis to identify dietary patterns in Iranian adults: Isfahan Healthy Heart Program. Int J Public Health. (2012) 57:235–41. doi: 10.1007/s00038-011-0260-x
29. Weng LC, Steffen LM, Szklo M, Nettleton J, Chambless L, Folsom AR, et al. diet pattern with more dairy and nuts, but less meat is related to lower risk of developing hypertension in middle-aged adults: the Atherosclerosis Risk in Communities (ARIC) study. Nutrients. (2013) 5:1719–33. doi: 10.3390/nu5051719
30. Weng LC, Steffen LM, Szklo M, Nettleton J, Chambless L, Folsom AR. Association between dietary behavior and risk of hypertension among Japanese male workers. Hypertens Res. (2013) 36:374–80. doi: 10.1038/hr.2012.205
31. Lee SA, Cai H, Yang G, Xu WH, Zheng W, Li H, et al. Dietary patterns and blood pressure among middle-aged and elderly Chinese men in Shanghai. Br J Nutr. (2010) 104:265–75. doi: 10.1017/S0007114510000383
32. Mahmood S, Shah KU, Khan TM, Nawaz S, Rashid H, Baqar SWA, et al. Non-pharmacological management of hypertension: in the light of current research. Ir J Med Sci. (2019) 188:437–52. doi: 10.1007/s11845-018-1889-8
33. van Dam RM, Grievink L, Ocké MC, Feskens EJ. Patterns of food consumption and risk factors for cardiovascular disease in the general Dutch population. Am J Clin Nutr. (2003) 77:1156–63. doi: 10.1093/ajcn/77.5.1156
34. Marques FZ, Nelson E, Chu PY, Horlock D, Fiedler A, Ziemann M, et al. High-fiber diet and acetate supplementation change the gut microbiota and prevent the development of hypertension and heart failure in hypertensive mice. Circulation. (2017) 135:964–77. doi: 10.1161/CIRCULATIONAHA.116.024545
35. Borgi L, Muraki I, Satija A, Willett WC, Rimm EB, Forman JP. Fruit and vegetable consumption and the incidence of hypertension in three prospective cohort studies. Hypertension. (2016) 67:288–93. doi: 10.1161/HYPERTENSIONAHA.115.06497
36. Savica V, Bellinghieri G, Kopple J D. The effect of nutrition on blood pressure. Annu Rev Nutr. (2010) 30:365–401. doi: 10.1146/annurev-nutr-010510-103954
37. Morvaridzadeh M, Sepidarkish M, Fazelian S, Rahimlou M, Omidi A, Ardehali SH, et al. Effect of calcium and vitamin D co-supplementation on blood pressure: a systematic review and meta-analysis. Clin Ther. (2020) 42:e45–63. doi: 10.1016/j.clinthera.2020.01.005
38. Seravalle G, Grassi G. Obesity and hypertension. Pharmacol Res. (2017) 122:1–7. doi: 10.1016/j.phrs.2017.05.013
39. Wang T, Heianza Y, Sun D, Zheng Y, Huang T, Ma W, et al. Improving fruit and vegetable intake attenuates the genetic association with long-term weight gain. Am J Clin Nutr. (2019) 110:759–68. doi: 10.1093/ajcn/nqz136
40. Panahi S, Fernandez MA, Marette A, Tremblay A. Yogurt, diet quality and lifestyle factors. Eur J Clin Nutr. (2017) 71:573–9. doi: 10.1038/ejcn.2016.214
41. Vallée A, Gabet A, Deschamps V, Blacher J, Olié V. Relationship between nutrition and alcohol consumption with blood pressure: The ESTEBAN survey. Nutrients. (2019) 11:1433. doi: 10.3390/nu11061433
42. Rhee EJ, Cho JH, Kwon H, Park SE, Jung JH, Han KD, et al. Association between abdominal obesity and increased risk for the development of hypertension regardless of physical activity: A nationwide population-based study. J Clin Hypertens. (2018) 20:1417–26. doi: 10.1111/jch.13389
43. Roerecke M, Kaczorowski J, Tobe SW, Gmel G, Hasan OSM, Rehm J. The effect of a reduction in alcohol consumption on blood pressure: a systematic review and meta-analysis. Lancet Public Health. (2017) 2:e108–e20. doi: 10.1016/S2468-2667(17)30003-8
44. Bu T, Tang D, Liu Y, Chen D. Trends in dietary patterns and diet-related behaviors in China. Am J Health Behav. (2021) 45:371–83. doi: 10.5993/AJHB.45.2.15
45. Shu L, Zheng PF, Zhang XY Si CJ Yu XL, Gao W, et al. Association between dietary patterns and the indicators of obesity among Chinese: a cross-sectional study. Nutrients. (2015) 7:7995–8009. doi: 10.3390/nu7095376
46. Zhang Y, Wang Y, Chen Y, Zhou J, Xu L, Xu K, et al. Associations of dietary patterns and risk of hypertension in Southwest China: a prospective cohort study. Int J Environ Res Public Health. (2021) 18 . doi: 10.3390/ijerph182312378
47. Bahadoran Z, Mirmiran P, Azizi F. Fast food pattern and cardiometabolic disorders: a review of current studies. Health Promot Perspect. (2015) 5:231–40. doi: 10.15171/hpp.2015.028
48. Palagini L, Bruno RM, Gemignani A, Baglioni C, Ghiadoni L, Riemann D. Sleep loss and hypertension: a systematic review. Curr Pharm Des. (2013) 19:2409–19. doi: 10.2174/1381612811319130009
49. Buford T W. Hypertension and aging. Aging Res Rev. (2016) 26:96–111. doi: 10.1016/j.arr.2016.01.007
50. Bae Y J, Kim M H, Choi M K. Dietary mineral intake from nuts and its relationship to hypertension among Korean adults. Biol Trace Elem Res. (2021). doi: 10.1007/s12011-021-02952-3
51. Zhen S, Ma Y, Zhao Z, Yang X, Wen D. Dietary pattern is associated with obesity in Chinese children and adolescents: data from China Health and Nutrition Survey (CHNS). Nutr J. (2021) 17:68. doi: 10.1186/s12937-018-0372-8
52. Chen Y, Fang Z, Zhu L, He L, Liu H, Zhou C. The association of eating behaviors with blood pressure levels in college students: a cross-sectional study. Ann Transl Med. (2021) 9:155. doi: 10.21037/atm-20-8031
53. Liu J, Rehm CD, Micha R, Mozaffarian D. Quality of Meals Consumed by US Adults at Full-Service and Fast-Food Restaurants, 2003-2016: Persistent Low Quality and Widening Disparities. J Nutr. (2020) 150:873–83. doi: 10.1093/jn/nxz299
Keywords: dietary pattern, factor analysis, hypertension, dietary recall, cross-sectional study
Citation: Wang C, Zheng Y, Zhang Y, Liu D, Guo L, Wang B and Zuo H (2022) Dietary Patterns in Association With Hypertension: A Community-Based Study in Eastern China. Front. Nutr. 9:926390. doi: 10.3389/fnut.2022.926390
Received: 22 April 2022; Accepted: 13 June 2022;
Published: 08 July 2022.
Edited by:
Farhana Akter, Chittagong Medical College, BangladeshReviewed by:
Rita Akutsu, Rita de Cássia Coelho de Almeida Akutsu, BrazilShelly R. McFarlane, University of the West Indies, Jamaica
Copyright © 2022 Wang, Zheng, Zhang, Liu, Guo, Wang and Zuo. This is an open-access article distributed under the terms of the Creative Commons Attribution License (CC BY). The use, distribution or reproduction in other forums is permitted, provided the original author(s) and the copyright owner(s) are credited and that the original publication in this journal is cited, in accordance with accepted academic practice. No use, distribution or reproduction is permitted which does not comply with these terms.
*Correspondence: Bo Wang, 153652012@qq.com; Hui Zuo, zuohui@suda.edu.cn
†These authors have contributed equally to this work and share first authorship