Associations Between Dietary Patterns and Neuroimaging Markers: A Systematic Review
 Rebecca F. Townsend1
  Jayne V. Woodside1,2
  Federica Prinelli3 Roisin F. O’Neill1
  Claire T. McEvoy1,2*
- 1Centre for Public Health, Queen’s University Belfast, Belfast, United Kingdom
- 2Institute for Global Food Security, Queen’s University Belfast, Belfast, United Kingdom
- 3Institute of Biomedical Technologies, National Research Council, Milan, Italy
Dementia is a complex, growing challenge for population health worldwide. Dietary patterns (DPs) may offer an opportunity to beneficially influence cognitive ageing and potentially reduce an individuals’ risk of dementia through diet-related mechanisms. However, previous studies within this area have shown mixed results, which may be partly explained by the lack of sensitivity and accuracy within cognitive testing methods. Novel neuroimaging techniques provide a sensitive method to analyse brain changes preceding cognitive impairment which may have previously remained undetected. The purpose of this systematic review was to elucidate the role of DPs in relation to brain ageing processes, by summarising current prospective and intervention studies. Nine prospective studies met the inclusion criteria for the review, seven evaluated the Mediterranean diet (MeDi), one evaluated the Alternative Healthy Eating Index-2010, and one evaluated a posteriori derived DPs. No intervention studies were eligible for inclusion in this review. There was some evidence of an association between healthy DPs and neuroimaging markers including changes within these markers over time. Consequently, it is plausible that better adherence to such DPs may positively influence brain ageing and neurodegeneration. Future studies may benefit from the use of multi-modal neuroimaging techniques, to further investigate how adherence to a DP influences brain health. The review also highlights the crucial need for further intervention studies within this research area.
Introduction
Dementia is a global challenge within the twenty-first century. Over 50 million individuals worldwide are estimated to live with the condition, a number that is expected to treble by 2050 (1). Up to 40% of future cases could be prevented or delayed by targeting modifiable factors (2). Previous observational research suggests greater adherence towards a healthy dietary pattern (DP) is associated with slower cognitive decline (3–7) and reduced risk of Alzheimer’s disease (AD) (the most common cause of dementia) (8–12) in later life. Yet, the limited data from randomised controlled trials (RCT) have not convincingly demonstrated a protective effect of diet on cognition. For example, two RCT’s found intervention with an enhanced Mediterranean diet (MeDi) enhanced with either nuts or extra-virgin olive oil (EVOO) improved Mini-Mental State Examination (MMSE) scores ranging from 4 to 6 years post-intervention, in older adults with high vascular risk (13, 14). However, a sub-study from the same cohort also found cognitive performance only improved significantly in those supplementing the MeDi with EVOO and not those that supplemented with nuts, when compared to controls (15). Similarly, another study also found intervention with a MeDi supplemented with dairy foods did not significantly improve cognition in middle-aged adults (16). Intervention studies investigating DPs other than the MeDi have also found inconsistent results (17–20).
A potential reason for the inconsistent findings may be the relatively short trial duration, making it difficult to discern effects on cognition and the narrow range of cognitive endpoints assessed. Subsequently, there is a need to determine which aspects of cognition are sensitive to dietary change, and the optimum timescale over which to observe these effects during trials. Furthermore, diet intervention is likely to have the most benefit during preclinical stages of AD, where it is more difficult to detect such minimal deterioration in cognition. However, due to advancements in neuroimaging techniques, there is now the ability to sensitively measure changes within brain health, which can help to elucidate potential diet-related mechanisms of neurodegeneration. For example, accumulating cross-sectional data suggest a protective association of healthy DPs on brain structures and functions. In particular, adherence to the MeDi has been associated with reduced brain atrophy, specifically in AD-vulnerable regions (21) including the hippocampus (22) and posterior cingulate cortex (23). Furthermore, better adherence to the MeDi has also been associated with less amyloid-β (Aβ) burden (24).
There have been limited comprehensive reviews of whole DPs and neuroimaging biomarkers (25–27). A previous systematic review (28) evaluated evidence published up to 2017. However, several prospective studies investigating DPs and neuroimaging outcomes have been published since 2017, which have not yet been synthesized. More recently, a systematic review (25) suggested evidence of associations between healthy DPs and brain imaging correlates, which preceded cognitive decline. However, only studies reporting both cognitive performance and neuroimaging biomarkers were reviewed, meaning that several studies reporting neuroimaging markers alone were not eligible for review. A further review (26) investigated DPs in relation to neuroimaging markers but only in middle-aged adults, meaning studies including both younger and older age adults were excluded. An additional review (27), investigated any aspect of diet or metabolism in relation to neuroimaging markers and included some, but not all available (29, 30) studies investigating DPs in relation to neuroimaging markers. It should be noted that these latter three reviews included evidence from cross-sectional studies, from which a causal relationship between diet and neurocognitive outcomes cannot be established. Therefore, we aimed to synthesise the available data from RCTs and prospective studies to evaluate effects of DPs on neuroimaging biomarkers. This review will address the following research questions; (1) What is the relationship between DPs and neuroimaging markers across the adult life course? and (2) What is the effect of DPs on changes in neuroimaging measures over time?
Methods
Study Design and Systematic Review Protocol
This systematic review was undertaken based on the Centre for Reviews and Dissemination (CRD) guidance for undertaking systematic reviews in health care. The protocol for this review was registered with PROSPERO database (PROSPERO 2020: CRD42020181423). The review presented here focuses on neuroimaging outcomes from part of a broader review on DPs and neurocognitive outcomes.
Search Strategy and Data Sources
A systematic literature search was conducted using two major databases; EMBASE and Ovid MEDLINE (a subset of PubMed), for relevant studies published up to 5 March 2020. A detailed search strategy (shown in Supplementary Table 1) was developed (28, 31), using key terms associated with DPs and neuroimaging markers. The primary search was limited to humans and English language publications. Articles were considered eligible for review if they were an RCT or prospective observational design and met the following criteria; (i) measured adherence/exposure to ≥1 whole DP, (ii) reported neuroimaging outcomes using any imaging measure/technique; (iii) evaluated the effect of diet in relation to any specified brain ageing outcome(s) or determined the association between diet and brain ageing outcomes. Intervention studies were eligible for inclusion if they were of RCT design and met the above criteria. We placed no restrictions on intervention duration or type. As studies were required to include ≥1 whole DP, those which focused on a single food, macronutrient group, were based on nutrients alone or focused on calorie restriction or weight loss, without overall consideration for dietary quality were excluded. Multi-domain lifestyle exposures/interventions were also excluded, due to the difficulty in disentangling potential effects from diet alone. Studies within the same cohort were excluded if the exposures and outcomes studied were analysed identically within each.
Data Extraction
The process of study selection and data extraction was managed using EndNote software version X9 and Rayyan online software. Titles of all potentially eligible studies were screened by R.F.T. and those not including any keywords relating to the review were excluded. Two reviewers (R.F.T. and C.T.ME.) screened the abstracts of all remaining studies independently before assessing the remaining studies further for eligibility via retrieval and independent reading of full texts. Any discrepancies or queries regarding inclusion of studies were then resolved through discussion among the research team (R.F.T, C.T.ME., and J.V.W). For duplicated study cohorts reporting identical diet exposure and neuroimaging outcome(s) at different time points, the study with the longest follow-up period was included. Data was collected from each study identified as eligible for inclusion using a standardized form. For prospective studies included, the following information was collected; names of authors, year of publication and study cohort name (if applicable); country of study location; follow-up period (years); exclusion and inclusion criteria; method to derive DP (a priori or a posteriori); dietary assessment tools used (e.g., 24 h recall, food frequency questionnaire (FFQ), diet record, diet history); DP(s) examined; time points at which DP was examined; neuroimaging methods; primary outcomes effect size and/or summary of main findings; covariates included in adjusted models (where applicable).
Risk of Bias Assessment
Two reviewers (R.F.T and R.F.ON.) independently examined the quality of each study included in the review using the Newcastle-Ottawa Scale (NOS) (32) for prospective studies. Studies could be awarded a maximum of nine stars in total. Up to four stars could be awarded for selection of study (representation within sample, selection of sample, exposure measurement, and demonstration outcome not present at baseline). Up to two stars could be awarded within the comparability domain (controls for basic confounders or includes additional confounding factors) comparability and up to three stars for outcome measurement (including methodology of outcome assessment, follow-up length, and adequacy of follow-up cohort). Studies were considered high quality if they scored 9 stars, medium quality if 7–8 stars were scored, or low quality if ≤6 stars were scored.
Data Analysis
Due to the heterogeneity within the data collected in terms of neuroimaging markers, statistical analyses and reporting of data, a quantitative analysis was not possible. Consequently, a narrative synthesis was used to present results alongside detailed tables.
Results
Study Selection
The preferred reporting items for systematic reviews and meta-analyses (PRISMA) flow diagram is shown in Figure 1. From the primary systematic search in March 2020, 10,194 articles were identified, 978 of which were removed due to duplication. Following title and abstract screening, 9,065 articles were excluded. From the remaining 158 full text articles, a further 149 were excluded (see Figure 1). A total of 79 articles [70 prospective studies and 9 randomised control trials (RCT)] were therefore included within the broader systematic review; 9 of which included neuroimaging markers and were included in this review.
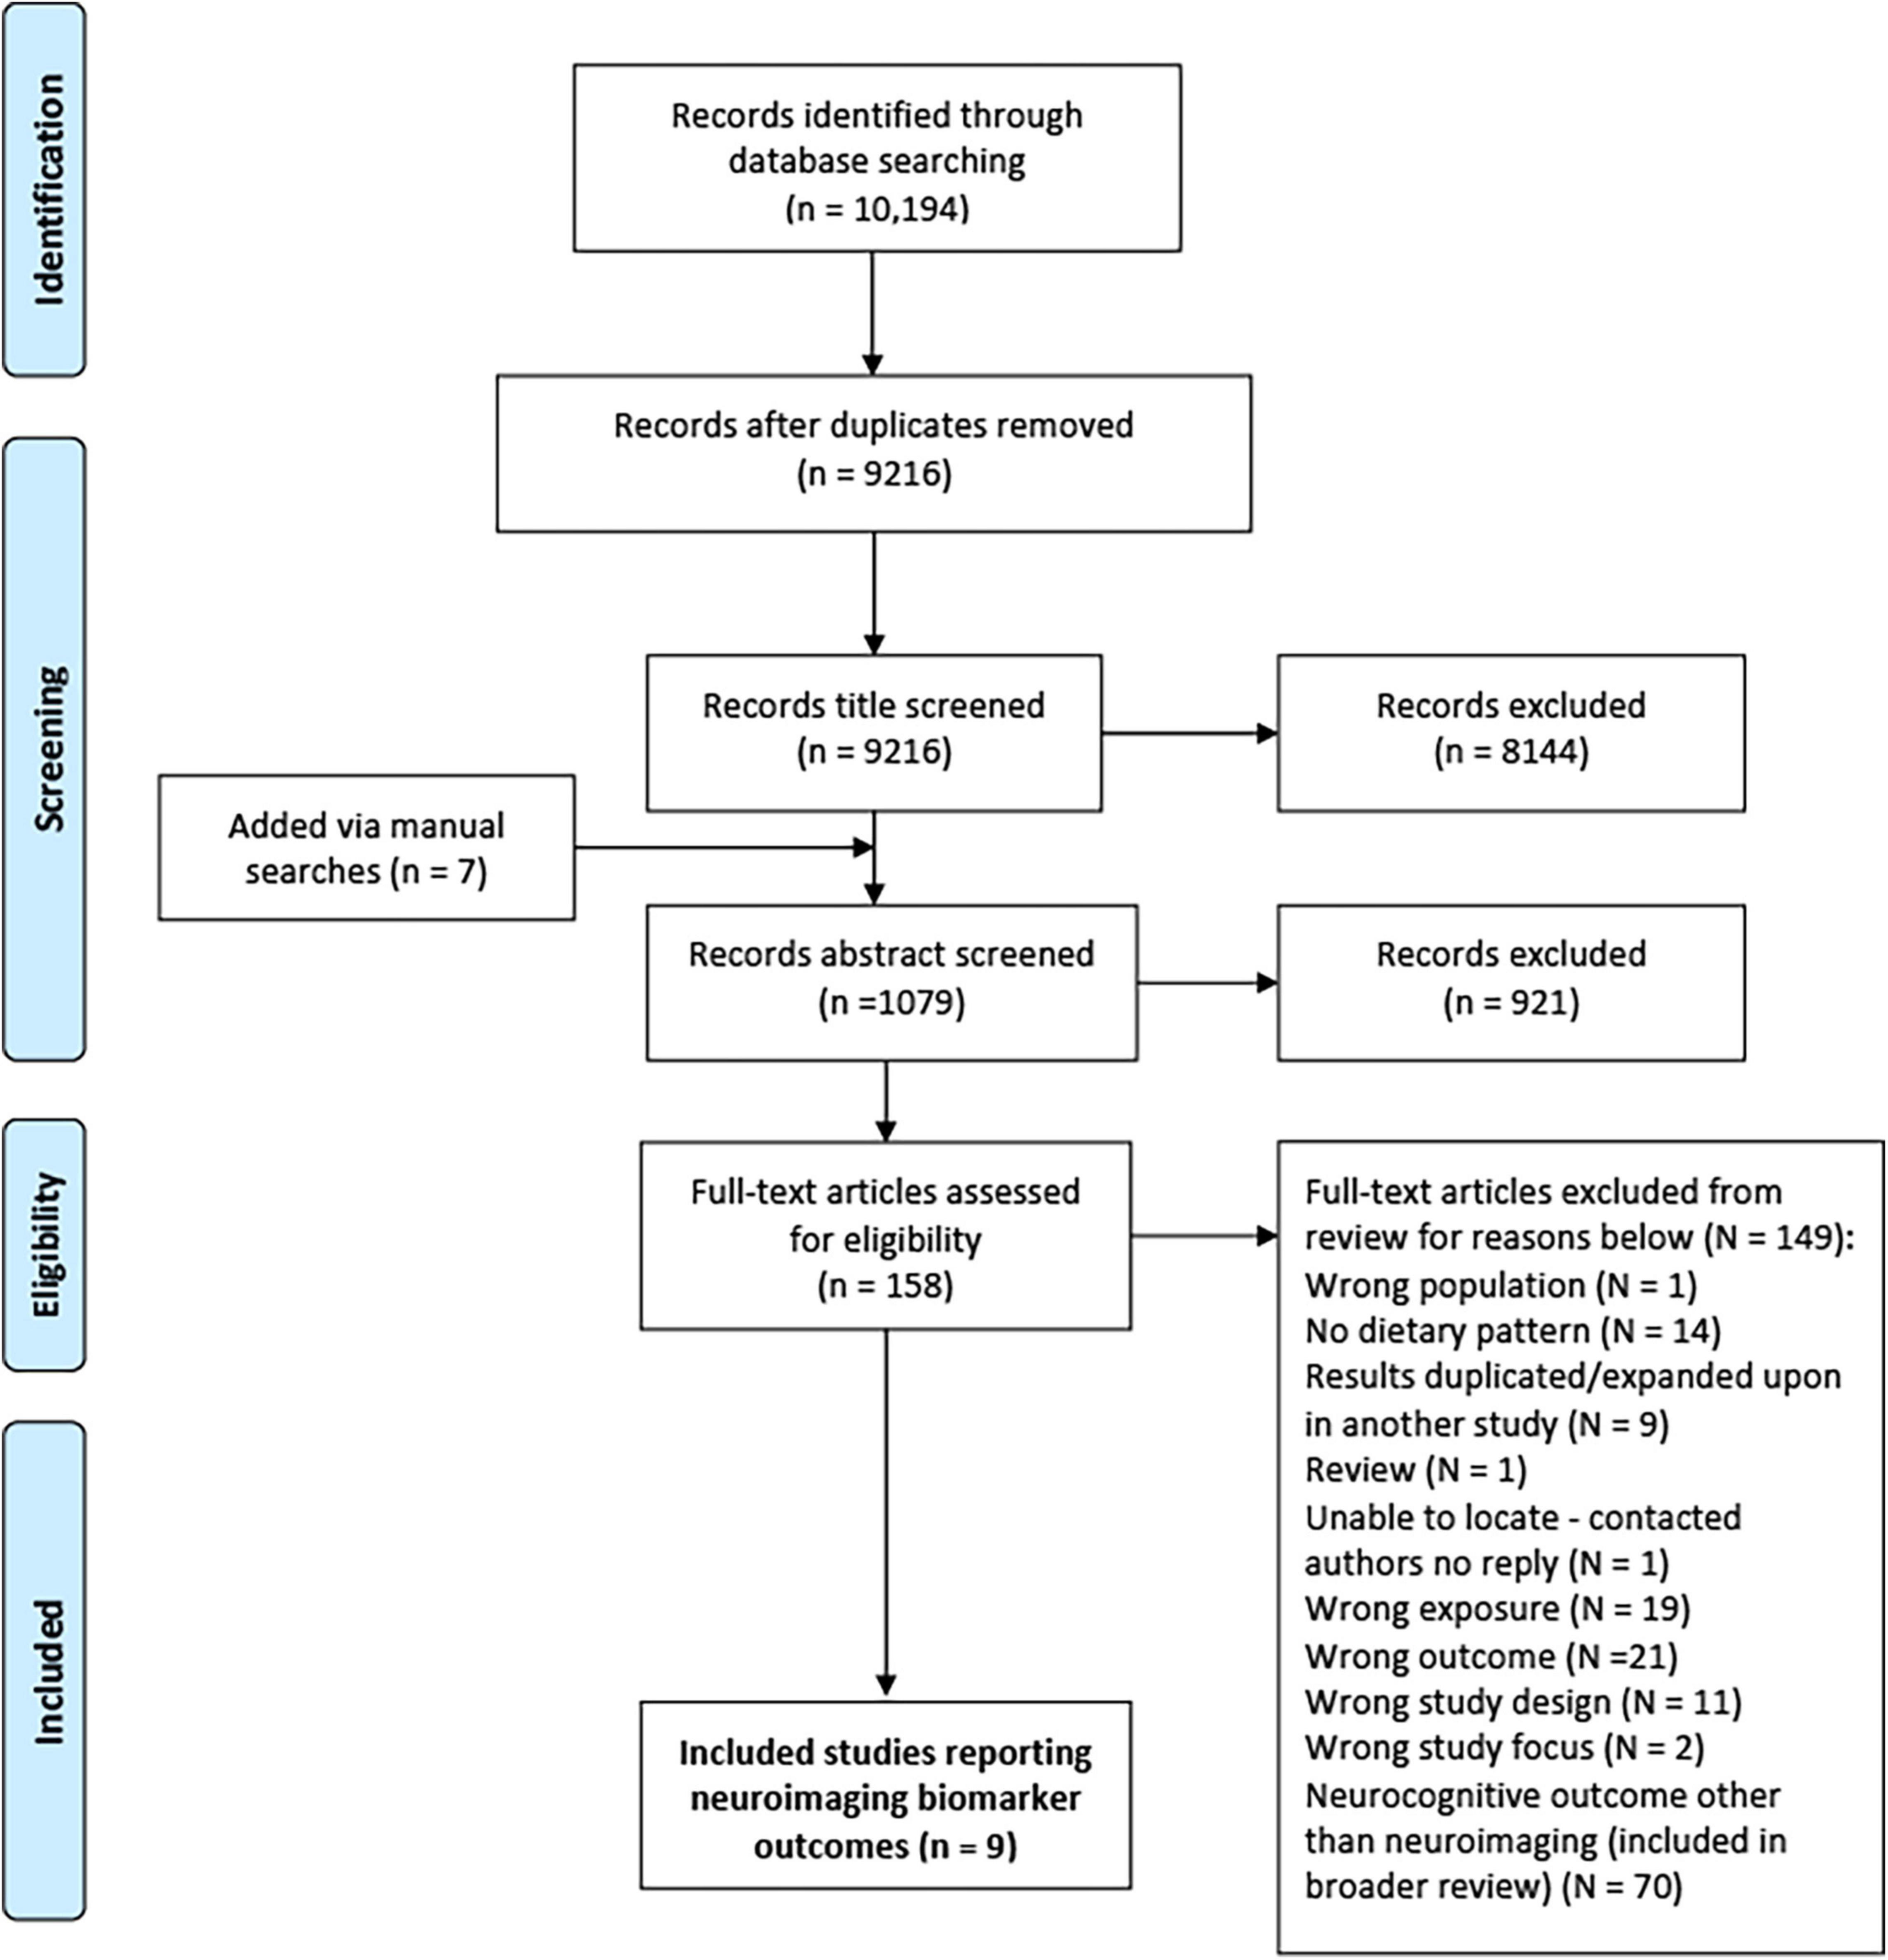
Figure 1. PRISMA flow diagram for process of study selection (87).
Study Characteristics
All included articles were prospective studies published in the last 10 years (29, 30, 33–39). There were no RCTs identified. Sample sizes varied between studies ranging from 70 to 707, with a total of approximately 2,540 participants across all articles. Similarly, follow-up periods also differed greatly with the shortest period being 3 years to the longest period of 13 years. An overview of the key characteristics and findings of each study included within the review is provided in Table 1.
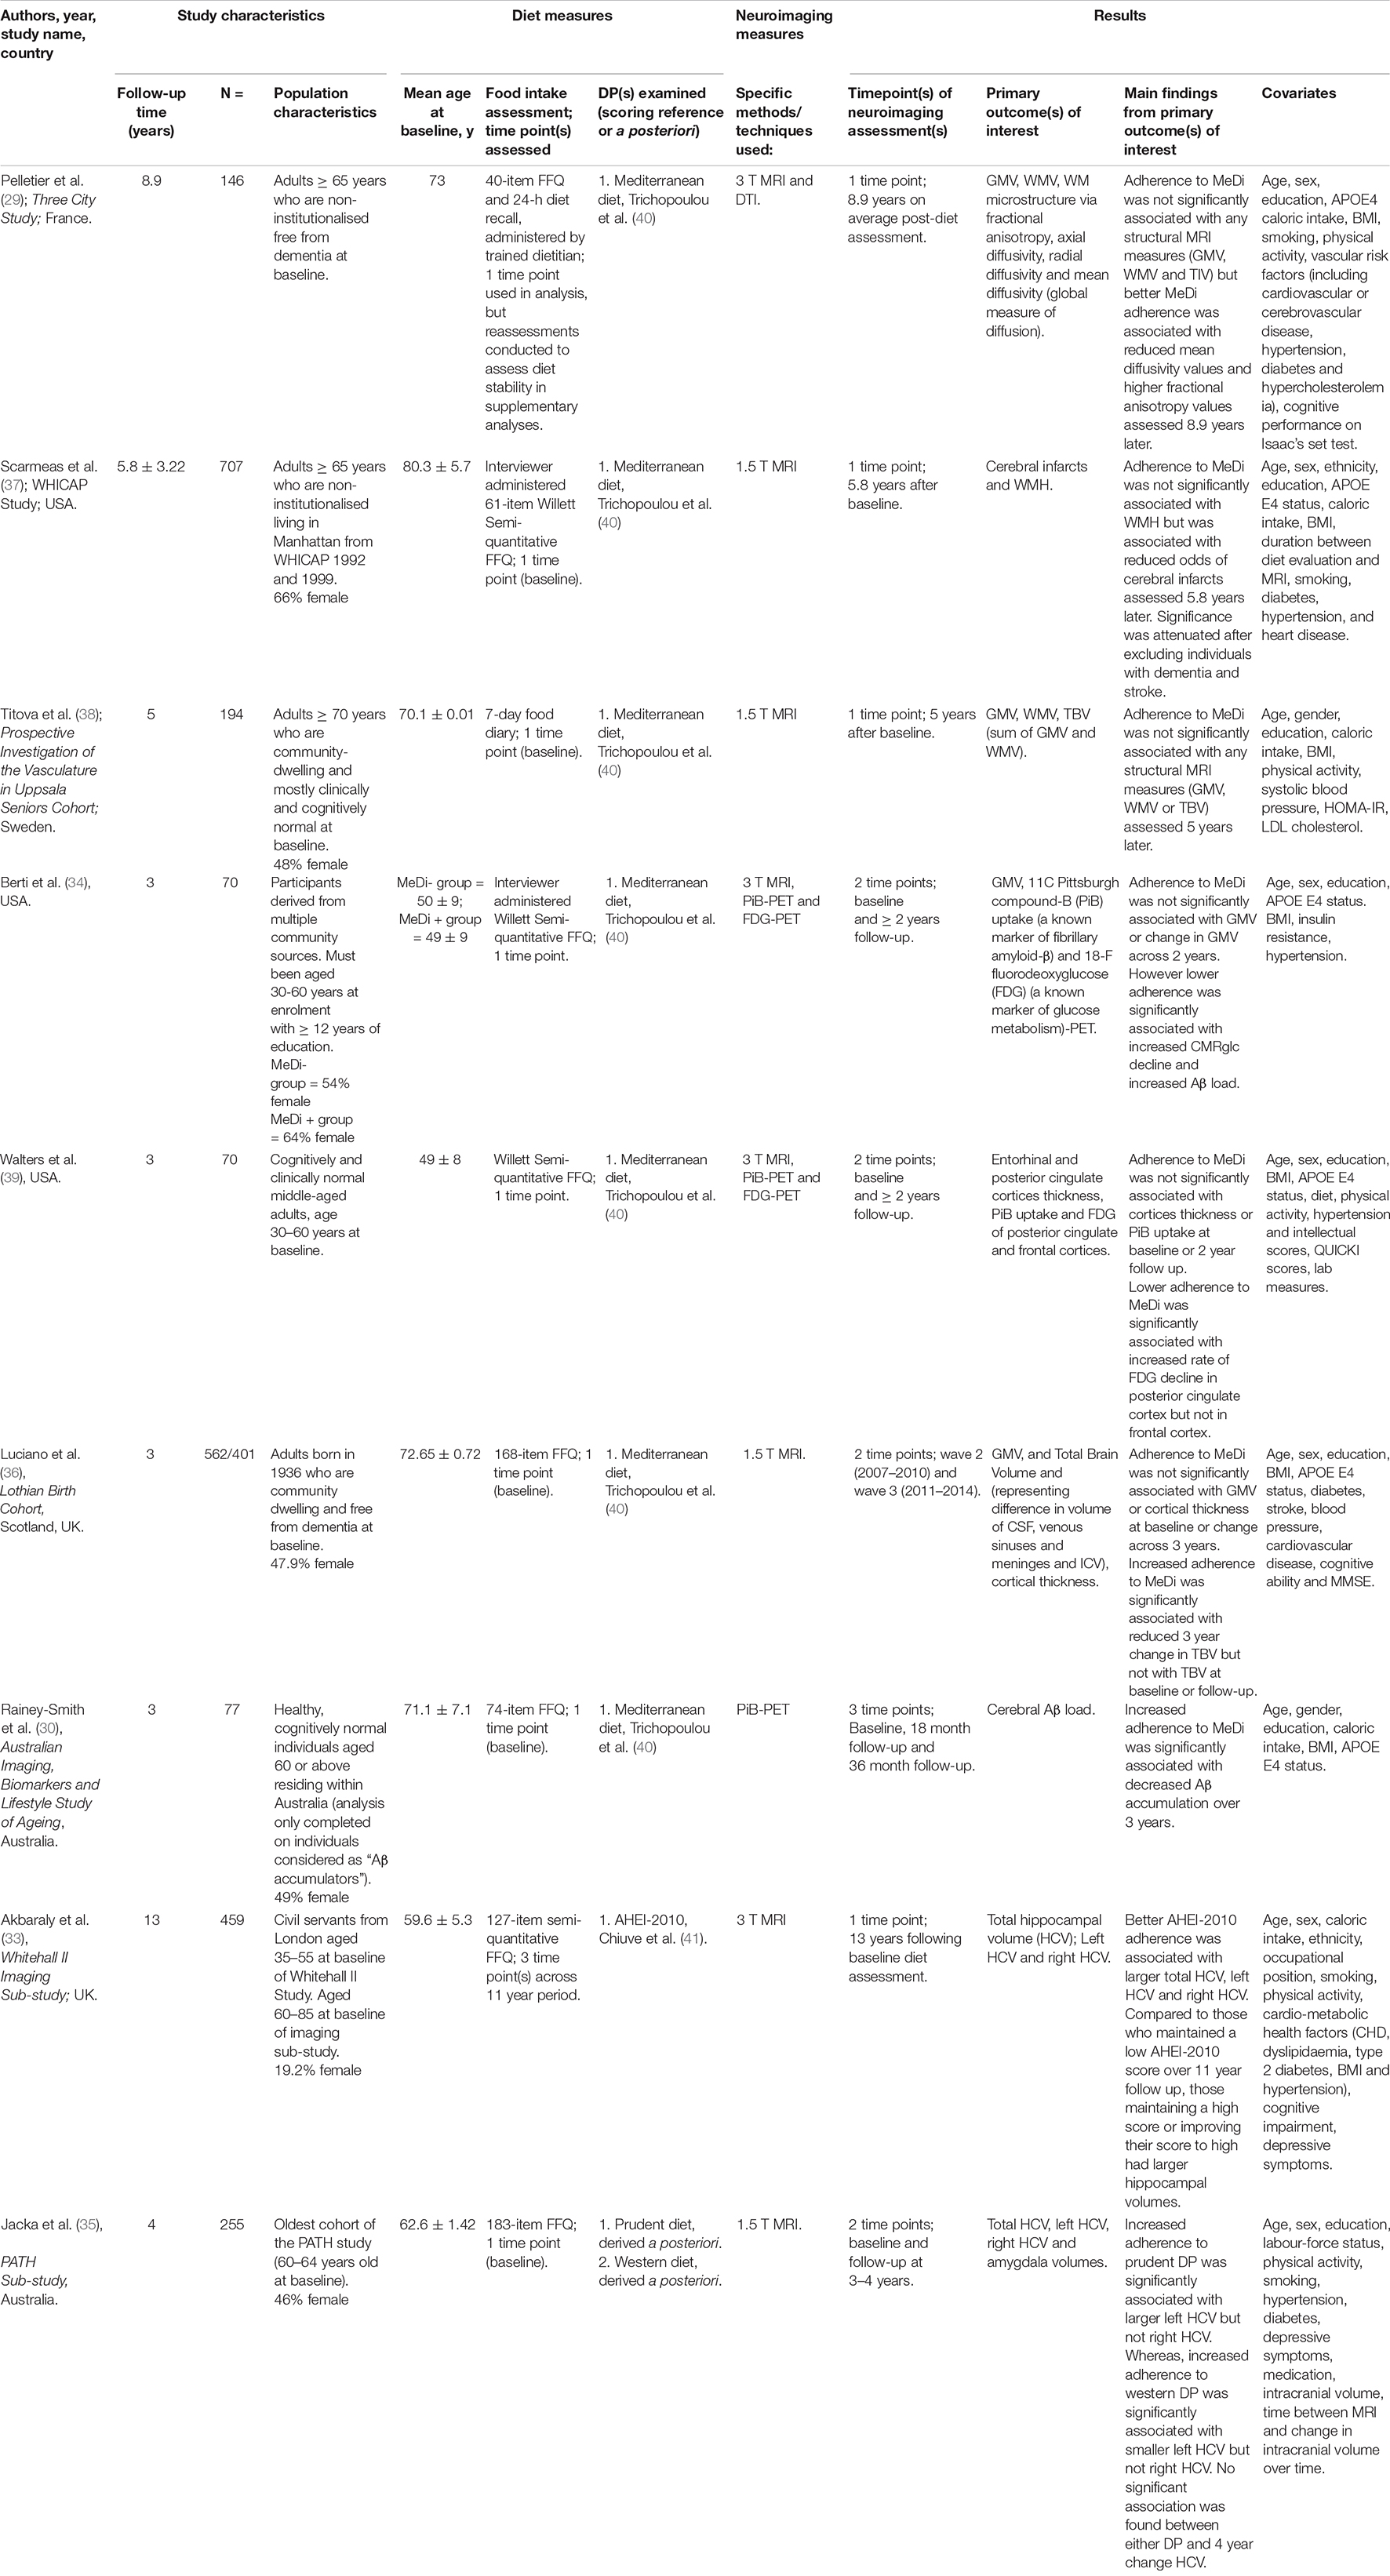
Table 1. Overview of included studies investigating DPs in relation to neuroimaging markers.
Populations Assessed
Most studies (6/9) included older aged adults (aged ≥ 60 years) (29, 30, 33, 35–38). Only two studies specifically included individuals from both young adulthood (age ≥ 30 years) and older adulthood (aged ≥ 60 years) (34, 39). Three studies were conducted in the United States of America (USA) (34, 37, 39), two from the United Kingdom (UK) (33, 36), two from Australia (30, 35), one from France (29), and one from Sweden (38).
All studies except for one (33) specified that at study baseline, participants must have been cognitively healthy and/or free from dementia. Although, one study did specifically select individuals categorised as Aβ accumulators (30). However, at the time of neuroimaging measurement, three studies reported the inclusion of individuals with cognitive impairment and/or a diagnosis of dementia (33, 37, 38). Two of these studies reported sensitivity analyses excluding those with cognitive impairment (33, 37).
The majority of studies were conducted in educated populations, with three specifically requiring ≥12 years of education to participate in the study (30, 34, 39).
Another demographic factor that may impact the relationship between DP and neuroimaging measures is ethnicity. Populations such as Black and Asian ethnic groups may experience a higher risk of developing AD (2). Yet, only four of nine included studies specifically reported participants’ ethnic demographics. Three studies (33, 34, 39) reported a high prevalence (≥70%) of white participants. In contrast, the proportion of white individuals within the Washington Heights-Hamilton Heights-Inwood Community Aging Project (WHICAP) study (37) (27%) was lower than African American individuals (35%) and Hispanic individuals (36%).
Measurement of Dietary Patterns
Assessment of Dietary Intake
Food frequency questionnaires were used in the majority of studies (8/9) to assess dietary intake. Of which, one study combined the FFQ used with another method, which was a 24-h dietary recall (29). The nature of FFQs means they lend themselves to self-reporting. However, from the studies within this review, three specifically reported that a trained individual (i.e., a dietitian or interviewer, respectively) administered the FFQ (29, 34, 37). In the one study that did not use an FFQ, a 7-day food diary was used (38).
Time Points of Diet Intake Assessment
Dietary intake data was captured at a single time point at baseline in nearly all studies (8/9) to measure adherence to the DPs studied in relation to neuroimaging markers (29, 30, 34–39). One study (33) evaluated diet exclusively retrospectively, to determine earlier life diet exposure. Diet measures were then repeated to evaluate a cumulative average and provide a value representative of longer-term adherence to the DP. It should be noted that one other study (29) also assessed diet stability through repeated diet measures within supplementary analyses, but not within main statistical analyses.
Dietary Pattern Indices
A priori scoring indices were used in eight studies to determine adherence towards a DP (29, 30, 33–39). One study utilised a posteriori methods (35). Details of the DPs studied within each article, including their respective scoring systems and food components are summarised in Supplementary Table 2.
Of the eight studies investigating a priori derived DPs, seven (29, 30, 34, 36–39) examined the MeDi and one (33) examined the Alternate Healthy Eating Index-2010 (AHEI-2010). Within the seven studies investigating the MeDi, all were based on the scoring index from Trichopoulou et al. (40), which is based on population median cut points for nine specific food components. Of which, five measured adherence to the MeDi as a continuous variable (29, 30, 36, 38, 39), one as a categorical variable (34), and one used both (37). The one study (33) which examined the AHEI-2010 used an adaptation of the index from Chiuve et al. (41). Adherence to the AHEI-2010 was measured as a continuous variable in main analyses and as a categorical variable in further analyses.
Only one study used a posteriori methodology in the form of principal component analysis (PCA). In contrast to a priori methodology, this adopts an exploratory approach and relies on dietary intake information provided to identify correlated items to enable the construction of common consumption patterns (DPs). The study included within this review defined the two DPs identified as prudent and western, which can be dichotomised as healthy and unhealthy, respectively (35). In regards to the management of energy misreporting from FFQs, some studies (30, 36, 38) reported using methods to address this.
Neuroimaging Measures
Magnetic resonance imaging (MRI) was used in eight studies to measure neuroimaging markers. MRI alone was used in five studies (33, 35–38), and in combination with either diffusion tensor imaging (DTI) (29) or positron emission tomography (PET) in three studies (34, 39). Neuroimaging markers were assessed at one time point in four studies (29, 30, 33, 36–38), two time points in four other studies (34–36, 39), and three time points in one study (30).
Results of Main Outcome Analyses
A graphical overview of each of the DPs studied in relation to either their positive or null association to neuroimaging markers is provided within Table 2.
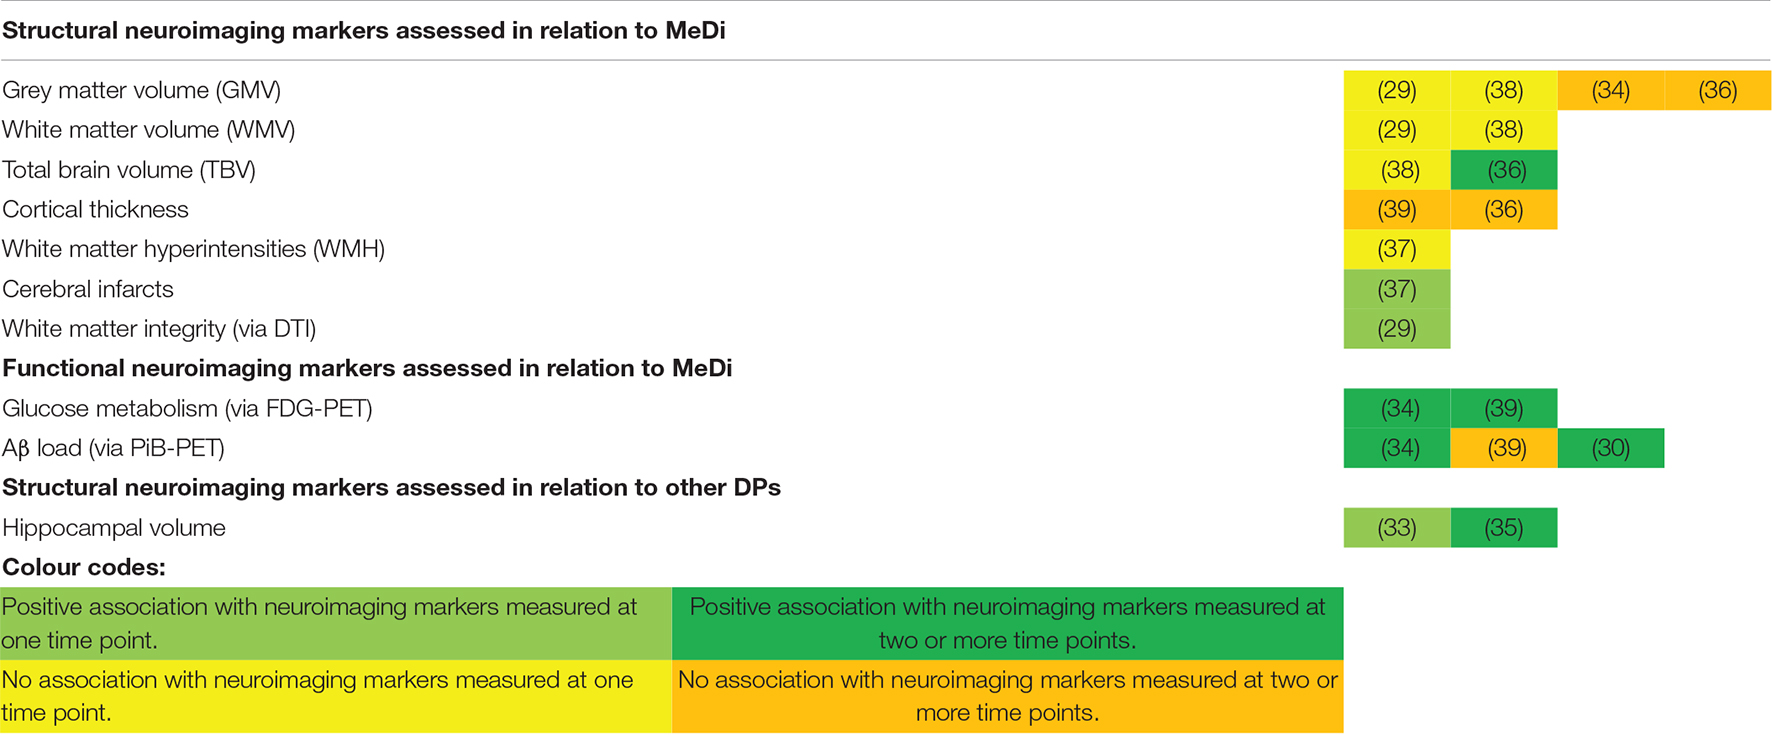
Table 2. Graphical overview of each of the DPs studied in relation to their association to neuroimaging markers.
Mediterranean Diet and Structural Neuroimaging Markers
Six studies assessed the relationship between MeDi adherence and structural neuroimaging markers. These include grey matter volume (GMV), total brain volume (TBV), cortical thickness, white matter volume (WMV), white matter integrity (WMI), white matter hyperintensities (WMH) and cerebral infarcts.
Grey Matter Volumes
In total, four studies (29, 34, 36, 38) analysed the association between GMV and adherence to the MeDi. Two studies found no significant association between adherence to MeDi and GMV measured between 5 and 8.9 years later (29, 38). Two other studies (34, 36) included repeated measures of GMV. In the Lothian birth cohort, no significant association was found between adherence to the MeDi and GMV at baseline (β = 0.182; SE = 0.553; P = 0.742), follow-up (β = 0.864; SE = 0.659; P = 0.191), or change in GMV longitudinally across 3 years in older cognitively healthy adults (β = 0.451; SE = 0.383; P = 0.240) (36). Similarly, Berti and colleagues also found no significant differences between the high and low MeDi adherence and change in GMV over 3 years in middle-aged adults from the USA (34).
Total Brain Volumes
Two studies (36, 38) assessed TBV. One study (38) found MeDi adherence was not significantly associated with TBV measured at one time point 5 years following baseline. The other study (36) found no associations between MeDi adherence and TBV at either baseline or follow-up among older cognitively healthy adults, but lower MeDi adherence was significantly associated with greater reductions in TBV across 3 years (β = 0.976; SE = 0.483; P = 0.044) (36).
Cortical Thickness
Two prospective studies examined cortical thickness in relation to MeDi adherence (36, 39). In the Lothian birth cohort, MeDi adherence was not related to 3-year change in cortical thickness between 73 and 76 years (β = 0.004; SE = 0.003; P = 0.198) (36). Likewise, Walters and colleagues also found no significant association between adherence to the MeDi and thickness of the frontal cortex or the posterior cingulate cortex at baseline or follow-up (39). Nor was there a significant association between 2-year change in frontal or posterior cingulate cortical thickness and MeDi adherence (39).
White Matter Volumes
Two studies determined WMV in relation to MeDi adherence (29, 38). Neither found an association between MeDi adherence and WMV measured at an average of 5 or 8.9 years later (29, 38).
White Matter Integrity
Only one study (29) assessed WMI. The study found a significant association between increased adherence to the MeDi and reduced diffusivity values within specific areas of the white matter skeleton (the whole corpus callosum, anterior and posterior thalamic radiations, para cingulate gyrus cingulum, and parahippocampal fornix) among older French adults (≥65 years). Better adherence to the MeDi was also associated with increased fractional anisotropy values in specific regions of the white matter skeleton (corpus callosum, anterior and posterior thalamic radiations) (29). Authors consequently explored further the associations between diffusivity and fractional anisotropy values and cognitive tests. As a result, significant associations were found between higher global cognitive scores and the DTI parameters significantly associated with the MeDi (Multivariable adjusted mean difference when comparing Q1 to Q5 of mean diffusivity = 0.35; 95% CI: 0.06, 0.65; P for trend = 0.002). Higher global cognitive scores were also significantly associated with the DTI parameters significantly associated with the MeDi when comparing individuals in quartile one to quartile five of fractional anisotropy values (Multivariable adjusted mean difference = 0.48; 95% CI: 0.19, 0.77; P for trend = 0.001) (29).
White Matter Hyperintensities and Cerebral Infarcts
One study examined the presence of WMH and cerebral infarcts (37). While MeDi was not related to the presence of WMH, greater MeDi adherence was significantly associated with lower odds of cerebral MRI infarcts 5.8 years later (OR = 0.89; 95% CI = 0.80, 0.99; P = 0.04). This association was attenuated however, after exclusion of individuals with stroke (n = 86) and dementia (n = 46) (OR = 0.90; 95% CI = 0.80, 1.00; P = 0.07) (37).
Other Dietary Patterns and Structural Neuroimaging Markers
One study examined diet using the AHEI-2010 (33) and the other, PCA-derived prudent and western DPs (20) in relation to structural neuroimaging markers. Adherence to the AHEI-2010 was associated with increased total hippocampal volumes (HCV) measured 13 years later [β per each 1 SD increase in AHEI-2010 score (1 SD = 8.7 points) = 0.11; 95% CI: 0.02, 0.21]. Each 1 SD increase in AHEI-2010 score was associated with an increase of 92.5 mm3 (SE = 42 mm3) in total HCV, and when assessing each; an increase of 56.3 mm3 (SE = 23 mm3) in left HCV, and 36.2 mm3 (SE = 22.7 mm3) increase in right HCV (33). Similarly, better adherence to a prudent DP was significantly associated with larger left HCV, equal to 45.7 mm3 (S.E = 22.9 mm3). In contrast, a western DP was significantly associated with smaller left HCV, equal to 52.6 mm3 (S.E = 26.6 mm3). No associations were found between either a posteriori DP or right HCV (35). Change in left or right HCV across 4 years was also not significantly associated with the prudent DP (βprudent×time = 20.8; SE = 24.4; P = 0.40) or western DP (βwestern×time = 27.2; SE = 28.8; P = 0.34) (35).
Mediterranean Diet and Functional Neuroimaging Markers
Three studies assessed MeDi adherence in relation to functional neuroimaging markers, including brain glucose metabolism and Aβ load (30, 34, 39).
Brain Glucose Metabolism
Two studies used (18)F-fluorodeoxyglucose (FDG)-PET to assess glucose metabolism among middle-aged USA adults (34, 39). Low MeDi adherence was associated with significant reductions in the cerebral metabolic rate of glucose (CMRglc) specifically within the bilateral temporal cortex (P = 0.001) (34). Furthermore, the rate of CMRglc decline within both the temporal and posterior cingulate cortices among the group with low MeDi adherence was significantly faster than that of the high MeDi group (P interaction = 0.002). This equated to a decline of 3.83% (low MeDi group) (0.028 ± 0.049 units/year) compared to <1% (high MeDi group) (0.018 ± 0.054 SUVR units/year) per year from baseline (34). Similarly, Walters and colleagues also reported that lower adherence to the MeDi was significantly associated with a higher rate of FDG decline within the posterior cingulate cortex (β = 0.010; SE = 0.005; P = 0.043) but not in the frontal cortex (β = -0.012; SE = 0.007; P = 0.072) (39).
Amyloid Load
Three studies examined repeated measures of cerebral Aβ deposition up to 3 years (30, 34, 39). Two of the three studies found that decreased adherence to the MeDi was significantly associated with increased Aβ load among both middle-aged and older adults (30, 34). Lower MeDi adherence was associated with both higher Pittsburgh compound B (PiB) uptake at baseline and increased rate of PiB uptake across 3 years (P = 0.001) in middle-aged adults (34). Change in the low MeDi group was on average, 0.028 ± 0.031 SUVR units/year, equal to a 3% increase per year, compared to higher MeDi adherence which was on average, 0.009 ± 0.020 SUVR units/year, equal to a <1% increase per year (34). The Aβ accumulation rate within the AIBL cohort of older adults was higher than that of the cohort within the study by Berti and colleagues, at a rate of 0.050 SUVR units/year, meaning each 1-point increase in MeDi score was equal to 20% decrease in Aβ load per year (β = -0.01; S.E = 0.004; P = 0.0070) (30). However, it should be noted this cohort consisted entirely of individuals defined as Aβ accumulators by authors. In contrast, Walters and colleagues found no significant association between MeDi adherence and changes in Aβ in the frontal cortex among middle-aged adults (β = -0.016; SE = 0.011; P = 0.104) (39).
Risk of Bias Assessment
An overview of the risk of bias assessment of all included studies is presented in Table 3. All studies included in the review were rated as medium (29, 30, 33, 35–39). Only one study achieved a high rating with a maximum total score of nine (34). The results of the quality assessment can be found in Table 3. Most studies were lacking within the selection domain, more specifically regarding ascertainment of exposure (due to most using self-reported assessment methods) and demonstration that the outcome was not present at baseline.
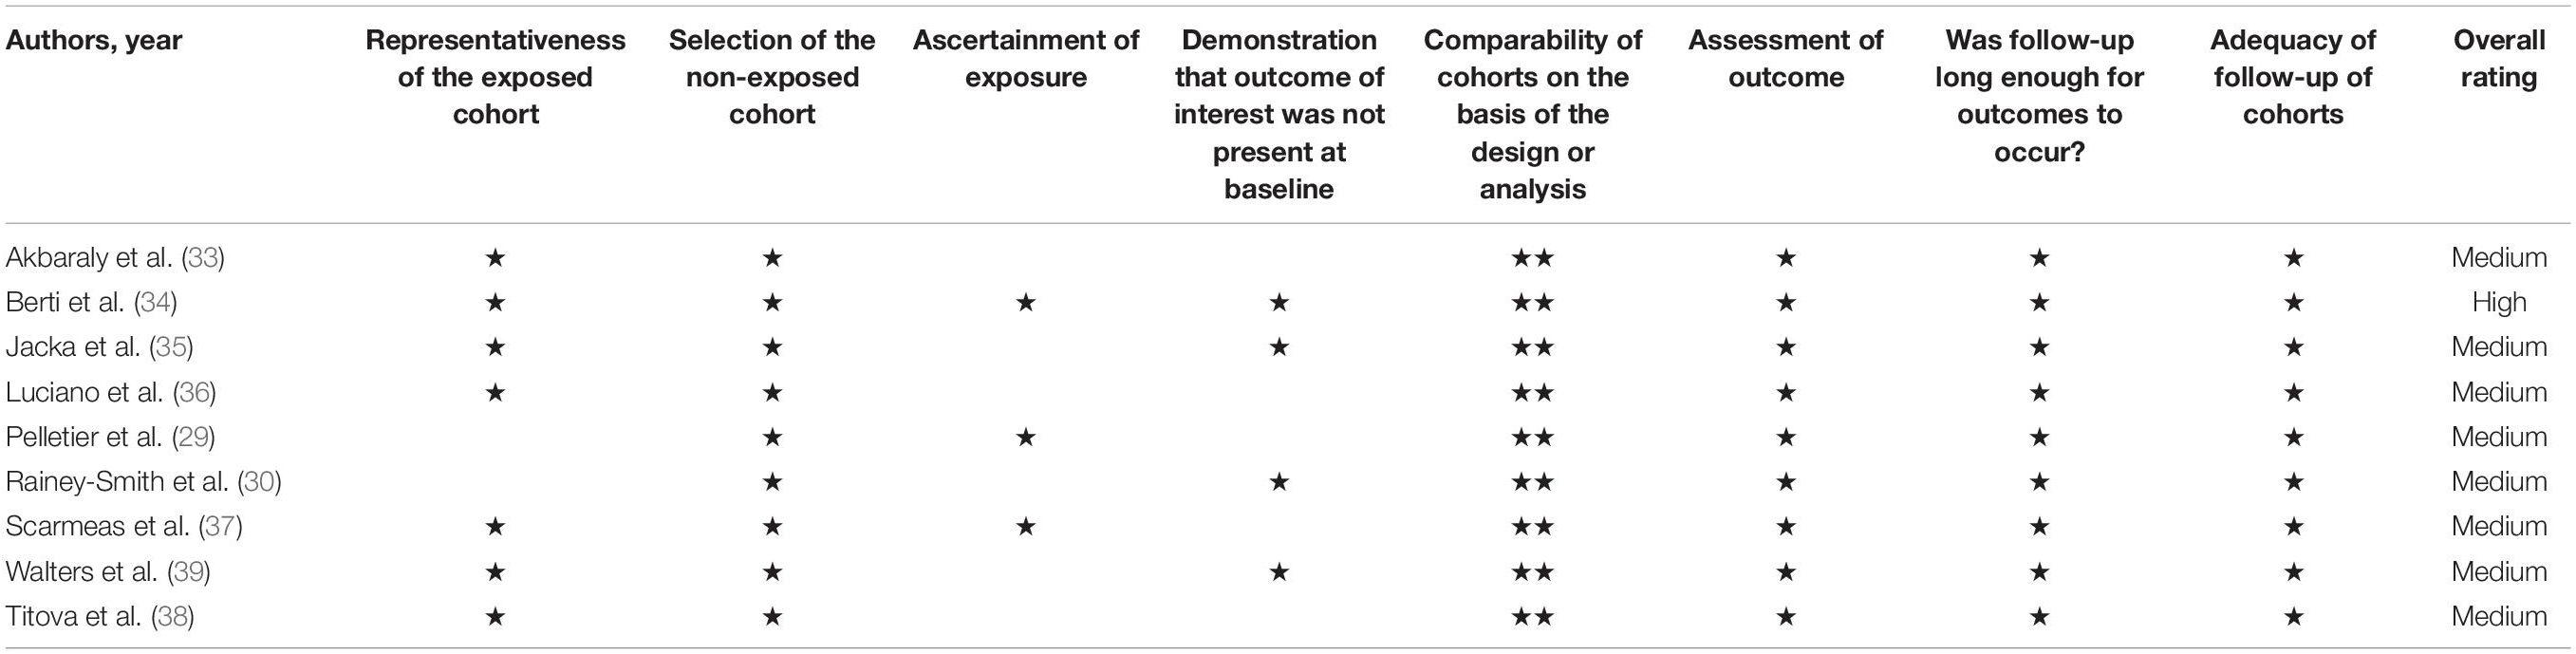
Table 3. Results of quality assessment of included studies using Newcastle-Ottawa Scale.
Discussion
Summary of Overall Findings
This systematic review evaluates results from nine prospective studies including approximately 2,540 individuals. No intervention evidence was evaluated, as no RCTs were eligible for inclusion. Consequently, it is difficult to understand the application of neuroimaging markers within future dietary interventions, as we are reliant on evidence gathered from prospective observational studies Within included studies, the MeDi was examined as the DP exposure in the majority (n = 7), with only two studies examining other DPs. Findings for associations between the MeDi and structural neuroimaging markers were mixed from the small number of studies available. MeDi was consistently not associated with a change in volumes of key brain regions such as GMV, WMV, or cortical thickness but was associated with reduced risk of cerebral infarcts and lower total brain atrophy. One study also found evidence of a protective association between MeDi and WMI (29). Other DPs (AHEI-2010 and PCA-derived DPs) were linked to higher HCV (33, 35) which is particularly relevant for AD, given that hippocampal atrophy is a major AD characteristic that often predates clinical diagnosis (42–44). HCV is considered one of the earliest structural MRI markers for AD, with studies suggesting atrophy rates may deviate from normal ageing as far as 3–5.5 years prior to diagnosis (45, 46). The MeDi appeared to be more consistently protective against hypometabolism (34, 39) and Aβ load (30, 34) from mid-life to older age, which preceded any evidence of cognitive impairment. Such results are important, given that impairments in systemic metabolism (such as hypometabolism) and Aβ accumulation are pathophysiologic hallmarks of AD (47–49). However, current data is unable to discern the exact mechanisms behind these associations; specifically, whether a healthy DP helps by inhibiting Aβ accumulation/deposition, by improving Aβ clearance, or through both (30). Data in this area are currently limited, with few prospective studies examining Aβ load in relation to DPs among humans (30, 34, 39) consequently warranting further investigation.
Overall, this systematic review of available prospective data suggests a protective association between healthy DPs and neuroimaging markers and confirms findings from a prior review involving prospective studies to 2017 (28) and other reviews involving both prospective and cross-sectional study evidence (25–27). The exact mechanisms responsible for how healthy DPs may be neuroprotective are not known but high-quality DPs such as the MeDi could improve vasculature functioning by reducing oxidative stress and inflammation. Better adherence to a healthy diet such as the MeDi, may serve to decrease the likelihood of vascular comorbidities including hypertension, metabolic syndrome, dyslipidaemia, and cardiopathy (50). It is proposed this subsequently promotes healthy brain ageing by reducing an individuals’ risk of vascular-related brain pathologies. The main drivers of vascular preservation likely involve enhanced endothelial capacity, healthy cerebral blood flow and reduced inflammation and oxidative stress. The neuroimaging markers commonly associated with vascular pathologies relate to the potential progression of small vessel disease, such as the volume and enlargement of WMH, lesions, infarcts, and preceding this, loss of WMI (51). Previous cross-sectional studies have reported associations between greater MeDi adherence and reduced volume of WMH (52). A main predictor of WMH volume within this relationship, was suggested to be the ratio of monounsaturated fats to saturated fats within the MeDi (52). Greater fish consumption, as recommended by the MeDi, has also been independently related to reduced WMH volume and increased brain volumes (53–56). The vascular pathway is supported by findings of this review, as two studies found associations greater adherence to the MeDi and reduced appearance of vascular-related neuroimaging markers (specifically reduced odds of cerebral infarcts, and improved white matter tract integrity) (34, 37).
Loss of white matter microstructural integrity is also proposed to reflect both myelin breakdown and axonal damage (57, 58). The neurodegeneration hypothesis proposes pathological brain changes such as structural atrophy, formation, deposition of Aβ plaques and oxidative stress occur due to a combination of events. This includes axonal cytoskeleton degeneration, myelin degradation and an accumulation of reactive oxygen species. Findings from six studies included within this review lend support to a healthy DP for supporting axonal maintenance and protecting against neurodegeneration. For example, through reduced hippocampal and total brain atrophy over time (33, 35, 36), decreased Aβ deposition (30, 34) and slower declines in glucose metabolism within specific regions (34, 39). Data from several cross-sectional studies have also shown protective associations of healthy DPs on neuroimaging outcomes (22, 53, 59–62).
Healthy DPs such as the MeDi, AHEI-2010 and prudent DP derived a posteriori share similarities including high consumption of foods rich in polyphenols and antioxidants such as fruits/vegetables. Such compounds may exert protective effects by obstructing neuronal oxidation, maintaining cellular homeostasis and hence, limit abnormal intracellular responses such as senescence and alterations within brain plasticity (63–66). Furthermore, healthy DPs such as the MeDi, DASH and AHEI-2010 are suggested to reduce levels of inflammatory macrophage proteins, cytokines, and chemokines (67–70). Neuroinflammation plays a major role in both oxidative and neurodegenerative pathways, thus review outcomes support the role of healthy DPs such as the MeDi, AHEI-2010 and prudent DPs in decreasing neuroinflammation. In support of this, one study also found a western DP, often associated with systemic inflammation, was associated with decreased HCV (35).
Inconsistencies Within Study Methodology
This review also serves to highlight several inconsistencies within the designs of included studies when investigating associations between DPs and neuroimaging markers. This includes robustness of study design, potential biases within populations assessed, and measurement of neuroimaging markers, dietary intake and consequent DPs as discussed below.
Study Design
All studies included in this review were prospective cohort studies. Most studies were rated as medium quality, with the exception of one rated as high. None of the included studies were assessed as poor quality. Although the design of such prospective studies has several strengths, they cannot determine causality and may be biased toward residual confounding. All studies controlled for age and sex. Most studies controlled for important confounders that influence both diet and neurocognition, as eight (29, 30, 33–39) controlled for education, six (29, 30, 34, 36, 37, 39) controlled for APOE E4 status, and eight (29, 33–39) controlled for ≥1 measure of cardiovascular risk (i.e., diabetes, hypertension). However, only two studies controlled for socioeconomic status (SES) (33, 35). This is interesting, given the association between SES and cognition across the lifespan (71), in addition to the link between SES and diet (72). Although both studies which controlled for SES in this review found statistically significant findings to suggest an influence of DP on neuroimaging measures, future studies may wish to consider controlling for this factor within analyses. Finally, no included studies were RCTs. Subsequently, this means it is difficult to draw causal inferences from this review.
Populations Assessed
No study focused exclusively on an age category and therefore each included older adult populations (aged ≥ 60). Due to this, combined with conflicting findings overall it is difficult to draw conclusions as to whether associations may differ dependent upon the life stage. However, from the two studies that did include younger adult individuals (age ≥ 30), both found significant associations between MeDi and structural (specifically WMI) and functional neuroimaging markers (specifically Aβ and glucose metabolism) (34, 39). It has been suggested that the earliest pathological changes may be detected using neuroimaging markers between 15 and 30 years preceding symptom onset (42, 73, 74). As most studies captured older-aged individuals, it is difficult to understand how long an individual must have adhered to a DP, to influence changes in brain ageing. The majority of studies were conducted among educated populations and only four studies reported ethnic status (mostly white populations except for WHICAP). Consequently, more studies are required in diverse populations, particularly those at higher risk of AD in later life.
Dietary Assessment
The limitations associated with methods of dietary intake measurement, specifically FFQs as the most frequently used method of assessment have previously been acknowledged (75, 76). This includes potential misreporting from the participant due to both recall bias and social desirability bias; as “healthy” foods are likely to be reported more frequently in comparison to “unhealthy” foods. Based on this, studies using FFQs to measure diet intake should aim to validate the obtained data to ensure a robust assessment of dietary intake using an alternative methodology such as combined measurement of various recovery-based nutrient biomarkers (e.g., doubly labelled water for energy intake or urinary nitrogen for protein intake) or another quantitative method as reference, such as food records or 24 h diet recalls (77, 78).
To validate subjective methods should be considered within studies to ensure a robust assessment of dietary intake. Furthermore, most studies within this review also failed to assess diet at multiple time points and relied on FFQ reporting from years prior to neuroimaging marker measurement. Older adulthood has previously been suggested to be a period where individuals may experience reduced diet stability (79–81). Therefore, it is difficult to rule out the risk of reverse causation within associations observed. Future studies should be conducted in earlier life, to understand how DPs may influence changes in neuroimaging markers across the adult life span.
Dietary Patterns Assessed
Most prospective studies to date have examined associations between the MeDi and neuroimaging markers, which can help elucidate potential neuroprotective mechanisms. However, differences were noted between the applications of the MeDi scoring system within the included studies. Although all studies applied a similar scoring index, there were interindividual study differences in food components, specific cut-offs for components (i.e., alcohol), and adjustments for energy intake. For example, Titova et al. (38) combined vegetables and legumes into one component, added potatoes to the cereals component, and replaced monounsaturated fats with polyunsaturated fats in the fats ratio component. Differences were also noted between studies in the scoring cut-offs for the alcohol component. Adaptations such as the above may contribute further towards inconsistent findings within this area; as it becomes difficult to understand if observed associations are due to the synergy within the MeDi pattern or due to its individual food components, which often differ between studies. Similarly, the AHEI-2010 score applied in one study within this review (33) was also adapted from the original score index by decreasing the recommended intake of alcohol, based on the evidence within the research topic. Furthermore, as previous studies focus on healthy DPs, there is a substantial lack of studies exploring the effects of unhealthy DPs on neuroimaging markers. Previous animal studies have illustrated that a western diet is associated with reduced cognitive functioning, due to reduced neuronal plasticity and higher levels of inflammation and oxidative stress (82, 83). This review found only one longitudinal study that investigated an unhealthy DP in relation to neuroimaging markers in humans. Further research should therefore address this gap and aim to understand the influence and mechanisms of poor-quality DPs on brain ageing, using neuroimaging markers. This would increase understanding of their effects on wider populations, such as those across westernised countries who often consume such diets.
Neuroimaging Marker Measurement
Only five studies assessed change in neuroimaging markers at two or more time points. The maximum length of time in any study between these two points was 4 years. Therefore, it is difficult to interpret to distinguish between normal vs. pathological brain changes and how this may associate with any given DP. The main modality of neuroimaging assessment across studies was via MRI (8 studies), with only three studies using other methodologies (i.e., PET and DTI) (30, 34, 39). However, it has been suggested that in pathological brain ageing, changes in Aβ deposition may occur first, followed by neurodegenerative changes such as Tau burden and structural brain atrophy (42, 84). Hence, this may help to explain why four (29, 30, 34, 39) of the eight studies in cognitively healthy adults found significant associations between adherence towards a DP and neuroimaging markers other than structural MRI. Another noteworthy finding from this review was the substantial lack of studies that assessed important sub-cortical brain regions such as the hippocampus that are vulnerable to AD. Previous animal studies have also suggested diet may impact hippocampal neurogenesis, by demonstrating a damaging role of saturated fats and refined sugar on hippocampal neurogenesis (85, 86). Interestingly, only two studies (33, 35) in this review investigated hippocampal volume. It would therefore be beneficial for future studies to adopt a multi-modal imaging approach; as this would enable us to understand the earliest and optimal window for nutritional interventions to support healthy brain ageing. The use of both modalities in combination with neuropsychological testing would also provide a comprehensive overview of structural and functional brain changes; how these correlate with cognitive performance and potential associations between DPs and the food components within that DP. Finally, it must be noted that this systematic review may be prone to bias as articles published in languages other than English were excluded. As a meta-analysis was not possible, it is also difficult to determine the extent of publication bias within the studies included.
Conclusion
This systematic review of prospective data suggests a protective association between healthy DPs and neuroimaging markers and agrees with prior reviews involving cross-sectional studies (25–27). Evidence, while limited, suggests healthy DP’s, such as the MeDi or AHEI-2010 may exert beneficial changes on both brain structure (reduced brain atrophy) and function (maintenance of glucose metabolism and reduced Aβ accumulation). Although the mechanisms underpinning these associations require further elucidation, both vascular and neurodegenerative processes are likely involved. This review highlighted the value of different neuroimaging techniques (i.e., MRI and PET) and markers in detecting and capturing subtle changes within the brain, which often occur prior to cognitive impairment. No RCTs were available for inclusion in this review and highlights a clear gap within the research field. Future intervention studies in cognitively healthy adults that include multi-modal neuroimaging measures would advance current knowledge on whether adopting a healthy diet impacts brain health. Undertaking such studies may be especially relevant and beneficial in reducing the likelihood of dementia among high-risk population groups, such as those with diabetes. Furthermore, future studies should be designed to adopt a life-span approach, conducting rigorous follow-up reviews with multi-modal neuroimaging techniques and validated dietary intake assessment at regular time points. This will enable a comprehensive depiction of how the length of adherence towards a specific DP may alter an individuals’ brain ageing trajectory. Finally, although healthy DPs may offer neuroprotective benefits, the exact combination of foods and nutrients providing such benefits remain unknown. Consequently, future studies should also seek to address the paucity of research investigating DPs other than the MeDi.
Author Contributions
RT, CM, and JW conceived and designed the study. RT conducted the search. RT and CM completed screening and extraction processes with any disagreements discussed in the presence of JW, RT, and RO’N and performed quality assessment. RT, CM, JW, RO’N, and FP contributed to drafting and completing the manuscript. All authors contributed to the article and approved the submitted version.
Funding
RT is a current Ph.D. student at Queen’s University Belfast, funded by the Department for the Economy (DfE), Northern Ireland. CM and JW received funding from UK Biotechnology and Biological Sciences Research Council and FP received funding from Italy Ministry for Universities and Research, under the umbrella of the European Joint Programming Initiative “A Healthy Diet for a Healthy Life” (JPI HDHL) and of the ERA-NET Cofund ERA-HDHL (GA No. 696295 of the EU Horizon 2020 Research and Innovation Programme).
Conflict of Interest
The authors declare that the research was conducted in the absence of any commercial or financial relationships that could be construed as a potential conflict of interest.
Publisher’s Note
All claims expressed in this article are solely those of the authors and do not necessarily represent those of their affiliated organizations, or those of the publisher, the editors and the reviewers. Any product that may be evaluated in this article, or claim that may be made by its manufacturer, is not guaranteed or endorsed by the publisher.
Supplementary Material
The Supplementary Material for this article can be found online at: https://www.frontiersin.org/articles/10.3389/fnut.2022.806006/full#supplementary-material
Abbreviations
AD, Alzheimer’s Disease; AHEI-2010, Alternate Healthy Eating Index-2010; Aβ, Amyloid-β; Cmrglc, Cerebral Metabolic Rate Of Glucose; DP, Dietary pattern; DTI, Diffusion Tensor Imaging; EVOO, Extra Virgin Olive Oil; FDG-PET, (18)F-Fluorodeoxyglucose Positron Emission Tomography; FFQ, Food frequency questionnaire; GMV, Grey Matter Volume; HCV, Hippocampal Volume; MeDi, Mediterranean diet; MMSE, Mini-Mental State Examination; MRI, Magnetic Resonance Imaging; NOS, Newcastle Ottawa Scale; PCA, Principal Component Analysis; PET, Positron Emission Tomography; PiB, Pittsburgh compound B; PRISMA, Preferred Reporting Items for Systematic Reviews and Meta-Analyses; PROSPERO, International Prospective Register of Systematic Reviews; RCT, Randomised Controlled Trial; SUVR, Standard Uptake Volume Ratio; TBV, Total Brain Volume; WMI, White Matter Integrity; WMV, White Matter Volume.
References
1. Prince MJ, Wimo A, Guerchet MM, Ali GC, Wu Y-T, Prina M. World Alzheimer Report 2015-The Global Impact of Dementia: An Analysis of Prevalence, Incidence, Cost and Trends. London: Alzheimer’s Disease International (2015).
2. Livingston G, Huntley J, Sommerlad A, Ames D, Ballard C, Banerjee S, et al. Dementia prevention, intervention, and care: 2020 report of the lancet commission. Lancet. (2020) 396:413–46. doi: 10.1016/S0140-6736(20)30367-6
3. Munoz-Garcia MI, Toledo E, Razquin C, Dominguez LJ, Maragarone D, Martinez-Gonzalez J, et al. “A priori” dietary patterns and cognitive function in the SUN project. Neuroepidemiology. (2020) 54:45–57. doi: 10.1159/000502608
4. Shakersain B, Santoni G, Larsson SC, Faxén-Irving G, Fastbom J, Fratiglioni L, et al. Prudent diet may attenuate the adverse effects of western diet on cognitive decline. Alzheimers Dement. (2016) 12:100–9. doi: 10.1016/j.jalz.2015.08.002
5. Tanaka T, Talegawkar SA, Jin Y, Colpo M, Ferrucci L, Bandinelli S. Adherence to a Mediterranean diet protects from cognitive decline in the invecchiare in Chianti study of aging. Nutrients. (2018) 10:2007. doi: 10.3390/nu10122007
6. Trichopoulou A, Kyrozis A, Rossi M, Katsoulis M, Trichopoulos D, La Vecchia C, et al. Mediterranean diet and cognitive decline over time in an elderly Mediterranean population. Eur J Nutr. (2015) 54:1311–21. doi: 10.1007/s00394-014-0811-z
7. Wengreen H, Munger RG, Cutler A, Quach A, Bowles A, Corcoran C, et al. Prospective study of dietary approaches to stop hypertension–and Mediterranean-style dietary patterns and age-related cognitive change: the Cache County study on memory, health and aging. Am J Clin Nutr. (2013) 98:1263–71. doi: 10.3945/ajcn.112.051276
8. Barberger-Gateau P, Raffaitin C, Letenneur L, Berr C, Tzourio C, Dartigues J-F, et al. Dietary patterns and risk of dementia: the three-city cohort study. Neurology. (2007) 69:1921–30. doi: 10.1212/01.wnl.0000278116.37320.52
9. Hosking DE, Eramudugolla R, Cherbuin N, Anstey KJ. MIND not Mediterranean diet related to 12-year incidence of cognitive impairment in an Australian longitudinal cohort study. Alzheimers Dement. (2019) 15:581–9. doi: 10.1016/j.jalz.2018.12.011
10. Morris MC, Tangney CC, Wang Y, Sacks FM, Bennett DA, Aggarwal NT. MIND diet associated with reduced incidence of Alzheimer’s disease. Alzheimers Dement. (2015) 11:1007–14. doi: 10.1016/j.jalz.2014.11.009
11. Scarmeas N, Stern Y, Mayeux R, Manly JJ, Schupf N, Luchsinger JA. Mediterranean diet and mild cognitive impairment. Arch Neurol. (2009) 66:216–25.
12. Scarmeas N, Stern Y, Tang MX, Mayeux R, Luchsinger JA. Mediterranean diet and risk for Alzheimer’s disease. Ann Neurol. (2006) 59:912–21.
13. Martínez-Lapiscina EH, Clavero P, Toledo E, Estruch R, Salas-Salvadó J, San Julián B, et al. Mediterranean diet improves cognition: the PREDIMED-NAVARRA randomised trial. J Neurol Neurosurg Psychiatry. (2013) 84:1318–25. doi: 10.1136/jnnp-2012-304792
14. Valls-Pedret C, Sala-Vila A, Serra-Mir M, Corella D, De la Torre R, Martínez-González MÁ, et al. Mediterranean diet and age-related cognitive decline: a randomized clinical trial. JAMA Intern Med. (2015) 175:1094–103. doi: 10.1001/jamainternmed.2015.1668
15. Martinez-Lapiscina EH, Clavero P, Toledo E, San Julian B, Sanchez-Tainta A, Corella D, et al. Virgin olive oil supplementation and long-term cognition: the PREDIMED-NAVARRA randomized, trial. J Nutr Health Aging. (2013) 17:544–52. doi: 10.1007/s12603-013-0027-6
16. Wade AT, Davis CR, Dyer KA, Hodgson JM, Woodman RJ, Keage HA, et al. A Mediterranean diet supplemented with dairy foods improves mood and processing speed in an Australian sample: results from the MedDairy randomized controlled trial. Nutr Neurosci. (2020) 23:646–58. doi: 10.1080/1028415X.2018.1543148
17. Chlebowski RT, Rapp S, Aragaki AK, Pan K, Neuhouser ML, Snetselaar LG, et al. Low-fat dietary pattern and global cognitive function: exploratory analyses of the women’s health initiative (WHI) randomized dietary modification trial. EClinicalMedicine. (2020) 18:100240. doi: 10.1016/j.eclinm.2019.100240
18. Kwok T, Lam L, Sea M, Goggins W, Woo J. A randomized controlled trial of dietetic interventions to prevent cognitive decline in old age hostel residents. Eur J Clin Nutr. (2012) 66:1135–40. doi: 10.1038/ejcn.2012.117
19. Marseglia A, Xu W, Fratiglioni L, Fabbri C, Berendsen AA, Bialecka-Debek A, et al. Effect of the NU-AGE diet on cognitive functioning in older adults: a randomized controlled trial. Front Physiol. (2018) 9:349. doi: 10.3389/fphys.2018.00349
20. Wade AT, Davis CR, Dyer KA, Hodgson JM, Woodman RJ, Keage HA, et al. A Mediterranean diet with fresh, lean pork improves processing speed and mood: cognitive findings from the MedPork randomised controlled trial. Nutrients. (2019) 11:1521. doi: 10.3390/nu11071521
21. Jack CR Jr, Knopman DS, Jagust WJ, Shaw LM, Aisen PS, Weiner MW, et al. Hypothetical model of dynamic biomarkers of the Alzheimer’s pathological cascade. Lancet Neurol. (2010) 9:119–28. doi: 10.1016/s1474-4422(09)70299-6
22. Gu Y, Brickman AM, Stern Y, Habeck CG, Razlighi QR, Luchsinger JA, et al. Mediterranean diet and brain structure in a multiethnic elderly cohort. Neurology. (2015) 85:1744–51. doi: 10.1212/WNL.0000000000002121
23. Mosconi L, Murray J, Tsui WH, Li Y, Davies M, Williams S, et al. Mediterranean diet and magnetic resonance imaging-assessed brain atrophy in cognitively normal individuals at risk for Alzheimer’s disease. J Prev Alzheimers Dis. (2014) 1:23–32.
24. Vassilaki M, Aakre JA, Syrjanen JA, Mielke MM, Geda YE, Kremers WK, et al. Mediterranean diet, its components, and amyloid imaging biomarkers. J Alzheimers Dis. (2018) 64:281–90. doi: 10.3233/JAD-171121
25. Rodrigues B, Asamane EA, Magalhães R, Sousa N, Thompson JL, Santos NC. The association of dietary patterns with cognition through the lens of neuroimaging-a systematic review. Ageing Res Rev. (2020) 63:101145. doi: 10.1016/j.arr.2020.101145
26. Gauci S, Young LM, Arnoldy L, Lassemillante A-C, Scholey A, Pipingas A. Dietary patterns in middle age: effects on concurrent neurocognition and risk of age-related cognitive decline. Nutr Rev. (2021) 0:1–31. doi: 10.1093/nutrit/nuab047
27. Jensen DEA, Leoni V, Klein-Flügge MC, Ebmeier KP, Suri S. Associations of dietary markers with brain volume and connectivity: a systematic review of MRI studies. Ageing Res Rev. (2021) 70:101360. doi: 10.1016/j.arr.2021.101360
28. Chen X, Maguire B, Brodaty H, O’Leary F. Dietary patterns and cognitive health in older adults: a systematic review. J Alzheimers Dis. (2019) 67:583–619.
29. Pelletier A, Barul C, Féart C, Helmer C, Bernard C, Periot O, et al. Mediterranean diet and preserved brain structural connectivity in older subjects. Alzheimers Dement. (2015) 11:1023–31. doi: 10.1016/j.jalz.2015.06.1888
30. Rainey-Smith SR, Gu Y, Gardener SL, Doecke JD, Villemagne VL, Brown BM, et al. Mediterranean diet adherence and rate of cerebral Aβ-amyloid accumulation: data from the Australian imaging, biomarkers and lifestyle study of ageing. Transl Psychiatry. (2018) 8:1–7. doi: 10.1038/s41398-018-0293-5
31. van den Brink AC, Brouwer-Brolsma EM, Berendsen AA, van de Rest O. The Mediterranean, dietary approaches to stop hypertension (DASH), and Mediterranean-DASH intervention for neurodegenerative delay (MIND) diets are associated with less cognitive decline and a lower risk of Alzheimer’s disease—a review. Adv Nutr. (2019) 10:1040–65. doi: 10.1093/advances/nmz054
32. Wells GA, Shea B, O’Connell D, Peterson J, Welch V, Losos M, et al. The Newcastle-Ottawa Scale (NOS) for Assessing the Quality of Nonrandomised Studies in Meta-Analyses. Oxford: Oxford University Press (2000).
33. Akbaraly T, Sexton C, Zsoldos E, Mahmood A, Filippini N, Kerleau C, et al. Association of long-term diet quality with hippocampal volume: longitudinal cohort study. Am J Med. (2018) 131:1372–81.e4. doi: 10.1016/j.amjmed.2018.07.001
34. Berti V, Walters M, Sterling J, Quinn CG, Logue M, Andrews R, et al. Mediterranean diet and 3-year Alzheimer brain biomarker changes in middle-aged adults. Neurology. (2018) 90:e1789–98. doi: 10.1212/WNL.0000000000005527
35. Jacka FN, Cherbuin N, Anstey KJ, Sachdev P, Butterworth P. Western diet is associated with a smaller hippocampus: a longitudinal investigation. BMC Med. (2015) 13:215. doi: 10.1186/s12916-015-0461-x
36. Luciano M, Corley J, Cox SR, Hernández MCV, Craig LC, Dickie DA, et al. Mediterranean-type diet and brain structural change from 73 to 76 years in a Scottish cohort. Neurology. (2017) 88:449–55. doi: 10.1212/WNL.0000000000003559
37. Scarmeas N, Luchsinger JA, Stern Y, Gu Y, He J, DeCarli C, et al. Mediterranean diet and magnetic resonance imaging–assessed cerebrovascular disease. Ann Neurol. (2011) 69:257–68.
38. Titova OE, Ax E, Brooks SJ, Sjögren P, Cederholm T, Kilander L, et al. Mediterranean diet habits in older individuals: associations with cognitive functioning and brain volumes. Exp Gerontol. (2013) 48:1443–8. doi: 10.1016/j.exger.2013.10.002
39. Walters MJ, Sterling J, Quinn C, Ganzer C, Osorio RS, Andrews RD, et al. Associations of lifestyle and vascular risk factors with Alzheimer’s brain biomarker changes during middle age: a 3-year longitudinal study in the broader New York City area. BMJ Open. (2018) 8:e023664. doi: 10.1136/bmjopen-2018-023664
40. Trichopoulou A, Costacou T, Bamia C, Trichopoulos D. Adherence to a Mediterranean diet and survival in a Greek population. N Engl J Med. (2003) 348:2599–608. doi: 10.1056/NEJMoa025039
41. Chiuve SE, Fung TT, Rimm EB, Hu FB, McCullough ML, Wang M, et al. Alternative dietary indices both strongly predict risk of chronic disease. J Nutr. (2012) 142:1009–18. doi: 10.3945/jn.111.157222
42. Jack CR Jr, Knopman DS, Jagust WJ, Petersen RC, Weiner MW, Aisen PS, et al. Tracking pathophysiological processes in Alzheimer’s disease: an updated hypothetical model of dynamic biomarkers. Lancet Neurol. (2013) 12:207–16. doi: 10.1016/S1474-4422(12)70291-0
43. Barnes J, Bartlett JW, van de Pol LA, Loy CT, Scahill RI, Frost C, et al. A meta-analysis of hippocampal atrophy rates in Alzheimer’s disease. Neurobiol Aging. (2009) 30:1711–23. doi: 10.1016/j.neurobiolaging.2008.01.010
44. Jack CR Jr, Shiung MM, Gunter JL, O’Brien PC, Weigand SD, Knopman DS, et al. Comparison of different MRI brain atrophy rate measures with clinical disease progression in AD. Neurology. (2004) 62:591–600. doi: 10.1212/01.wnl.0000110315.26026.ef
45. Ridha BH, Barnes J, Bartlett JW, Godbolt A, Pepple T, Rossor MN, et al. Tracking atrophy progression in familial Alzheimer’s disease: a serial MRI study. Lancet Neurol. (2006) 5:828–34. doi: 10.1016/S1474-4422(06)70550-6
46. Schott JM, Fox NC, Frost C, Scahill RI, Janssen JC, Chan D, et al. Assessing the onset of structural change in familial Alzheimer’s disease. Ann Neurol. (2003) 53:181–8. doi: 10.1002/ana.10424
47. Edison P, Archer H, Hinz R, Hammers A, Pavese N, Tai Y, et al. Amyloid, hypometabolism, and cognition in Alzheimer disease: an [11C] PIB and [18F] FDG PET study. Neurology. (2007) 68:501–8. doi: 10.1212/01.wnl.0000244749.20056.d4
48. Landau SM, Mintun MA, Joshi AD, Koeppe RA, Petersen RC, Aisen PS, et al. Amyloid deposition, hypometabolism, and longitudinal cognitive decline. Ann Neurol. (2012) 72:578–86. doi: 10.1002/ana.23650
49. Lowe VJ, Weigand SD, Senjem ML, Vemuri P, Jordan L, Kantarci K, et al. Association of hypometabolism and amyloid levels in aging, normal subjects. Neurology. (2014) 82:1959–67. doi: 10.1212/WNL.0000000000000467
50. Siervo M, Shannon OM, Llewellyn DJ, Stephan BC, Fontana L. Mediterranean diet and cognitive function: from methodology to mechanisms of action. Free Radic Biol Med. (2021) 176:105–17. doi: 10.1016/j.freeradbiomed.2021.09.018
51. Bennett IJ, Madden DJ, Vaidya CJ, Howard DV, Howard JH Jr. Age−related differences in multiple measures of white matter integrity: a diffusion tensor imaging study of healthy aging. Hum Brain Mapp. (2010) 31:378–90. doi: 10.1002/hbm.20872
52. Gardener H, Scarmeas N, Gu Y, Boden-Albala B, Elkind MS, Sacco RL, et al. Mediterranean diet and white matter hyperintensity volume in the Northern Manhattan Study. Arch Neurol. (2012) 69:251–6. doi: 10.1001/archneurol.2011.548
53. Staubo SC, Aakre JA, Vemuri P, Syrjanen JA, Mielke MM, Geda YE, et al. Mediterranean diet, micronutrients and macronutrients, and MRI measures of cortical thickness. Alzheimers Dement. (2017) 13:168–77. doi: 10.1016/j.jalz.2016.06.2359
54. Raji CA, Erickson KI, Lopez OL, Kuller LH, Gach HM, Thompson PM, et al. Regular fish consumption and age-related brain gray matter loss. Am J Prev Med. (2014) 47:444–51. doi: 10.1016/j.amepre.2014.05.037
55. Bowman GL, Silbert L, Howieson D, Dodge H, Traber M, Frei B, et al. Nutrient biomarker patterns, cognitive function, and MRI measures of brain aging. Neurology. (2012) 78:241–9.
56. Virtanen JK, Siscovick DS, Longstreth WT, Kuller LH, Mozaffarian D. Fish consumption and risk of subclinical brain abnormalities on MRI in older adults. Neurology. (2008) 71:439–46. doi: 10.1212/01.wnl.0000324414.12665.b0
57. Bartzokis G. Age-related myelin breakdown: a developmental model of cognitive decline and Alzheimer’s disease. Neurobiol Aging. (2004) 25:5–18.
58. Bennett IJ, Madden DJ. Disconnected aging: cerebral white matter integrity and age-related differences in cognition. Neuroscience. (2014) 276:187–205. doi: 10.1016/j.neuroscience.2013.11.026
59. Karstens AJ, Tussing-Humphreys L, Zhan L, Rajendran N, Cohen J, Dion C, et al. Associations of the Mediterranean diet with cognitive and neuroimaging phenotypes of dementia in healthy older adults. Am J Clin Nutr. (2019) 109:361–8. doi: 10.1093/ajcn/nqy275
60. Mosconi L, Walters M, Sterling J, Quinn C, McHugh P, Andrews RE, et al. Lifestyle and vascular risk effects on MRI-based biomarkers of Alzheimer’s disease: a cross-sectional study of middle-aged adults from the broader New York city area. BMJ Open. (2018) 8:e019362. doi: 10.1136/bmjopen-2017-019362
61. Matthews DC, Davies M, Murray J, Williams S, Tsui WH, Li Y, et al. Physical activity, Mediterranean diet and biomarkers-assessed risk of Alzheimer’s: a multi-modality brain imaging study. Adv J Mol Imaging. (2014) 4:43–57. doi: 10.4236/ami.2014.44006
62. Croll PH, Voortman T, Ikram MA, Franco OH, Schoufour JD, Bos D, et al. Better diet quality relates to larger brain tissue volumes: the Rotterdam study. Neurology. (2018) 90:e2166–73. doi: 10.1212/wnl.0000000000005691
63. Bhullar KS, Rupasinghe H. Polyphenols: multipotent therapeutic agents in neurodegenerative diseases. Oxid Med Cell Longev. (2013) 2013:891748. doi: 10.1155/2013/891748
64. Pandey KB, Rizvi SI. Plant polyphenols as dietary antioxidants in human health and disease. Oxid Med Cell Longev. (2009) 2:270–8. doi: 10.4161/oxim.2.5.9498
65. Lau FC, Shukitt-Hale B, Joseph JA. The beneficial effects of fruit polyphenols on brain aging. Neurobiol Aging. (2005) 26:128–32. doi: 10.1016/j.neurobiolaging.2005.08.007
66. Youdim KA, Spencer JP, Schroeter H, Rice-Evans C. Dietary flavonoids as potential neuroprotectants. Biol Chem. (2002) 383:503–19. doi: 10.1515/bc.2002.052
67. McGrattan AM, McGuinness B, McKinley MC, Kee F, Passmore P, Woodside JV, et al. Diet and inflammation in cognitive ageing and Alzheimer’s disease. Curr Nutr Rep. (2019) 8:53–65. doi: 10.1007/s13668-019-0271-4
68. Soltani S, Chitsazi MJ, Salehi-Abargouei A. The effect of dietary approaches to stop hypertension (DASH) on serum inflammatory markers: a systematic review and meta-analysis of randomized trials. Clin Nutr. (2018) 37:542–50. doi: 10.1016/j.clnu.2017.02.018
69. Chrysohoou C, Panagiotakos DB, Pitsavos C, Das UN, Stefanadis C. Adherence to the Mediterranean diet attenuates inflammation and coagulation process in healthy adults. J Am Coll Cardiol. (2004) 44:152–8. doi: 10.1016/j.jacc.2004.03.039
70. Akbaraly TN, Shipley MJ, Ferrie JE, Virtanen M, Lowe G, Hamer M, et al. Long-term adherence to healthy dietary guidelines and chronic inflammation in the prospective Whitehall II study. Am J Med. (2015) 128:152–60.e4. doi: 10.1016/j.amjmed.2014.10.002
71. Hackman DA, Farah MJ, Meaney MJ. Socioeconomic status and the brain: mechanistic insights from human and animal research. Nat Rev Neurosci. (2010) 11:651–9. doi: 10.1038/nrn2897
72. Parrott MD, Shatenstein B, Ferland G, Payette H, Morais JA, Belleville S, et al. Relationship between diet quality and cognition depends on socioeconomic position in healthy older adults. J Nutr. (2013) 143:1767–73. doi: 10.3945/jn.113.181115
73. Petersen RC, Wiste HJ, Weigand SD, Fields JA, Geda YE, Graff-Radford J, et al. NIA-AA Alzheimer’s disease framework: clinical characterization of stages. Ann Neurol. (2021) 89:1145–56. doi: 10.1002/ana.26071
74. Bateman RJ, Xiong C, Benzinger TL, Fagan AM, Goate A, Fox NC, et al. Clinical and biomarker changes in dominantly inherited Alzheimer’s disease. N Engl J Med. (2012) 367:795–804. doi: 10.1056/NEJMoa1202753
75. Kristal AR, Peters U, Potter JD. Is it Time to Abandon the Food Frequency Questionnaire?. Philadelphia, PA: AACR (2005).
76. Byers T. Food frequency dietary assessment: how bad is good enough? Am J Epidemiol. (2001) 154:1087–8. doi: 10.1093/aje/154.12.1087
77. Carroll RJ, Midthune D, Subar AF, Shumakovich M, Freedman LS, Thompson FE, et al. Taking advantage of the strengths of 2 different dietary assessment instruments to improve intake estimates for nutritional epidemiology. Am J Epidemiol. (2012) 175:340–7. doi: 10.1093/aje/kwr317
78. Kipnis V, Subar AF, Midthune D, Freedman LS, Ballard-Barbash R, Troiano RP, et al. Structure of dietary measurement error: results of the OPEN biomarker study. Am J Epidemiol. (2003) 158:14–21. doi: 10.1093/aje/kwg091
79. Ward KA, Prentice A, Kuh DL, Adams JE, Ambrosini GL. Life course dietary patterns and bone health in later life in a British birth cohort study. J Bone Miner Res. (2016) 31:1167–76. doi: 10.1002/jbmr.2798
80. Ding D, Grunseit AC, Chau JY, Vo K, Byles J, Bauman AE. Retirement—a transition to a healthier lifestyle?: evidence from a large Australian study. Am J Prev Med. (2016) 51:170–8. doi: 10.1016/j.amepre.2016.01.019
81. Ali-Kovero K, Pietiläinen O, Mauramo E, Jäppinen S, Rahkonen O, Lallukka T, et al. Changes in fruit, vegetable and fish consumption after statutory retirement: a prospective cohort study. Br J Nutr. (2020) 123:1390–5. doi: 10.1017/S0007114520000136
82. Stranahan AM, Norman ED, Lee K, Cutler RG, Telljohann RS, Egan JM, et al. Diet−induced insulin resistance impairs hippocampal synaptic plasticity and cognition in middle−aged rats. Hippocampus. (2008) 18:1085–8. doi: 10.1002/hipo.20470
83. Molteni R, Barnard R, Ying Z, Roberts CK, Gomez-Pinilla F. A high-fat, refined sugar diet reduces hippocampal brain-derived neurotrophic factor, neuronal plasticity, and learning. Neuroscience. (2002) 112:803–14. doi: 10.1016/s0306-4522(02)00123-9
84. Jack CR Jr, Bennett DA, Blennow K, Carrillo MC, Dunn B, Haeberlein SB, et al. NIA−AA research framework: toward a biological definition of Alzheimer’s disease. Alzheimers Dement. (2018) 14:535–62. doi: 10.1016/j.jalz.2018.02.018
85. Kanoski SE, Davidson TL. Western diet consumption and cognitive impairment: links to hippocampal dysfunction and obesity. Physiol Behav. (2011) 103:59–68. doi: 10.1016/j.physbeh.2010.12.003
86. Pistell PJ, Morrison CD, Gupta S, Knight AG, Keller JN, Ingram DK, et al. Cognitive impairment following high fat diet consumption is associated with brain inflammation. J Neuroimmunol. (2010) 219:25–32. doi: 10.1016/j.jneuroim.2009.11.010
Keywords: dietary patterns, neuroimaging, neurocognition, diet, brain health
Citation: Townsend RF, Woodside JV, Prinelli F, O’Neill RF and McEvoy CT (2022) Associations Between Dietary Patterns and Neuroimaging Markers: A Systematic Review. Front. Nutr. 9:806006. doi: 10.3389/fnut.2022.806006
Received: 31 October 2021; Accepted: 16 March 2022;
Published: 26 April 2022.
Edited by:
Gorazd Drevenšek, University of Primorska, SloveniaReviewed by:
Ban Hock Khor, Universiti Malaysia Sabah, MalaysiaShannon Risacher, Indiana University Bloomington, United States
Copyright © 2022 Townsend, Woodside, Prinelli, O’Neill and McEvoy. This is an open-access article distributed under the terms of the Creative Commons Attribution License (CC BY). The use, distribution or reproduction in other forums is permitted, provided the original author(s) and the copyright owner(s) are credited and that the original publication in this journal is cited, in accordance with accepted academic practice. No use, distribution or reproduction is permitted which does not comply with these terms.
*Correspondence: Claire T. McEvoy, c.mcevoy@qub.ac.uk