Increased Risk of Vitamin D Deficiency Among HIV-Infected Individuals: A Systematic Review and Meta-Analysis
 Yingying Wang†
  Xiaojie Huang†
  Yaxin Wu
  Aixin Li
  Yakun Tian
  Meixin Ren
  Zhen Li
  Tong Zhang
  Hao Wu
  Wen Wang*
- Center for Infectious Diseases, Beijing Youan Hospital, Capital Medical University, Beijing, China
Background: Human immunodeficiency virus (HIV) infection is a heavy burden worldwide. Observational studies have reported a high prevalence of vitamin D deficiency (VDD) among people living with HIV (PLWH). However, its deficiency is also a global health problem. Therefore, we conducted a meta-analysis and systemic review to compare differences between HIV-infected subjects and non-HIV-infected subjects.
Methods: We searched PubMed, Web of Science, Embase, and Cochrane library. We extracted data, including demographic information, study type, vitamin D-related values, and HIV-related values, ultimately including 15 studies after removing duplicates and screening titles, abstracts, and full texts and finally performing a meta-analysis in terms of vitamin D level and vitamin D deficiency prevalence.
Results: Regarding VDD prevalence, the HIV vs. the non-HIV group had an odds ratio of 1.502 (95% CI, 1.023–2.205; P = 0.038). In the subgroup analysis, the odds ratios were 1.647 (95% CI, 1.020–2.659; P = 0.041; I2 = 94.568) from 7 studies (age over 40), 2.120 (95% CI, 1.122–4.008; P = 0.021; I2 = 0.000) from 2 studies (BMI less than or equal to 25), 1.805 (95% CI, 1.373–2.372; P = 0.042; I2 = 74.576) from 7 studies (latitude <40), 2.120 (95% CI, 1.122–4.088; P = 0.021; I2 = 0.000) from 2 studies (only included male participants), and 2.296 (95% CI, 1.287–4.097; P = 0.005; I2 = 19.927) from 3 studies (only included ART-experienced participants). Thirteen studies were deemed to have moderate quality, while two had high quality.
Conclusions: HIV infected subjects are prone to have VDD compared with general population. ART, older age, lower BMI, lower latitude and male sex may present risk factors for VDD in PLWH.
Systematic Review Registration: https://www.crd.york.ac.uk/PROSPERO/display_record.php?RecordID=228096.
Introduction
Human immunodeficiency virus (HIV) infection is a global concern. Thirty-eight million people are living with HIV (PLWH); however, only 26 million receive treatment. The goal of 90−90−90, launched by the Joint United Nations Programme on HIV/AIDS (UNAIDS), was still underachieved in 2019. Fortunately, the deaths related to HIV have decreased by 39% since 20101. People must receive antiretroviral therapy (ART) since there is still no cure (1). Recent guidelines for first-line therapy are different among the USA, Europe and WHO. The Nucleoside reverse transcriptase inhibitor (NRTI)-based regimen plus DTG is recommended as the preferred first-line regimen by the WHO (2). In contrast, the USA suggests an inhibitor-based strategy (3). Tenofovir Disoproxil Fumarate (TDF) or Tenofovir alafenamide (TAF), plus one of which includes rilpivirine, boosted darunavir, and an integrase inhibitor, are allowed in Europe (4). Improvements are apparent in terms of viral suppression, quality of life, life span, and so on (3). Simultaneously, chronic diseases involving bone, kidney, and heart and metabolic disorders such as vitamin D deficiency, have appeared (5).
Vitamin D, a steroid hormone that balances homeostasis, involves bone metabolism and calcium absorption, affecting many processes in the human body. Vitamin D metabolites have been recognized to support innate antiviral mechanisms, including antimicrobial peptides and autophagy. Immune cells, which include monocytes and macrophages, are equipped to synthesize and respond to active vitamin D (6). These cells could have an antibacterial effect on Vitamin D receptor-expressing cells, such as T cells and B cells, by releasing 1,25(OH)2D in response to the induction by pathogens, such as M. tuberculosis (6). In addition, vitamin D receptors exist in broad tissues, including the heart muscle, kidney, cancer cells, lungs, and so on (7). Observational and ecological studies have demonstrated correlations between low serum vitamin D concentration and increased risk of cardiovascular disease, cancer, diabetes, and death (8).
Vitamin D deficiency may cause immune dysfunction by altering the expression of autophagy and inflammatory markers in HIV-infected subjects. Additionally, its deficiency is also linked with an increased risk of AIDS-related comorbidities and mortalities (9). Recently, vitamin D has attracted attention in many fields. Its supplementation strengthens muscle, lowers the fracture risk in elderly patients (10), reduces chronic obstructive pulmonary disease exacerbations, and prevents respiratory tract infections in children (11, 12). Furthermore, it reduces the coinfection and progression of HIV/TB (13). However, vitamin D deficiency is a common concern. Approximately 7% of the population presents with <30 ng/ml of serum vitamin D concentrations worldwide (14). Approximately 5 and 14% of individuals live with severe vitamin D deficiency in the USA and Europe, respectively. At the same time, the Middle East or Gulf states reported an even higher percentage (15).
Recent studies reported higher vitamin D deficiency prevalence in PLWH (16–18). Many factors, such as HIV infection, ART, detectable HIV RNA, and HIV-related comorbidities, could be the reason for hypovitaminosis D (19). For example, efavirenz (EFV) enhances the transformation of active vitamin D into inactive forms by inducing the cytochrome P450 enzyme (20). Simultaneously, the inconsistency of whether protease inhibitor (PI) or TDF leads to a lower vitamin D levels is still unresolved. A cross-sectional study showed that PI-boosted monotherapy was related to a lower risk of vitamin D deficiency by inhibiting vitamin D activation (21), but Cervero et al. reported the opposite result (22).
Many studies have estimated the prevalence of vitamin D deficiency. However, a consensus on whether HIV-infected subjects exhibit serum vitamin D concentrations or higher vitamin D deficiency prevalence than non-HIV-infected populations has not been reached. Therefore, we aimed to investigate the difference in both outcomes between HIV and control groups.
Materials and Methods
Study Design
We performed a systematic review and meta-analysis based on PRISMA guidelines, and it was registered in PROSPERO (CRD42021228096).
Data Sources and Searches
PubMed, Embase, Web of Science, and the Cochrane Library were researched for relevant articles.
We used the Medical Subject Heading terms for PubMed and comparable terms for other databases. Search terms included vitamin D (“vitamin D,” “vitamin D deficiency,” “25-hydroxyvitamin D,” “calcifediol,” “ergocalciferols,” and “cholecalciferol”) and HIV (“HIV” and “HIV Infections”). The detailed search strategy is described in Supplementary Table 1. Studies that fulfilled both the inclusion and exclusion criteria published before November 29, 2020 were included.
Study Selection
The inclusion criteria were as follows: (1) human study related to HIV, (2) participants over 18 y of age diagnosed with HIV, (3) observational study with a comparable non-HIV healthy or general control group, and (4) accessible data examining the frequency of VDD or the levels of VD in each group.
Exclusion criteria included the following: (1) experimental studies, (2) intervention studies, (3) no control group for comparison or unclear information for the control group, (4) conference proceedings and abstracts, short or brief communications, (5) case reports or case series, (6) non-English language studies, (7) participants included pregnant women, and (8) human studies related to tuberculosis.
All the studies searched from four database were sent to citation manager (Endnote X9). After removing duplicates by using the citation manager, researchers (Y.Y.W. and Y.X.W.) read through the titles and abstracts of the studies independently. Full texts were obtained, and further screening was performed when the studies were recognized as eligible or uncertain with respect to their eligibility. Disagreements were resolved by consensus.
Data Extraction
Two authors independently extracted data using predefined and standardized data extraction forms, combining the data if studies included several subgroups. Disagreements were resolved by discussion. The extracted information included: year of publication, name of the first author, sample size, study design, sampling date or season, male proportion, country, method of vitamin D measurement, mean serum vitamin D level, vitamin D deficiency prevalence, and HIV-related information.
Risk of Bias
Researchers assessed the quality of the included studies, case-control studies and cohort studies using the Newcastle–Ottawa Scale. Cross-sectional studies were evaluated using the scale launched by the Agency for Healthcare Research and Quality (23). Selection and comparability were both considered in case-control and cohort studies. At the same time, exposure was evaluated in case-control studies, and the outcome was evaluated in cohort studies. The highest score is 9. A high risk of bias was deemed when the score was <5, 5–7 was deemed to be moderate, and <7 was considered a low risk of bias. Eleven items were judged in the cross-sectional study. Publication bias was assessed according to a visualized funnel plot. Low publication bias appeared when the plot was symmetrical.
Outcomes
The primary outcomes for this review were differences in serum 25 (OH) D levels and vitamin D deficiency prevalence between participants with and without HIV infection.
Statistical Analysis
Search results were sent to citation manager software. We performed statistical analysis on pooled mean serum 25 (OH) D concentration and vitamin D prevalence using CMA software. Heterogeneity was expected to be high due to numerous factors influencing vitamin D syntheses, such as season, ethnicity, and latitude. Consequently, we used the random-effects model to conduct data synthesis. Heterogeneity was assessed using the I2 test, we considered values below 25% to be low, 25–50% to be moderate and over 50% to be high, and it was considered substantial when <75% (24). A significant difference was considered with a p-value <0.05.
Data Synthesis
We transformed data using the formula SD = SE x √ N when presented in the form of the mean ± SE (25). N represents the sample size or the number of participants. When data was provided as the median ± IQR, they were converted into estimated mean ± SD using an established method (26). Data presented only with medians were excluded from the final meta-analysis. Data needed to be pooled based on the Cochrane Handbook for Systematic Reviews of Interventions if provided as the mean ± SD from two or more subgroups (27). Serum vitamin D levels were converted into ng/ml by dividing by 2.5 when they were presented as nmol/L (14).
Subgroup Analysis and Meta-Regression
We analyzed predefined subgroups (28) by age (>40 or ≤40), latitude (>40 or ≤40), ART (HIV participants with 100% ART or without ART), HIV RNA (detectable vs. undetectable), BMI (>25 vs. ≤ 25), and sex (only male vs. only female) to determine the factors affecting heterogeneity.
We also adopted the variables (the proportion of ART, male proportion, Undetectable HIV RNA proportion, BMI, latitude, publication year, and CD4 count) to perform a meta-regression to find out the sources of heterogeneity.
Results
Literature Search Results
A total of 2,261 records were screened for titles and abstracts after the initial removal of 923 duplicates by the citation manager. Seventy-three articles were left for full-text screening. Fifteen studies were included in our review. Details for the progress of searching are available in Figure 1.
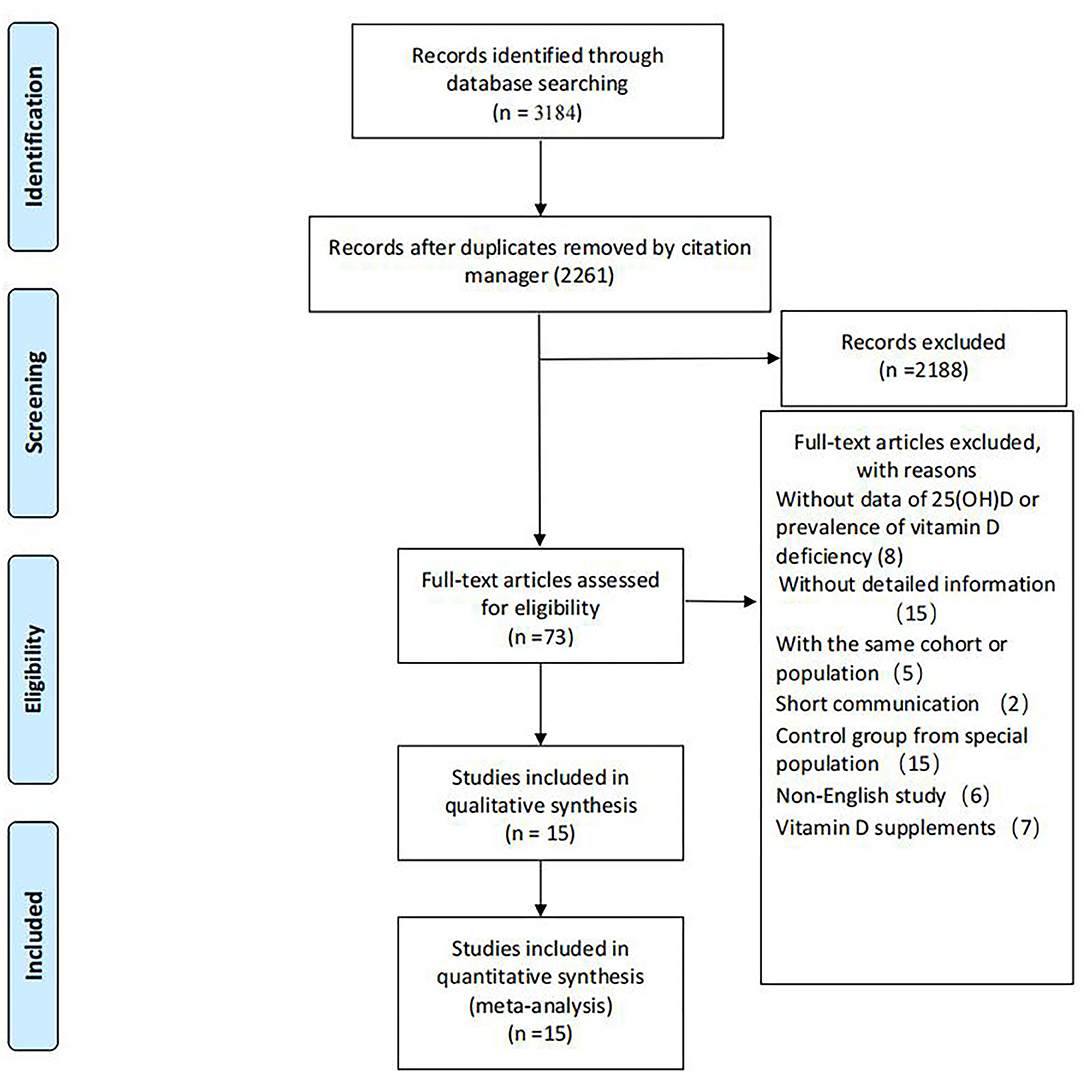
Figure 1. Flowchart of the studies included in the meta-analysis.
Six studies were performed in the United States (18, 29–33), 2 in Italy (34, 35), and 1 each from China (36), Chile (37), Iran (28), Australia (38), Poland (39), Brazil (40), and India (41). Seven studies recruited participants based on ART status, 4 of which included ART-experienced HIV subjects (29, 33, 35, 39), while the rest included ART-naïve HIV-infected subjects (31, 36, 37). Three studies were performed in the male population (33, 37, 41), whereas 1 study included only females (18). Twenty-five (OH) D was detected using enzyme-linked immunosorbent assay (ELISA) (28, 29), high-performance liquid chromatography (34, 35), Ultra-HPLC-tandem MS (30), immunoaffinity-liquid chromatography-tandem mass spectrometry (33), Electrochemiluminescence immunoassay (36), liquid chromatography/mass spectrometry (18, 32, 37), chemiluminescent assay (31, 38), luminescent method (39), chemiluminescent microparticle immunoassay (40), and radioimmunoassay (41). The primary characteristics of the included studies are shown in Tables 1, 2. The risk of bias from the included articles is presented in Tables 3, 4.
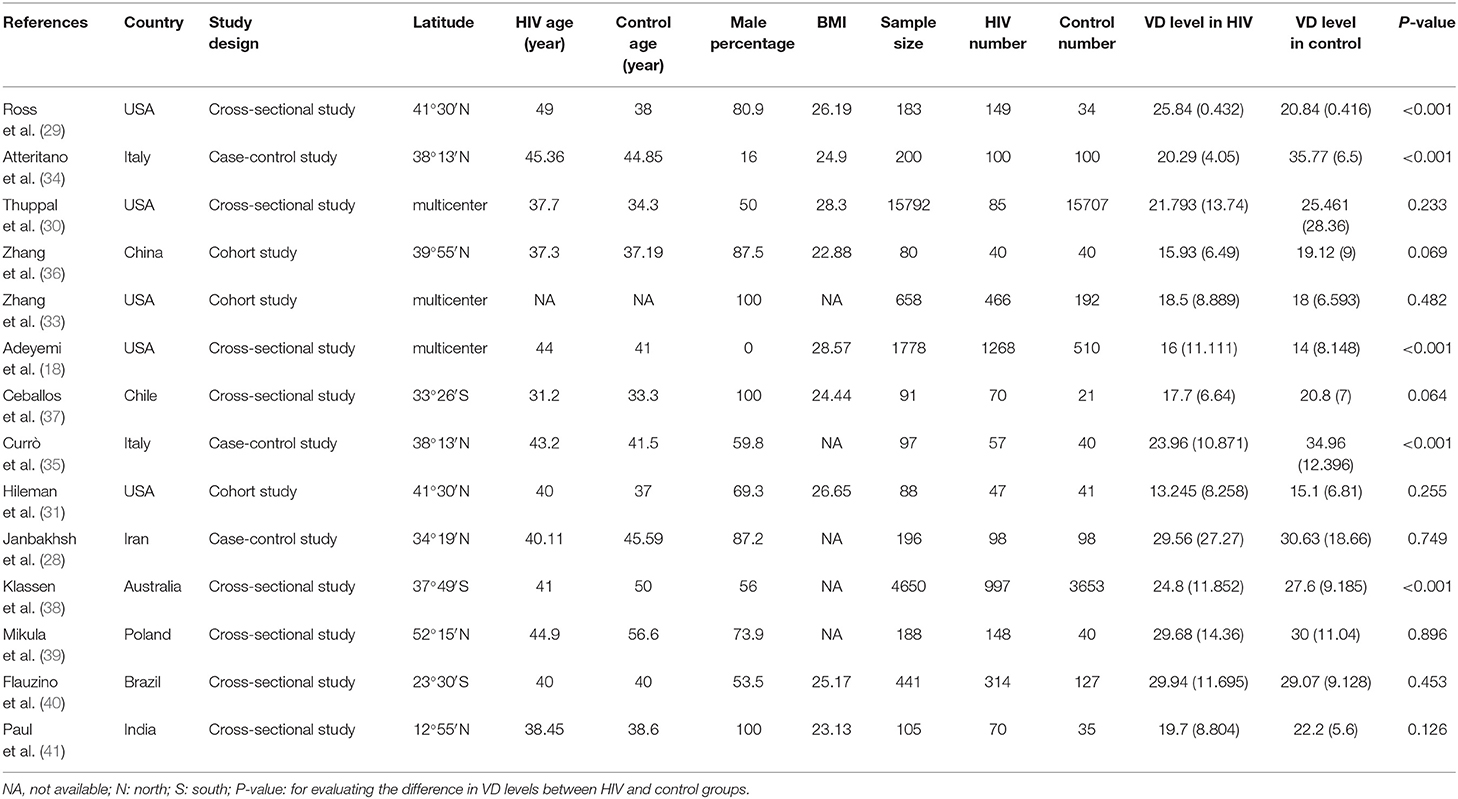
Table 1. The characteristics of included studies for assessing vitamin D level.
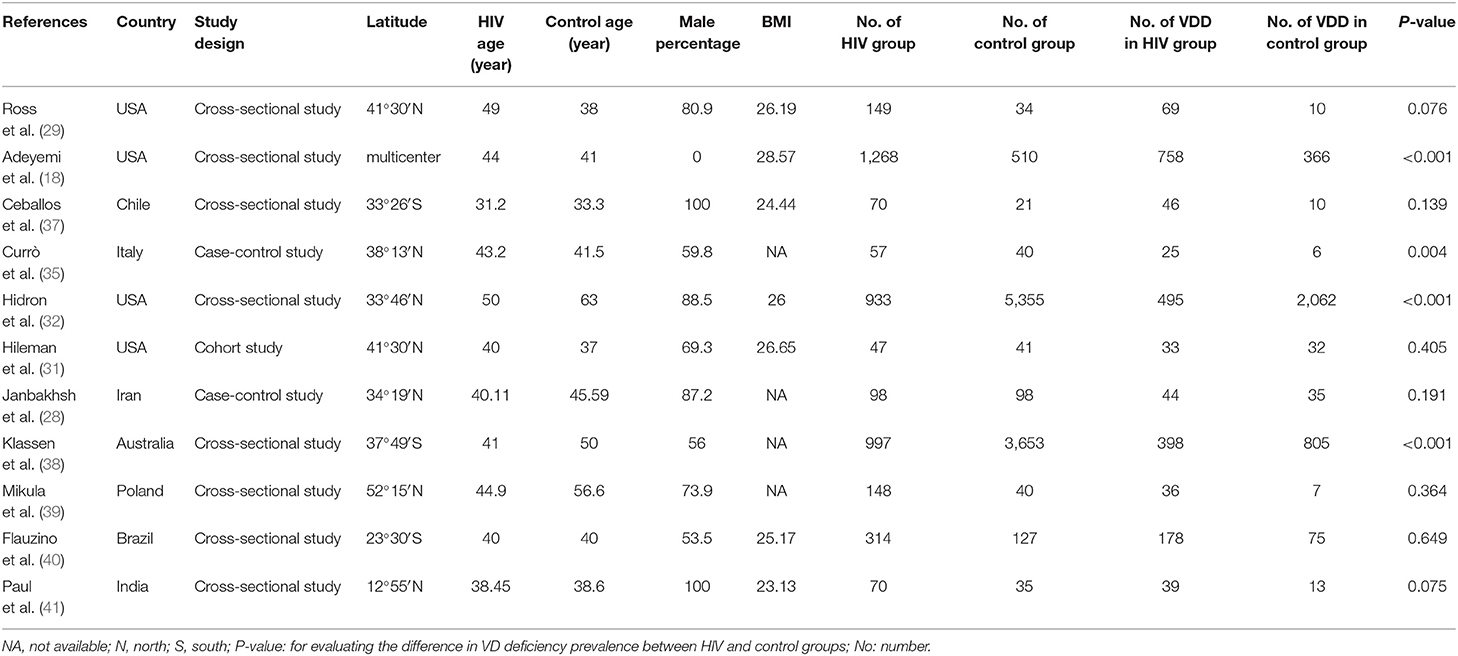
Table 2. Characteristic of included studies for assessing the Vitamin D Deficiency prevalence.
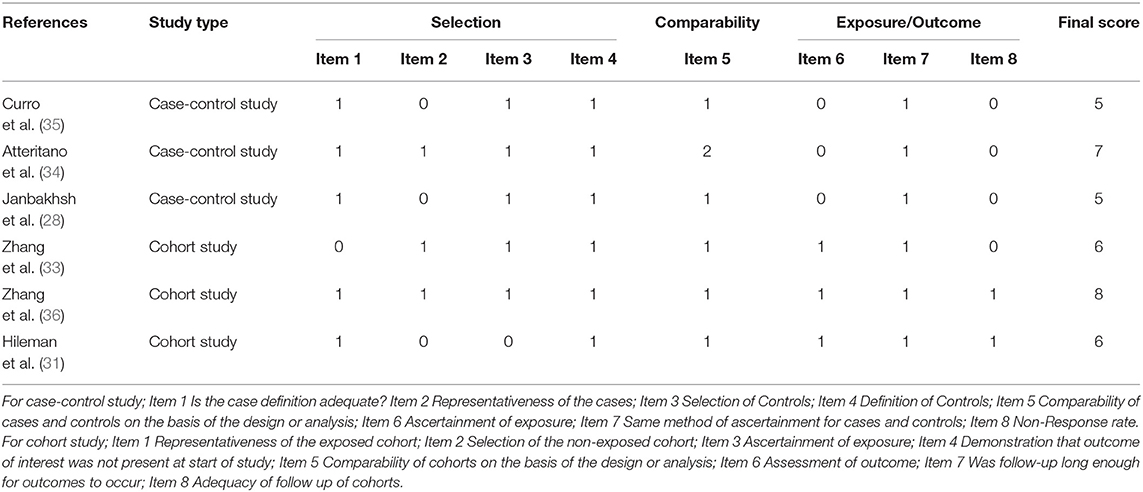
Table 3. Quality assessment of included studies.
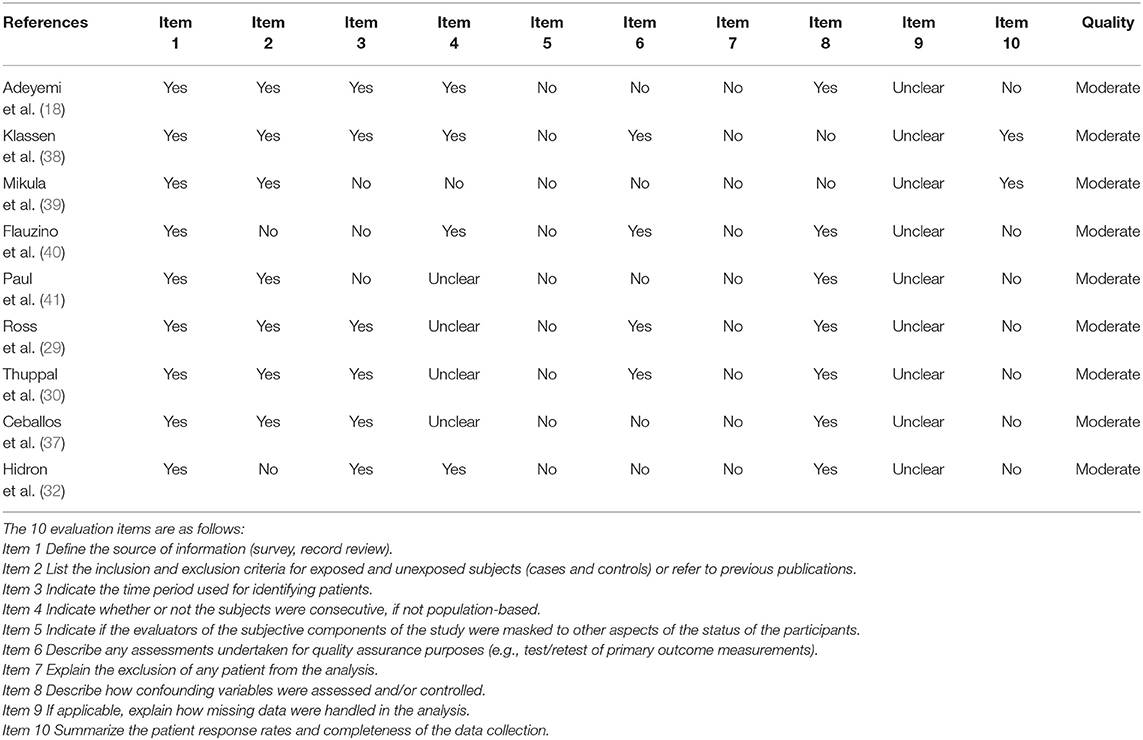
Table 4. Quality assessment of included cross-sectional studies.
Differences in Vitamin D Deficiency Prevalence Between HIV and Control Groups
The overall number of VDD and sample size of HIV and the control group from 11 studies were combined and calculated. The overall odds ratio (OR) for HIV vs. the control group was 1.502 (95% CI, 1.023–2.205; P = 0.038), with substantial heterogeneity (I2 = 91.804). In subgroup analyses, the overall ORs were 1.647 (95% CI, 1.020–2.659; P = 0.041; I2 = 94.568) from 7 studies (age over 40), 2.120 (95% CI, 1.122–4.008; P = 0.021; I2 = 0.000) from 2 studies (BMI less than or equal to 25), 1.805 (95% CI, 1.373–2.372; P = 0.042; I2 = 74.576) from 7 studies (latitude <40), 2.120 (95% CI, 1.122–4.088; P = 0.021; I2 = 0.000) from 2 studies (only included male participants), and 2.296 (95% CI, 1.287–4.097; P = 0.005; I2 = 19.927) from 3 studies (only included ART-experienced participants). We did not observe a biased correlation from Begg and Mazumdar rank collection test results. Egger's regression showed that the intercept was 0.75804 (95% CI, −4.59309 to 3.07702; t = 0.44714), and the P-values were 0.33267 and 0.66534 in one-tailed and two-tailed analyses, respectively. The forest plots are shown in Figure 2. Detailed subgroup results and the funnel plots are shown in Supplementary Table 2 and Supplementary Figure 1.
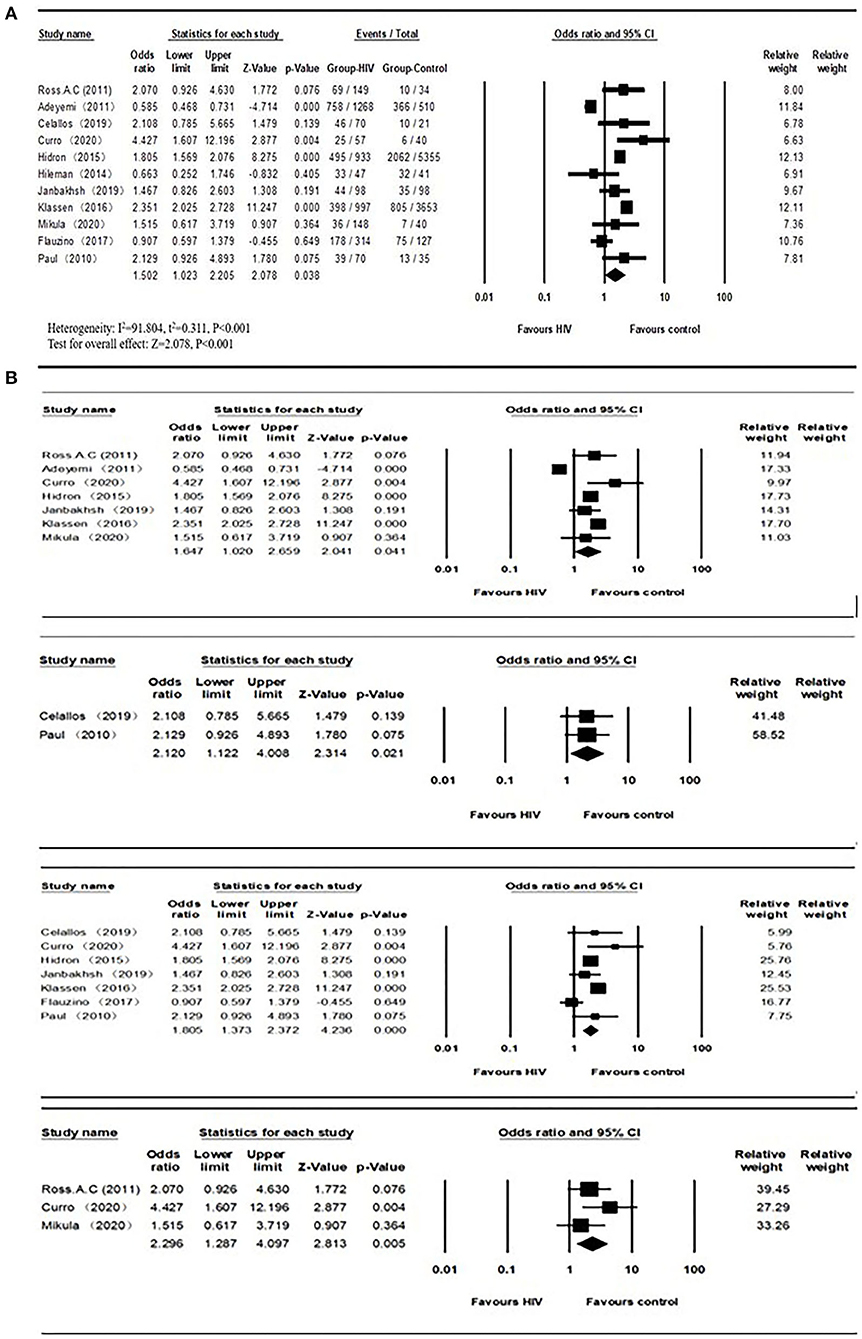
Figure 2. (A) Vitamin D deficiency prevalence in HIV and control groups; (B) Subgroups of vitamin D deficiency (Age > 40, BMI ≤ 25, Latitude < 40, ART-experienced studies from top to bottom) prevalence between HIV and control groups.
Differences in Serum Vitamin D Levels Between HIV and Control Groups
The mean and SD of serum 25(OH)D levels reported by 14 studies were pooled and computed. The overall mean difference between HIV and control groups was −2.567 (95% CI, −5.976 to 0.843; P = 0.140), with substantial heterogeneity (I2 = 99.021). In subgroup analyses, the overall mean difference (MD) was −1.876 (95% CI, −3.341 to −0.187; P = 0.028; I2 = 27.956) from 6 studies (age less than or equal to 40), −2.684 (95% CI, −4.588 to −0.780; P = 0.006; I2 = 0.000) from 3 studies (ART-naïve HIV participants), −4.841 (95% CI, −9.515 to −0.167; P = 0.042; I2 = 97.326) from 8 studies (latitude less than or equal to 40) and −2.473 (95% CI, −4.812 to −0.134; P = 0.038; I2 = 0.000) from 2 studies (HIV participants with detectable HIV RNA). It was asymmetric in the visual funnel plot. Therefore, we performed Duval and Tweedies's trim and fill test and found that the summary MD was still not significantly different between the HIV and control groups after 4 studies were trimmed and filled. The forest plots are shown in Figure 3. Detailed subgroup results and the funnel plots are shown in Supplementary Table 3 and Supplementary Figure 2. The results of meta-regression for both outcomes are presented in Supplementary Table 4. The global map for vitamin D levels in HIV individuals from included studies is shown in Figure 4.
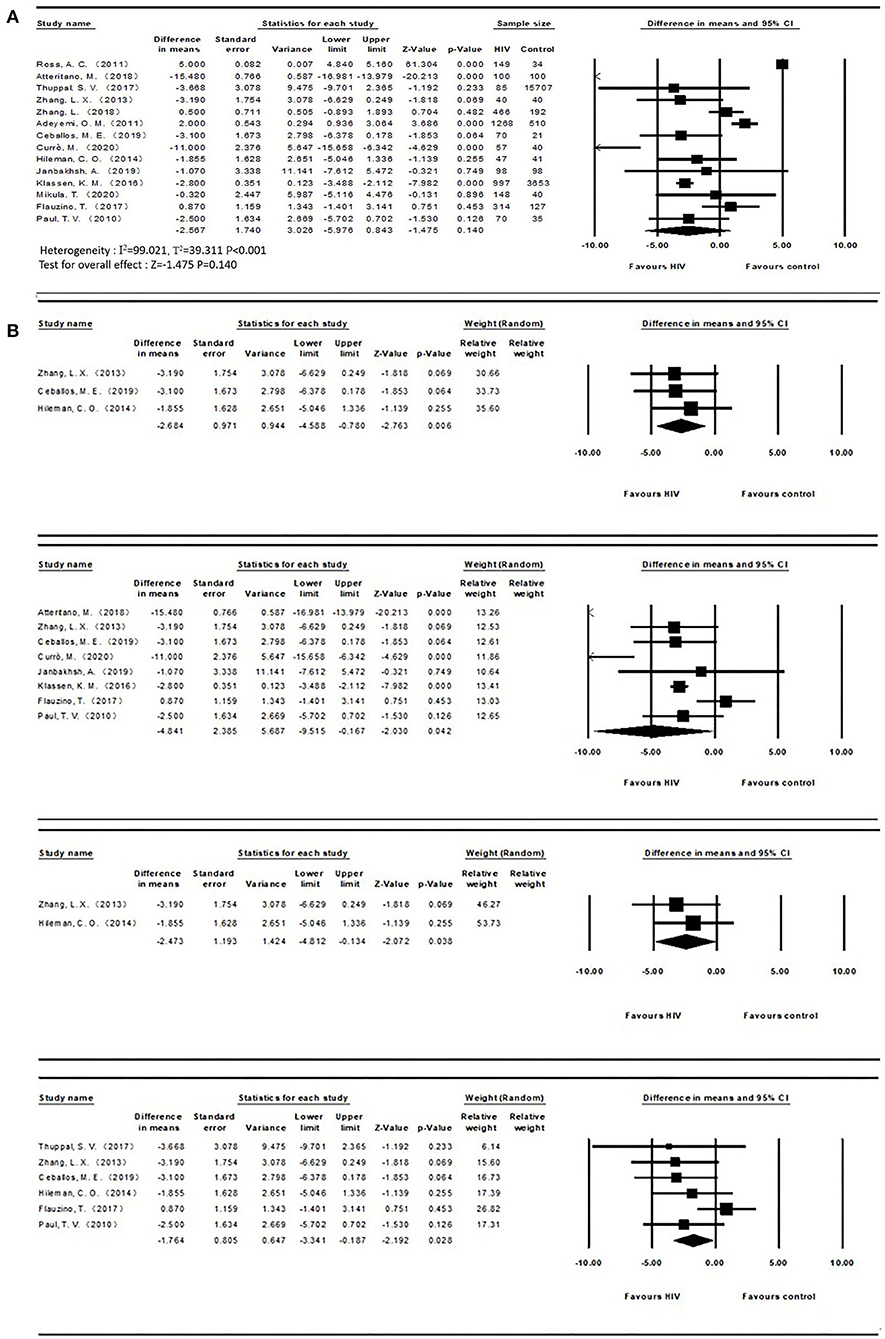
Figure 3. (A) Vitamin D levels in HIV and control groups; (B) Subgroups of vitamin D levels (ART-naïve, Latitude ≤40, detectable HIV RNA, Age ≤ 40 from top to bottom) between both groups.
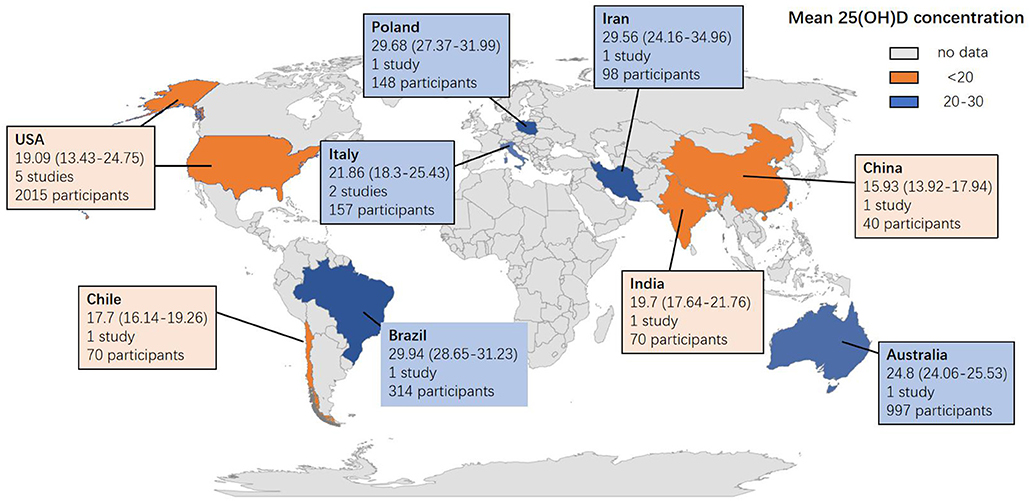
Figure 4. Global map for vitamin D concentration in HIV individuals from 14 included studies. Data are the mean (95% CI) 25 (OH) D concentrations reported in studies done in each country. Pooled means were calculated if the country had more than one study. Twenty five (OH) D = 25-hydroxyvitamin D.
Discussion
This review is the first to quantitatively and systematically compare differences in VDD prevalence and serum VD levels between PLWH and the general population. The HIV group had a lower but not significantly different vitamin D level than the control group. In contrast, a higher vitamin D deficiency prevalence tended to occur in PLWH.
Principal Findings and Comparison to Other Studies
Observational studies conducted only on HIV participants reported high vitamin D deficiency prevalence. Some mechanisms have been explored to interpret the relationship between HIV and VDD. PLWH have many more risk factors than traditional patients. For example, ART is related to vitamin D deficiency (42). Avihingsanon et al. reported that EFV use was an independent predictor of VDD (43). Another prospective study observed lower vitamin D levels after 21 months of treatment with PI or NRTIs (44). These results were consistent with the outcomes of our subgroups stratifying HIV participants into ART-experienced and ART-naïve. Interestingly, a study conducted in veterans also demonstrated a higher prevalence in HIV participants than in the control group (53.2 vs. 38.5%, p < 0.001), yet tenofovir use was inversely associated with vitamin D deficiency (OR 0.72, 95% CI 0.54–0.96) (32). Likewise, Adeyemi reported an opposite effect of recent PI use (18). The disagreement regarding the effect of ART drugs on vitamin D metabolism is still unresolved (18). Unfortunately, we could not perform subgroup analysis stratifying detailed ART regimens due to limited information.
Vitamin D modulates immune responses. Its receptors are expressed on nearly all immune cells, primarily CD8 and CD4 T lymphocytes (45). In addition to responding to infection, it also prevents the development of autoimmune diseases, such as type 1 diabetes, systemic lupus erythematosus, and inflammatory bowel disease. Several studies have evaluated the association between CD4 T cell count and VD status, often with contradictory results. In a pearl study, vitamin D status precART was linked to CD4 T cell recovery (46). The same effect was observed in another longitudinal study stratifying HIV participants into VDD, Vitamin D insufficiency (VDI), and Vitamin D sufficiency (VDS) groups. CD4 count was screened at every visit (47). The VDD and VDI groups displayed lower absolute T cell gain at all time. Likewise, Adeymi and colleagues reported ORs of 2.77 (1.29–6.68) and 1.66 (1.15–2.51) in CD4 <50 and ranged between 50 and 200 in regard to vitamin D deficiency (18). Mikula and colleagues found that vitamin D levels were positively correlated with CD4 percentage (r = 0.17, P = 0.036) (39). In contrast, Flauzino et al. found no significant difference in CD4 count (categorized into <200, 200–500, and over 500 groups) when stratified by vitamin D levels (vitamin D < 30 ng/ml vs. ≥ 30 ng/ml) (P = 0.426) (40). Janbakhsh et al. also demonstrated that CD4 count was not associated with vitamin D levels (28). Similarly, our review did not find a significant association on either outcome by subgrouping according to CD4 count.
Its deficiency is linked with IRIS, HIV disease progression, virologic failure, and death. A longitudinal study supplied healthy participants with high VD3 dosage (50,000 IU/week) for 6 weeks (48). The obtained PBMCs were cultured and infected with HIV at each of the visits. P24 antigen levels were high at initiation and decreased after 6 weeks of VD3 supplementation. The effect of limiting HIV replication was observed through this study, yet it was conducted using healthy PBMCs in vitro. In our subgroup of 2 studies in which HIV participants had detectable HIV RNA, HIV participants presented with lower vitamin D levels. Beyond our hypothesis, Flauzino et al. observed a positive correlation between vitamin D level and viral load (when vitamin D level was over or equal to 30 ng/ml) (r = 0.178, p = 0.039), which may result from increased immune stimulation (40).
The influence of traditional factors involving latitude, BMI, and age is apparent in PLWH. The initial step of VD metabolism occurs in the skin, in which sunlight plays an important role. Adequate sunlight is easy to obtain in lower latitude places. At the same time, a meta-analysis reported a higher prevalence of VDD in Africa. Several factors, such as lifestyle, skin color, and nutritional status could be sources of VDD in this review. In our analysis, the HIV group has a higher risk of VDD at lower latitudes. As reported by Maggi et al., HIV participants were prone to use sunblock to protect their skin because they were young with more frequent outdoor activities and more easily developed malignancies (49). Canuto et al. reported the relationship between sunscreen use and lower vitamin D concentration in PLWH in low latitude areas (50). One study from our review reported a higher use of sunblock among PLWH (P = 0.006) (37). The influence of skin color could not be excluded due to lack of detailed information. In addition, PLWH are likely to experience appetite loss, nutrient malabsorption, and inadequate dietary intake (51). A cross-sectional study demonstrated that over 85% of subjects in PLWH had at least one gastrointestinal abnormality (52). Poles et al. reported a high incidence of fat malabsorption in HIV participants (53). Moreover, aging-related VDD is a combined result of all the factors mentioned above. Sunlight exposure, nutrient intake and absorption, and VD synthesis are reduced in elderly patients (54). In addition, Inflammation increases with aging in the imbalanced immune system and the accumulation of senescent cells. PLWH may experience persistent inflammation and immune activation, even with successful viral suppression. Gut-associated lymphoid tissue is damaged early during HIV infection, followed by the translocation of microbial products into the bloodstream, leading to chronic immune activation (55, 56). In addition, HIV shares several proinflammatory biomarkers with aging (55). Vitamin D has antioxidant and anti-inflammatory effects. However, the relationship that occurs first between vitamin D and aging is still unclear (57).
PLWH are prone to present decreased bone mass. Vitamin D also functions in bone metabolism with calcium. Shahar and colleagues reported that vitamin D status was associated with bone mineral density in female PLWH (58). In addition, Atteritano et al. demonstrated a statistical association between vitamin D insufficiency and vertebral fracture (OR = 9.15, p < 0.04) (34).
Therefore, PLWH need to be screened to identify the potential vitamin D deficiency. Additional randomized controlled studies must perform due to the unclear suitable dosage of vitamin D supplements in HIV participants. Moreover, we advise establishing a model predicting and screening PLWH at higher risk for VD deficiency, which could act in a positive way in detecting potential deficiency in resource-limited places. Appropriate cutoffs of vitamin D deficiency should also be considered due to the differential current criteria developed based on bone-related studies.
Limitations
Several points should be considered in interpreting our results. First, we only adopted the baseline data into our meta-analysis from all the literature. We could not obtain a causal association from these studies because the change in vitamin D may interfere with lifestyle. Second, it should be noted that several studies did not survey detailed information on vitamin D supplements. Third, in our review, the included studies were conducted in Europe, the middle and east of Asia, America, and Australia. Therefore, it is unclear whether this association exists elsewhere. Our included studies were also limited to the English language. Finally, age, sex, type of HIV participants, latitude, CD4 counts, publication year and BMI could be sources of heterogeneity, which was supported by subgroup analysis and meta-regression.
Conclusions
In conclusion, in our systematic review and meta-analysis, we observed a modest but significantly higher vitamin D deficiency prevalence in PLWH than in control subjects. Furthermore, HIV participants were prone to VDD in when receiving ART, living in lower latitudes, being older, having a lower BMI, and being male. In addition, we strongly recommend performing further cohort studies and population-based trials to confirm our results.
Data Availability Statement
The original contributions presented in the study are included in the article/Supplementary Material, further inquiries can be directed to the corresponding author/s.
Author Contributions
YWa: article review, quality assessment, and draft written. XH: article review, quality assessment, and manuscript revise. YWu and AL: data extraction and quality assessment. YT, TZ, and HW: manuscript revise. MR: article review. WW: study design, article review, quality assessment, and manuscript revise. All authors contributed to the article and approved the submitted version.
Funding
This research was funded by Technology Major Project of China During the 13th Five-year Plan Period (2017ZX10202101-001-004 and 2017ZX10201101), the Beijing Excellent Talent Plan (2018000021223ZK04) and the Beijing Talent Project in the New Millennium (2020A35).
Conflict of Interest
The authors declare that the research was conducted in the absence of any commercial or financial relationships that could be construed as a potential conflict of interest.
Publisher's Note
All claims expressed in this article are solely those of the authors and do not necessarily represent those of their affiliated organizations, or those of the publisher, the editors and the reviewers. Any product that may be evaluated in this article, or claim that may be made by its manufacturer, is not guaranteed or endorsed by the publisher.
Supplementary Material
The Supplementary Material for this article can be found online at: https://www.frontiersin.org/articles/10.3389/fnut.2021.722032/full#supplementary-material
Abbreviations
ART, Antiretroviral therapy; HIV, Human immunodeficiency virus; PLWH, People Living with HIV; VDD, Vitamin D deficiency; SE, Standard error; SD, Standard difference; IQR, Interquartile range; MD, Mean difference; OR, Odds ratio; BMI, Body Mass Index; ELISA, Enzyme-linked immunosorbent assay; TDF, Tenofovir Disoproxil Fumarate; TAF, Tenofovir alafenamide; VDR, Vitamin D receptor; EFV, Efavirenz; PI, Protease inhibitor; VDI, Vitamin D insufficiency; VDS, Vitamin D sufficiency; UNAIDS, Joint United Nations Programme on HIV/AIDS; NRTI, the nucleoside reverse transcriptase inhibitor.
Footnotes
1. ^Available online at: https://www.unaids.org/en (accessed January 15, 2021) (2019).
References
1. Margolis D, Archin N, Cohen M, Eron J, Ferrari G, Garcia J, et al. Curing HIV: seeking to target and clear persistent infection. Cell. (2020) 181:189–206. doi: 10.1016/j.cell.2020.03.005
2. WHO. (2019). Available online at: https://www.who.int/ (accessed January 15, 2021).
3. Saag M, Gandhi R, Hoy J, Landovitz R, Thompson M, Sax P, et al. Antiretroviral Drugs for Treatment and Prevention of HIV Infection in Adults: 2020 Recommendations of the International Antiviral Society-USA Panel. JAMA. (2020) 324:1651–69. doi: 10.1001/jama.2020.17025
4. Ryom L, Cotter A, De Miguel R, Béguelin C, Podlekareva D, Arribas JR, et al. 2019 update of the European AIDS clinical society guidelines for treatment of people living with HIV version 10.0. HIV Med. (2020) 21:617–24. doi: 10.1111/hiv.12878
5. Deeks S, Tracy R, Douek D. Systemic effects of inflammation on health during chronic HIV infection. Immunity. (2013) 39:633–45. doi: 10.1016/j.immuni.2013.10.001
6. Hewison M. Antibacterial effects of vitamin D. Nat Rev Endocrinol. (2011) 7:337–45. doi: 10.1038/nrendo.2010.226
7. Plum L, DeLuca H. Vitamin D, disease and therapeutic opportunities. Nat Rev Drug Disc. (2010) 9:941–55. doi: 10.1038/nrd3318
8. Autier P, Boniol M, Pizot C, Mullie P. Vitamin D status and ill health: a systematic review. Lancet Diab Endocrinol. (2014) 2:76–89. doi: 10.1016/S2213-8587(13)70165-7
9. Viard J, Souberbielle J, Kirk O, Reekie J, Knysz B, Losso M, et al. Vitamin D and clinical disease progression in HIV infection: results from the EuroSIDA study. AIDS. (2011) 25:1305–15. doi: 10.1097/QAD.0b013e328347f6f7
10. Bischoff-Ferrari H, Willett W, Wong J, Giovannucci E, Dietrich T, Dawson-Hughes B. Fracture prevention with vitamin D supplementation: a meta-analysis of randomized controlled trials. JAMA. (2005) 293:2257–64. doi: 10.1001/jama.293.18.2257
11. Mathyssen C, Gayan-Ramirez G, Bouillon R, Janssens W. Vitamin D supplementation in respiratory diseases: evidence from randomized controlled trials. Pol Arch Intern Med. (2017) 127:775–84. doi: 10.20452/pamw.4134
12. Esposito S, Lelii M. Vitamin D and respiratory tract infections in childhood. BMC Infect Dis. (2015) 15:487. doi: 10.1186/s12879-015-1196-1
13. Ayelign B, Workneh M, Molla M, Dessie G. Role of vitamin-D supplementation in TB/HIV co-infected patients. Infect Drug Res. (2020) 13:111–8. doi: 10.2147/IDR.S228336
14. Hilger J, Friedel A, Herr R, Rausch T, Roos F, Wahl D, et al. A systematic review of vitamin D status in populations worldwide. Bri J Nutr. (2014) 111:23–45. doi: 10.1017/S0007114513001840
15. Lips P, Cashman K, Lamberg-Allardt C, Bischoff-Ferrari H, Obermayer-Pietsch B, Bianchi M, et al. Current vitamin D status in European and middle east countries and strategies to prevent vitamin D deficiency: a position statement of the European calcified tissue society. Eur J Endocrinol. (2019) 180:P23–54. doi: 10.1530/EJE-18-0736
16. Mansueto P, Seidita A, Vitale G, Gangemi S, Iaria C, Cascio A. Vitamin D Deficiency in HIV infection: not only a bone disorder. BioMed Res Int. (2015) 2015:735615. doi: 10.1155/2015/735615
17. Deshwal R, Arora S. High prevalence of vitamin d deficiency in HIV infected on antiretroviral therapy in a cohort of indian patients. J Assoc Phys India. (2019) 67:42–5.
18. Adeyemi O, Agniel D, French A, Tien P, Weber K, Glesby M, et al. Vitamin D deficiency in HIV-infected and HIV-uninfected women in the United States. J Acquir Immune Defic Syndr 1999. (2011) 57:197–204. doi: 10.1097/QAI.0b013e31821ae418
19. Hsieh E, Yin M. Continued interest and controversy: vitamin D in HIV. Curr HIV/AIDS Rep. (2018) 15:199–211. doi: 10.1007/s11904-018-0401-4
20. Wang Z, Schuetz E, Xu Y, Thummel K. Interplay between vitamin D and the drug metabolizing enzyme CYP3A4. J Steroid Biochem Mol Biol. (2013) 136:54–8. doi: 10.1016/j.jsbmb.2012.09.012
21. Cervero M, Agud J, Torres R, García-Lacalle C, Alcázar V, Jusdado J, et al. Higher vitamin D levels in HIV-infected out-patients on treatment with boosted protease inhibitor monotherapy. HIV Med. (2013) 14:556–62. doi: 10.1111/hiv.12049
22. Cervero M, Agud J, García-Lacalle C, Alcázar V, Torres R, Jusdado J, et al. Prevalence of vitamin D deficiency and its related risk factor in a Spanish cohort of adult HIV-infected patients: effects of antiretroviral therapy. AIDS Res Hum Retroviruses. (2012) 28:963–71. doi: 10.1089/aid.2011.0244
23. Zeng X, Zhang Y, Kwong JS, Zhang C, Li S, Sun F, et al. The methodological quality assessment tools for preclinical and clinical studies, systematic review and meta-analysis, and clinical practice guideline: a systematic review. J Evid Based Med. (2015) 8:2–10. doi: 10.1111/jebm.12141
24. Higgins JP, Thompson SG, Deeks JJ, Altman DG. Measuring inconsistency in meta-analyses. BMJ. (2003) 327:557–60. doi: 10.1136/bmj.327.7414.557
25. Sowah D, Fan X, Dennett L, Hagtvedt R, Straube S. Vitamin D levels and deficiency with different occupations: a systematic review. BMC Public Health. (2017) 17:519. doi: 10.1186/s12889-017-4436-z
26. Wan X, Wang W, Liu J, Tong T. Estimating the sample mean and standard deviation from the sample size, median, range and/or interquartile range. BMC Med Res Methodol. (2014) 14:135. doi: 10.1186/1471-2288-14-135
27. Table 7.7.a. Formulae for Combining Groups. (2016). Available online at: http://handbook.cochrane.org/chapter_7/table_7_7_a_formulae_for_combining_groups.htm (accessed January 15, 2021).
28. Janbakhsh A, Afsharian M, Ramezani M, Mozaffari HR, Sadeghi M. Serum levels of vitamin D, magnesium, calcium, iron, and total iron binding capacity in HIV-infected patients. Hiv Aids Rev. (2019) 18:148–52. doi: 10.5114/hivar.2019.83845
29. Ross AC, Judd S, Kumari M, Hileman C, Storer N, Labbato D, et al. Vitamin D is linked to carotid intima-media thickness and immune reconstitution in HIV-positive individuals. Antiv Ther. (2011) 16:555–63. doi: 10.3851/IMP1784
30. Thuppal SV, Jun SY, Cowan A, Bailey RL. The nutritional status of HIV-Infected US adults. Curr Dev Nutr. (2017) 1:e001636. doi: 10.3945/cdn.117.001636
31. Hileman CO, Labbato DE, Storer NJ, Tangpricha V, McComsey GA. Is bone loss linked to chronic inflammation in antiretroviral-naive HIV-infected adults? A 48-week matched cohort study. AIDS. (2014) 28:1759–67. doi: 10.1097/QAD.0000000000000320
32. Hidron AI, Hill B, Guest JL, Rimland D. Risk factors for vitamin D deficiency among veterans with and without HIV infection. PLoS ONE. (2015) 10:e0124168. doi: 10.1371/journal.pone.0124168
33. Zhang L, Brown TT, Margolick JB, Witt MD, Palella FJ, Kingsley LA, et al. Vitamin D metabolites in aging HIV-infected men: does inflammation play a role? Aids Res Hum Retroviruses. (2018) 34:1067–74. doi: 10.1089/aid.2018.0101
34. Atteritano M, Mirarchi L, Venanzi-Rullo E, Santoro D, Iaria C, Catalano A, et al. Vitamin D status and the relationship with bone fragility fractures in HIV-infected patients: a case control study. Int J Mol Sci. (2018) 19:119. doi: 10.3390/ijms19010119
35. Currò M, Visalli G, Pellicanò GF, Ferlazzo N, Costanzo MG, D'andrea F, et al. Vitamin d status modulates inflammatory response in hiv+ subjects: evidence for involvement of autophagy and tg2 expression in pbmc. Int J Mol Sci. (2020) 21:1–14. doi: 10.3390/ijms21207558
36. Zhang LX, Su YB, Hsieh E, Xia WB, Xie J, Han Y, et al. Bone turnover and bone mineral density in HIV-1 infected Chinese taking highly active antiretroviral therapy -a prospective observational study. BMC Musculoskelet Disord. (2013) 14:224. doi: 10.1186/1471-2474-14-224
37. Ceballos ME, Carvajal C, Jaramillo J, Dominguez A, Gonzalez G. Vitamin D and bone mineral density in HIV newly diagnosed therapy-naive patients without any secondary causes of osteoporosis. Calcif Tissue Int. (2019) 104:42–9. doi: 10.1007/s00223-018-0474-5
38. Klassen KM, Fairley CK, Kimlin MG, Hocking J, Kelsall L, Ebeling PR. Vitamin D deficiency is common in HIV-infected southern Australian adults. Antivir Ther. (2016) 21:117–25. doi: 10.3851/IMP2983
39. Mikula T, Sapula M, Suchacz MM, Kozlowska J, Krankowska D, Stanczak W, et al. Risk factors of hypovitaminosis D in HIV-infected patients on suppressive antiretroviral therapy. Aids Res Hum Retroviruses. (2020) 36:676–80. doi: 10.1089/aid.2019.0020
40. Flauzino T, Simao ANC, de Almeida ERD, Morimoto HK, Oliveira SR, Alfieri DF, et al. Association between vitamin D status, oxidative stress biomarkers and viral load in human immunodeficiency virus type 1 infection. Curr Hiv Res. (2017) 15:336–44. doi: 10.2174/1570162X15666171005170227
41. Paul TV, Asha HS, Thomas N, Seshadri MS, Rupali P, Abraham OC, et al. Hypovitaminosis D and bone mineral density in human immunodeficiency virus-infected men from India, with or without antiretroviral therapy. Endocr Pract. (2010) 16:547–53. doi: 10.4158/EP09197.OR
42. Allavena C, Delpierre C, Cuzin L, Rey D, Viget N, Bernard J, et al. High frequency of vitamin D deficiency in HIV-infected patients: effects of HIV-related factors and antiretroviral drugs. J Antimicrob Chemother. (2012) 67:2222–30. doi: 10.1093/jac/dks176
43. Avihingsanon A, Kerr SJ, Ramautarsing RA, Praditpornsilpa K, Sophonphan J, Ubolyam S, et al. The association of gender, age, efavirenz use, and hypovitaminosis D among HIV-infected adults living in the tropics. AIDS Res Hum Retroviruses. (2016) 32:317–24. doi: 10.1089/aid.2015.0069
44. Bonnet E, Ruidavets JB, Genoux A, Mabile L, Busato F, Obadia M, et al. Early loss of bone mineral density is correlated with a gain of fat mass in patients starting a protease inhibitor containing regimen: the prospective Lipotrip study. BMC Infect Dis. (2013) 13:293. doi: 10.1186/1471-2334-13-293
45. Fernandez Lahore G, Raposo B, Lagerquist M, Ohlsson C, Sabatier P, Xu B, et al. Vitamin D3 receptor polymorphisms regulate T cells and T cell-dependent inflammatory diseases. Proceedings of the National Academy of Sciences of the United States of America. Stockholm (2020). p. 24986–97.
46. Shivakoti R, Ewald E, Gupte N, Yang W, Kanyama C, Cardoso S, et al. Effect of baseline micronutrient and inflammation status on CD4 recovery post-cART initiation in the multinational PEARLS trial. Clin Nutr. (2019) 38:1303–9. doi: 10.1016/j.clnu.2018.05.014
47. Ezeamama A, Guwatudde D, Wang M, Bagenda D, Kyeyune R, Sudfeld C, et al. Vitamin-D deficiency impairs CD4+T-cell count recovery rate in HIV-positive adults on highly active antiretroviral therapy: a longitudinal study. Clin Nutr. (2016) 35:1110–7. doi: 10.1016/j.clnu.2015.08.007
48. Coussens A, Naude C, Goliath R, Chaplin G, Wilkinson R, Jablonski N. High-dose vitamin D3 reduces deficiency caused by low UVB exposure and limits HIV-1 replication in urban Southern Africans. Proceedings of the National Academy of Sciences of the United States of America. Khayelitsha (2015). p. 8052–7.
49. Maggi P, Brancaccio G, Gaeta GB. Sunscreen ingredients in plasma: a threat for drug-drug interactions and toxicity among patients living with HIV? Expert Opin Drug Metab Toxicol. (2019) 15:775–8. doi: 10.1080/17425255.2019.1670164
50. Canuto JM, Canuto VM, de Lima MH, de Omena AL, Morais TM, Paiva AM, et al. Risk factors associated with hypovitaminosis D in HIV/aids-infected adults. Arch Endocrinol Metab. (2015) 59:34–41. doi: 10.1590/2359-3997000000007
51. Clark WA, Cress EM. Nutritional issues and positive living in human immunodeficiency virus/AIDS. Nurs Clin North Am. (2018) 53:13–24. doi: 10.1016/j.cnur.2017.10.002
52. Knox TA, Spiegelman D, Skinner SC, Gorbach S. Diarrhea and abnormalities of gastrointestinal function in a cohort of men and women with HIV infection. Am J Gastroenterol. (2000) 95:3482–9. doi: 10.1111/j.1572-0241.2000.03365.x
53. Poles MA, Fuerst M, McGowan I, Elliott J, Rezaei A, Mark D, et al. HIV-related diarrhea is multifactorial and fat malabsorption is commonly present, independent of HAART. Am J Gastroenterol. (2001) 96:1831–7. doi: 10.1111/j.1572-0241.2001.03879.x
54. Boettger S, Angersbach B, Klimek C, Wanderley A, Shaibekov A, Sieske L, et al. Prevalence and predictors of vitamin D-deficiency in frail older hospitalized patients. BMC Geriatr. (2018) 18:219. doi: 10.1186/s12877-018-0919-8
55. Brenchley J, Price D, Schacker T, Asher T, Silvestri G, Rao S, et al. Microbial translocation is a cause of systemic immune activation in chronic HIV infection. Nat Med. (2006) 12:1365–71. doi: 10.1038/nm1511
56. Marchetti G, Tincati C, Silvestri G. Microbial translocation in the pathogenesis of HIV infection and AIDS. Clin Microbiol Rev. (2013) 26:2–18. doi: 10.1128/CMR.00050-12
57. D'Amelio P. Vitamin D deficiency and risk of metabolic syndrome in aging men. World J Mens Health. (2021) 39:291–301. doi: 10.5534/wjmh.200189
Keywords: HIV, vitamin D deficiency, ART, prevalence, human inmunodeficiency virus
Citation: Wang Y, Huang X, Wu Y, Li A, Tian Y, Ren M, Li Z, Zhang T, Wu H and Wang W (2021) Increased Risk of Vitamin D Deficiency Among HIV-Infected Individuals: A Systematic Review and Meta-Analysis. Front. Nutr. 8:722032. doi: 10.3389/fnut.2021.722032
Received: 08 June 2021; Accepted: 26 July 2021;
Published: 18 August 2021.
Edited by:
Esther Molina-Montes, University of Granada, SpainReviewed by:
Amir Abdoli, Jahrom University of Medical Sciences, IranMohammad Javad Nasiri, Shahid Beheshti University of Medical Sciences, Iran
Copyright © 2021 Wang, Huang, Wu, Li, Tian, Ren, Li, Zhang, Wu and Wang. This is an open-access article distributed under the terms of the Creative Commons Attribution License (CC BY). The use, distribution or reproduction in other forums is permitted, provided the original author(s) and the copyright owner(s) are credited and that the original publication in this journal is cited, in accordance with accepted academic practice. No use, distribution or reproduction is permitted which does not comply with these terms.
*Correspondence: Wen Wang, wangwen2020@ccmu.edu.cn
†These authors have contributed equally to this work