Erratum: AMPA and GABAA receptor nanodomains assemble in the absence of synaptic neurotransmitter release
 Frontiers Production Office
- Frontiers Media SA, Lausanne, Switzerland
An Erratum on
AMPA and GABAA receptor nanodomains assemble in the absence of synaptic neurotransmitter release
by Ramsay, H. J., Gookin, S. E., Ramsey, A. M., Kareemo, D. J., Crosby, K. C., Stich, D. G., Olah, S. S., Actor-Engel, H. S., Smith, K. R., and Kennedy, M. J. (2023). Front. Mol. Neurosci. 16:1232795. doi: 10.3389/fnmol.2023.1232795
Due to a production error, there was a mistake in the legends for Figures 2–4 as published. The requested changes were missed during typesetting. The correct legends appear below.
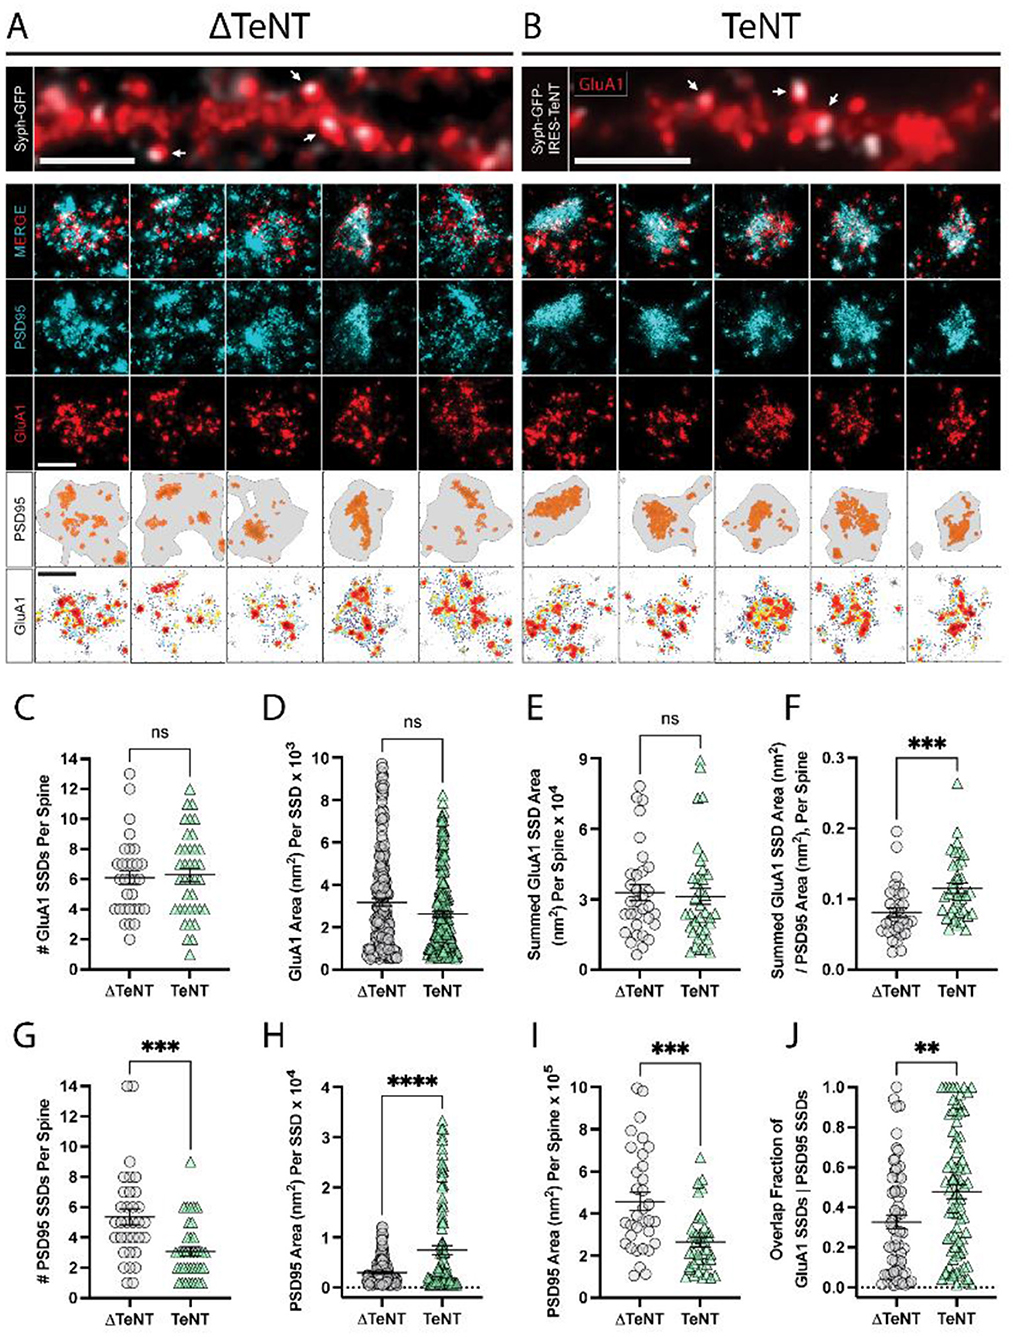
Figure 2. Formation of excitatory receptor and scaffold SSDs in the absence of neurotransmission. (A, B) Representative epifluorescence images of dendritic regions for cultures infected with control virus (ΔTeNT, A), or TeNT virus (TeNT, B) and stained for surface GluA1 (red) are shown (top panels) with syph-GFP, or syph-GFP-IRES-TeNT shown in greyscale. In both cases note the apposition of syph-GFP signal and GluA1-positive (red) dendritic spines (white arrows). Scale bar = 5 μm in each image. Representative dSTORM images of synapses contacted by ΔTeNT (A), or TeNT (B) terminals are shown below in rows 2–4. Row 5 shows the PSD boundary for each synapse, defined by a minimum PSD95 localization density (gray borders), with PSD95 localizations in defined SSDs rendered in orange. Row 6 shows GluA1 localization density maps for each synapse with warmer colors representing higher GluA1 localization density. Scale bars in rows 4 and 6 both = 500 nm. (C) There was no significant difference in the number of GluA1 SSDs per spine at TeNT-silenced synapses compared to controls [spines, n = 31 ΔTeNT/38 TeNT; ns, not significant; p = 0.7690 (T-Test)]. (D) The area of individual GluA1 SSDs was not significantly different at TeNT-silenced synapses compared to controls [SSDs, n = 194 ΔTeNT/200 TeNT; ns, not significant; p = 0.0531 (Mann–Whitney)]. (E) The summed GluA1 SSD area, per spine was not significantly different at TeNT-silenced synapses compared to controls [spines, n = 32 ΔTeNT/38 TeNT; ns, not significant; p = 0.5777 (Mann–Whitney)]. (F) The ratio between the summed GluA1 SSD area to its total PSD95 area was significantly increased at TeNT-contacted dendritic spines [spines, n = 33 ΔTeNT/37 TeNT; ***p < 0.001; p = 0.0007 (Mann–Whitney)]. (G) The number of PSD95 SSDs per spine was significantly decreased at TeNT-contacted spines compared to controls [spines, n = 33 ΔTeNT/38 TeNT; ***p < 0.001; p = 0.0002 (Mann–Whitney)]. (H) The area of individual PSD95 SSDs was significantly increased at TeNT-silenced spines compared to controls [SSDs, n = 141 ΔTeNT/103 TeNT; ****p < 0.0001 (Welch's T-Test)]. (I) The total PSD95 area per spine was significantly reduced at TeNT-contacted spines compared to controls [spines, n = 33 ΔTeNT/38 TeNT; ***p = 0.0001 (Mann–Whitney)]. (J) The degree of GluA1 SSD/PSD95 SSD overlap was significantly increased at TeNT-contacted spines compared to controls [SSDs, n = 61 ΔTeNT/81 TeNT; **p < 0.01; p = 0.0052 (Mann–Whitney)].

Figure 3. Trans-synaptic SSD alignment is intact at chronically silenced excitatory synapses. (A, B) Representative STED images of synapses labeled with RIM1 (cyan) and GluA1 (red) for (control, A) and (TeNT, B) conditions. Note the apposition of syph-GFP signal and GluA1-positive (red) dendritic spines (white arrows). Scale bar = 5 μm. Columns 1–5 in (A, B) display representative STED images of synapses for control (A), and TeNT (B) conditions; merged RIM1 (cyan), and GluA1 (red) (row 2); RIM1 (cyan) (row 3); GluA1 (red) (row 4). Scale bar = 500 nm. (C) The number of RIM1 SSDs per synaptic terminal was significantly increased at TeNT-expressing terminals compared to controls [terminals, n = 38 control/49 TeNT; *p < 0.05 (Mann–Whitney)]. (D) RIM1 fluorescence intensity quantified at individual SSDs was decreased at TeNT-silenced terminals compared to controls [SSDs, n = 104 control/346 TeNT; ****p < 0.0001 (Mann–Whitney)]. (E) The area of individual RIM1 SSDs was decreased at TeNT-silenced terminals compared to controls [SSDs, n = 81 control/281 TeNT; **p < 0.01 (Welch's T-Test)]. (F) The summed RIM1 SSD area per terminal was not significantly different at TeNT-silenced terminals compared to controls [terminals, n = 38 control/48 TeNT; ns, not significant; p = 0.7050 (Mann–Whitney)]. (G) The number of GluA1 SSDs per spine was not significantly different at TeNT-silenced spines compared to controls [spines, n = 38 control/49 TeNT; ns, not significant; p = 0.0539 (Mann–Whitney)]. (H) The fluorescence intensity of individual GluA1 SSDs was not significantly different at TeNT-silenced spines compared to controls [SSDs, n = 218 control/372 TeNT; ns, not significant; p = 0.0959 (Mann–Whitney)]. (I) The mean area of individual GluA1 SSDs was not significantly different at TeNT-silenced spines compared to controls [SSDs, n = 187 control/339 TeNT; ns, not significant; p = 0.2098 (Mann–Whitney)]. (J) The summed GluA1 SSD area per spine was not significantly different at TeNT-silenced spines compared to controls [spines, n = 35 control/49 TeNT; ns, not significant; p = 0.1120 (Welch's T-Test)]. (K) Schematic showing the fraction of GluA1/RIM1 SSD overlap (left). GluA1 SSD overlap with RIM1 SSDs was slightly elevated at TeNT-associated synapses (i.e., on average, a larger area of each GluA1 SSD at TeNT-associated synapses was overlapped by closely-associated RIM1 SSDs) [SSDs, n = 155 Control/268 TeNT; *p < 0.05; p = 0.0372 (Mann–Whitney)].
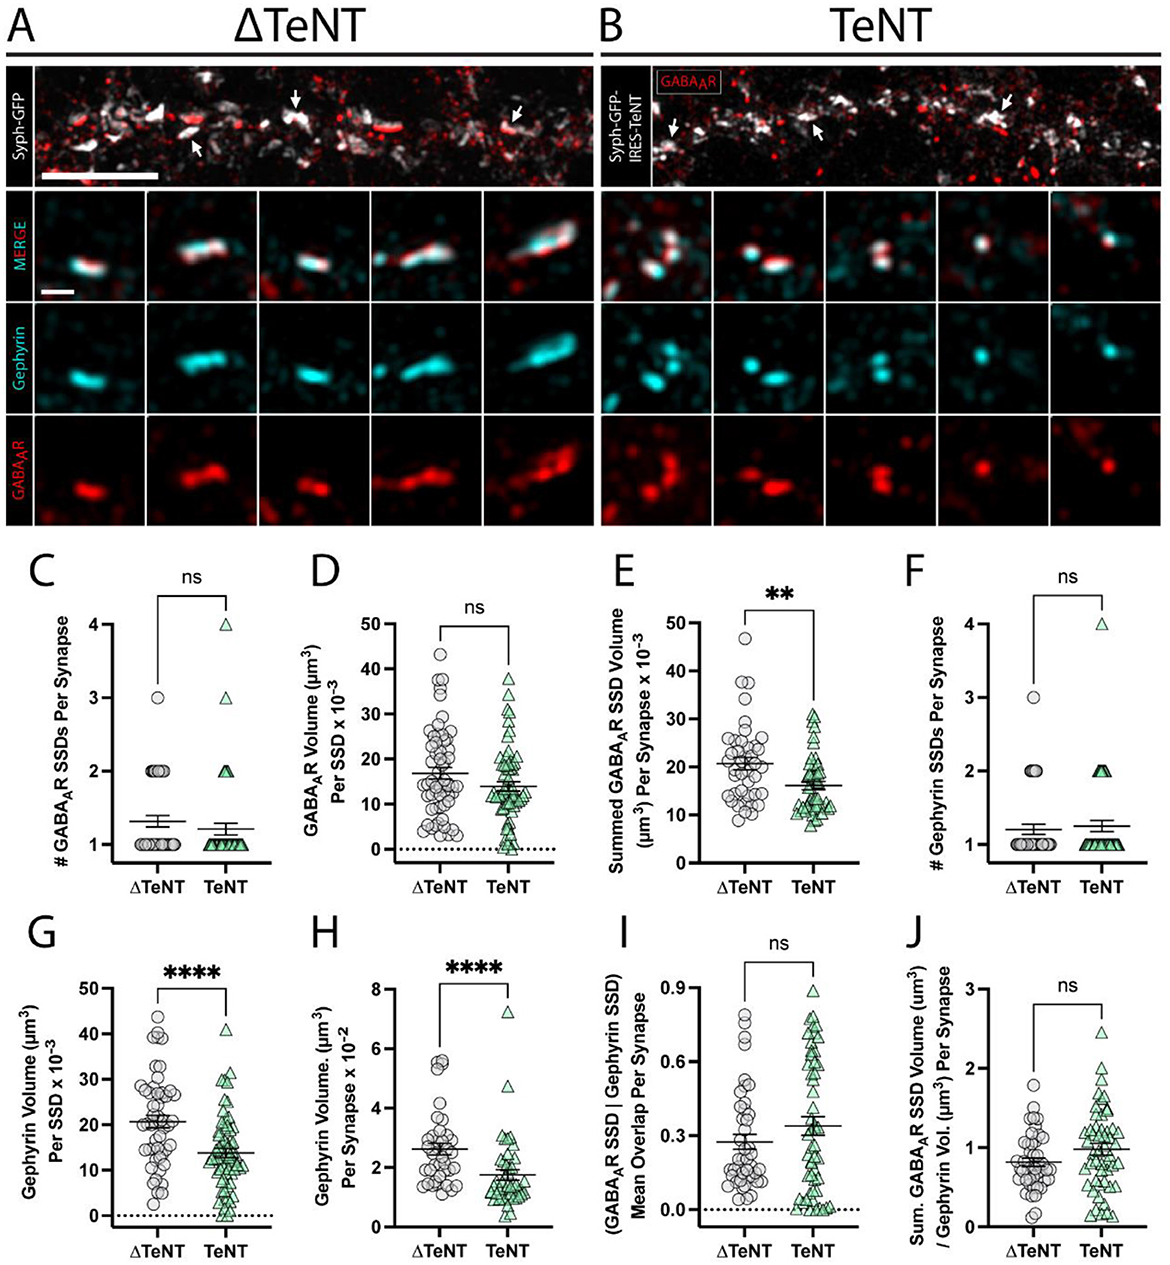
Figure 4. Formation of inhibitory receptor and scaffold SSDs in the absence of neurotransmission. (A, B) Representative SIM images of dendritic regions from (ΔTeNT, A) or (TeNT, B), cultures displaying syph-GFP, or syph-GFP-IRES-TeNT (greyscale), and GABAAR (red). Note the apposition of syph-GFP signal and GABAAR-positive (red) synapses (white arrows). Scale bar = 5 μm. Columns 1–5 display representative synapses for ΔTeNT (A), and TeNT (B) conditions; merged gephyrin (cyan), and GABAAR (red) (row 2); gephyrin (cyan) (row 3); and GABAAR (red) (row 4). Scale bar = 500 nm. (C) The number of GABAAR SSDs per synapse was not significantly different at TeNT-silenced synapses compared to controls [synapses, n = 44 ΔTeNT/52 TeNT; ns, not significant; p = 0.1340 (Mann–Whitney)]. (D) The volume of individual GABAAR SSDs was not significantly different at TeNT-silenced synapses compared to controls [SSDs, n = 57 ΔTeNT/63 TeNT; ns, not significant; p = 0.0739 (Mann–Whitney)]. (E) The summed synaptic volume of GABAAR SSDs per synapse was significantly decreased at TeNT-silenced spines compared to controls [synapses, n = 41 ΔTeNT/50 TeNT; **p < 0.01; p = 0.0020 (Mann–Whitney)]. (F) The number of gephyrin SSDs per synapse was not significantly different at TeNT-silenced synapses compared to controls [synapses, n = 44 ΔTeNT/52 TeNT; ns, not significant; p = 0.7200 (Mann–Whitney)]. (G) The volume of individual gephyrin SSDs was significantly reduced at TeNT-silenced synapses compared to controls [SSDs, n = 52 ΔTeNT/64 TeNT; ****p < 0.0001 (T-Test)]. (H) The total gephyrin volume per synapse was significantly decreased at TeNT-silenced synapses compared to controls [synapses, n = 38 ΔTeNT/44 TeNT; ****p < 0.0001 (Mann–Whitney)]. (I) There was no significant difference in the mean overlap between GABAAR SSDs and gephyrin SSD signals at TeNT-silenced synapses compared to controls [SSDs, n = 43 ΔTeNT/52 TeNT; ns, not significant; p = 0.5039 (Mann–Whitney)]. (J) The ratio between the summed synaptic volume of GABAAR SSDs, and the total gephyrin volume, per synapse was not significantly different at TeNT-silenced synapses compared to controls [synapses, n = 44 ΔTeNT/51 TeNT; ns, not significant; p = 0.0795 (T-Test)].
The publisher apologizes for this mistake. The original article has been updated.
Keywords: Synapse, neurotransmitter release, postsynaptic neurotransmitter receptors, AMPA receptor, GABA receptor, excitatory, inhibitory, nanodomain
Citation: Frontiers Production Office (2023) Erratum: AMPA and GABAA receptor nanodomains assemble in the absence of synaptic neurotransmitter release. Front. Mol. Neurosci. 16:1281653. doi: 10.3389/fnmol.2023.1281653
Received: 22 August 2023; Accepted: 22 August 2023;
Published: 01 September 2023.
Approved by:
Frontiers Editorial Office, Frontiers Media SA, SwitzerlandCopyright © 2023 Frontiers Production Office. This is an open-access article distributed under the terms of the Creative Commons Attribution License (CC BY). The use, distribution or reproduction in other forums is permitted, provided the original author(s) and the copyright owner(s) are credited and that the original publication in this journal is cited, in accordance with accepted academic practice. No use, distribution or reproduction is permitted which does not comply with these terms.
*Correspondence: Frontiers Production Office, production.office@frontiersin.org