Single-cell RNA sequencing reveals distinct transcriptional features of the purinergic signaling in mouse trigeminal ganglion
 Shilin Jia1,2†
  Qing Liu
 Wenguo Fan
- 1Hospital of Stomatology, Guanghua School of Stomatology, Sun Yat-sen University, Guangzhou, China
- 2Guangdong Provincial Key Laboratory of Stomatology, Guangzhou, China
- 3Paediatric Dentistry and Orthodontics, Faculty of Dentistry, The University of Hong Kong, Hong Kong, Hong Kong SAR, China
Trigeminal ganglion (TG) is the first station of sensory pathways in the orofacial region. The TG neurons communicate with satellite glial cells (SGCs), macrophages and other cells forming a functional unit that is responsible for processing of orofacial sensory information. Purinergic signaling, one of the most widespread autocrine and paracrine pathways, plays a crucial role in intercellular communication. The multidirectional action of purinergic signaling in different cell types contributes to the neuromodulation and orofacial sensation. To fully understand the purinergic signaling in these processes, it is essential to determine the shared and unique expression patterns of genes associated with purinergic signaling in different cell types. Here, we performed single-cell RNA sequencing of 22,969 cells isolated from normal mouse TGs. We identified 18 distinct cell populations, including 6 neuron subpopulations, 3 glial subpopulations, 7 immune cell subpopulations, fibroblasts, and endothelial cells. We also revealed the transcriptional features of genes associated with purinergic signaling, including purinergic receptors, extracellular adenosine triphosphate (eATP) release channels, eATP metabolism-associated enzymes, and eATP transporters in each cell type. Our results have important implications for understanding and predicting the cell type-specific roles of the purinergic signaling in orofacial signal processing in the trigeminal primary sensory system.
Introduction
The somatosensory system processes mechanical, thermal, and chemical information about the internal physiological state and the environment to provide organisms “feel” touch, temperature, pain, itch, and more (Dubin and Patapoutian, 2010; Wu et al., 2017; Dong and Dong, 2018; Yin and Lee, 2020). The sensory neurons of the trigeminal ganglion (TG, a cranial analog of the dorsal root ganglia, DRG) are the primary somatosensory receptors, innervating the orofacial region, and conveying signals to the central nervous system (Messlinger and Russo, 2019; Delmas and Coste, 2020). A variety of neurotransmitters and mediators associated with nociception are present in neurons and non-neuronal cells, such as satellite glial cells (SGCs), Schwann cells (SCs) and macrophages in the peripheral nervous system (PNS), through which crosstalk between these cells plays a vital role in the etiology and pathogenesis of pain (Goto et al., 2017; Wang et al., 2018; Messlinger et al., 2020; Iwai et al., 2021).
Purinergic signaling is one of the most critical autocrine/paracrine signaling pathways involved in intercellular communication. It is a versatile system that includes extracellular adenosine triphosphate (eATP), purinergic receptors, eATP transport pathways, and eATP metabolism-associated enzymes (Antonioli et al., 2019). It is now recognized that the purinergic signaling acts as a modulatory system in the peripheral somatosensory system and is involved in the regulation of orofacial pain (Shinoda et al., 2007; Murasaki et al., 2013; Lin et al., 2019). However, the expression of the components associated with purinergic signaling in each cell type of TG has not yet been characterized in detail.
Single-cell RNA sequencing (scRNA-seq) has emerged as a powerful tool for cell-type heterogeneity identification and cell type-specific gene expression analysis (Kolodziejczyk et al., 2015). Here, we aimed to identify distinct cellular populations in TG and describe the transcriptional features of the genes associated with the purinergic signaling in each cell type. We provided a comprehensive transcriptomic atlas of the purinergic signaling in TG. Our findings contribute to the understanding of the purinergic signaling mechanism of neuromodulation and neurotransmission.
Materials and methods
Animals
Male C57BL/6 mice weighing 20–25 g (5–8 weeks) were housed in cages under standard conditions (12-h light/dark cycle) with access to food and water ad libitum. All experimental procedures were performed in accordance with relevant guidelines established by the Animal Care Committee for the Care and Use of Laboratory Animals of Sun Yat-sen University (Guangzhou, Guangdong Province, China; Ethical clearance No. SYSU-IACUC-2020-000245).
Preparation of single-cell suspension from trigeminal ganglion
Five mice were euthanized by 4% isoflurane inhalation and decapitation. Bilateral TGs were carefully harvested (n = 10) and then were quickly chopped into small pieces and dissociated using a papain dissociation system (Worthington, Lakewood, NJ, USA, 20 units/ml papain, 0.005% DNase) according to the manufacturer’s instructions. The mixture was incubated at a 37°C water bath for 1 h with constant agitation, and then the cloudy suspension was collected and centrifuged at 300 g for 5 min at room temperature. The supernatant was discarded, and the cell pellets were resuspended in a DNase/papain-inhibitor solution (2.7 ml EBSS, 300 μl papain-inhibitor and 150 μl DNase). The obtained cell suspension was purified by discontinuous density gradient centrifugation (70 g for 6 min), and then the cell pellets were resuspended in DMEM to obtain a single-cell suspension. All solutions were equilibrated with 95% O2 and 5% CO2 throughout the procedure.
RNA library construction and sequencing
scRNA-seq libraries were constructed using the BD Rhapsody™ Single-Cell Analysis System according to the manufacturer’s instructions. Briefly, single cells were captured and lysed with barcoded beads on an array of microwells. The mRNA was enriched by the oligo(dT) beads in the microwell and each mRNA molecule was tagged with a unique molecular identifier (UMI) and cell label (Birey et al., 2017). After reverse transcription of the tagged mRNA and amplification, the cDNA libraries were constructed. Libraries were sequenced on the Illumina NovaSeq platform. The sequencing data (FASTQ file) were processed by the BD Rhapsody analysis pipeline on Seven Bridges1 to obtain the gene expression matrix (ST file). Sequence data were submitted to the Gene Expression Omnibus (GEO) database (GSE213105).
Preprocessing of gene expression matrix
Data preprocessing was performed using Seurat R package v4.0.2. As quality controls, cells with more than 15% mitochondrial gene proportion, less than 300 detected genes, or less than 500 UMIs were discarded. The filtered count matrix was normalized with a scale factor of 10,000 and subsequently natural-log transformed using Seurat’s NormalizeData function. The normalized count matrix was further scaled with Seurat’s ScaleData function.
Data integration
To ensure our results are reliable, the same analysis pipeline was performed in another TG sample (n = 6) derived from the GEO database (GSE186421).2 Integration of the two datasets was performed using canonical correlation analysis (CCA) algorithm (Stuart et al., 2019). The integrated matrix was processed as described above for subsequent analysis.
Dimensionality reduction and clustering analysis
The top 3,000 highly variable genes were identified using Seurat’s FindVariableFeatures function, and Principal component (PC) analysis was subsequently performed using Seurat’s RunPCA function. Then, the standard deviations of the PCs were visualized by the ElbowPlot function, and the top 20 PCs were selected according to elbow position for non-linear dimensionality reduction and visualization (Uniform Manifold Approximation and Projection, UMAP). Unsupervised identification of clusters was performed using the FindClusters function (an algorithm based on Shared Nearest Neighbor construction and modularity optimization).
Cell type annotation
Cell types were manually annotated based on marker genes of each cluster, and the manual annotations were verified by automated cell annotation using SingleR R package v1.4.1. Cluster-specific marker genes were identified using the FindAllMarkers function with parameters: logfc.threshold = 1.5 and min.pct = 0.6. Gene symbols and corresponding protein names can be found in Supplementary Table 1. The reference databases used for manual annotation were obtained from CellMarker3 and PanglaoDB4 (Franzén et al., 2019; Zhang et al., 2019). The MouseRNAseqData database was utilized for automated annotation using celldex R package v1.0.0.
Differential gene expression analysis
Differential gene expression analysis among distinct cell populations was performed using the FindMarkers function with parameters: logfc.threshold = 0.2 and min.pct = 0.05. Genes with a p-value less than 0.001 and log2 fold change(log2FC)more than 0.5 were considered significantly differentially expressed. log2FC was calculated through the following formula: log2FC = log2(Average expression value.1 + 1)-log2(Average expression value.2 + 1). Average expression value.1 refers to the average expression of a gene in the indicated cell groups, and Average expression value.2 refers to the average expression of this gene in another or more cell groups, which is usually set as all cells except the indicated cell population.
Statistical analysis
Statistical analyses were performed using the FindMarkers or FindAllMarkers function of the Seurat R package. The significance of differential gene expression was assessed using the Wilcoxon Rank Sum test. Statistical significance was defined as a P-value less than 0.01.
Results
Single-cell transcriptomics reveal cell-type heterogeneity in trigeminal ganglion
To assess the cellular heterogeneity in TG, we prepared single cell suspensions of mouse TG and performed scRNA-seq. A total of 22,969 cells from two independent samples were sequenced. Following quality control (see section “Materials and methods”), a total of 16,294 cells were obtained and used for subsequent analyses. To identify cell clusters, we performed non-linear dimensionality reduction and unsupervised cell clustering using the Seurat R package. 17 distinct clusters (C1–17) were identified and visualized on a UMAP plot (Figure 1A). Then, these clusters were classified into 5 major cell types based on the expression of known marker genes, including neurons (Tubb3 and Rbfox3), glial cells (Plp1), immune cells (Ptprc), fibroblasts (Dcn and Col1a1), and endothelial cells (Flt1 and Pecam1) (Figures 1A,C). Among these cell types, the proportion of glial cells was the highest, followed by neurons and fibroblasts, and the proportions of each cell type were similar across the two samples (Figure 1B).
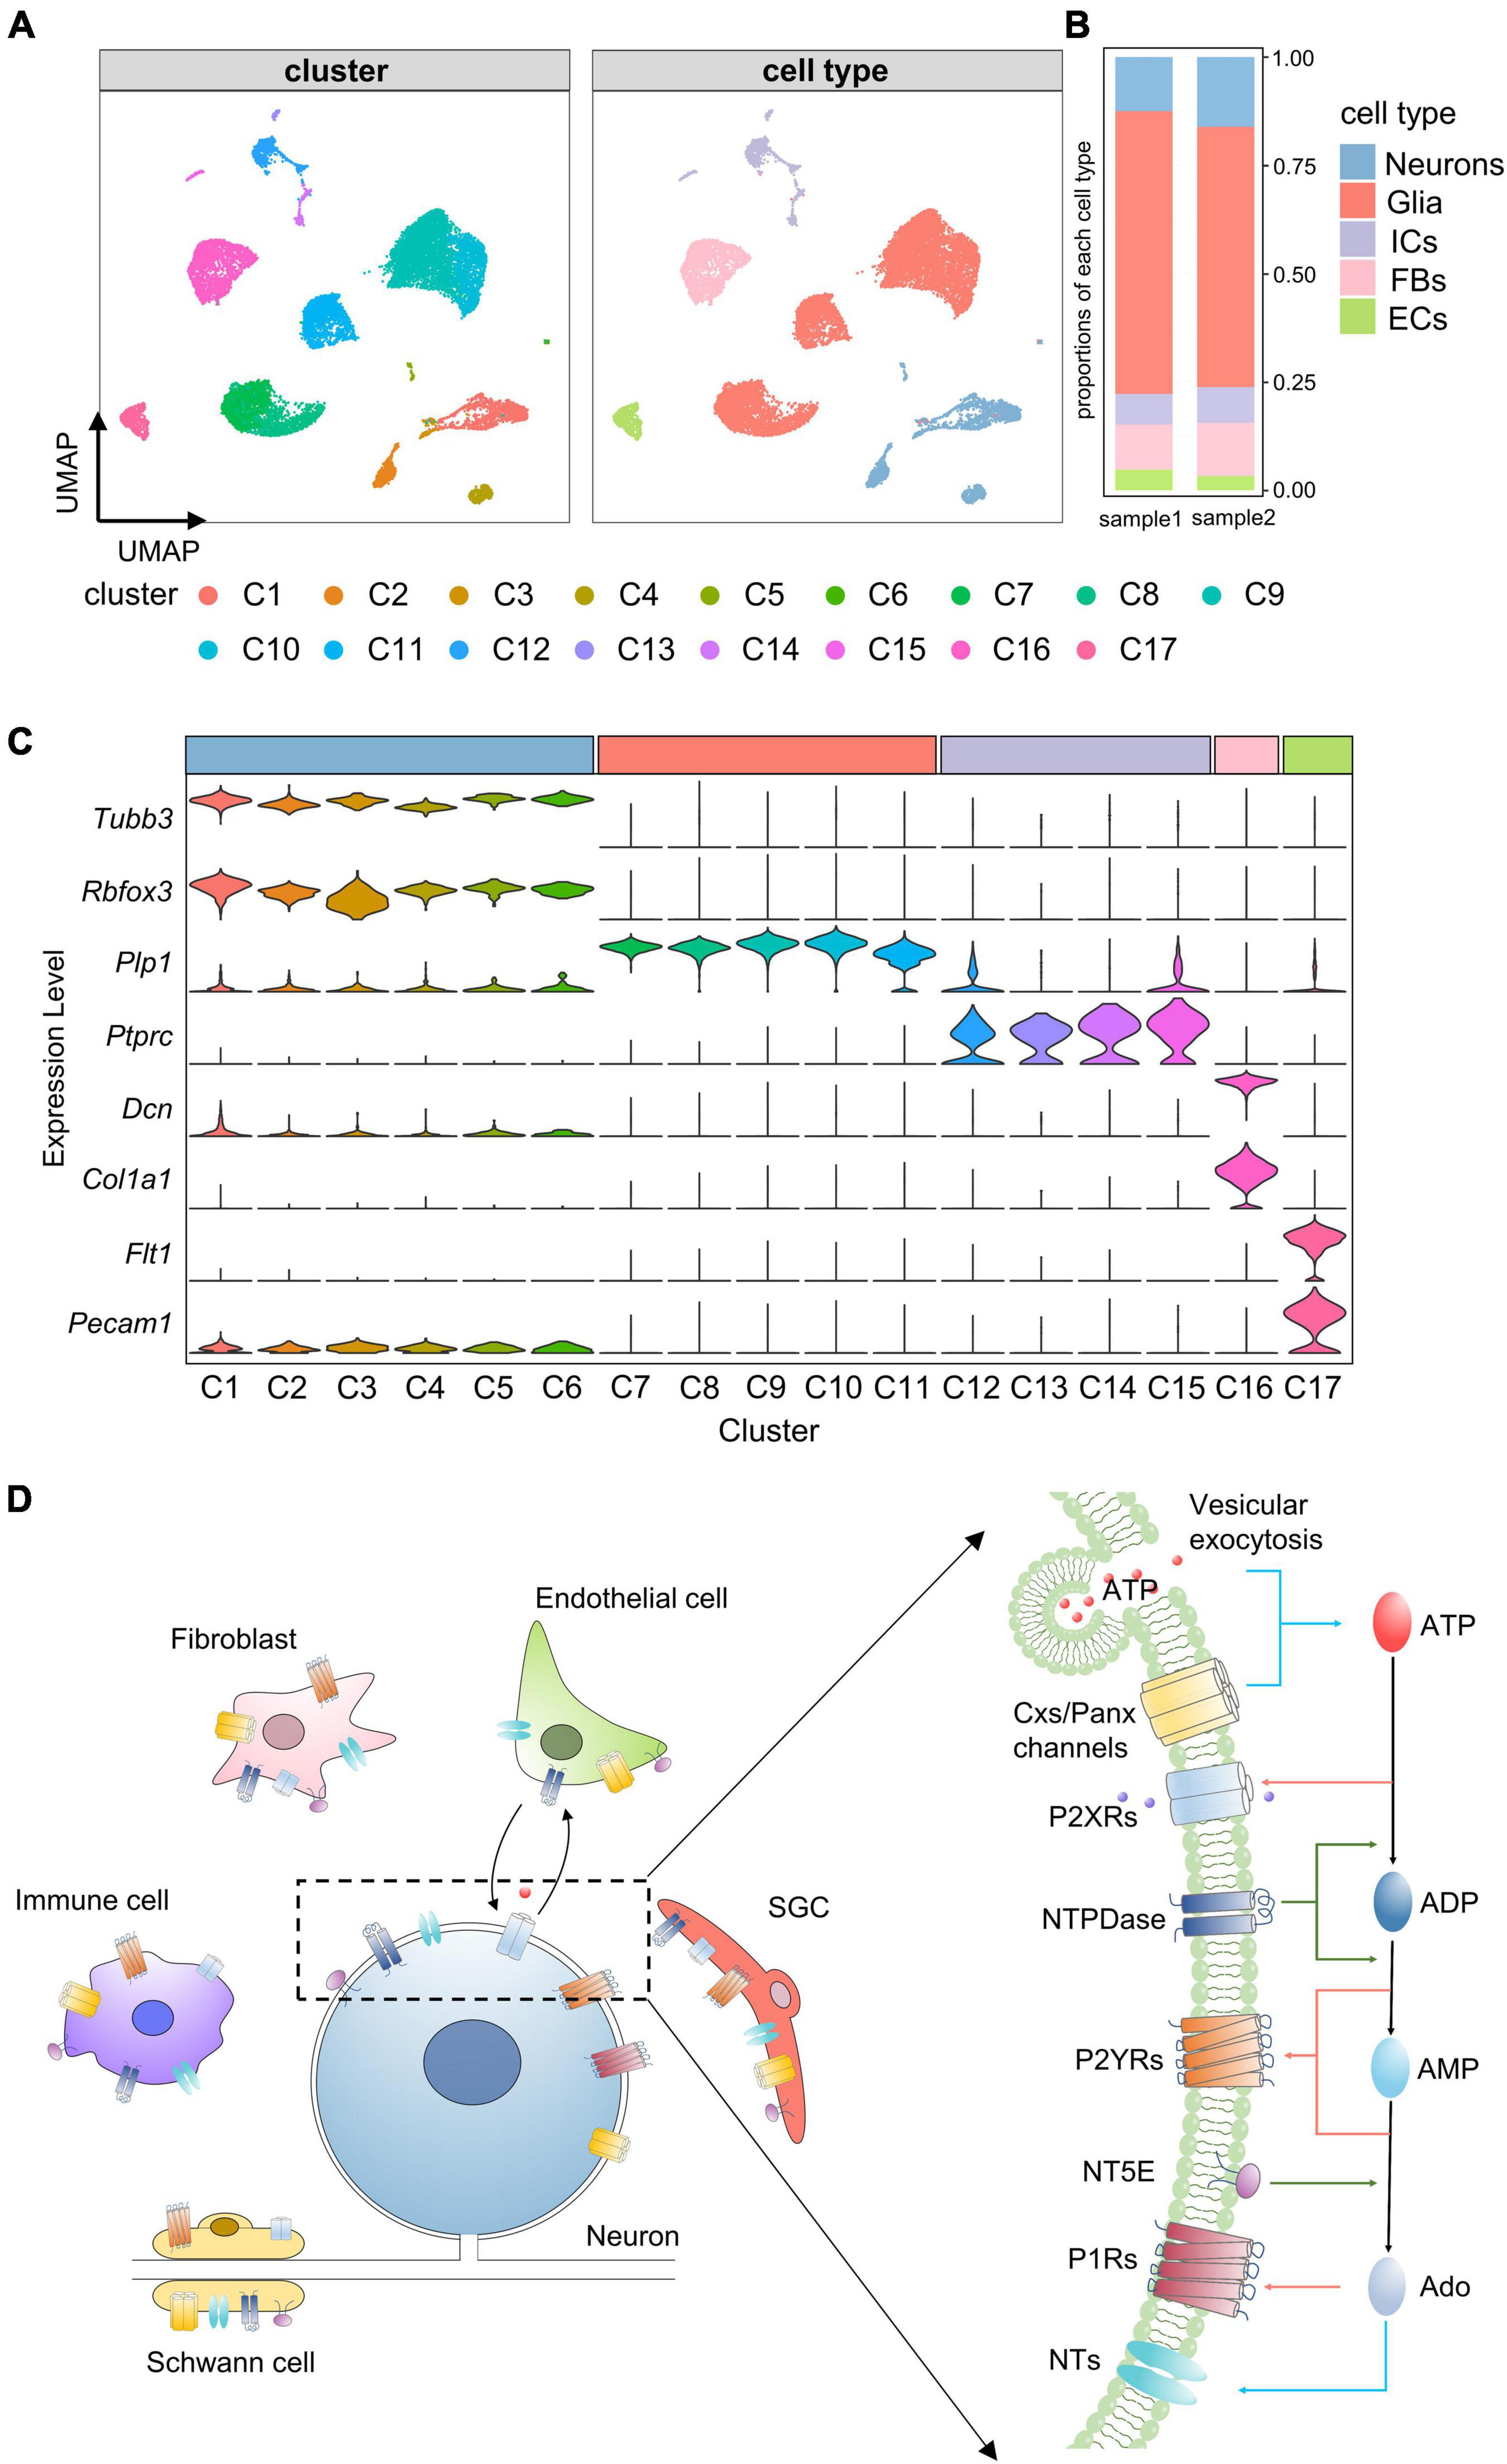
Figure 1. Identification of cell clusters and cell types in TG. (A) UMAP projection of cell clusters and cell types. Unsupervised cell clustering and cell type annotation identify 17 distinct cell clusters (C1–C17) and 5 cell types, including neurons, glial cells, immune cells, fibroblasts and endothelial cells. Each dot represents one cell; Each color represents one cluster or one cell type. (B) Bar plot showing proportions of each cell type in each TG sample. (C) Stacked violin plot showing the distribution of known marker genes (e.g., neuronal marker genes: Tubb3 and Rbfox3) in each cluster. The width of the violin plots represents density distributions, the height represents gene expression levels [normalized (counts)], and each color represents one cluster. C1–C6 were identified as neurons by high expression of Tubb3 and Rbfox3, C7–C11 were identified as glial cells by Plp1, C12-C15 were identified as immune cells by Ptprc, C16 was identified as fibroblasts by Dcn and Col1a1, C17 was identified as endothelial cells by Flt1 and Pecam1. (D) Schematic illustration of purinergic signaling in TG. Extracellular ATP is released from TG cells via vesicular exocytosis and Cxs/Panx channels; ATP-activated P2XRs mediate non-selective cation influx; ATP-metabolism associated ecto-enzymes, such as NTPDase and NT5E, hydrolyze ATP to ADP, AMP and Ado; Both ADP and AMP activate P2YRs, and Ado activates P1Rs; In addition, NTs mediate the bidirectional diffusion of Ado between the cytoplasm and extracellular environment. UMAP, Uniform Manifold Approximation and Projection; Neu, neurons; Glia, glial cells; ICs, immune cells; FBs, fibroblasts; ECs, endothelial cells; ATP, adenosine triphosphate; P2XRs, P2X receptors; NTPDase, ectonucleoside triphosphate diphosphohydrolase; NT5E, Ecto-5’-nucleotidase; ADP, adenosine diphosphate; AMP, adenosine monophosphate; Ado, adenosine; P2YRs, P2Y receptors; P1Rs, P1 receptors; NTs, nucleoside transporters. SGC, Satellite glial cells.
To describe the transcriptional features of the purinergic signaling in each cell type, we categorized genes associated with the purinergic signaling into four parts: genes encoding purinergic receptors, eATP release channels, eATP metabolism-associated enzymes, and ATP/adenosine transporters (Figure 1D). Gene symbols and corresponding protein names are shown in Supplementary Table 2. Expression rates [percentage of cells with positive expression (pos_pct)] and average expression levels (avg_exp) of these genes in different cell types were analyzed.
Purinergic receptors
Among genes encoding ATP-gated P2X cation channels, five P2rx genes were expressed in more than 5% of neurons, including P2rx2-P2rx6 (Figure 2A). Among these, P2rx4 was the most widely expressed in the neurons (pos_pct = 64.2%), followed by P2rx3 (pos_pct = 38.4%). Compared with the neurons, non-neuronal cells expressed relatively few P2rx family members. Glial cells positively expressed only P2rx7 (pos_pct = 12.4%), while immune cells positively expressed P2rx4 (pos_pct = 10.5%) and P2rx7 (pos_pct = 13.3%). However, less than 5% of fibroblasts and endothelial cells expressed P2rx genes (Figure 2A). Moreover, differential gene expression analysis among the 5 cell types revealed that P2rx7 was expressed significantly higher in glial cells (log2FC > 0.5 and P < 0.01; Figure 2F). Among genes encoding P2Y receptors, P2ry1 and P2ry2 were positively expressed in the neurons, P2ry12 in glial cells, P2ry6, P2ry10, P2ry10b, P2ry12, and P2ry13 in immune cells, and P2ry1 and P2ry14 in fibroblasts (pos_pct > 5%; Figure 2A). Moreover, P2ry1 was expressed significantly greater in neurons and fibroblasts. Five P2ry genes including P2ry6, P2ry10, P2ry10b, P2ry12, and P2ry13 were expressed more highly in immune cells than the other cells (log2FC > 0.5 and P < 0.01; Figures 2A,F).
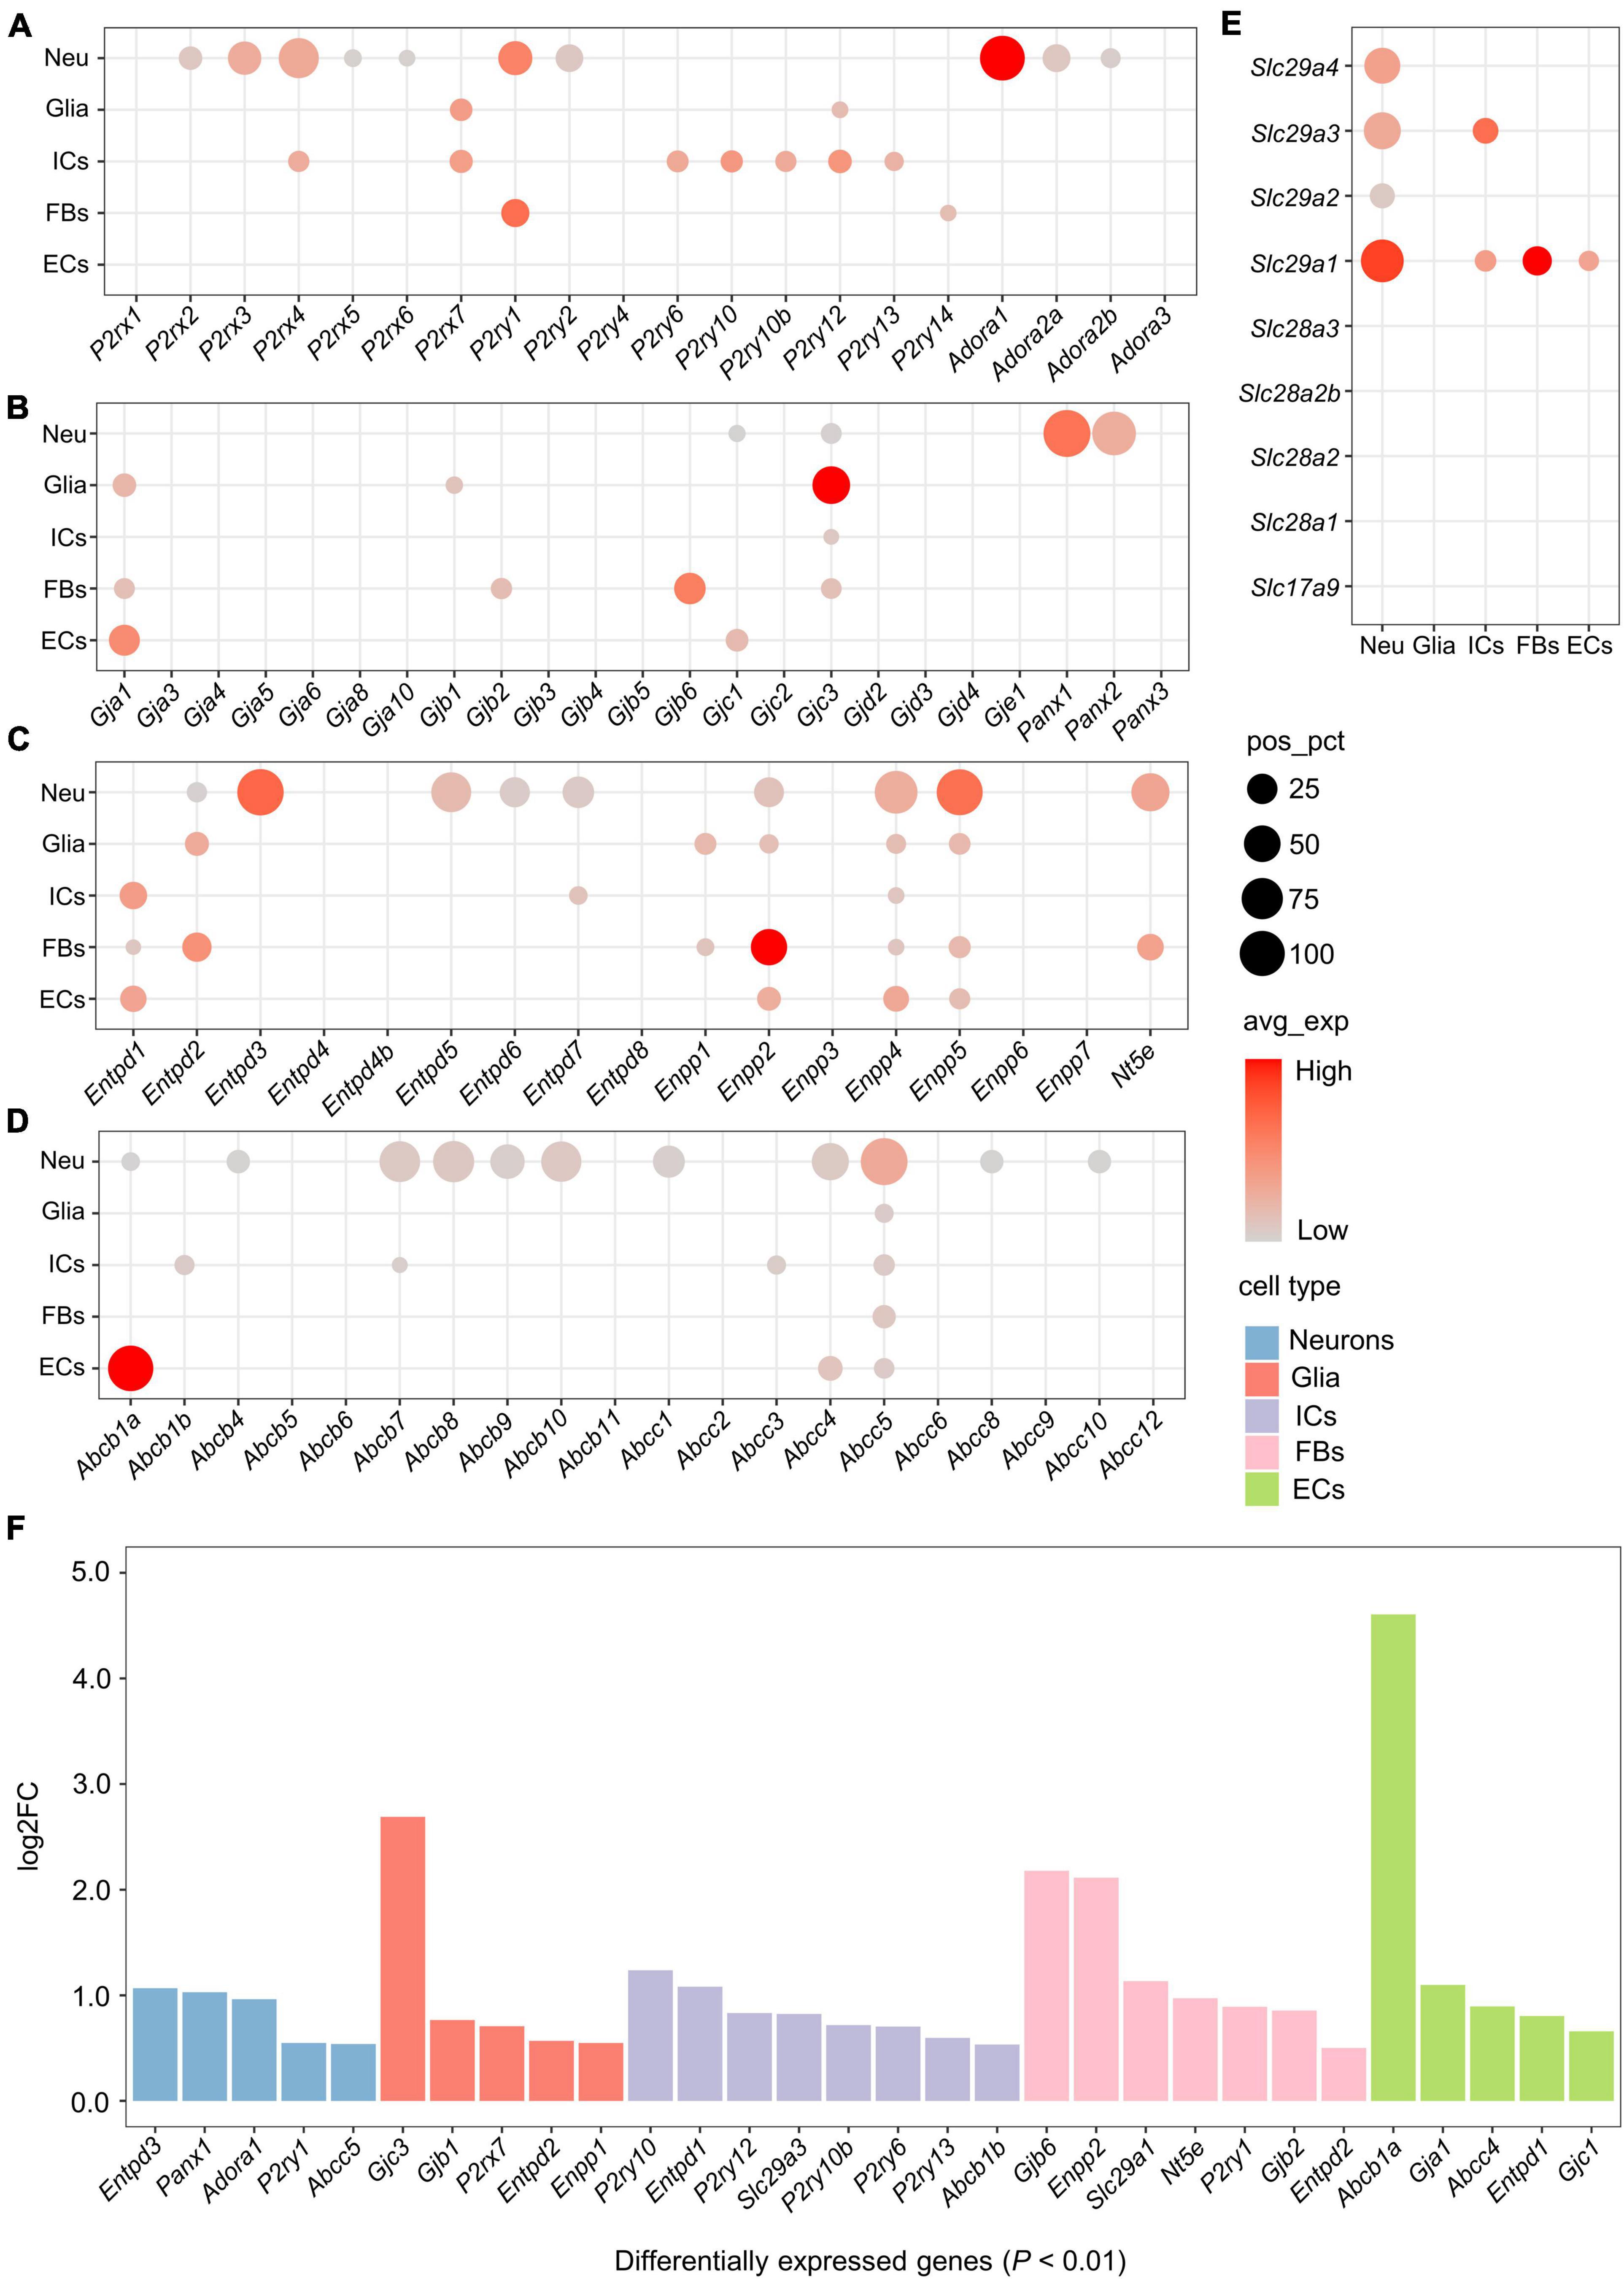
Figure 2. Expression of genes associated with purinergic signaling in distinct cell types. (A–E) Bubble plot showing expression of genes encoding purinergic receptors, ATP release channels, ATP metabolism-associated enzymes or ATP/adenosine transporters in the 5 cell types. Bubble size represents the percentage of cells with positive expression (pos_pct), and bubble color represents average normalized expression levels (avg_exp). (Bubbles with pos_pct < 5% are not shown). (F) Bar plot showing significant differences in the expression of genes associated with purinergic signaling among 5 cell types (Wilcoxon Rank Sum test; P < 0.01 was considered statistically significant). The bars are color-coded by cell types, and the bar height represents log2 fold change (log2FC). Genes with log2FC > 0.5 and P < 0.01 are considered to have significantly higher expression.
The neuronal population showed positive expression of genes encoding adenosine receptors (P1 receptors), including Adora1, Adora2a and Adora2b (Figure 2A). Among these, Adora1 was the most widely expressed (pos_pct = 86.8%), followed by Adora2a (pos_pct = 22.9%) and Adora2b (pos_pct = 8.9%). Expression of Adora3 was only detected in a small number of immune cells (pos_pct = 1.87%) and neurons (pos_pct = 0.21%).
Cxs and Panx channels
Both connexin hemichannels (Cxs) and Panx channels (Panxs) are transmembrane proteins, mediating the release of small signaling molecules such as ATP via their central pores (Taruno, 2018). Among genes encoding Cxs, Gjc3 was positively expressed in all the cell types except endothelial cells, Gja1 was positively expressed in glial cells, fibroblasts and endothelial cells, and Gjc1 was positively expressed in neurons and endothelial cells (pos_pct > 5%; Figure 2B). In addition, glial cells expressed Gjb1 positively, and fibroblasts expressed Gjb2 and Gjb6 positively. Differential gene expression analysis showed that Gjb1 and Gjc3 had significantly higher expression in glial cells, Gjb2 and Gjb6 in fibroblasts, and Gja1 and Gjc1 in endothelial cells (log2FC > 0.5 and P < 0.01; Figure 2F).
Panxs-encoding genes were exclusively expressed in neurons. Panx1 was expressed in almost all neurons (pos_pct = 97.8%), Panx2 was expressed in more than 80% of the neurons, whereas Panx3 expressed less than 5% (Figure 2B). No positive expression of Panx family members was found in non-neuronal cells.
Extracellular adenosine triphosphate metabolism-associated enzymes
eATP metabolism-associated enzymes include ectonucleoside triphosphate diphosphohydrolase (E-NTPDase, encoded by Entpd), ectonucleotide pyrophosphatase/phosphodiesterase (ENPP, encoded by Enpp) and Ecto-5’-nucleotidase (NT5E, encoded by Nt5e) (Yegutkin, 2014).
Five Entpd genes including Entpd2, 3, 5, 6, and Entpd7 were positively expressed in neurons (pos_pct > 5%), of which Entpd3 and Entpd5 were expressed in more than 50% of the neurons (pos_pct = 94.9% and 63.3%, respectively; Figure 2C). Entpd1 was mainly expressed in non-neuronal cells, including immune cells, fibroblasts and endothelial cells. In addition, glial cells and fibroblasts expressed Entpd2 positively, and immune cells expressed Entpd7 positively. Moreover, differential gene expression analysis revealed that Entpd3 was expressed significantly higher in neurons, Entpd2 in glial cells and fibroblasts, Entpd1 in immune cells and endothelial cells (log2FC > 0.5 and P < 0.01; Figure 2F).
Among genes encoding ENPP, Enpp4 was positively expressed in all cell types (pos_pct > 5%), Enpp2 and Enpp5 were expressed in all cell types except immune cells, and Enpp1 was expressed in glial cells and fibroblasts (Figure 2C). Both Enpp4 and Enpp5 were widely expressed in the neurons (pos_pct = 76.4% and 92.8%, respectively). Differential gene expression analysis showed that Enpp1 had significantly higher expression in glial cells, and Enpp2 in fibroblasts (log2FC > 0.5 and P < 0.01; Figure 2F). We also found that Nt5e was positively expressed in 56.0% of neurons and 20.0% of fibroblasts, whereas no positive expression of Nt5e was detected in glial cells, immune cells or endothelial cells.
Adenosine triphosphate and adenosine transporters
ATP Binding Cassette transporters (ABCTs), including multidrug resistance protein (MDR, encoded by Abcb) and cystic fibrosis transmembrane conductance regulator (CFTR, encoded by Abcc), contribute to eATP release (Abraham et al., 1993; Reigada and Mitchell, 2005). Eleven ABCT-encoding genes were found to be positively expressed in neurons (pos_pct > 5%), of which Abcb7, Abcb8, Abcb10, Abcc4, and Abcc5 were expressed in more than 50% of the neurons (Figure 2D). Among non-neuronal cells, all cell types expressed Abcc5 positively (pos_pct > 5%). Immune cells expressed Abcb1b, Abcb7, and Abcc3 positively, and endothelial cell expressed Abcb1a and Abcc4 positively. Differential gene expression analysis revealed that Abcc5 was significantly higher expressed in neurons, Abcb1b in immune cells, and Abcb1a in endothelial cells (log2FC > 0.5 and P < 0.01; Figure 2F).
Nucleoside transporters (NTs), including equilibrative NTs (ENTs, encoded by Slc29a) and concentrative NTs (CNTs, encoded by Slc28a), mediate the bidirectional diffusion of adenosine between the cytoplasm and extracellular environment (Kong et al., 2004). All Slc29a genes were positively expressed in neurons (pos_pct > 5%), of which Slc29a1 was the most widely expressed (pos_pct = 76.9%), followed by Slc29a3 (51.7%; Figure 2E). Among non-neuronal cells, immune cells expressed Slc29a1 and Slc29a3 positively, fibroblasts and endothelial cells expressed Slc29a1 only, whereas no positively expression of these genes was detected in glial cells. Moreover, differential gene expression analysis showed that Slc29a1 was significantly higher expressed in fibroblasts, and Slc29a3 in immune cells (log2FC > 0.5 and P < 0.01; Figure 2F).
Vesicular nucleotide transporter (VNUT, encoded by Slc17a9) is responsible for the vesicular storage of ATP by membrane potential-dependent active transport (Sawada et al., 2008). However, no positive expression of Slc17a9 (encoding VNUT) or Slc28a (encoding CNTs) was found in any of these cell types (pos_pct < 5%; Figure 2E).
Expression of genes associated with purinergic signaling in neuronal subpopulations
To further subdivide the neuronal population (C1-6), differentially expressed genes (DEGs) for each neuronal cluster were identified using the Seurat FindAllMarkers function. Six neuronal subpopulations were identified based on the representative DEGs, including peptidergic neurons (PEP; High expression of Calca/Tac1), non-peptidergic neurons (NP; Mrgprd), large-diameter myelinated neurons (NF; Nefh), low threshold mechanoreceptive unmyelinated neurons (LTMR, Piezo2/Th), and pruriceptive (itch-sensing) subpopulations, PRU1 (Mrgpra3) and PRU2 (Nppb/Nts/Sst; Figures 3A–C).
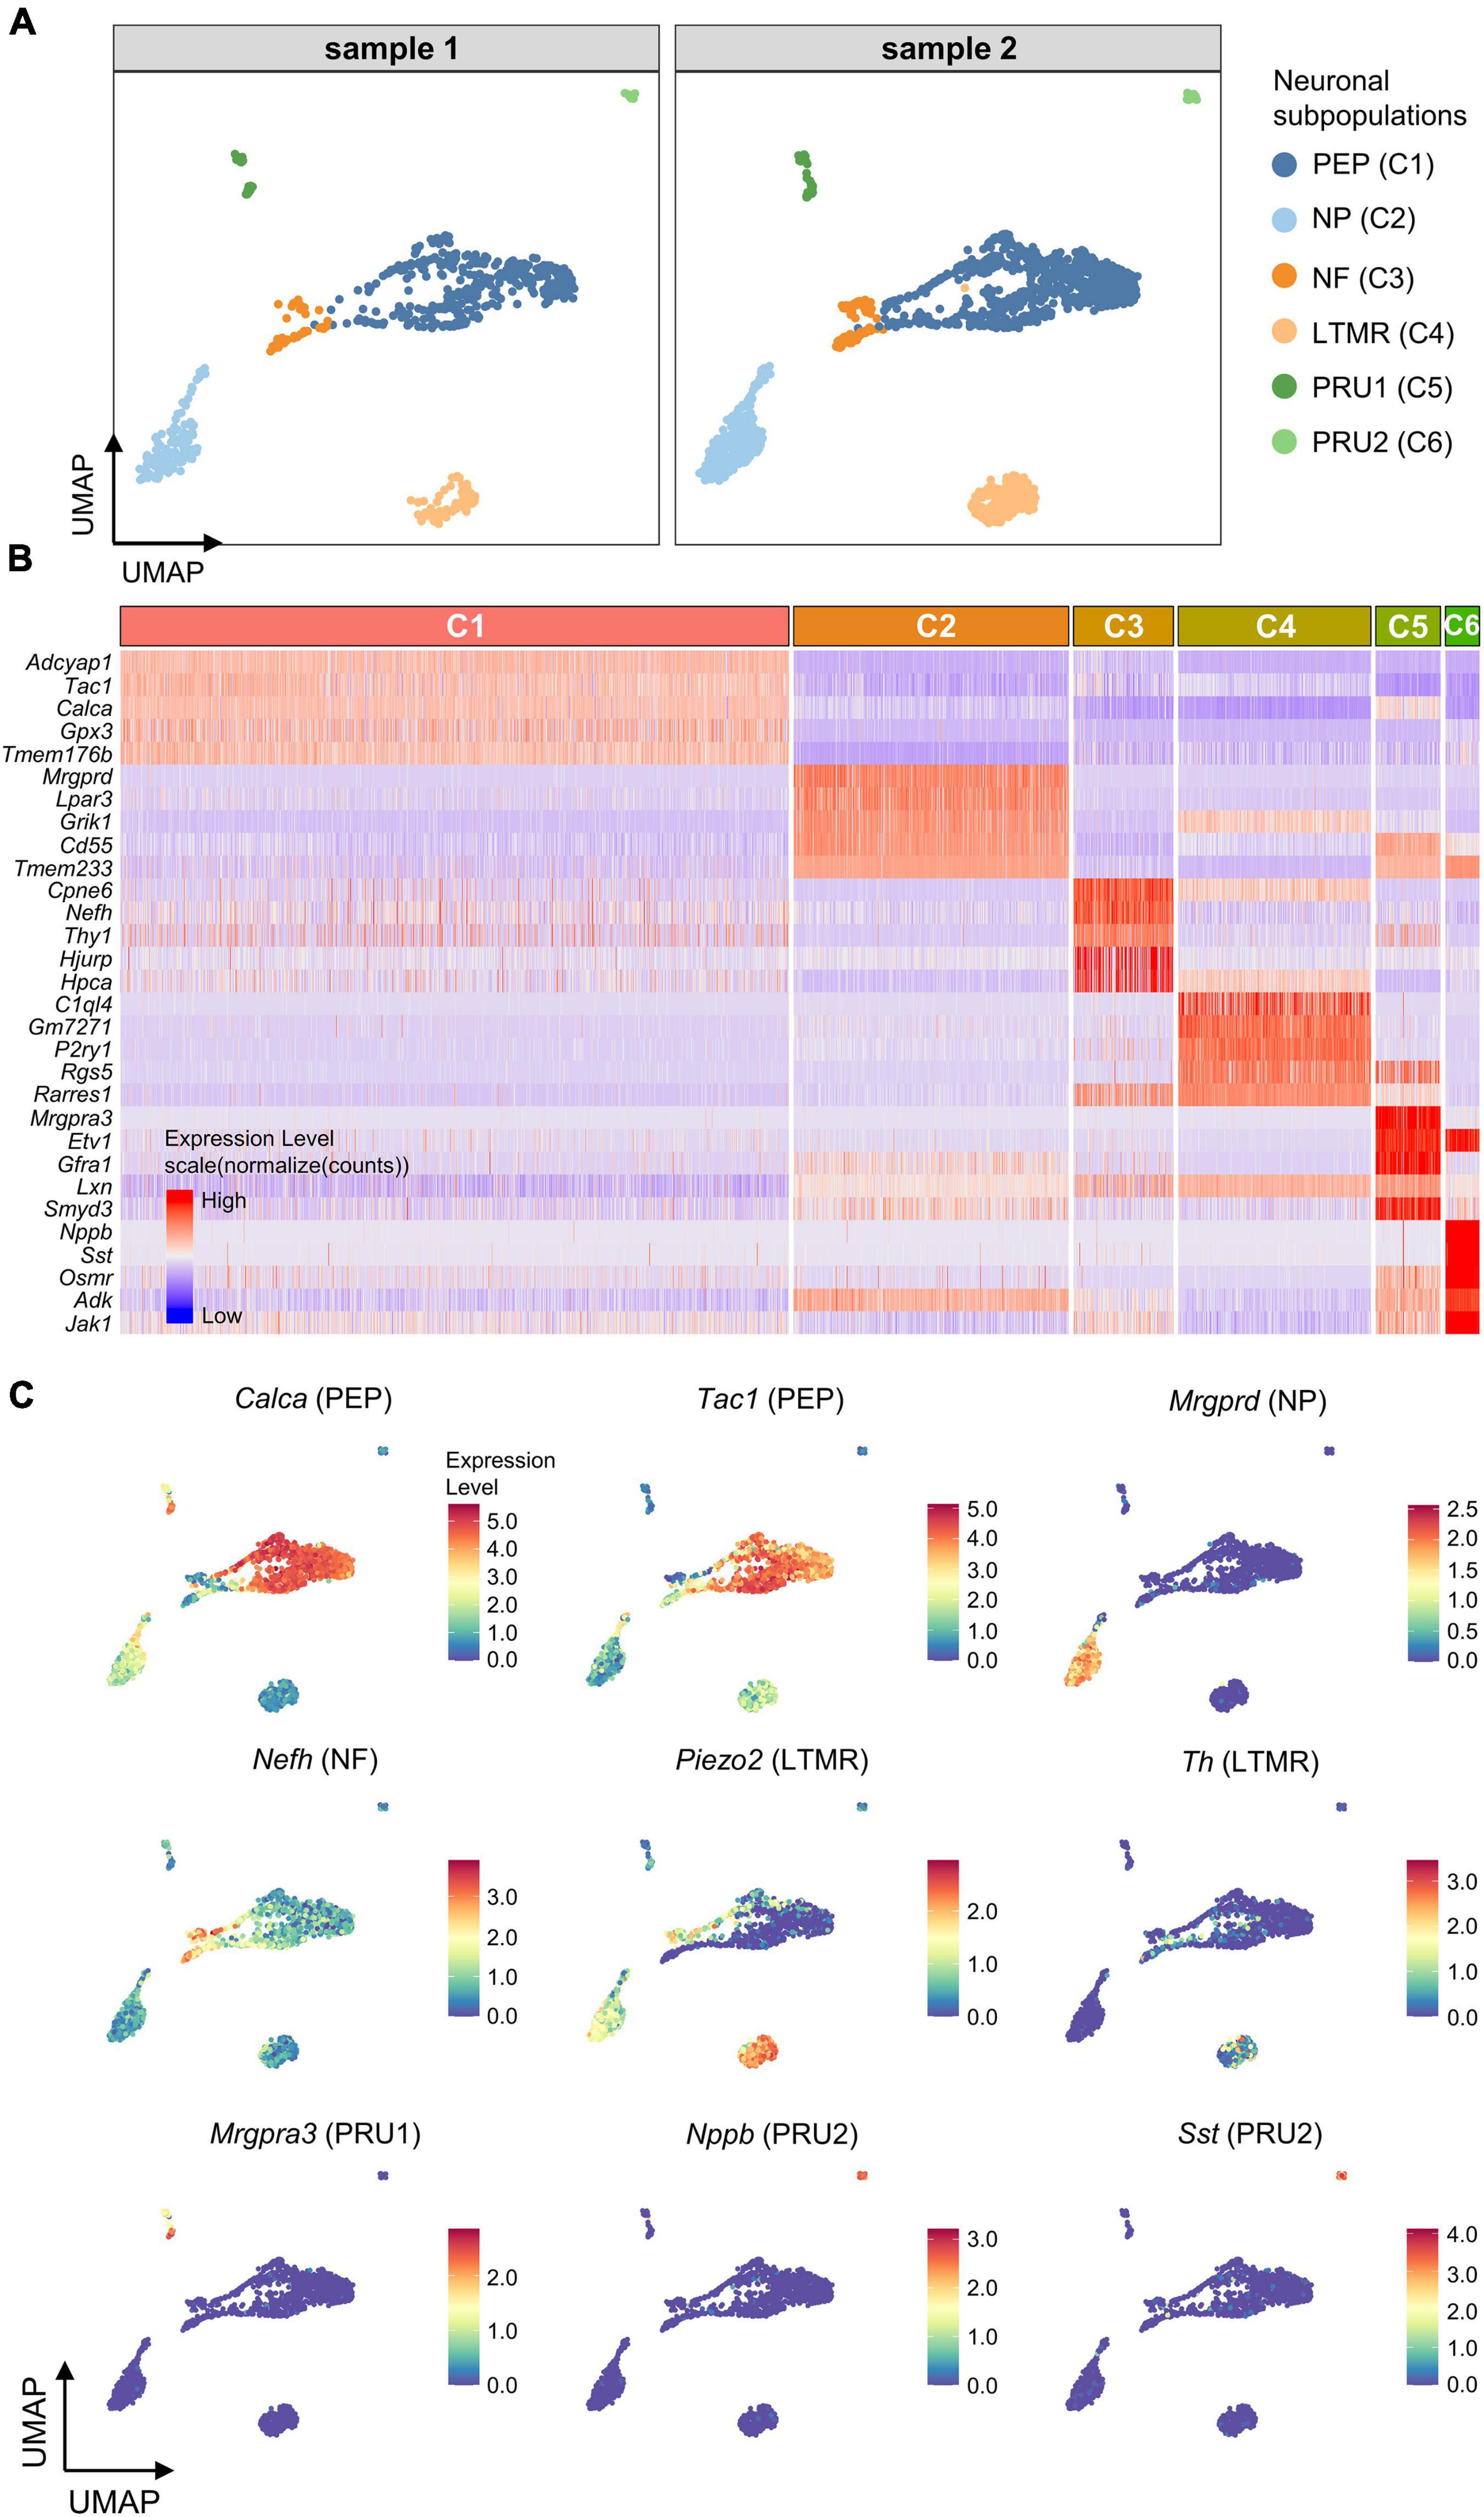
Figure 3. Identification of neuronal subpopulations. (A) UMAP projection of neuronal subpopulations. 6 neuronal subpopulations including PEP, NP, NF, LTMR, PRU1, and PRU2 were identified in both samples. Each dot represents one cell; Each color represents one neuronal subpopulation. (B) Heatmap showing expression of the top5 marker genes for each neuronal cluster (C1–C6). Colors represents relative expression levels. Red represents high expression and blue low expression. Each color-block above the heatmap represents one neuronal cluster, and its length represents the number of cells per cluster. (C) UMAP projection of known marker genes for each neuronal subpopulation in neuronal clusters (C1–C6). Each dot represents one cell. Cells are colored by normalized expression levels (normalized (counts)). Warm colors represent higher gene expression. C1 was identified as PEP by the expression of Calca and Tac1, C2 was identified as NP by Mrgprd, C3 was identified as NF by Nefh, C4 was identified as LTMR by Piezo2 and Th, C5 was identified as PRU1 by Mrgpra3, and C6 was identified as PRU2 by Nppb and Sst. PEP, peptidergic neurons; NP, non-peptidergic neurons; NF, large-diameter myelinated neurons; LTMR, low threshold mechanoreceptive unmyelinated neurons; PRU1, pruriceptive neurons type 1; PRU2, pruriceptive neurons type 2.
We investigated the expression and distribution of genes associated with purinergic signaling in each neuronal subpopulation (Figures 4A–F). Genes encoding purinergic receptors were found differentially expressed in neuronal subpopulations (Figures 4A,F). P2rx2 was expressed significantly greater in PRU2, P2rx3 in NP, P2ry1 in LTMR, Adora1 in NF, and Adora2b in PRU1 (log2FC > 0.5 and P < 0.01; Figures 4F,G). However, P2rx4 expression was almost equal in different subpopulations.
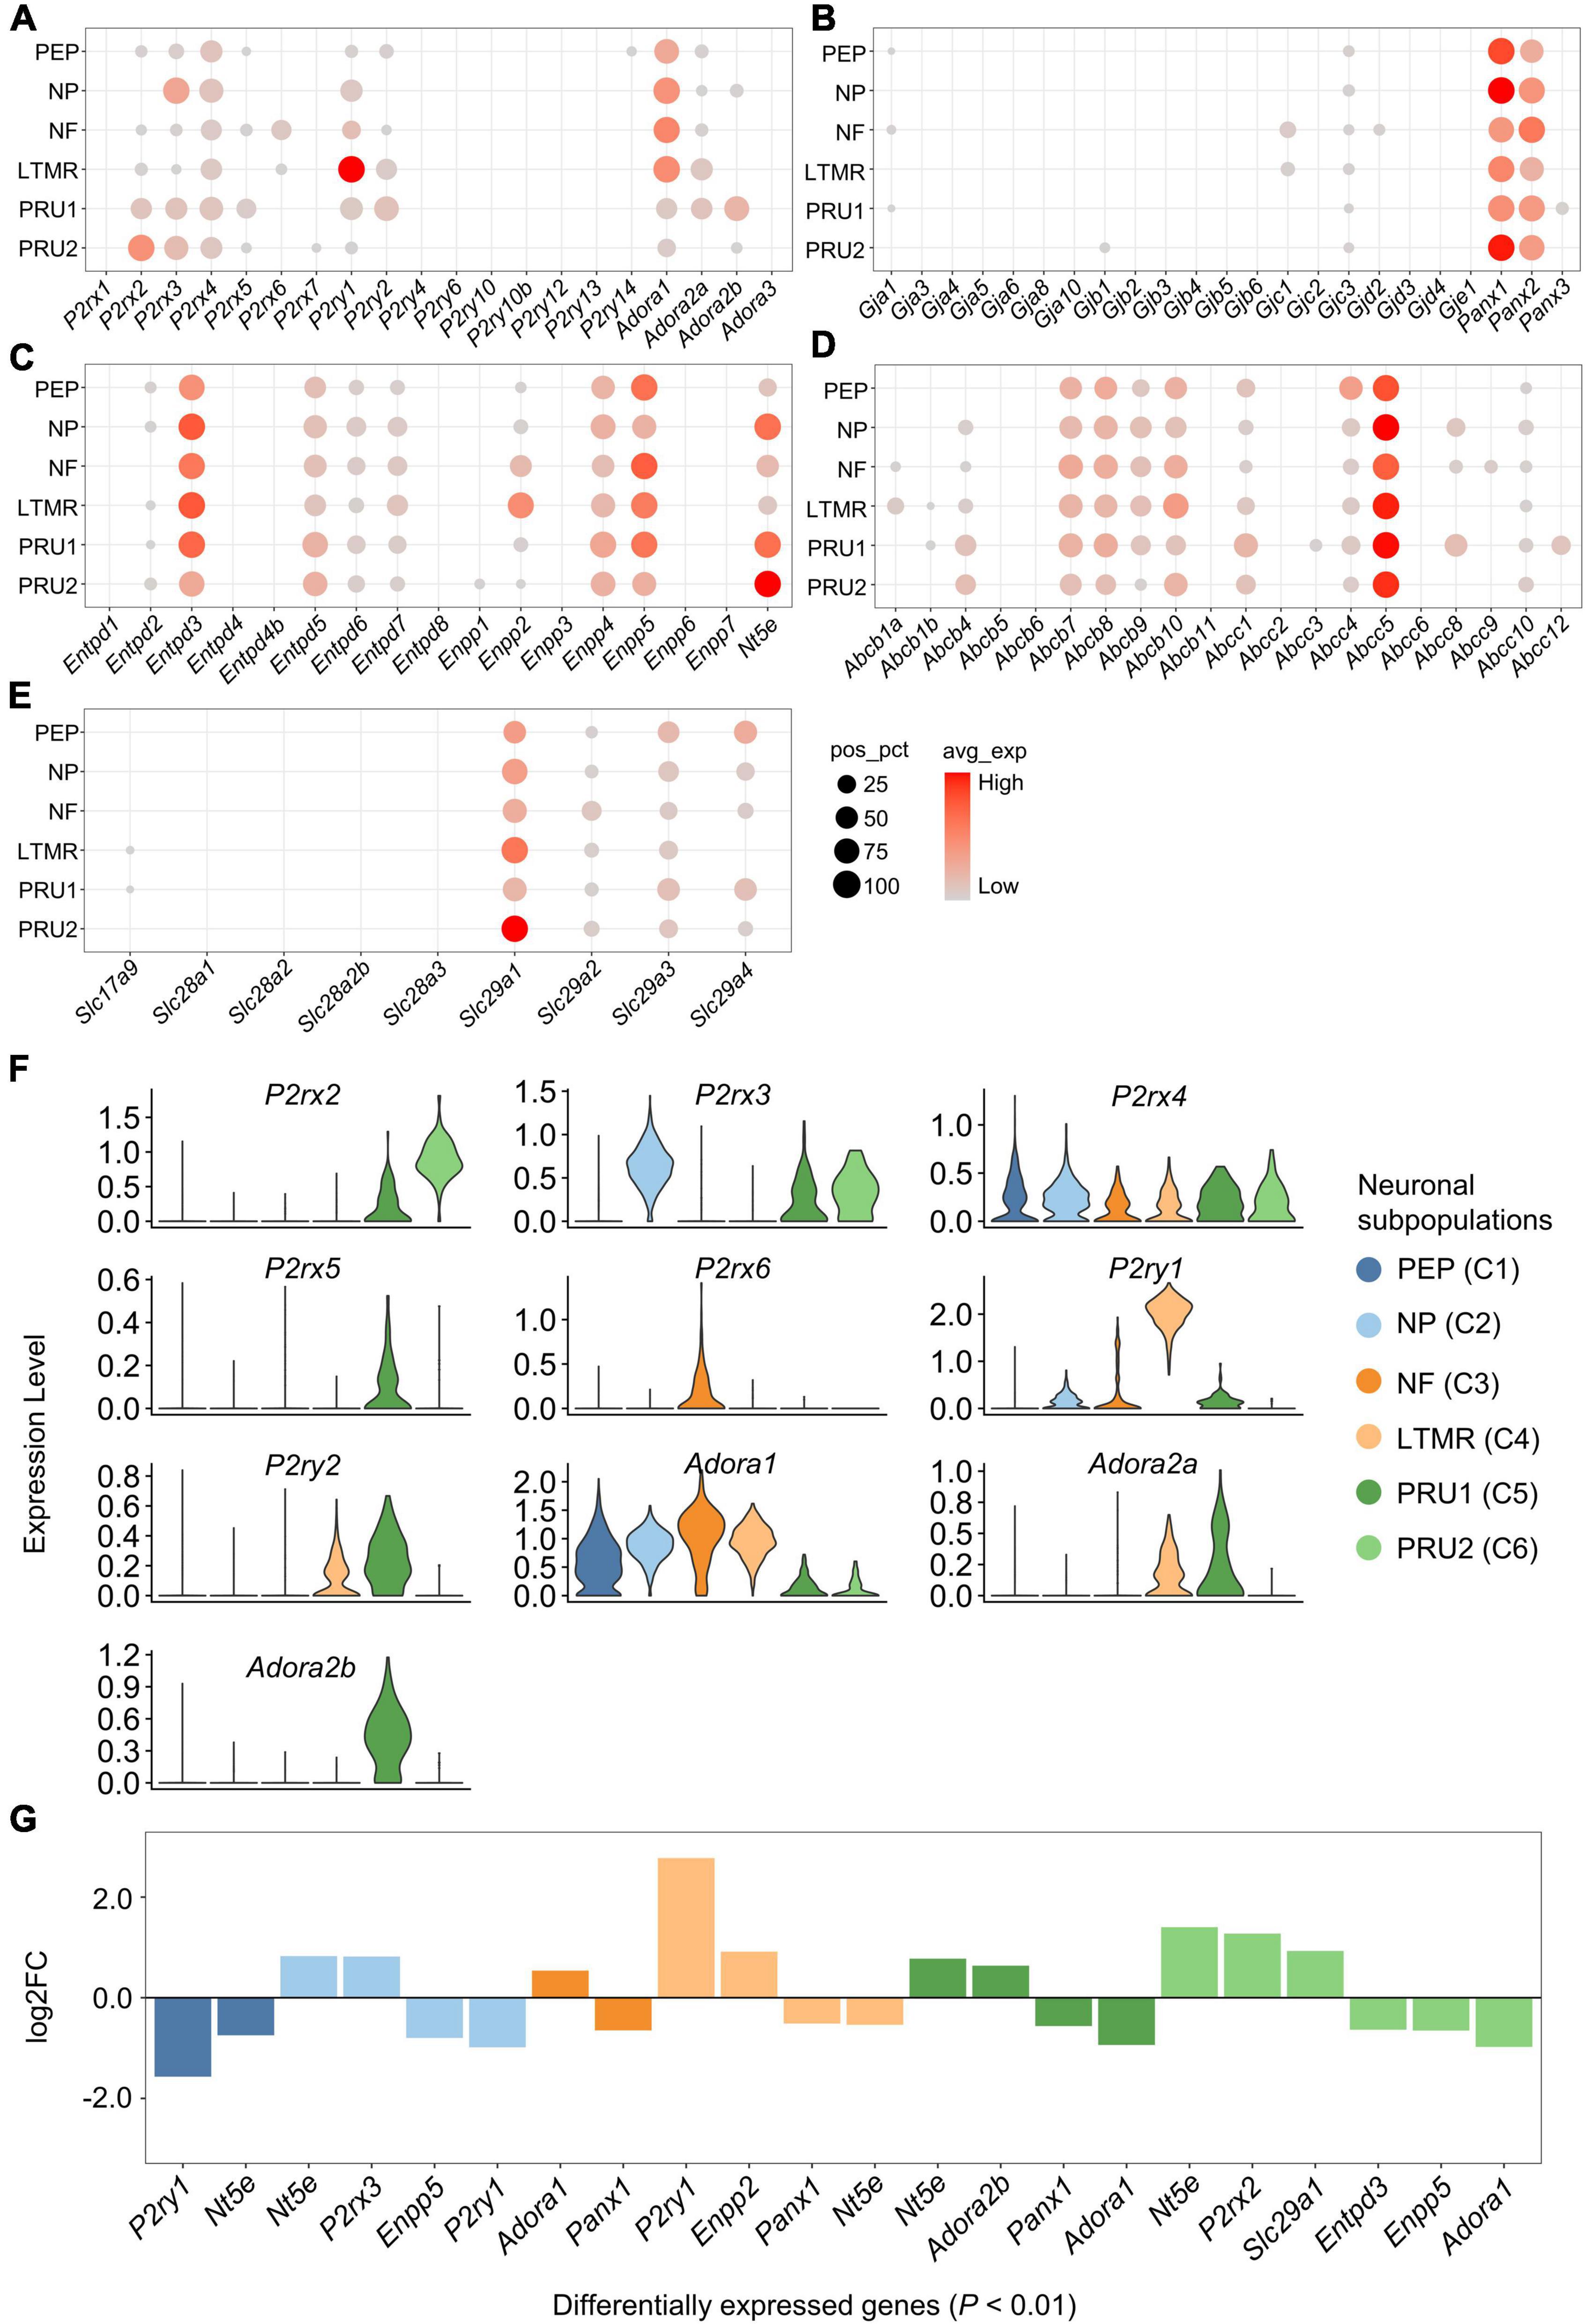
Figure 4. Expression of genes associated with purinergic signaling in neuronal subpopulations. (A–E) Bubble plot showing the expression of genes described above in neuronal subpopulations. Bubble size represents percentage of cells with positive expression (pos_pct), and bubble color represents average normalized expression levels (avg_exp). Bubbles with pos_pct < 5% are not shown. (F) Violin plots showing the distribution of partial purinergic receptor-encoding genes in distinct neuronal subpopulations. Violin height represents normalized expression level [normalized (counts)], and violin width represents density distribution. Violin plots were color-coded based on neuronal subpopulations. (G) Bar plot showing significant differences in gene expression among neuronal subpopulations (Wilcoxon Rank Sum test; P < 0.01 was considered statistically significant). The bars are color-coded by neuronal subpopulations, and bar height represents log2 fold change (log2FC). Genes with log2FC > 0.5 and P < 0.01 are shown.
In addition, several genes encoding eATP metabolism-associated enzymes or NTs were differentially expressed among the subpopulations. Nt5e had significantly higher expression in NP, PRU1 and PRU2, Enpp2 in LTMR, and Slc29a1 in PRU2 (log2FC > 0.5 and P < 0.01; Figures 4C,E,G). Among genes encoding Cxs, Panxs or ABCTs, no significantly differently expressed genes was detected among neuronal subpopulations (log2FC < 0.5; Figures 4B,D,G).
Expression of genes associated with purinergic signaling in glial subpopulations
The highest DEGs for each glial cluster (C7-11) were identified and visualized (Figure 5A). Based on the expression of known marker genes, C7 and C8 were identified as satellite glial cells (SGCs; Fabp7), C9 and C10 were identified as myelinating Schwann cells (mSCs; Ncmap), and C11 was identified as Remak Schwann cells (RSCs; Scn7a) (Figure 5B).
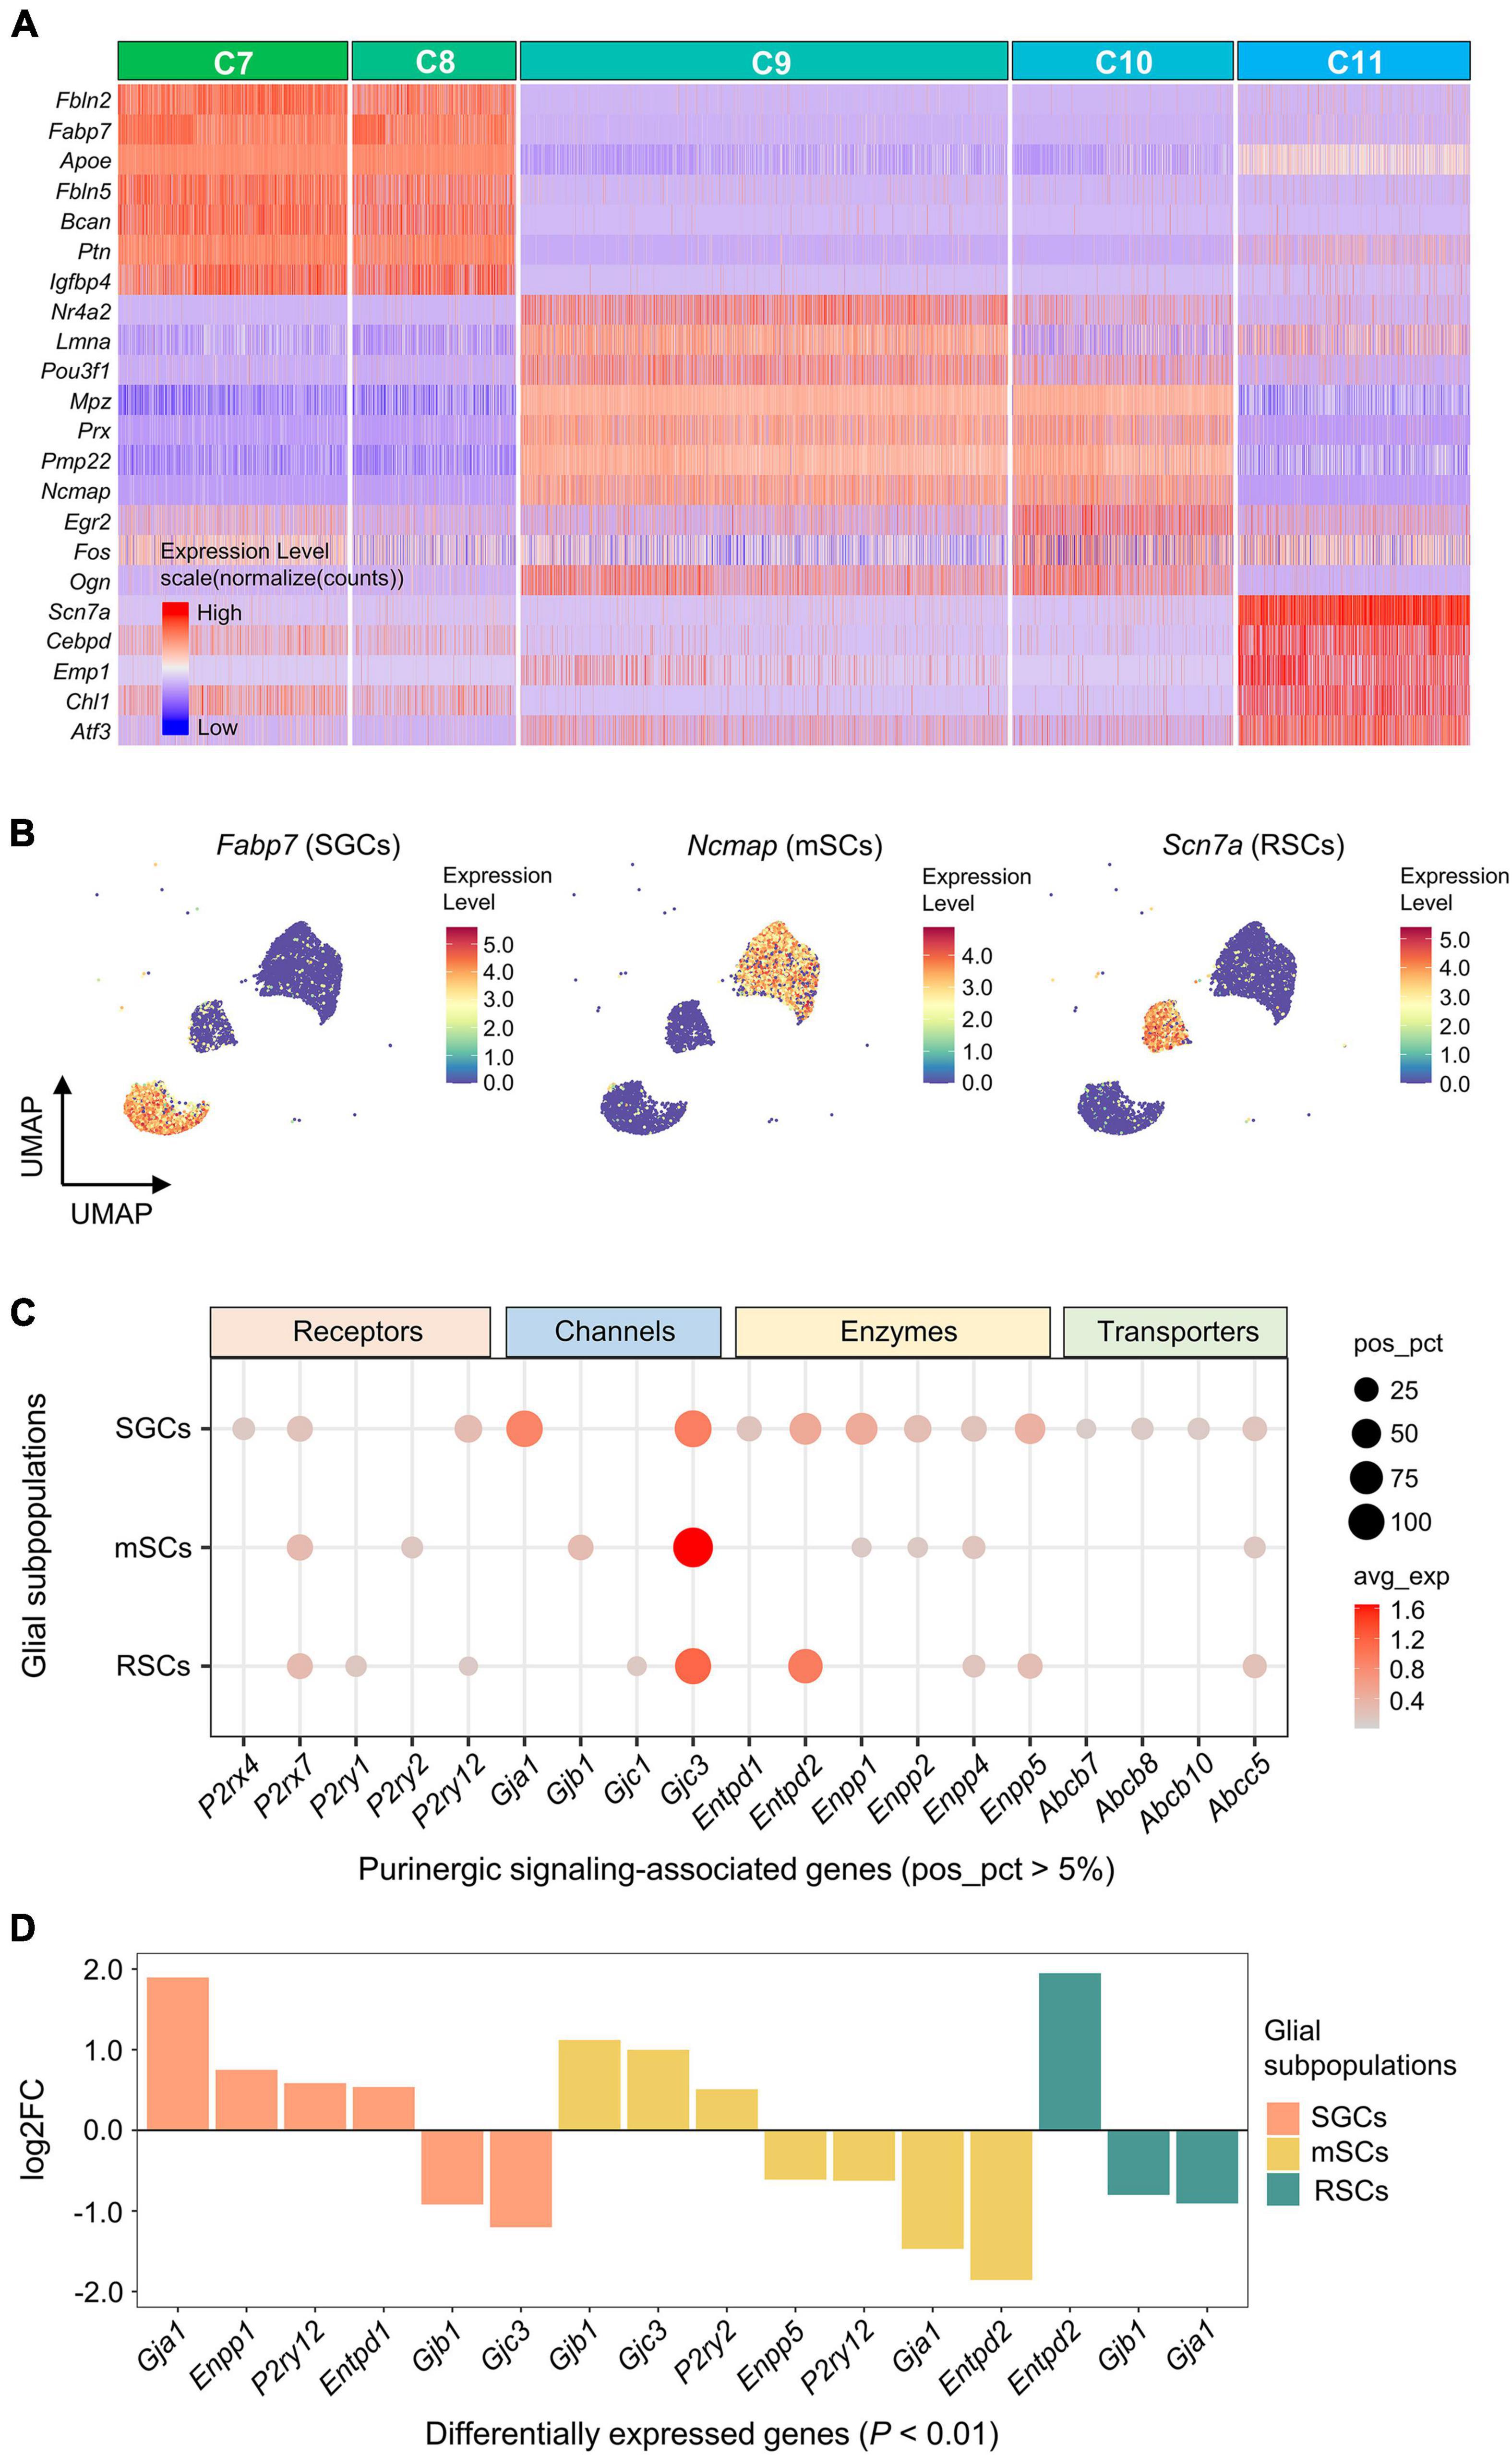
Figure 5. Expression of genes associated with purinergic signaling in glial subpopulations. (A) Heatmap showing expression of representative marker genes for each glial cluster (C7–C11). Heatmap colors represent relative expression levels. Red represents high expression and blue low expression. Glial clusters were color-coded above the heatmap. (B) UMAP projection of known marker genes for SGCs, mSCs, and RSCs in glial clusters (C7–C11). Each dot represents one cell. Cells are colored by gene expression levels. Levels are normalized expression counts. Warm colors (red and yellow) represent high expression, and cool colors (light and dark blue) represent low expression. C7 and C8 were identified as SGCs by the expression of Fabp7, C9 and C10 were identified as mSCs by Ncmap, and C11 was identified as RSCs by Scn7a. (C) Bubble plot showing genes encoding purinergic complex (including receptors, channels, enzymes, and transporters) in glial subpopulations. (D) Bar plot showing differential expression of these genes among glial subpopulations (Wilcoxon Rank Sum test; P < 0.01 was considered statistically significant). The bars are color-coded by glial subpopulations, and bar height represents log2 fold change (log2FC). Genes with log2FC > 0.5 and P < 0.01 are shown. SGCs, satellite glial cells; mSCs, myelinating Schwann cells; RSCs, Remak Schwann cells.
Five receptor-encoding genes were positively expressed in glial subpopulations (pos_pct > 5%). Among these, P2rx7 was positively expressed in all 3 glial subpopulations, P2ry12 in SGCs and RSCs, P2rx4 in SGCs, P2ry2 in mSCs, and P2ry1 in RSCs (Figure 5C). Differential gene expression analysis showed that P2ry2 was expressed significantly greater in mSCs, and P2ry12 in SGCs (log2FC > 0.5 and P < 0.01; Figure 5D).
Among genes encoding Cxs, Gjc3 was positively expressed in all 3 glial subpopulations (47.3% of SGCs, 61.4% of mSCs and 43.6% of RSCs), and had significantly higher expression in mSCs (log2FC > 0.5 and P < 0.01; Figures 5C,D). In addition, Gja1 was expressed significantly more in 45.3% of SGCs, and Gjb1 in 11.5% of mSCs (log2FC > 0.5 and P < 0.01).
Genes encoding E-NTPDase or ENPP were also found differentially expressed among glial subpopulations (Figures 5C,D). Differential gene expression analysis revealed that Entpd2 was expressed significantly greater in 36.8% of RSCs, and Enpp1 in 27.3% of SGCs (log2FC > 0.5 and P < 0.01).
Expression of genes associated with purinergic signaling in immune cell subpopulations
Based on SingleR automatic annotations, 7 immune cell subpopulations were identified, including macrophages, monocytes, microglia-like cells (MLCs), B cells, T cells, NK cells and granulocytes (Figure 6A). The highest DEGs for each immune cell subpopulation were consistent with known canonical markers (Figure 6B).
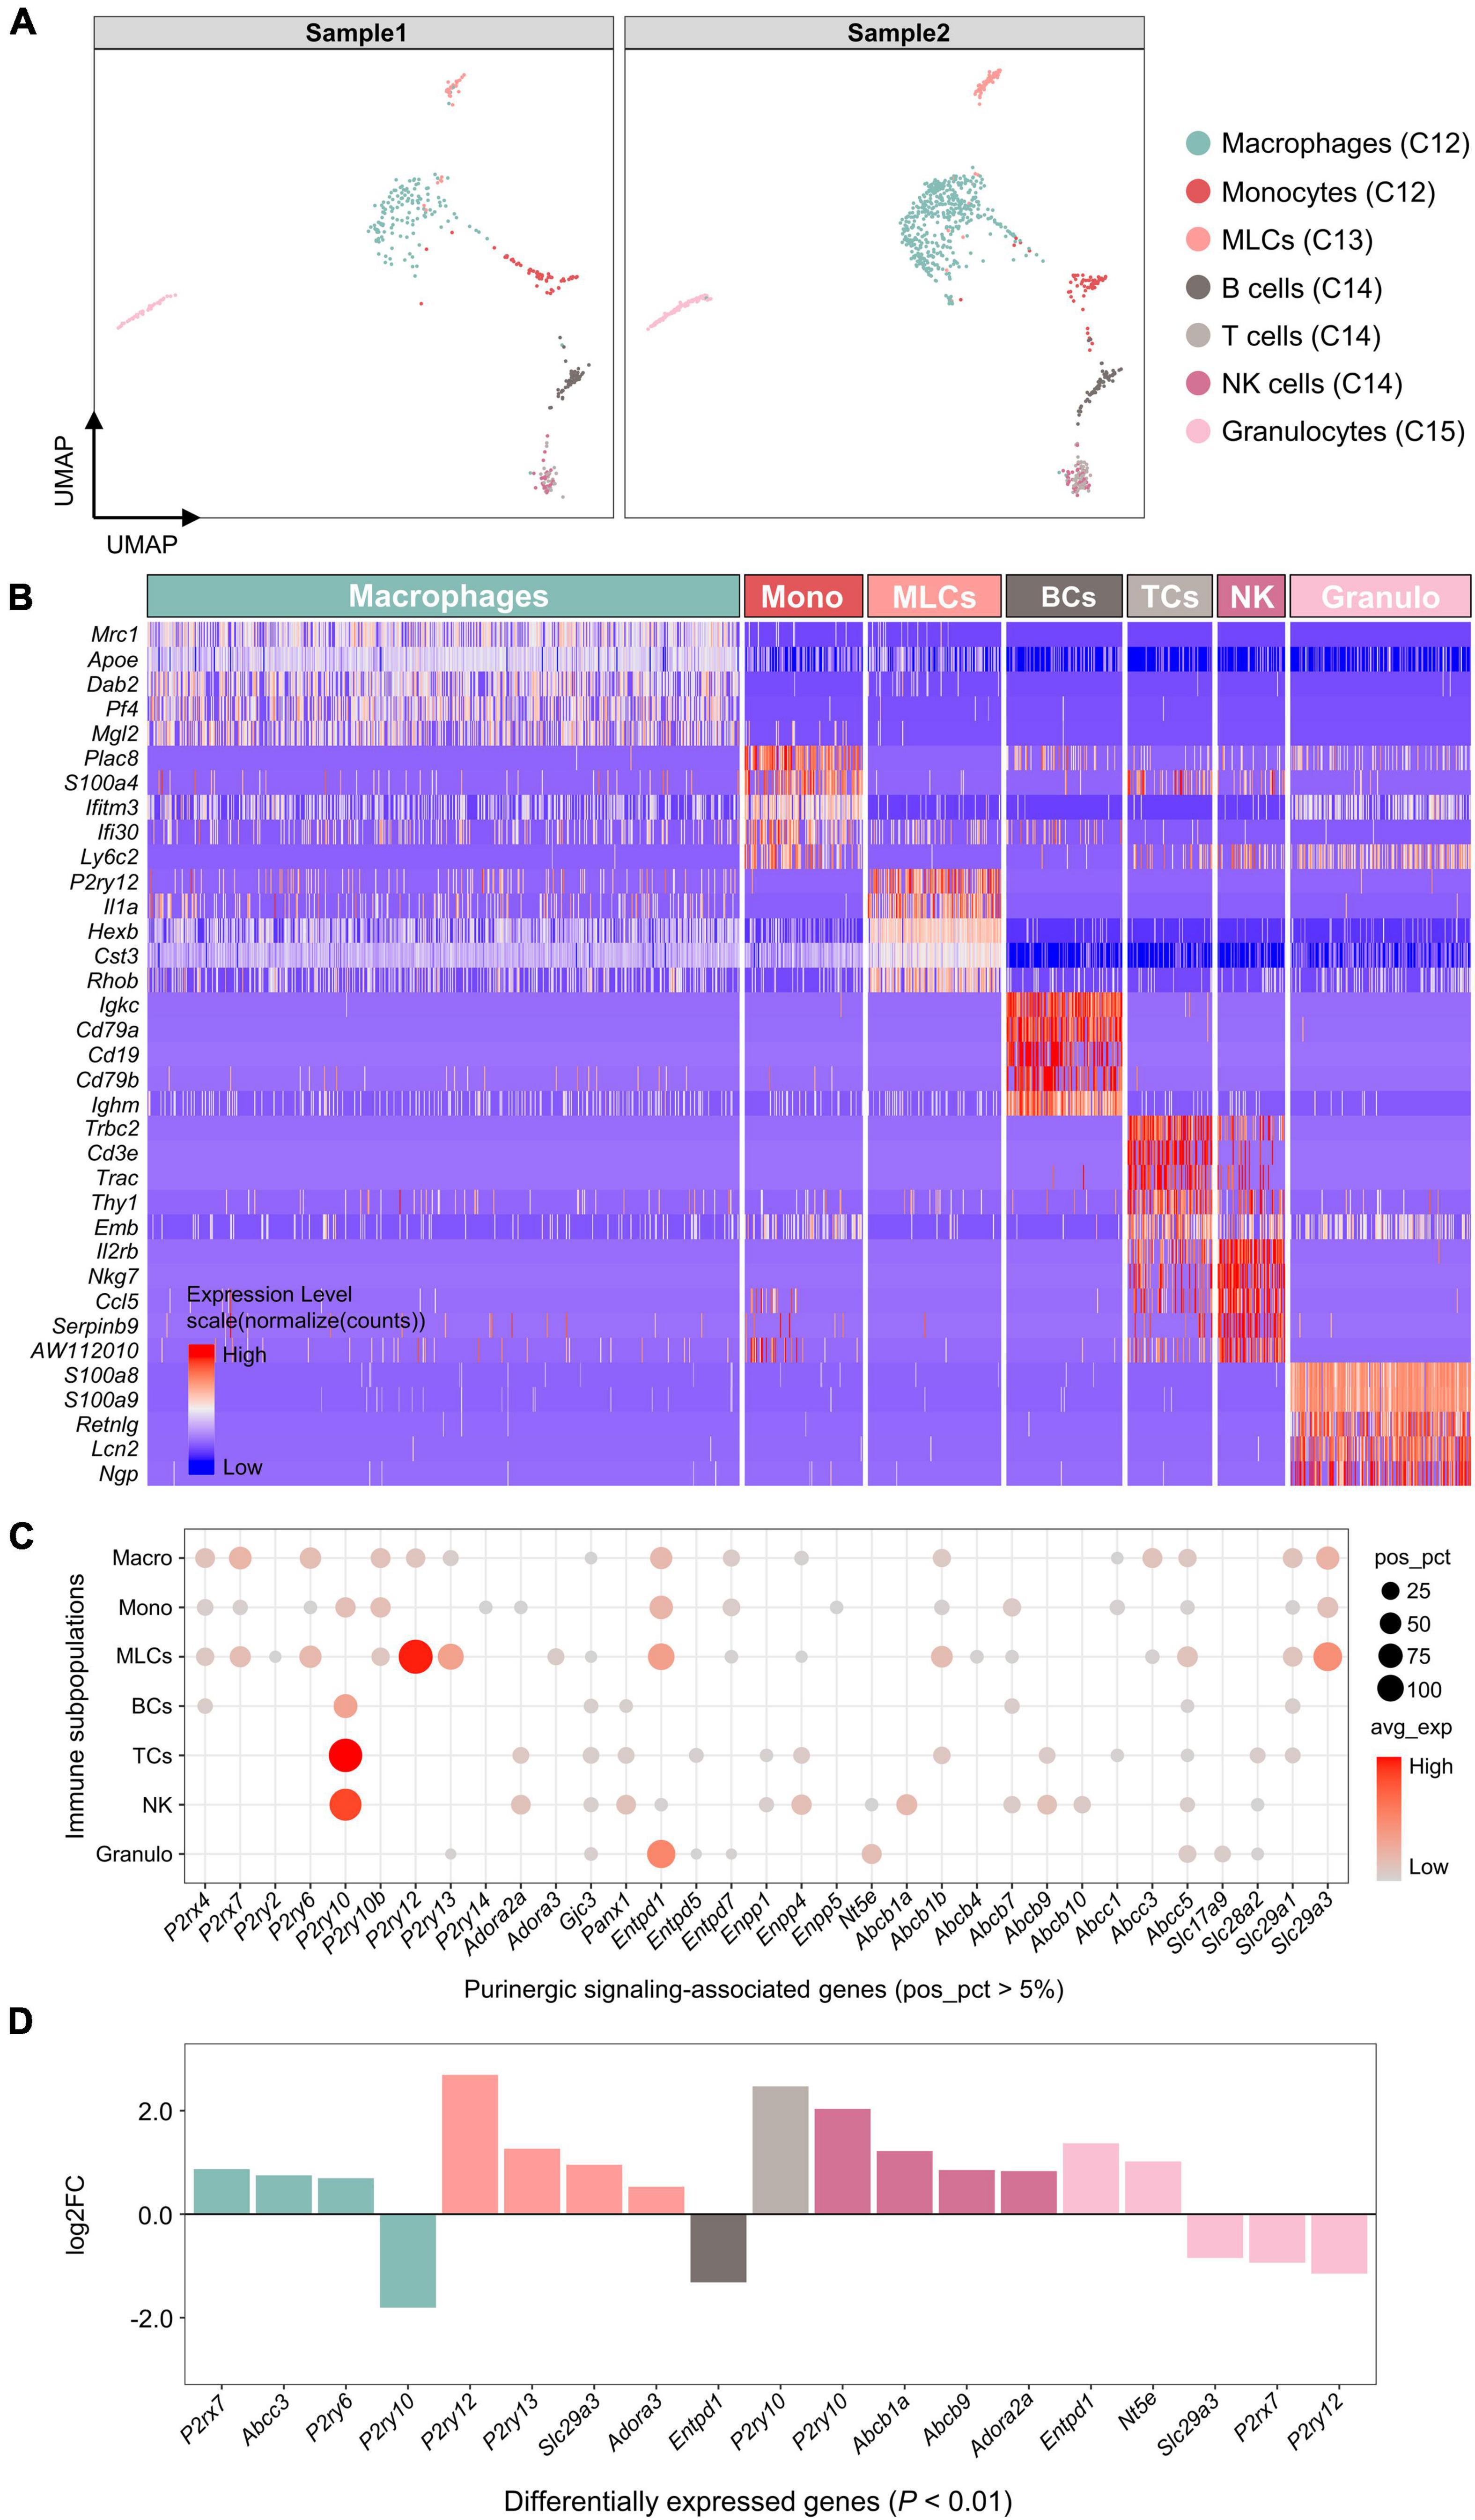
Figure 6. Expression of genes associated with purinergic signaling in immune cell subpopulations. (A) UMAP plot showing SingleR automatic annotations. Each dot represents one cell. Cells are colored by SingleR annotations. (B) Heatmap showing expression of top 5 marker genes for each immune cell subpopulation annotated by SingleR. Heatmap colors represent relative expression levels. Red represents high expression and blue low expression. Immune cell subpopulations were color-coded above the heatmap. (C) Bubble plot showing expression of purinergic signaling-associated genes in immune cell subpopulations. (D) Bar plot showing differential expression of these genes among immune cell subpopulations (Wilcoxon Rank Sum test; P < 0.01 was considered statistically significant). Genes with log2FC > 0.5 and P < 0.01 are shown.
Among genes encoding purinergic receptors, P2rx4, P2rx7, P2ry6, P2ry10b, P2ry12, and P2ry13 were found to be positively expressed in macrophages (pos_pct > 5%; Figure 6C), of which P2rx7 and P2ry6 showed significantly higher expression compared with the other immune cells (log2FC > 0.5 and P < 0.01; Figure 6D). MLCs shared a similar expression pattern with macrophages, and showed significantly higher expression of P2ry12, P2ry13, and Adora3 than the other immune cells. Both monocytes and lymphocytes expressed P2ry10 positively, of which T cells and NK cells showed significantly higher P2ry10 expression than the other immune cells.
In addition, macrophages significantly expressed Abcc3, MLCs significantly expressed Slc29a3, NK cells significantly expressed Abcb1a and Abcb9, and granulocytes significantly expressed Entpd1 and Nt5e (log2FC > 0.5 and P < 0.01; Figure 6D).
Discussion
Although many aspects of purinergic signaling have been elucidated, currently little is known about the transcriptional features of purinergic signaling in TG. In recent years, scRNA-seq and single nucleus RNA sequencing technologies have been used to investigate heterogeneity of peripheral ganglia (Usoskin et al., 2015; Nguyen et al., 2017; Mapps et al., 2022; Yang et al., 2022) and transcriptional features of functional gene sets such as transcription factors at the single cell level (Paul et al., 2017; Li et al., 2021). In this study, we revealed the shared and unique expression patterns of genes associated with purinergic signaling in distinct cell types, suggesting that the multidirectional action of purinergic signaling in TG is cell-type specific.
Purinergic receptors
Purinergic receptor activation up-regulates intracellular Ca2+ concentration via P2XR-mediated extracellular Ca2+ influx and P2YR-/P1R-mediated Ca2+ release from the calcium stores (North, 2002; Abbracchio et al., 2006; Antonioli et al., 2013). Purinergic receptors expressed in the TG can be greatly up-regulated following orofacial inflammation and/or nerve injury, contributing to the initiation and maintenance of orofacial allodynia and hyperalgesia (Shinoda et al., 2005, 2007; Katagiri et al., 2012; Ito et al., 2013; Yin et al., 2021). P2rx3, the gene that encodes P2 × 3Rs, was mainly expressed in neurons, and was virtually absent in other cell types. Among neuronal subpopulations, P2rx3 was expressed in 97.6% of NP, 22.7% PEP, and 12.1% NF, which was consistent with previous rat studies (Ambalavanar et al., 2005; Staikopoulos et al., 2007). In addition, we found that P2rx3 was also widely detected in PRU1 and PRU2, indicating its potential role in pruriception.
Unlike P2rx3, P2rx4 was expressed not only in neurons but also in SGCs and macrophages. In addition, we found that there was no significant difference in P2rx4 expression among neuronal subpopulations, suggesting that P2 × 4R function is relatively conserved. Several studies have revealed that P2 × 4R is expressed in microglia of spinal trigeminal nucleus (STN), and up-regulated in the chronic migraine models, which may play important roles in central sensitization and pathogenesis of migraine chronicity (Liu et al., 2018; Long et al., 2018). Moreover, P2 × 4R located in DRG or local tissues has been shown to be involved in inflammatory or neuropathic pain (Ulmann et al., 2010; Wang et al., 2020). We speculate that the data about the roles of P2 × 4R obtained in the spinal system could also be operative in the trigeminal system, which would be needed to determine.
P2rx7 was mainly expressed in glial cells and macrophages, whereas is barely expressed in TG neurons, which is consistent with previous studies (Kushnir et al., 2011; Nowodworska et al., 2017). In addition, we found that P2rx7 was expressed at similar levels in the 3 glial subpopulations, including SGCs, mSCs, and RSCs. Among immune cell subpopulations, P2rx7 was expressed not only in macrophages but also in MLCs and monocytes. There is evidence that P2 × 7R in the TG or STN is involved in orofacial pain (Currò et al., 2020; Yin et al., 2021). However, given the cell type-specific expression patterns of P2XRs, there may be differences in mechanisms by which P2XR subtypes promote orofacial pain.
P2YRs are subdivided into Gq-coupled P2Y1-like receptor subtypes (including P2Y1, P2Y2, P2Y4, P2Y6, and P2Y11R) and Gi-coupled P2Y12-like receptor subtypes (including P2Y12, P2Y13, and P2Y14R) (Abbracchio et al., 2006). We found that P2ry1 was expressed in 40.8% of neurons and 23.4% of fibroblasts, and P2ry2 was positively expressed in 22.4% of neurons. Previous studies showed that both P2Y1R and P2Y2R in TG were up-regulated after temporomandibular joint (TMJ) inflammation, and antagonism of P2Y2R significantly inhibited the mechanical allodynia, whereas antagonism of P2Y1R was completely ineffective, indicating the potential role of P2Y2R in orofacial pain (Magni et al., 2015). In this study, we observed high P2ry1 expression in LTMR neuronal subpopulation that also co-express Piezo2 and Th (encoding tyrosine hydroxylase, a key enzyme mediating the conversion of tyrosine to dopamine), suggesting its potential roles in dopamine release, and this prediction has been validated by a recent study (Wei et al., 2022). In addition, P2ry1 was also expressed in 62.7% of NP and 66.9% of PRU, which can account for its pronociceptive role in regulating of neuropathic pain (Su et al., 2021a,b). P2ry2 was mainly expressed in LTMR and PRU1 and was rarely expressed in NP, suggesting that the pro-nociceptive role of P2Y2R is not directly related to NP nociceptive neurons. Further studies are necessary to elucidate the molecular mechanism that responsible for pro-nociceptive effect of P2Y1R and P2Y2R.
Gi-coupled P2Y12-like receptor subtypes were mainly expressed in glial cells and immune cells. Previous studies showed that activation of P2Y12R in SGCs of TG was in involved in orofacial neuropathic pain induced by unilateral lingual nerve injury (Katagiri et al., 2012; Sugawara et al., 2017). In addition, microglia P2Y12R in STN was also verified to be involved in several types of orofacial pain, including migraine and tongue cancer pain (Tamagawa et al., 2016; Gölöncsér et al., 2021). In our studies, P2ry12 was expressed not only in SGCs, but also in macrophages and MLCs, suggesting that the pro-nociceptive effect of P2Y12R may not only rely on the glia-neuron interactions but also on the neuroimmune communication. Moreover, we identified a microglia-like immune cell subpopulation (MLCs) that could be characterized by known marker genes of microglia, including P2ry12 and Tmem119 (Li et al., 2019). Although microglia have been considered the CNS-resident phagocytic cells, several studies have provided histochemical evidence for microglia-like macrophages in TG (Glenn et al., 1993; Mori et al., 2003).
Increased eATP following inflammation or tissue injury may be converted to adenosine which exerts complex pro- or anti-nociceptive effects via P1Rs activation (Sawynok and Liu, 2003). Growing evidence has shown that A2AR (encoded by Adora2a) exhibits the pro-nociceptive effect, whereas A1R (encoded by Adora1) acts as an anti-nociceptive target in orofacial pain. Our results showed that Adora1 was widely expressed in almost all neuronal subpopulations and was more highly expressed in NF neurons, whereas Adora2a was mainly expressed in LTMR and PRU1. In addition, Adora2b was expressed specifically in PRU1 neurons, whereas Adora3 was expressed in less than 5% of each neuronal subpopulation. Although Adora3 was detected at relatively low levels, their roles in mouse TG cannot be discounted. Several studies have shown that A3AR (encoded by Adora3) activation in the spinal cord or brain contributes to the alleviation of neuropathic pain induced by paclitaxel, cisplatin or chronic constriction injury of the sciatic nerve (Janes et al., 2014; Ford et al., 2015; Little et al., 2015; Singh et al., 2022). In addition, A3ARs were expressed in rat DRG neurons, and A3AR activation inhibited N-type Ca2+ currents and neuronal excitability, which could be independent mechanisms for A3ARs in anti-nociception (Coppi et al., 2019). However, few evidence showed its anti-nociceptive role in orofacial region. Further studies are needed to elucidate the roles of adenosine receptors in orofacial pain.
Cxs and Panx channels
Increased ATP levels following inflammation and/or tissue injury initiates the purinergic signaling. Both Cxs and Panx channels are transmembrane proteins, mediating the release of ATP via their central pores (Taruno, 2018). In addition, the Cxs can form gap junction between neurons and SGCs, mediating the neuron-glia interactions (Spray et al., 2019). The pro-nociceptive properties of Panx1 (encoded by Panx1) and Cx43 (encoded by Gja1) have been demonstrated (Kaji et al., 2016; Kurisu et al., 2022). Our results showed that the expression of Panx1 were high in neurons, whereas Gja1 were low in this population. In contrast, in glial cells, the expression of Panx1 was nearly absent, whereas Gja1 was highly expressed in SGCs. In addition, we found that Panx2 was highly expressed in neurons, and Gjc3 (encoding Cx29) was highly expressed among SGCs and Schwann cells, which has never been reported before. Further studies are needed to identify their roles in neuron-glia interactions and orofacial pain.
Extracellular adenosine triphosphate metabolism-associated enzymes
eATP metabolism-associated enzymes can hydrolyze eATP to adenosine, thereby mediating the attenuation of purinergic signaling and the enhancement of adenosine signaling. E-NTPDase family can catalyze the conversion of eATP and/or adenosine diphosphate (ADP) to adenosine monophosphate (AMP) (Yegutkin, 2014). Our results showed that Entpd3 was specifically expressed in TG neurons, which is consistent with a previous study (Ma et al., 2016). In addition, we found that Entpd1 was mainly expressed in immune cells and endothelial cells, Entpd2 was mainly expressed in glial cells and fibroblasts, and Entpd5-7 were mainly expressed in neurons. Among glial subpopulations, SGCs and RSCs expressed Entpd2, but not mSCs. Among immune cell subpopulations, macrophages and MLCs expressed Entpd1, but not lymphocytes.
ENPP family mediate the conversion of eATP to AMP and PPi, and NT5E mediates the conversion of AMP to adenosine (Yegutkin, 2014). A previous study showed that administration of purified NT5E inhibited the mechanical and thermal hyperalgesia in inflammatory or peripheral neuropathic pain models (Sowa et al., 2010). The expression of NT5E in TG nociceptive neurons has been demonstrated (Liu et al., 2017). Our results showed that Nt5e was positively expressed in 56.0% of neurons and 19.9% of fibroblasts, while it was barely expressed in glial cells or immune cells. Among the different subpopulations of neurons, NP and PRU neurons showed high expression of Nt5e. Among genes encoding ENPP, Enpp1 was mainly expressed in SGCs, Enpp2 was mainly expressed in fibroblasts, and Enpp4 and Enpp5 were mainly expressed in neurons. Here, we demonstrate that genes encoding eATP metabolism-associated enzymes are differentially expressed within distinct cell types, which suggests that the capacity to hydrolyze eATP varies among the different cell types.
Adenosine triphosphate and adenosine transporters
VUNT-dependent vesicular exocytosis represents a critical pathway for eATP release. Previous studies showed that VNUT was predominantly located on the small- and medium-diameter neurons in rat DRG (Nishida et al., 2014) and was up-regulated in neurons of rat TG after tooth extraction (Goto et al., 2017), suggesting its role in orofacial pain. However, Slc17a9 was not detected in any of the TG cell populations in mice, possibly due to low transcriptional activity of Slc17a9 under physiological conditions or species difference.
Extracellular adenosine is regulated by NTs, which are membrane transport proteins that mediate the bidirectional diffusion of adenosine (Kong et al., 2004). Previous studies showed that ENT1 was highly expressed in DRG peptidergic neurons, and other neuronal subpopulations including small-diameter nociceptive neurons and large-diameter neurons were also expressed ENT1 positively (Governo et al., 2005). We found that ENT1-encoding gene, Slc29a1, was expressed in 76.9% of TG neurons and 15.3% of macrophages, but not in glial cells. Other genes encoding ENTs including Slc29a2, Slc29a3, and Slc29a4 were also expressed in neurons. Besides neuron expression, Slc29a3 was expressed in macrophages, monocytes and MLCs. These results suggest that TG neurons and macrophages are major contributors to adenosine release and reuptake. There is evidence that inhibition of ENT1 exerts an anti-nociceptive effect in inflammatory paw pain models (Maes et al., 2012). Further studies are needed to clarify the roles of ENT family in orofacial nociception and chronic pain.
While this study provides a comprehensive transcriptomic description of the purinergic signaling in TG cells, there are limitations. First, preparation of single-cell suspension from TG inevitably led to neuronal injury, and this might result in transcriptomic changes involving nerve damage and repair. Whether this process involves in the purinergic signaling is unknown. Second, due to the presence of vasculature in TG, whether certain immune cell types, such as macrophages, B cells and T cells are blood-derived or tissue-resident cannot be determined. Nonetheless, we also cannot rule out a role for these cells in TG. Third, this study based on the scRNA-seq to analyze the mRNA expression level of purinergic signaling-associated genes has not been verified at protein levels. Further studies are needed to validate these findings.
Data availability statement
The datasets presented in this study can be found in online repositories. The names of the repository/repositories and accession number(s) can be found below: www.ncbi.nlm.nih.gov/geo/, GSE213105.
Ethics statement
The animal study was reviewed and approved by Animal Care Committee for the Care and Use of Laboratory Animals of Sun Yat-sen University (No. SYSU-IACUC-2020-000245).
Author contributions
SJ: conceptualization, formal analysis, and writing—original draft. JL: data curation, visualization, and software. YC: methodology, visualization, writing—review, and editing. QL: resources, writing—review, and editing. LM: resources and writing—original draft. WF: supervision, writing—review and editing, project administration, and funding acquisition. All authors contributed to the article and approved the submitted version.
Funding
This work was supported by the National Natural Science Foundation of China (Nos. 81771098 and 81541153).
Conflict of interest
The authors declare that the research was conducted in the absence of any commercial or financial relationships that could be construed as a potential conflict of interest.
Publisher’s note
All claims expressed in this article are solely those of the authors and do not necessarily represent those of their affiliated organizations, or those of the publisher, the editors and the reviewers. Any product that may be evaluated in this article, or claim that may be made by its manufacturer, is not guaranteed or endorsed by the publisher.
Supplementary material
The Supplementary Material for this article can be found online at: https://www.frontiersin.org/articles/10.3389/fnmol.2022.1038539/full#supplementary-material
Footnotes
- ^ https://www.sevenbridges.com
- ^ https://www.ncbi.nlm.nih.gov/geo/query/acc.cgi?acc=GSE186421
- ^ http://biocc.hrbmu.edu.cn/CellMarker/
- ^ https://panglaodb.se/
References
Abbracchio, M. P., Burnstock, G., Boeynaems, J. M., Barnard, E. A., Boyer, J. L., Kennedy, C., et al. (2006). International Union Of pharmacology LVIII: Update on the P2Y G protein-coupled nucleotide receptors: From molecular mechanisms and pathophysiology to therapy. Pharmacol. Rev. 58, 281–341. doi: 10.1124/pr.58.3.3
Abraham, E. H., Prat, A. G., Gerweck, L., Seneveratne, T., Arceci, R. J., Kramer, R., et al. (1993). The multidrug resistance (mdr1) gene product functions as an ATP channel. Proc. Natl. Acad. Sci. U.S.A. 90, 312–316. doi: 10.1073/pnas.90.1.312
Ambalavanar, R., Moritani, M., and Dessem, D. (2005). Trigeminal P2X3 receptor expression differs from dorsal root ganglion and is modulated by deep tissue inflammation. Pain 117, 280–291. doi: 10.1016/j.pain.2005.06.029
Antonioli, L., Blandizzi, C., Pacher, P., and Haskó, G. (2013). Immunity, inflammation and cancer: A leading role for adenosine. Nat. Rev. Cancer 13, 842–857. doi: 10.1038/nrc3613
Antonioli, L., Blandizzi, C., Pacher, P., and Haskó, G. (2019). The purinergic system as a pharmacological target for the treatment of immune-mediated inflammatory diseases. Pharmacol. Rev. 71, 345–382. doi: 10.1124/pr.117.014878
Birey, F., Andersen, J., Makinson, C. D., Islam, S., Wei, W., Huber, N., et al. (2017). Assembly of functionally integrated human forebrain spheroids. Nature 545, 54–59. doi: 10.1038/nature22330
Coppi, E., Cherchi, F., Fusco, I., Failli, P., Vona, A., Dettori, I., et al. (2019). Adenosine A3 receptor activation inhibits pronociceptive N-type Ca2+ currents and cell excitability in dorsal root ganglion neurons. Pain 160, 1103–1118. doi: 10.1097/j.pain.0000000000001488
Currò, D., Navarra, P., Samengo, I., and Martire, M. (2020). P2X7 receptors exert a permissive effect on the activation of presynaptic AMPA receptors in rat trigeminal caudal nucleus glutamatergic nerve terminals. J. Headache Pain 21:83.
Delmas, P., and Coste, B. (2020). SnapShot: Orofacial sensation. Cell 183, 284–284.e1. doi: 10.1016/j.cell.2020.08.014
Dong, X., and Dong, X. (2018). Peripheral and central mechanisms of Itch. Neuron 98, 482–494. doi: 10.1016/j.neuron.2018.03.023
Dubin, A. E., and Patapoutian, A. (2010). Nociceptors: The sensors of the pain pathway. J. Clin. Invest. 120, 3760–3772. doi: 10.1172/jci42843
Ford, A., Castonguay, A., Cottet, M., Little, J. W., Chen, Z., Symons-Liguori, A. M., et al. (2015). Engagement of the GABA to KCC2 signaling pathway contributes to the analgesic effects of A3AR agonists in neuropathic pain. J. Neurosci. 35, 6057–6067. doi: 10.1523/jneurosci.4495-14.2015
Franzén, O., Gan, L. M., and Björkegren, J. L. M. (2019). PanglaoDB: A web server for exploration of mouse and human single-cell RNA sequencing data. Database 2019:baz046. doi: 10.1093/database/baz046
Glenn, J. A., Sonceau, J. B., Wynder, H. J., and Thomas, W. E. (1993). Histochemical evidence for microglia-like macrophages in the rat trigeminal ganglion. J. Anat. 183, 475–481.
Gölöncsér, F., Baranyi, M., Iring, A., Hricisák, L., Otrokocsi, L., Benyó, Z., et al. (2021). Involvement of P2Y(12) receptors in a nitroglycerin-induced model of migraine in male mice. Br. J. Pharmacol. 178, 4626–4645. doi: 10.1111/bph.15641
Goto, T., Iwai, H., Kuramoto, E., and Yamanaka, A. (2017). Neuropeptides and ATP signaling in the trigeminal ganglion. Jpn. Dent. Sci. Rev. 53, 117–124. doi: 10.1016/j.jdsr.2017.01.003
Governo, R. J., Deuchars, J., Baldwin, S. A., and King, A. E. (2005). Localization of the NBMPR-sensitive equilibrative nucleoside transporter, ENT1, in the rat dorsal root ganglion and lumbar spinal cord. Brain Res. 1059, 129–138. doi: 10.1016/j.brainres.2005.08.017
Ito, G., Suekawa, Y., Watanabe, M., Takahashi, K., Inubushi, T., Murasaki, K., et al. (2013). P2X7 receptor in the trigeminal sensory nuclear complex contributes to tactile allodynia/hyperalgesia following trigeminal nerve injury. Eur. J. Pain 17, 185–199. doi: 10.1002/j.1532-2149.2012.00174.x
Iwai, H., Ataka, K., Suzuki, H., Dhar, A., Kuramoto, E., Yamanaka, A., et al. (2021). Tissue-resident M2 macrophages directly contact primary sensory neurons in the sensory ganglia after nerve injury. J. Neuroinflammation 18:227. doi: 10.1186/s12974-021-02283-z
Janes, K., Esposito, E., Doyle, T., Cuzzocrea, S., Tosh, D. K., Jacobson, K. A., et al. (2014). A3 adenosine receptor agonist prevents the development of paclitaxel-induced neuropathic pain by modulating spinal glial-restricted redox-dependent signaling pathways. Pain 155, 2560–2567. doi: 10.1016/j.pain.2014.09.016
Kaji, K., Shinoda, M., Honda, K., Unno, S., Shimizu, N., and Iwata, K. (2016). Connexin 43 contributes to ectopic orofacial pain following inferior alveolar nerve injury. Mol. Pain 12:1744806916633704. doi: 10.1177/1744806916633704
Katagiri, A., Shinoda, M., Honda, K., Toyofuku, A., Sessle, B. J., and Iwata, K. (2012). Satellite glial cell P2Y12 receptor in the trigeminal ganglion is involved in lingual neuropathic pain mechanisms in rats. Mol. Pain 8:23. doi: 10.1186/1744-8069-8-23
Kolodziejczyk, A. A., Kim, J. K., Svensson, V., Marioni, J. C., and Teichmann, S. A. (2015). The technology and biology of single-cell RNA sequencing. Mol. Cell 58, 610–620. doi: 10.1016/j.molcel.2015.04.005
Kong, W., Engel, K., and Wang, J. (2004). Mammalian nucleoside transporters. Curr. Drug Metab. 5, 63–84. doi: 10.2174/1389200043489162
Kurisu, R., Saigusa, T., Aono, Y., Hayashi, Y., Hitomi, S., Shimada, M., et al. (2022). Pannexin 1 role in the trigeminal ganglion in infraorbital nerve injury-induced mechanical allodynia. Oral Dis. 1–12. doi: 10.1111/odi.14129 [Epub ahead of print].
Kushnir, R., Cherkas, P. S., and Hanani, M. (2011). Peripheral inflammation upregulates P2X receptor expression in satellite glial cells of mouse trigeminal ganglia: A calcium imaging study. Neuropharmacology 61, 739–746. doi: 10.1016/j.neuropharm.2011.05.019
Li, M., Min, Q., Banton, M. C., and Dun, X. (2021). Single-cell regulatory network inference and clustering identifies cell-type specific expression pattern of transcription factors in mouse sciatic nerve. Front. Cell. Neurosci. 15:676515. doi: 10.3389/fncel.2021.676515
Li, Q., Cheng, Z., Zhou, L., Darmanis, S., Neff, N. F., Okamoto, J., et al. (2019). Developmental heterogeneity of microglia and brain myeloid cells revealed by deep single-cell RNA sequencing. Neuron 101, 207–223.e10. doi: 10.1016/j.neuron.2018.12.006
Lin, J., Zhang, Y. Y., Liu, F., Fang, X. Y., Liu, M. K., Huang, C. L., et al. (2019). The P2Y(14) receptor in the trigeminal ganglion contributes to the maintenance of inflammatory pain. Neurochem. Int. 131:104567. doi: 10.1016/j.neuint.2019.104567
Little, J. W., Ford, A., Symons-Liguori, A. M., Chen, Z., Janes, K., Doyle, T., et al. (2015). Endogenous adenosine A3 receptor activation selectively alleviates persistent pain states. Brain 138, 28–35. doi: 10.1093/brain/awu330
Liu, C., Zhang, Y., Liu, Q., Jiang, L., Li, M., Wang, S., et al. (2018). P2X4-receptor participates in EAAT3 regulation via BDNF-TrkB signaling in a model of trigeminal allodynia. Mol. Pain 14:1744806918795930. doi: 10.1177/1744806918795930
Liu, X., Ma, L., Zhang, S., Ren, Y., and Dirksen, R. T. (2017). CD73 Controls extracellular adenosine generation in the trigeminal nociceptive nerves. J. Dent. Res. 96, 671–677. doi: 10.1177/0022034517692953
Long, T., He, W., Pan, Q., Zhang, S., Zhang, Y., Liu, C., et al. (2018). Microglia P2X4 receptor contributes to central sensitization following recurrent nitroglycerin stimulation. J. Neuroinflammation 15:245. doi: 10.1186/s12974-018-1285-3
Ma, L., Trinh, T., Ren, Y., Dirksen, R. T., and Liu, X. (2016). Neuronal NTPDase3 mediates extracellular ATP degradation in trigeminal nociceptive pathway. PLoS One 11:e0164028. doi: 10.1371/journal.pone.0164028
Maes, S. S., Pype, S., Hoffmann, V. L., Biermans, M., and Meert, T. F. (2012). Antihyperalgesic activity of nucleoside transport inhibitors in models of inflammatory pain in guinea pigs. J. Pain Res. 5, 391–400. doi: 10.2147/jpr.S35108
Magni, G., Merli, D., Verderio, C., Abbracchio, M. P., and Ceruti, S. (2015). P2Y2 receptor antagonists as anti-allodynic agents in acute and sub-chronic trigeminal sensitization: Role of satellite glial cells. Glia 63, 1256–1269. doi: 10.1002/glia.22819
Mapps, A. A., Thomsen, M. B., Boehm, E., Zhao, H., Hattar, S., and Kuruvilla, R. (2022). Diversity of satellite glia in sympathetic and sensory ganglia. Cell Rep. 38:110328. doi: 10.1016/j.celrep.2022.110328
Messlinger, K., and Russo, A. F. (2019). Current understanding of trigeminal ganglion structure and function in headache. Cephalalgia 39, 1661–1674. doi: 10.1177/0333102418786261
Messlinger, K., Balcziak, L. K., and Russo, A. F. (2020). Cross-talk signaling in the trigeminal ganglion: Role of neuropeptides and other mediators. J. Neural. Transm. 127, 431–444. doi: 10.1007/s00702-020-02161-7
Mori, I., Goshima, F., Koshizuka, T., Imai, Y., Kohsaka, S., Koide, N., et al. (2003). Iba1-expressing microglia respond to herpes simplex virus infection in the mouse trigeminal ganglion. Brain Res. Mol. Brain Res. 120, 52–56. doi: 10.1016/j.molbrainres.2003.10.003
Murasaki, K., Watanabe, M., Takahashi, K., Ito, G., Suekawa, Y., Inubushi, T., et al. (2013). P2X7 receptor and cytokines contribute to extra-territorial facial pain. J. Dent. Res. 92, 260–265. doi: 10.1177/0022034512474668
Nguyen, M. Q., Wu, Y., Bonilla, L. S., von Buchholtz, L. J., and Ryba, N. J. P. (2017). Diversity amongst trigeminal neurons revealed by high throughput single cell sequencing. PLoS One 12:e0185543. doi: 10.1371/journal.pone.0185543
Nishida, K., Nomura, Y., Kawamori, K., Moriyama, Y., and Nagasawa, K. (2014). Expression profile of vesicular nucleotide transporter (VNUT, SLC17A9) in subpopulations of rat dorsal root ganglion neurons. Neurosci. Lett. 579, 75–79. doi: 10.1016/j.neulet.2014.07.017
North, R. A. (2002). Molecular physiology of P2X receptors. Physiol. Rev. 82, 1013–1067. doi: 10.1152/physrev.00015.2002
Nowodworska, A., van den Maagdenberg, A., Nistri, A., and Fabbretti, E. (2017). In situ imaging reveals properties of purinergic signalling in trigeminal sensory ganglia in vitro. Purinergic Signal. 13, 511–520. doi: 10.1007/s11302-017-9576-1
Paul, A., Crow, M., Raudales, R., He, M., Gillis, J., and Huang, Z. J. (2017). Transcriptional architecture of synaptic communication delineates GABAergic neuron identity. Cell 171, 522–539.e20. doi: 10.1016/j.cell.2017.08.032
Reigada, D., and Mitchell, C. H. (2005). Release of ATP from retinal pigment epithelial cells involves both CFTR and vesicular transport. Am. J. Physiol. Cell Physiol. 288:C132–C140. doi: 10.1152/ajpcell.00201.2004
Sawada, K., Echigo, N., Juge, N., Miyaji, T., Otsuka, M., Omote, H., et al. (2008). Identification of a vesicular nucleotide transporter. Proc. Natl. Acad. Sci. U.S.A. 105, 5683–5686. doi: 10.1073/pnas.0800141105
Sawynok, J., and Liu, X. J. (2003). Adenosine in the spinal cord and periphery: Release and regulation of pain. Prog. Neurobiol. 69, 313–340. doi: 10.1016/s0301-0082(03)00050-9
Shinoda, M., Kawashima, K., Ozaki, N., Asai, H., Nagamine, K., and Sugiura, Y. (2007). P2X3 receptor mediates heat hyperalgesia in a rat model of trigeminal neuropathic pain. J. Pain 8, 588–597. doi: 10.1016/j.jpain.2007.03.001
Shinoda, M., Ozaki, N., Asai, H., Nagamine, K., and Sugiura, Y. (2005). Changes in P2X3 receptor expression in the trigeminal ganglion following monoarthritis of the temporomandibular joint in rats. Pain 116, 42–51. doi: 10.1016/j.pain.2005.03.042
Singh, A. K., Mahalingam, R., Squillace, S., Jacobson, K. A., Tosh, D. K., Dharmaraj, S., et al. (2022). Targeting the A(3) adenosine receptor to prevent and reverse chemotherapy-induced neurotoxicities in mice. Acta Neuropathol. Commun. 10:11. doi: 10.1186/s40478-022-01315-w
Sowa, N. A., Voss, M. K., and Zylka, M. J. (2010). Recombinant ecto-5’-nucleotidase (CD73) has long lasting antinociceptive effects that are dependent on adenosine A1 receptor activation. Mol. Pain 6:20. doi: 10.1186/1744-8069-6-20
Spray, D. C., Iglesias, R., Shraer, N., Suadicani, S. O., Belzer, V., Hanstein, R., et al. (2019). Gap junction mediated signaling between satellite glia and neurons in trigeminal ganglia. Glia 67, 791–801. doi: 10.1002/glia.23554
Staikopoulos, V., Sessle, B. J., Furness, J. B., and Jennings, E. A. (2007). Localization of P2X2 and P2X3 receptors in rat trigeminal ganglion neurons. Neuroscience 144, 208–216. doi: 10.1016/j.neuroscience.2006.09.035
Stuart, T., Butler, A., Hoffman, P., Hafemeister, C., Papalexi, E., Mauck, W. M. III, et al. (2019). Comprehensive integration of single-cell data. Cell 177, 1888–1902.e21. doi: 10.1016/j.cell.2019.05.031
Su, L., Bai, X., Niu, T., Zhuang, X., Dong, B., Li, Y., et al. (2021a). P2Y1 Purinergic receptor contributes to remifentanil-induced cold hyperalgesia via transient receptor potential melastatin 8-dependent regulation of N-methyl-d-aspartate receptor phosphorylation in dorsal root ganglion. Anesth. Analg. 133, 794–810. doi: 10.1213/ane.0000000000005617
Su, L., Bai, X., Niu, T., Zhuang, X., Dong, B., Wang, G., et al. (2021b). P2Y1 purinergic receptor inhibition attenuated remifentanil-induced postoperative hyperalgesia via decreasing NMDA receptor phosphorylation in dorsal root ganglion. Brain Res. Bull. 177, 352–362. doi: 10.1016/j.brainresbull.2021.10.006
Sugawara, S., Okada, S., Katagiri, A., Saito, H., Suzuki, T., Komiya, H., et al. (2017). Interaction between calcitonin gene-related peptide-immunoreactive neurons and satellite cells via P2Y(12) R in the trigeminal ganglion is involved in neuropathic tongue pain in rats. Eur. J. Oral Sci. 125, 444–452. doi: 10.1111/eos.12382
Tamagawa, T., Shinoda, M., Honda, K., Furukawa, A., Kaji, K., Nagashima, H., et al. (2016). Involvement of microglial P2Y12 signaling in tongue cancer pain. J. Dent. Res. 95, 1176–1182. doi: 10.1177/0022034516647713
Ulmann, L., Hirbec, H., and Rassendren, F. (2010). P2X4 receptors mediate PGE2 release by tissue-resident macrophages and initiate inflammatory pain. Embo J. 29, 2290–2300. doi: 10.1038/emboj.2010.126
Usoskin, D., Furlan, A., Islam, S., Abdo, H., Lönnerberg, P., Lou, D., et al. (2015). Unbiased classification of sensory neuron types by large-scale single-cell RNA sequencing. Nat. Neurosci. 18, 145–153. doi: 10.1038/nn.3881
Wang, G. Y. F., Shi, X. Q., Wu, W., Gueorguieva, M., Yang, M., and Zhang, J. (2018). Sustained and repeated mouth opening leads to development of painful temporomandibular disorders involving macrophage/microglia activation in mice. Pain 159, 1277–1288. doi: 10.1097/j.pain.0000000000001206
Wang, M., Cai, X., Wang, Y., Li, S., Wang, N., Sun, R., et al. (2020). Astragalin alleviates neuropathic pain by suppressing P2X4-mediated signaling in the dorsal root ganglia of Rats. Front. Neurosci. 14:570831. doi: 10.3389/fnins.2020.570831
Wei, W., Sun, Z., He, S., Zhang, W., Chen, S., Cao, Y. N., et al. (2022). Mechanical ventilation induces lung and brain injury through ATP production, P2Y1 receptor activation and dopamine release. Bioengineered 13, 2346–2359. doi: 10.1080/21655979.2021.2022269
Wu, J., Lewis, A. H., and Grandl, J. (2017). Touch, tension, and transduction - the function and regulation of piezo ion channels. Trends Biochem. Sci. 42, 57–71. doi: 10.1016/j.tibs.2016.09.004
Yang, L., Xu, M., Bhuiyan, S. A., Li, J., Zhao, J., Cohrs, R. J., et al. (2022). Human and mouse trigeminal ganglia cell atlas implicates multiple cell types in migraine. Neuron 110, 1806–1821.e8. doi: 10.1016/j.neuron.2022.03.003
Yegutkin, G. G. (2014). Enzymes involved in metabolism of extracellular nucleotides and nucleosides: Functional implications and measurement of activities. Crit. Rev. Biochem. Mol. Biol. 49, 473–497. doi: 10.3109/10409238.2014.953627
Yin, C., Shen, W., Zhang, M., Wen, L., Huang, R., Sun, M., et al. (2021). Inhibitory effects of palmatine on P2X7 receptor expression in trigeminal ganglion and facial pain in trigeminal neuralgia Rats. Front. Cell. Neurosci. 15:672022. doi: 10.3389/fncel.2021.672022
Yin, Y., and Lee, S. Y. (2020). Current view of ligand and lipid recognition by the menthol receptor TRPM8. Trends Biochem. Sci. 45, 806–819. doi: 10.1016/j.tibs.2020.05.008
Keywords: purinergic signaling, purinergic receptor, adenosine triphosphate, trigeminal ganglion, trigeminal neurons, single-cell RNA sequencing
Citation: Jia S, Liu J, Chu Y, Liu Q, Mai L and Fan W (2022) Single-cell RNA sequencing reveals distinct transcriptional features of the purinergic signaling in mouse trigeminal ganglion. Front. Mol. Neurosci. 15:1038539. doi: 10.3389/fnmol.2022.1038539
Received: 07 September 2022; Accepted: 27 September 2022;
Published: 13 October 2022.
Edited by:
Masahito Yamagata, Harvard University, United StatesReviewed by:
Elsa Fabbretti, Independent Researcher, Trieste, ItalyPhillip R. Kramer, Texas A&M University, United States
Copyright © 2022 Jia, Liu, Chu, Liu, Mai and Fan. This is an open-access article distributed under the terms of the Creative Commons Attribution License (CC BY). The use, distribution or reproduction in other forums is permitted, provided the original author(s) and the copyright owner(s) are credited and that the original publication in this journal is cited, in accordance with accepted academic practice. No use, distribution or reproduction is permitted which does not comply with these terms.
*Correspondence: Wenguo Fan, fanweng@mail.sysu.edu.cn
†These authors have contributed equally to this work and share first authorship