The Contribution of L-Type Cav1.3 Channels to Retinal Light Responses
 Liheng Shi
 Janet Ya-An Chang
 Fei Yu1
  Gladys Y.-P. Ko
- 1Department of Veterinary Integrative Biosciences, Texas A&M University, College Station, TX, United States
- 2Texas A&M Institute of Neuroscience, Texas A&M University, College Station, TX, United States
L-type voltage-gated calcium channels (LTCCs) regulate tonic neurotransmitter release from sensory neurons including retinal photoreceptors. There are three types of LTCCs (Cav1.2, Cav1.3, and Cav1.4) expressed in the retina. While Cav1.2 is expressed in all retinal cells including the Müller glia and neurons, Cav1.3 and Cav1.4 are expressed in the retinal neurons with Cav1.4 exclusively expressed in the photoreceptor synaptic terminals. Mutations in the gene encoding Cav1.4 cause incomplete X-linked congenital stationary night blindness in humans. Even though Cav1.3 is present in the photoreceptor inner segments and the synaptic terminals in various vertebrate species, its role in vision is unclear, since genetic alterations in Cav1.3 are not associated with severe vision impairment in humans or in Cav1.3-null (Cav1.3−/−) mice. However, a failure to regulate Cav1.3 was found in a mouse model of Usher syndrome, the most common cause of combined deafness and blindness in humans, indicating that Cav1.3 may contribute to retinal function. In this report, we combined physiological and morphological data to demonstrate the role of Cav1.3 in retinal physiology and function that has been undervalued thus far. Through ex vivo and in vivo electroretinogram (ERG) recordings and immunohistochemical staining, we found that Cav1.3 plays a role in retinal light responses and synaptic plasticity. Pharmacological inhibition of Cav1.3 decreased ex vivo ERG a- and b-wave amplitudes. In Cav1.3−/− mice, their dark-adapted ERG a-, b-wave, and oscillatory potential amplitudes were significantly dampened, and implicit times were delayed compared to the wild type (WT). Furthermore, the density of ribbon synapses was reduced in the outer plexiform layer of Cav1.3−/− mice retinas. Hence, Cav1.3 plays a more prominent role in retinal physiology and function than previously reported.
Introduction
L-type voltage-gated calcium channels (LTCCs) are multi-subunit channel complexes composed of a pore-forming α1 subunit and auxiliary β and α2δ subunits. In the retina and inner ear, LTCCs mediate tonic neurotransmitter release from the ribbon synapses (Barnes and Kelly, 2002; Catterall et al., 2005; Dolphin, 2006). In cochlea hair cells, calcium influx through LTCCs triggers glutamate release from the inner hair cells onto the spiral ganglion neurons and participates in the fine-tuning of frequency detection of sound (Sheets et al., 2012; Joiner and Lee, 2015). In the retina, photoreceptors and bipolar cells release glutamate continuously in the dark as a result of depolarization-evoked activation of LTCCs (Barnes and Kelly, 2002). In addition to neurotransmitter release, LTCCs are involved in the regulation of membrane excitability, resonance properties, endocytosis, and synaptic plasticity at reciprocal synapses in the photoreceptors, bipolar cells, and amacrine cells (Palmer et al., 2003a,b; Hull and von Gersdorff, 2004; Vigh et al., 2005; Hull et al., 2006a). Thus, LTCCs may participate in multiple functions in the retina. There are three types of LTCCα1 subunits, Cav1.2, Cav1.3, and Cav1.4, present in the retina (Morgans, 2001; Barnes and Kelly, 2002; Ko et al., 2007; Lee et al., 2015). Among them, Cav1.4 is strongly expressed at the ribbon synapses (Morgans, 2001; Lee et al., 2015), and its function is the most well-characterized in the retina, since mutations in Cav1.4 cause X-linked incomplete congenital stationary night blindness type 2 (CSNB2) in humans (Bech-Hansen et al., 1998; Liu et al., 2013). This is due to the essential role of Cav1.4 in the formation of ribbon synapses between photoreceptor terminals and the second-order neurons during development (Liu et al., 2013). However, there are small residual inner retinal light responses recorded from CSNB2 patients (Miyake et al., 1986; Bradshaw et al., 2004) suggesting that there might be other LTCCα1 subunits present at the photoreceptor synaptic terminals to transmit light information to the inner retina.
Compared to Cav1.4, the functional roles of Cav1.2 and Cav1.3 are less known in the retina. While Cav1.2 is expressed in all retinal cells including the Müller glia, Cav1.3 is expressed only in the retinal neurons (Xu et al., 2002; Ko et al., 2007). Mutations of Cav1.2 or Cav1.3 cause severe cardiovascular dysfunctions in humans and animals (Seisenberger et al., 2000; Splawski et al., 2004; Striessnig et al., 2014; Pinggera et al., 2015; Pinggera and Striessnig, 2016), and dysregulation of Cav1.3 severely impairs hearing (Platzer et al., 2000; Seisenberger et al., 2000). In Cav1.3-null mutant (Cav1.3−/−) mice, the retina displays mild morphological changes in the outer plexiform layer (OPL) where photoreceptors and secondary neurons form synaptic contacts (Busquet et al., 2010). Even though there is no specific report on vision loss in humans or animals with Cav1.3 mutations, a failure to regulate Cav1.3 is found in a mouse model of Usher syndrome, the most common cause of combined deafness and blindness in humans (Petit, 2001; Kersten et al., 2010; Joiner and Lee, 2015), indicating that Cav1.3 may contribute to retinal function and physiology that requires further investigation.
One potential function of Cav1.3 in the retina may be in adaptive processes to external stimulation. In cultured retinal amacrine and ganglion cells, activation of glutamate receptors causes a rapid internalization of Cav1.3 but not Cav1.2 (Mizuno et al., 2010) suggesting that Cav1.3 is more “plastic” and responsive to potential light/dark stimulations. The plasticity of Cav1.3 may serve as an acute adaptation to protect the inner retinal circuitry against glutamate excitotoxicity (Mizuno et al., 2010). The mRNA and protein expressions of Cav1.3 are rhythmic in circadian oscillations, in which there are more Cav1.3 subunits inserted in the plasma membrane with larger Cav1.3-currents recorded at night than during the day in the avian retina (Ko et al., 2007; Ko M. L. et al., 2009). This indicates that Cav1.3 may participate in fine-tuning the retinal light responses to anticipate the ambient light changes throughout the course of a day (Ko et al., 2007; Ko G. Y. et al., 2009; Ko M. L. et al., 2009). To further understand the role of Cav1.3 in mammalian retinal physiology and function, we employed ex vivo and in vivo ERG studies to decipher the contribution of Cav1.3 to retinal light responses. Using ex vivo ERG recordings, we were able to isolate the a-wave from the b-wave and carefully analyze the contribution of Cav1.3 in the outer (a-wave) and inner (b-wave) retina. We further compared the retinal light responses from both outer and inner retina among the wild type (WT), Cav1.3 heterozygous mutant (Cav1.3+/−), and Cav1.3−/− mice. Combined with our morphological observations, we provide new evidence on the contribution of Cav1.3 to retinal light responses and synaptic transmission.
Materials and Methods
Animals
Male C57BL/6J mice (WT) were purchased from Harlan (Houston, TX, USA) and used at 2–3 months old in this study. The Cav1.3−/− mice (C57BL/6J background) were originally developed by Dr. Jörg Striessnig (University of Innsbruck, Innrain, Innsbruck, Austria; Platzer et al., 2000). The Cav1.3+/− (heterozygous) breeding pair for generating Cav1.3−/− (homozygous knockout) was from Dr. Amy Lee (University of Iowa, Iowa City, IA, USA). The Cav1.3−/−, Cav1.3 +/−, and Cav1.3+/+ (WT) littermates used in this study were produced at Texas A&M University (College Station, TX, USA). All animal experiments were approved by the Institutional Animal Care and Use Committee of Texas A&M University. Mice were housed under temperature and humidity-controlled conditions with 12:12 h light-dark cycles.
HEK Cell Culture and Transfection
The human HEK 293 cell line was purchased from American Type Culture Collection (ATCC, Manassas, VA, USA). The cells were maintained in DMEM (BioWhittaker, Walkersville, MD, USA) containing 10% FBS (HyClone, Pittsburgh, PA, USA), 50 u/ml penicillin/50 μg/ml streptomycin (Sigma-Aldrich, St. Louis, MO, USA), 1 mM sodium pyruvate (Life Technologies, Carlsbad, CA, USA), and 1x non-essential amino acids (Life Technologies) at 37°C under 5% CO2. Cells were cultured on coverslips and placed in a 24-well culture plate. Cells were seeded in each well to 70–80% confluence 24 h prior to the transfection. Transfections were performed using Lipofectamine 2000 Transfection Reagent (Life Technologies) according to the manufacturer's protocol. The calcium channel α2δ1 subunit (rat) expression vector was a gift from Dr. Terrance P. Snutch (University of British Columbia, Vancouver, Canada). The pCDNA-Cav1.2 α1 subunit was originally generated by Dr. Diane Lipscombe (Brown University, Providence, Rhode Island, USA) and distributed through Addgene (Cambridge, MA, USA). The pCDNA-Cav1.3 α1 subunit (mouse) was from Dr. Amy Lee. The pCMV-Sport-β2 subunit (mouse) was purchased from MGC cDNA clones collection (Dharmacon, GE, Lafayette, CO). Up to 500 ng DNA (150 ng for each plasmid) was transfected into the cultured HEK cells, and culture media was exchanged 12 h after transfection. Electrophysiological recordings were carried out 60 h after the transfection.
Patch-Clamp Electrophysiological Recordings
The whole cell patch-clamp recordings for LTCCs were carried out as previously described (Ko et al., 2007; Shi et al., 2009). The external solution was (in mM): 145 TEACl, 9 BaCl2, 0.5 MgCl2, 5.5 glucose, 0.1 NiCl2, and 5 HEPES, pH 7.4 adjusted with TEAOH. The pipette solution was (in mM): 125 Cs acetate, 20 CsCl, 3 MgCl2, 10 EGTA, and 5 HEPES, pH adjusted with CsOH. The holding potential for transfected HEK cells was set at −65 mV. Currents were recorded at room temperature using an A-M Systems model 2400 patch-clamp amplifier (Sequim, WA, USA). Signals were low-pass filtered at 2 kHz and digitized at 5 kHz with Digidata 1550A interface and pCLAMP 10.5 software (Molecular Devices, Sunnyvale, CA, USA). The Ba2+ current was recorded immediately after the whole-cell configuration was formed by gentle suction, and the ramp-voltage command (−80 to +60 mV in 500 ms) was applied to elicit Ba2+ currents. D-cis-diltiazem (diltiazem; Sigma-Aldrich) was first dissolved in water and further diluted in external recording solutions to the appropriate final concentrations as denoted in the results. The cells were first recorded in normal external solution for baseline currents, followed by perfusion with diltiazem (DIL), and the ramp-voltage command was elicited once per minute after perfusion with DIL. The controls were recorded following the same protocol but perfused with an external solution without DIL. The peak current amplitudes were normalized as the percentage (%) to the original baseline amplitude (set at 100%) for each cell recorded.
Ex vivo Electroretinogram (ERG) Recordings
Mice were dark adapted for at least 3 h prior to the recordings. All experiments were performed under dim red light as previously described (Kolesnikov and Kefalov, 2012). This ex vivo ERG recording technique and the configuration of the recording chamber were originally designed by Dr. Vladimir Kefalov (Washington University, St. Louis, MO, USA). Mouse retinas were dissected out in oxygen saturated dissection medium containing 1 mg/ml BSA and 13.6 mg/ml L-15 (Sigma-Aldrich) at 37°C. Retinas were transferred to an ex vivo ERG recording chamber (OcuScience, Henderson, NV, USA) and perfused with a buffer containing (in mM): 112 NaCl, 3.6 KCl, 2.4 MgCl2, 20 NaHCO3, 3 Na succinate, 0.02 EDTA, 10 Glucose, 10 HEPES (pH 7.4), 0.72 mg/ml L-15, 0.1% MEM vitamins, and MEM non-essential amino acids (Sigma-Aldrich) at 37°C. The electrode solution in the recording chamber contained (in mM): 140 NaCl, 2.4 MgCl2, 1.2 CaCl2, 3 HEPES (pH 7.4). In order to isolate the ERG a-wave and observe photoreceptor responses, the perfusion solution was supplemented with 2 mM L-glutamate and 10 μM DL-AP-4, and the electrode solution was supplemented with 2 mM L-glutamate and 10 mM BaCl2 to block the higher order photo-responses (Kolesnikov and Kefalov, 2012). Nitrendipine (EMD Millipore, Billerica, MA) was first dissolved in dimethylsulfoxide (DMSO), and further diluted in the external recording solution to 10 μM as the final concentration. A portable ERG device (OcuScience) was used for ex vivo ERG recordings. The ERG measurements were carried out sequentially at light intensities of 0.1, 0.3, 1.0, and 3.0 cd·s/m2. Each ERG response was an average of 4 light flashes at a specific light intensity. A 1-min recovery period was allowed between different intensities. The amplitudes and implicit times of a- and b-waves were recorded and analyzed by using the ERGView 4.4 software (OcuScience). Ex vivo results were normalized to the original baseline amplitude prior to the perfusion with the calcium channel inhibitors (diltiazem or nitrendipine) and reported as a change in percentage from the original baseline amplitude.
In Vivo ERG Recordings
Male mice at 3 months old were used for in vivo ERG recordings (performed as previously described; Chang et al., 2015). Mice were dark-adapted for at least 8 h then anesthetized with an intraperitoneal injection of Avertin (0.5 mL/25 g-body weight of 2% 2,2,2-tribromoethanol, 1.25% tert-amyl alcohol; Fisher Scientific, Pittsburgh, PA, USA). Pupils were dilated using a single drop of a 1% tropicamide and 2.5% phenylephrine mixture for 5 min. Mice were placed on a heating pad to maintain body temperatures at 37°C. The ground electrode was placed on the tail and the reference electrode placed under the skin in the cheek below the eye. A drop of Goniovisc (Hub Pharmaceuticals, Rancho Cucamonga, CA, USA) was applied on the surface of the cornea to keep it moist, and the threaded recording electrode conjugated to a mini contact lens (Ocuscience) was placed on top of the cornea. A dim red light was used for all preparatory procedures but was turned off during the ERG recording. A portable ERG device was used for measurements of light responses from a series of light stimulations at 0.1, 0.3, 1, 3, 10, and 25 cd·s/m2. Low light intensities (0.1, 0.3, 1.0, and 3.0 cd·s/m2) were flashed four times at 10 s intervals and the traces were averaged for a final ERG measurement. High light intensities (10 and 25 cd·s/m2) only had one flash. A 1 min recovery period was programmed between each light intensity. Amplitudes and implicit times of a- and b-waves were recorded and analyzed, and the oscillatory potentials were band-pass filtered between 100 and 300 Hz using the ERGView 4.4 software. The a-wave implicit time was measured from the onset of the light stimulus to the most hyperpolarized point (trough) of the a-wave, while the b-wave implicit time was measured from the onset of the light stimulus to the highest peak of the b-wave.
Immunohistochemistry
Cav1.3−/− and Cav1.3+/+ (WT) littermate mice were first anesthetized with isoflurane followed by cervical dislocation. The eyes were excised and fixed in Zamboni fixative (American Matertech Scientific Inc, Lodi, CA, USA) then cryo-protected in a 30% sucrose-PBS solution. Cav1.3−/− and Cav1.3+/+ eyes were embedded side by side in Tissue-Tek O.C.T. Compound (Sakura Finetek Inc, Torrance, CA, USA) and stored at −80°C. The frozen eye sections (10 μm) were cut using a cryostat (Leica Biosystem, Buffalo Grove, IL, USA) and mounted on glass slides. The sections were washed with PBS and incubated with a blocking solution containing 10% goat serum for 2 h at room temperature, followed by incubation with the primary antibodies (anti-Ribeye+anti-Cav1.4 or anti-Cav1.3 alone) at 4°C overnight. Sections were then washed three times with PBS containing 0.1% Triton 100 (PBST), incubated with a secondary antibody at room temperature for 2 h in a dark chamber, washed with PBST, and covered with the ProLong Gold antifade reagents containing 4′,6-diamidino-2-phenylindole (DAPI; Life Technologies) and a glass coverslip. The primary antibodies used were rabbit anti-Cav1.3 (1:100; Chemicon/Millipore Sigma, St. Louis, MO, USA), mouse anti-ribeye (1:100; Millipore) and rabbit anti-Cav1.4 (1:1000; a generous gift from Dr. Amy Lee, University of Iowa, Iowa City, IA). The secondary antibodies used were Alexa fluor 488 goat anti-rabbit IgG (1:200; Life Technologies) and Cy5 goat anti-mouse IgG (1:200; Abcam, Cambridge, MA, USA). The images were captured with a Zeiss LSM 780 NLO Multiphoton Microscope (Carl Zeiss AG, Oberkochen, Germany). The images from WT or Cav1.3−/− were taken under the identical setting (light intensity, magnification, and capture time) for Ribeye or Cav1.4.
Quantification of Ribeye positive and Cav1.4 positive synaptic terminals: After images were captured, we used “Fiji,” an image processing package that is an open-source platform for biological image analysis (Schindelin et al., 2012) to analyze our images. The “analyze particle” function in the Image J (software in “Fiji”) to quantify all fluorescent positive structures (as in pixels). Briefly, the threshold of individual fluorescent channel (red for Ribeye positive and green for Cav1.4 positive) was automatically adjusted. The setting in the Image J software: particle size was from 0 to infinity, and circularity was from 0 to 1.0. We also used the “Coloc 2” (available at https://imagej.net/Coloc_2), a plugin utility to determine the colocalization of Ribeye and Cav1.4. One stained retinal section was used per mouse. Three areas per retinal section were randomly selected. Channel 1 was assigned as red fluorescence (Ribeye positive), and channel 2 was assigned as green fluorescence (Cav1.4 positive). The Li's Intensity Correlation Quotient (ICQ) value (Li et al., 2004) was generated to determine the degree of Ribeye and Cav1.4 colocalization: for colocalized staining 0 < ICQ ≤ 0.5; ICQ = ~0 for random staining; for segregated staining 0 > ICQ ≥ −0.5.
Western Blotting
Samples were collected and prepared as described previously (Ko M. L. et al., 2009; Huang et al., 2013; Lin et al., 2015). Retinas were homogenized in a Tris lysis solution (50 mM Tris, 1 mM EDTA, 150 mM NaCl, 1% NP-40) including phosphatase (50 mM NaF, 1 mM Na3VO4) and protease inhibitors (Sigma-Aldrich). After centrifugation to remove cellular debris, an equal volume of 2x Laemmli buffer was added to each sample lysate, then the samples were heated at 95°C for 5 min. Proteins were separated by SDS-PAGE (10% gels) for 1–2 h. Proteins were then transferred to nitrocellulose membranes and probed by primary antibodies. The primary antibodies used were rabbit anti-Cav1.3 antibody (1:1,000; Chemicon/ Millipore Sigma) and rabbit anti-actin antibody (1:1,000; Cell Signaling Technology, Danvers, MA, USA). Actin was used for loading controls. The secondary antibody (goat anti-rabbit) conjugated to horseradish peroxidase (1:1,000; Cell Signaling Technology) and the Femto and Pico electrochemiluminescense (ECL) kits (Pierce ThermoFisher Scientific, Waltham, MA, USA) were used to visualize the blots.
Statistical Analyses
All data are presented as mean ± SEM (standard error of mean). Based on this study, as well as previously published data by us and our unpublished results, the data for our patch-clamp electrophysiological recordings, in vivo ERG, ex vivo ERG, and morphological analyses were all in normal distribution. One-way analysis of variance (ANOVA) with Tukey post hoc tests were used for statistical analyses between the various treatment groups or between the WT, Cav1.3+/− (heterozygous mutant), and Cav1.3−/− homozygous mutant groups. The Student's t-test was used to compare between WT and Cav1.3 −/−. Throughout, p < 0.05 was regarded as significant.
Results
Distinguishing Cav1.2 Currents from Cav1.3 through Pharmacological Inhibition
We first determined which pharmacological inhibitor could effectively differentiate Cav1.2 from Cav1.3, since there is no commercially available inhibitor that will selectively block Cav1.2 but not Cav1.3 (Cooper et al., 1987; Xu and Lipscombe, 2001). Among the LTCC inhibitors, dihydropyridines, phenylalkylamines, and benzothiazepines have lower affinities for Cav1.3 compared to Cav1.2 (Cai et al., 1997; Hockerman et al., 2000; Schnee and Ricci, 2003; Baumann et al., 2004; Tarabova et al., 2007; Bissig et al., 2013; Berkowitz et al., 2014). Particularly, the half maximal inhibitory concentration (IC50) of diltiazem (DIL) for Cav1.3 is more than 10 times higher than Cav1.2 (Cai et al., 1997; Hockerman et al., 2000; Schnee and Ricci, 2003; Baumann et al., 2004; Tarabova et al., 2007; Bissig et al., 2013; Berkowitz et al., 2014), so we took advantage of using DIL at a lower concentration to inhibit Cav1.2 with minimal effects on Cav1.3. However, a caveat we faced was that the effectiveness of DIL on Cav1.2 vs. Cav1.3 was not compared in the same cell type or preparation in previous reports (Cai et al., 1997; Hockerman et al., 2000; Schnee and Ricci, 2003; Baumann et al., 2004; Tarabova et al., 2007; Bissig et al., 2013; Berkowitz et al., 2014). Hence, we first set forth using HEK 293 cells transfected with Cav1.2 or Cav1.3 and recorded the LTCC currents to identify a concentration of DIL that would inhibit Cav1.2 without affecting Cav1.3.
The HEK 293 cells were co-transfected with Cav1.2 or Cav1.3 and β2+α2δ1 auxiliary subunits. Ba2+ currents were recorded in the absence or presence of DIL. After 5 min of perfusion, the control cells (extracellular solution added H2O, the vehicle) had a decrease of 20% from the baseline, which was due to the run-down of the current. After 5 min of perfusion with extracellular solution containing DIL (10, 100, or 400 μM), the current amplitudes all decreased to <50% of baseline (data not shown). Since perfusion for 2 min did not elicit any current run-down in the control cells, we chose to compare the inhibitory effects of DIL after 2 min of perfusion to avoid current run-down issues. Extracellular perfusion with 10 or 100 μM DIL for 2 min significantly decreased the Cav1.2-LTCC currents by 27 and 30%, respectively, while perfusion of 400 μM DIL for 2 min further decreased Cav1.2 currents by 71% (Figures 1A–C; Control: 96 ± 4%; DIL 10 μM: 73 ± 6%; DIL 100 μM: 70 ± 4%; DIL 400 μM: 29 ± 4%). However, extracellular perfusion with 10 μM DIL did not inhibit Cav1.3-LTCC currents, while perfusion with 400 μM DIL did (Figures 1D–F; Control: 95 ± 4%; DIL 10 μM: 98 ± 5%; DIL 400 μM: 42 ± 9%). This result indicates that Cav1.2 is more sensitive to DIL inhibition compared to Cav1.3 in transfected HEK cells, so treatments with 10 μM DIL could selectively dampen Cav1.2 with minimal impact on Cav1.3.
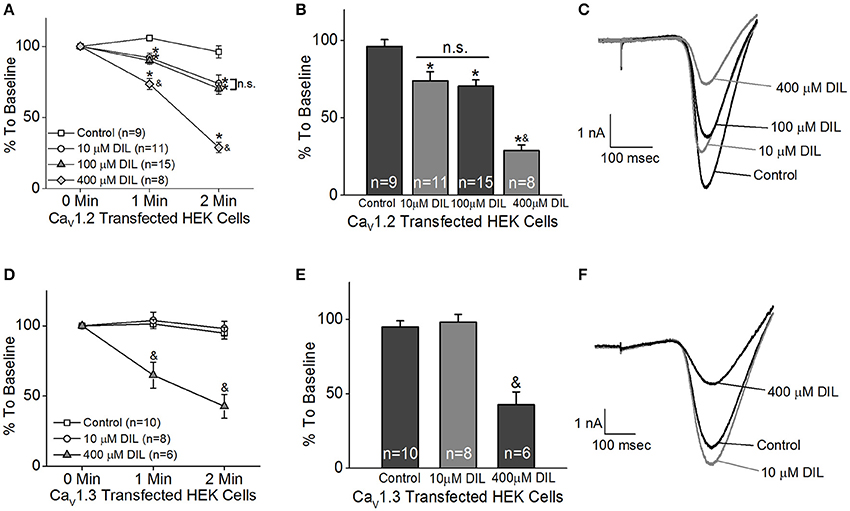
Figure 1. Different concentrations of diltiazem (DIL) are able to differentiate Cav1.2-LTCC from Cav1.3-LTCC currents in cultured HEK cells. The LTCC currents were recorded from Cav1.2-transfected HEK cells (A–C) and Cav1.3-transfected HEK cells (D–F) under the whole-cell patch-clamp configuration. (A) Perfusion with DIL at 10, 100, or 400 μM significantly decreases Cav1.2-LTCC currents recorded from HEK cells transfected with Cav1.2. (B) Perfusion with 10, 100, or 400 μM DIL for 2 min causes a reduction of Cav1.2-LTCC currents. (A,B) The asterisk (*) indicates a statistically significant difference between the control and the 10, 100, and 400 μM DIL groups; “&” indicates that the 400 μM DIL group is statistically different from the other 3 groups; “n.s.” indicates that there is no statistical difference between the 10 and 100 μM DIL groups. (C) Representative traces recorded from the Cav1.2-transfected HEK cells perfused with 0 (control), 10, 100, or 400 μM DIL are shown. (D) Diltiazem (DIL) at 400 μM, but not at 10 μM, causes a decrease in Cav1.3-LTCC currents recorded from HEK cells transfected with Cav1.3. (E) Perfusion with 400 μM DIL for 2 min causes a reduction of Cav1.3-LTCC currents by more than 50%. (D,E) “&” indicates that the 400 μM DIL group is statistically significant from the control and the 10 μM DIL group. (F) Representative traces recorded from the Cav1.3-transfected HEK cells perfused with 0 (control), 10, or 400 μM DIL are shown. *, &p < 0.05.
Inhibition of LTCCs Decreases Retinal Light Sensitivities
The ERG has long been used to determine overall retinal light sensitivities (Newman and Odette, 1984). The ERG a-wave reflects the photoreceptor responses to light stimulation, while the ERG b-wave represents the secondary light-evoked inner retinal responses, which reflects the summation from photoreceptor-bipolar cell synaptic transmission as well as responses from bipolar, amacrine, and Müller cells (Newman and Odette, 1984; Pinto et al., 2007). We employed the ex vivo transretinal ERG technique originally developed by Dr. Vladimir J. Kefalov (Vinberg et al., 2014), which allowed us to further dissect the contributions of LTCCs in retinal light responses from isolated mouse retinas. These ex vivo ERG recordings measure the light-induced voltage changes across the isolated retina from the photoreceptors to the ganglion cell layer (Vinberg et al., 2014), and it significantly improves the signal-to-noise ratio compared to in vivo ERGs and allows for easy assessments of pharmacological treatments in the isolated retina through extracellular perfusion (Kolesnikov and Kefalov, 2012; Vinberg et al., 2014).
Both retinas were isolated from a dark-adapted mouse and placed in a dual-recording chamber. The ex vivo ERG responses elicited at various light intensity flashes were recorded before and after perfusion with LTCC blockers under dim red lighting. We first tested the inhibitory effect of DIL and found that perfusion with 10 μM DIL for 10 min reached its maximal inhibition of the ERG responses, since continuous perfusion at this concentration for 30 min, or perfusion with higher concentrations of DIL (20, 50, or 100 μM), did not further decrease the ERG amplitudes. After ERG responses were first recorded under normal perfusion buffer, 10 μM DIL was perfused for 10 min to inhibit Cav1.2 followed by another round of ERG recordings. Subsequently, after perfusion with 10 μM nitrendipine (NIT) for another 10 min to further inhibit both Cav1.2 and Cav1.3, a third round of ERG responses were recorded. The representative ex vivo ERG waveforms are presented in Figures 2A–D. We found that both DIL and NIT did not significantly affect the ERG a-wave responses (Figures 2E). Inhibition of LTCCs with DIL or NIT largely decreased the ERG b-wave responses (Figures 2F), indicating that Cav1.2 and Cav1.3 were involved in post-photoreceptor and inner retinal light responses.
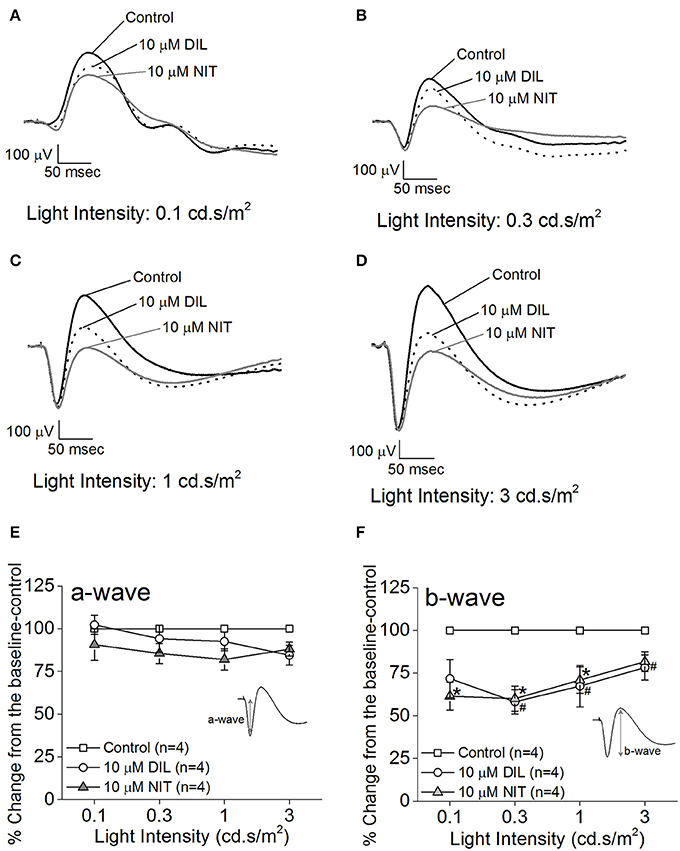
Figure 2. Differential contributions of LTCCs to retinal light responses as measured by ex vivo ERGs. Mice were dark adapted for at least 3 h, and the retinas were excised and placed in an ex vivo ERG recording chamber. The ERG responses were recorded under 4 different light intensities: 0.1, 0.3, 1, and 3 cd·s/m2. The ERG recordings were performed with normal perfusion buffer (Control), followed by perfusion with 10 μM DIL to inhibit Cav1.2, and subsequently perfused with 10 μM nitrendipine (NIT) to block both Cav1.2 and Cav1.3. (A–D) Representative ERG waveforms recorded in different solutions (control, 10 μM DIL, and 10 μM NIT) are shown, which were recorded under light intensities of 0.1, 0.3, 1, and 3 cd·s/m2, respectively. (E) Perfusion with 10 μM DIL or 10 μM NIT for 10 min did not have significant effect on the ERG a-wave amplitudes. (F) Perfusion with 10 μM DIL or 10 μM NIT for 10 min decreased ERG b-wave amplitudes. The asterisk (*) indicates a statistically significant difference between the control and the 10 μM NIT group; “#” indicates that the 10 μM DIL group is statistically different from the control. *, #p < 0.05.
While the ERG a-wave represents the photoreceptor light responses, under higher light intensity stimulations, the a-wave is often contaminated by the rising phase of the b-wave responses. Without pharmacological isolation of the a-wave, there was no specific effect elicited by NIT or DIL determined. In order to assess the role of LTCCs in photoreceptor light responses, we isolated the photoreceptor responses (ERG a-wave) with a perfusion solution containing 2 mM L-glutamate and 10 μM DL-AP-4 and an electrode solution containing 2 mM L-glutamate and 10 mM BaCl2 to block the higher order retinal light responses (Kolesnikov and Kefalov, 2012). After a-wave isolation, we found that both DIL (10 μM) and NIT (10 μM) were able to reduce the ERG a-wave amplitudes but NIT caused a larger decrease (Figures 3A–D), indicating that both Cav1.2 and Cav1.3 were involved in photoreceptor light-evoked responses. In addition, at a lower light intensity stimulation (0.3 cd.s/m2), DIL did not significantly affect the ERG a-wave as it did at higher light intensity stimulations (1 and 3 cd.s/m2), but NIT significantly decreased the ERG a-wave at all three light intensity stimulations. This suggests that Cav1.3 in photoreceptors might be more sensitive to changes in ambient light intensities, which echoes the notion that Cav1.3 is “plastic” in responding to external stimulations. Since NIT and DIL were able to dampen isolated a-wave, this could partially explain the reduction of ex vivo ERG b-wave by NIT and DIL shown in Figure 2.
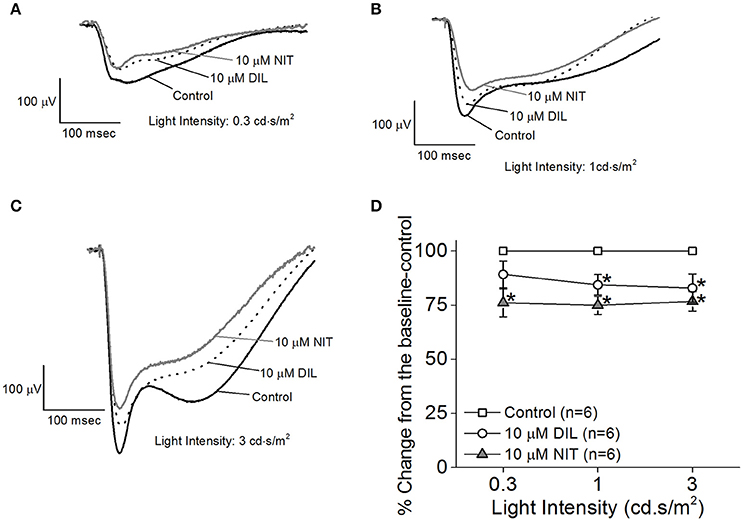
Figure 3. Differential contributions of LTCCs in ex vivo ERG a-wave responses. Mice were dark adapted for at least 3 h, and the retinas were excised and placed in an ex vivo ERG recording chamber. The ERG a-wave (photoreceptor) responses were isolated with a perfusion solution containing 2 mM L-glutamate and 10 μM DL-AP-4 and an electrode solution containing 2 mM L-glutamate and 10 mM BaCl2 to block the higher order of retinal photo-responses. The photoreceptor light responses were recorded under 3 different light intensities: 0.3, 1, and 3 cd·s/m2. The ERG recordings were first done with normal perfusion buffer (Control), followed by perfusion with 10 μM DIL, then perfusion with 10 μM NIT. (A–C) Representative ERG a-waves recorded in different solutions (control, 10 μM DIL, and 10 μM NIT) are shown, under light intensities of 0.3, 1, and 3 cd·s/m2, respectively. (D) Perfusion with 10 μM DIL and 10 μM NIT for 10 min each decreased ERG a-wave amplitudes. The asterisk (*) indicates that the 10 μM DIL or 10 μM NIT group is significantly different from the control. *p < 0.05.
Retinal Light Responses Are Decreased in Both Cav1.3+/− and Cav1.3−/− Mice
Since all Cav (Cav1.2, 1.3, and 1.4) channels are expressed in the retina, our pharmacological studies (Figures 2, 3) could not exclude the possibility that DIL and NIT might inhibit Cav1.4. Thus, to further verify the role of Cav1.3 in retinal light sensitivities, we recorded retinal light responses using in vivo ERG recordings from Cav1.3−/− homozygous null, Cav1.3+/− heterozygous, and wild type (WT) mice at 2.5 months old. Mice were dark adapted overnight for at least 8 h prior to ERG recordings with various light intensities at 0.1, 0.3, 1, 3, 10, and 25 cd·s/m2 (Figure 4A). There were 3 Cav1.3+/+ (WT) mice from the littermates and 5 WT mice purchased from the vendor. There was no statistical difference in the ERG amplitudes and implicit times recorded between these two WT groups, so we merged the data as a single WT group. But both Cav1.3+/− and Cav1.3−/− mice had significantly decreased ERG a-wave amplitudes (Figure 4B) and delayed implicit times (Figure 4C) compared to that of WT mice. Similarly, the ERG b-wave amplitudes were decreased (Figure 4D) and implicit times delayed (Figure 4E) in Cav1.3+/− and Cav1.3−/− mice compared to WT mice (Table 1).
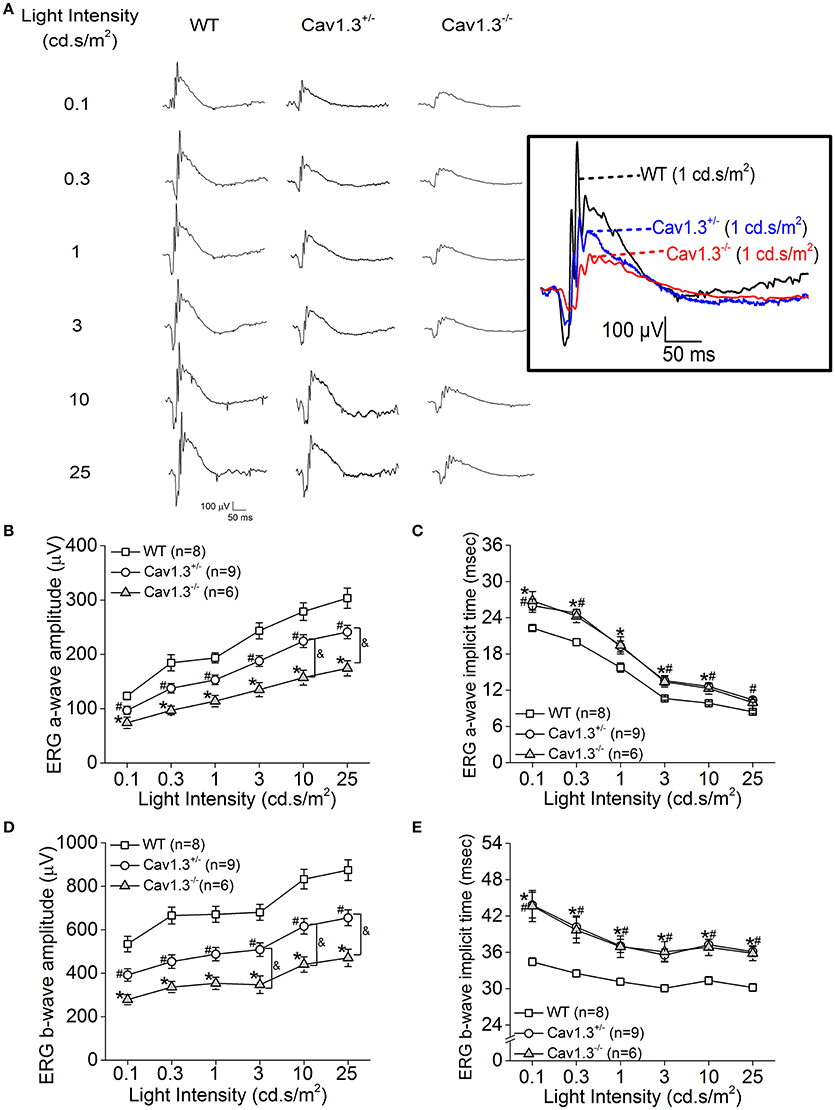
Figure 4. Retinal light responses are decreased in Cav1.3+/− and Cav1.3−/− mutant mice. The scotopic ERG amplitudes are decreased and implicit times delayed in both Cav1.3+/− (heterozygous mutant) and Cav1.3−/− (homozygous mutant) mice compared to the wild type (WT) mice. All mice were dark adapted for at least 8 h. Retinal light responses were measured when mice were exposed to a series of light intensities from 0.1 to 25 cd·s/m2. (A) Representative ERG wave forms recorded from WT (left), Cav1.3+/− (middle), and Cav1.3−/− (right) mouse eyes in response to each stimulating light intensity. The superimposed ERG traces from the WT (black), Cav1.3+/− (blue), and Cav1.3−/− (red) mice elicited at 1 cd.s/m2 light intensity are shown in the box. (B) The average ERG a-wave amplitudes are decreased in Cav1.3+/− and Cav1.3−/− mice compared to the WT. (C) The average ERG a-wave implicit times are increased in Cav1.3+/− and Cav1.3−/− mice compared to the WT. (D) The average ERG b-wave amplitudes are decreased in Cav1.3+/− and Cav1.3−/− mice compared to the WT. (E) The average ERG b-wave implicit times are increased in Cav1.3+/− and Cav1.3−/− mice compared to the WT. The asterisk (*) indicates a statistically significant difference between the WT and Cav1.3−/− mice; “#” indicates a statistically significant difference between the WT and Cav1.3+/− mice; “&” indicates a statistically significant difference between the Cav1.3+/− and Cav1.3−/− mice. *, #, &p < 0.05.
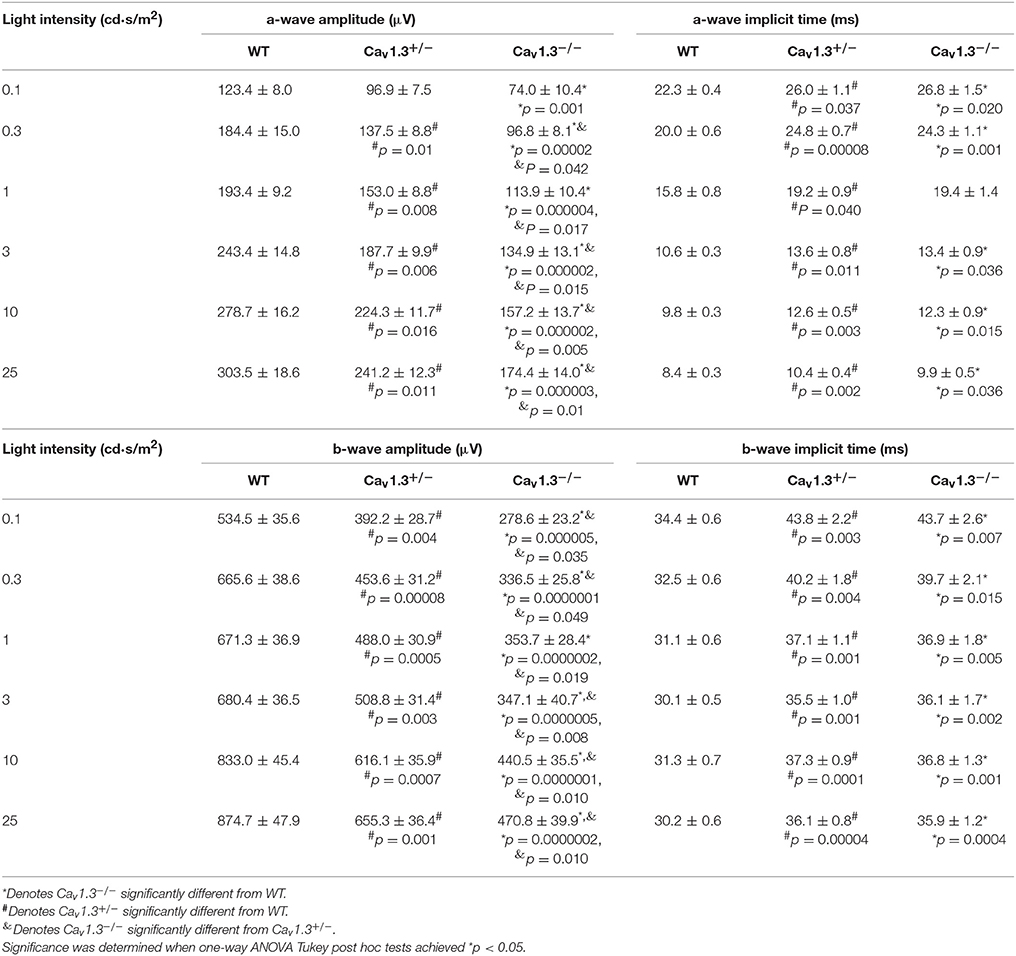
Table 1. Dark-adapted retinal light responses (Data for Figures 4B–E).
We further analyzed the ERG oscillatory potentials (OP1-OP4), which largely represent the inner retinal responses especially from amacrine cells (Wachtmeister and Dowling, 1978; Wachtmeister, 1998; Pinto et al., 2007). Both Cav1.3+/− and Cav1.3−/− mice had decreased OP1-4 amplitudes (Figures 5A,C,E,G) and delayed OP1-4 implicit times (Figures 5B,D,F,H) compared to WT mice (Table 2). Hence, these in vivo ERG data clearly demonstrate that Cav1.3 contributes to both outer and inner retinal light responses.
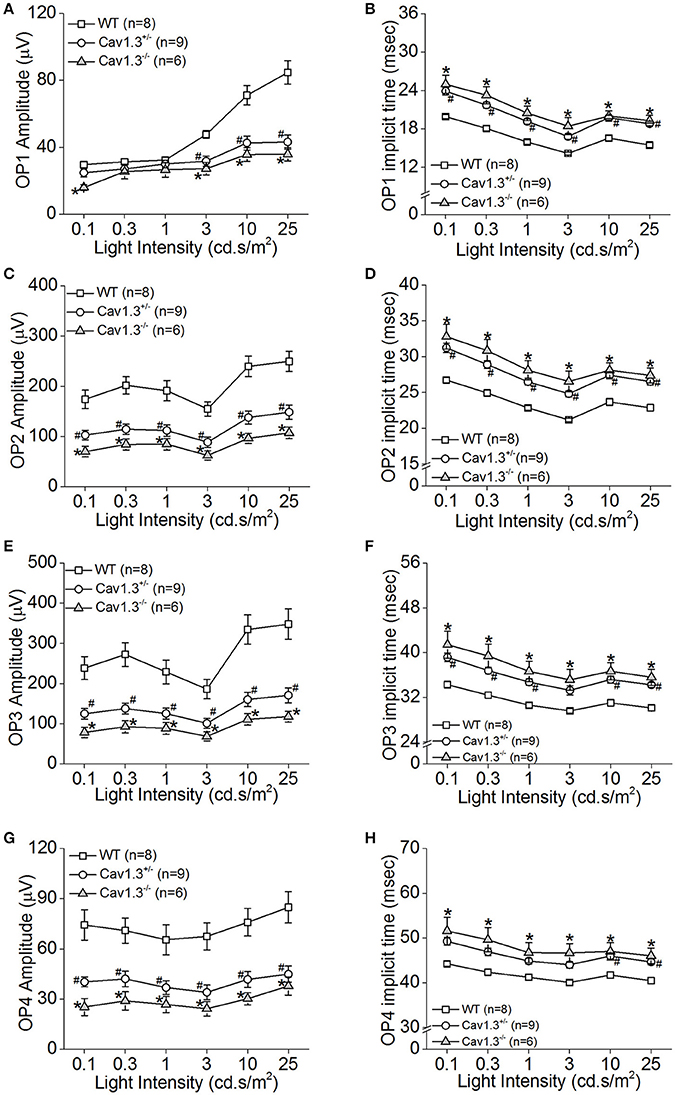
Figure 5. The inner retinal light responses are decreased in Cav1.3+/− and Cav1.3−/− mutant mice. The oscillatory potential (OP) amplitudes are decreased and implicit times delayed in both Cav1.3+/− and Cav1.3−/− mice compared to the wild type (WT). The OPs were analyzed after the scotopic ERG responses were filtered between 100 and 300 Hz band-pass using the ERGView4.4 software (Ocuscience). (A,B) The average OP1 amplitudes (A) are decreased, but the implicit time (B) is increased in Cav1.3+/− and Cav1.3−/− mice compared to the WT. (C,D) The average OP2 amplitudes (C) are decreased, but the implicit time (D) is increased in Cav1.3+/− and Cav1.3−/− mice compared to the WT. (E,F) The average OP3 amplitudes (E) are decreased, but the implicit time (F) is increased in Cav1.3+/− and Cav1.3−/− mice compared to the WT. (G,H) The average OP4 amplitudes (G) are decreased, but the implicit time (H) is increased in Cav1.3+/− and Cav1.3−/− mice compared to the WT. The asterisk (*) indicates a statistically significant difference between the WT and Cav1.3−/− mice; “#” indicates a statistically significant difference between the WT and Cav1.3+/− mice. *, #p < 0.05.
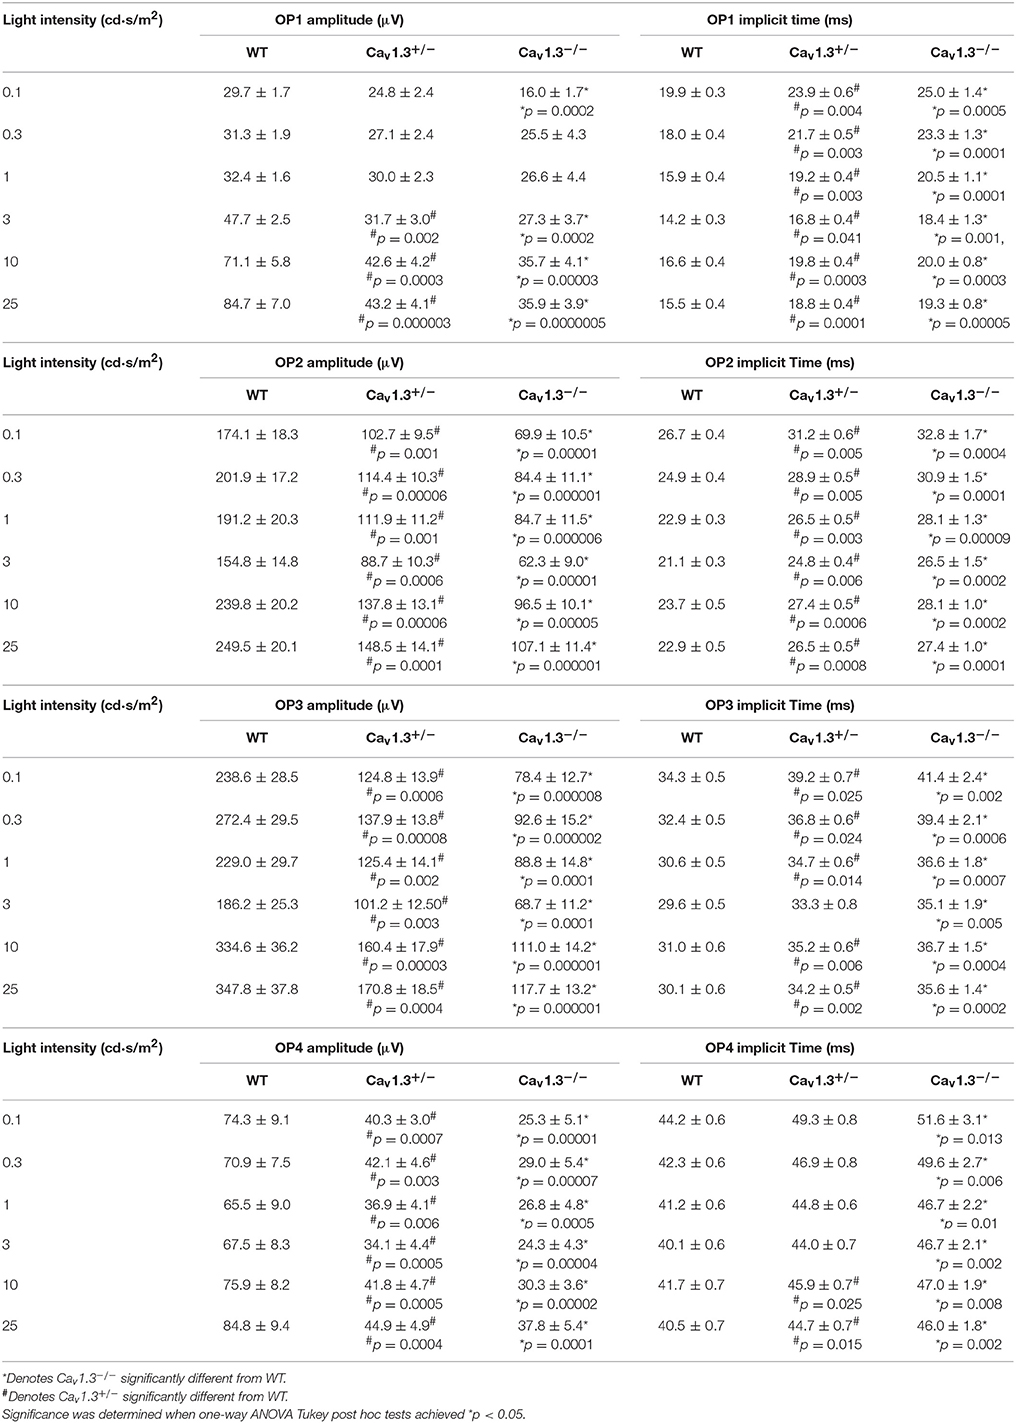
Table 2. Oscillatory Potential Responses (Data for Figures 5A–H).
Deletion of Cav1.3 α1 Subunit Affects the Density of Ribbon Synapses in the Retinal Outer Plexiform Layer (OPL)
Our ERG results revealed that deletion of Cav1.3 had an impact on the retinal light responses, mainly on the b-wave amplitude, suggesting that the light signal from the photoreceptors to the inner retina, as well as the light responses in the inner retinal neurons were dampened. The Cav1.3−/− retina (−/−) had the least protein expression of Cav1.3 compared to the WT or Cav1.3+/− (+/−) retina as shown by Western blots (Figure 6A, right panel, arrow head). Hence, we carried out immunostaining to examine any potential morphological changes in the Cav1.3−/− retina.
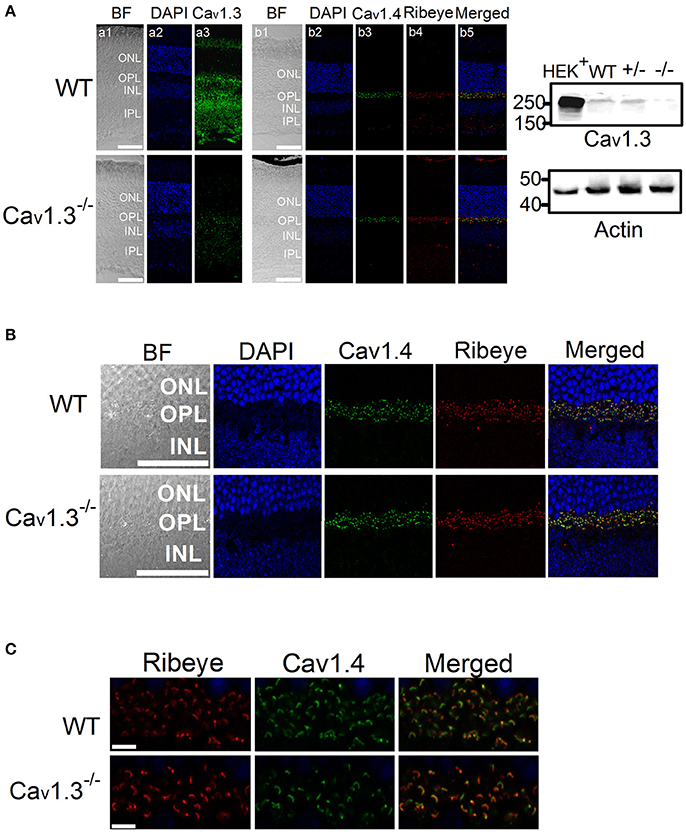
Figure 6. Immunofluorescent changes of Cav1.3, Cav1.4, and Ribeye in Cav1.3−/− mouse retinas. Cav1.3+/+ (WT) and Cav1.3−/− retinal sections (10 μm) were stained for Cav1.3, Cav1.4, and Ribeye. (A) Representative images at a lower magnification (20 X) of WT (upper panel) and Cav1.3−/− (lower panel) retinal sections. DAPI stains the cell nucleus. BF: bright field; ONL: outer nuclear layer; OPL: outer plexiform layer; INL: inner nuclear layer; IPL: inner plexiform layer. The scale bar = 50 μm. Right panel: The Western blots from Cav1.3 transfected HEK cells (HEK+), Cav1.3+/+ (WT) retina, Cav1.3+/− retina, and Cav1.3−/− retina show the protein band of Cav1.3 at ~250 kD. Actin serves as the loading controls. (B) Representative images at a higher magnification (40 X) of WT and Cav1.3−/− retinal sections stained for Cav1.4 and Ribeye. The scale bar = 50 μm. (C) Fluorescent images focused on the OPL at a higher magnification (80 X) from WT and Cav1.3−/− retinal sections are shown. The scale bar = 5 μm. The images taken at this magnification were used for statistical analyses (Table 3).
There was no noticeable morphological change of the overall retinal organization in the Cav1.3−/− retina compared to the WT (Figure 6A). In the WT retina, Cav1.3 was present in the photoreceptor inner segment (IS), outer nuclear layer (ONL), OPL, inner nuclear layer (INL), inner plexiform layer (IPL), and the retinal ganglion cells (Figure 6A). Even though Cav1.3 existed in the OPL, it was not exclusively co-localized with Ribeye at the ribbon synapses (Figure 6B), indicating that Cav1.3 is present at the synaptic terminals but maybe not specifically at the ribbon structure. The Cav1.3 fluorescence in the Cav1.3−/− retinal section could be the background staining.
Since one of the essential roles of LTCCs is governing the tonic release of neurotransmitters from photoreceptors, we focused on the OPL and detected two major proteins (Ribeye and Cav1.4) that are present in the photoreceptor ribbon synapses. Cav1.4 is largely expressed in the OPL, which contains the synaptic terminals of rod and cone photoreceptors (Figure 6A). Staining with Ribeye, ribbon synapses have a horseshoe-like shape in the OPL, and Cav1.4 is mostly co-localized within the synaptic ribbons (Figure 6C), which is consistent with a previous report (Lee et al., 2015). We quantified both Ribeye positive and Cav1.4 positive staining at the OPL using “Fiji” with “Coloc 2” to analyze their colocalization. “Fiji” is an image processing package that is an open-source platform for biological image analysis (Schindelin et al., 2012). The Li's Intensity Correlation Quotient (ICQ) value (Li et al., 2004) was generated in this software package to determine the degree of Ribeye and Cav1.4 colocalization: for colocalized/dependent staining 0 < ICQ ≤ +0.5; ICQ = ~0 for random staining; for segregated staining 0 > ICQ ≥ −0.5. In WT and Cav1.3−/− mouse retinas, Ribeye and Cav1.4 were highly colocalized, with Li's ICQ at ~0.35 for both. With further quantification using Image J to analyze the Ribeye or Cav1.4 positive structure, we found that WT retinas had significantly higher Ribeye positive and Cav1.4 positive structures at the OPL compared to that in the Cav1.3−/− mouse retinas (Table 3, Supplementary Figure 1). Thus, deletion of Cav1.3 had a negative impact on the photoreceptor ribbon synapses.
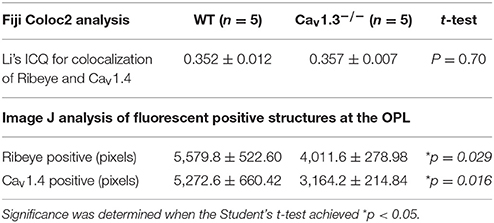
Table 3. Analyses of synaptic structures at the OPL.
Discussion
In rod and cone photoreceptors, Cav1.3 exists in the inner segments, cell bodies, and synaptic terminals (Firth et al., 2001; Xu et al., 2002; Morgans et al., 2005; Hull et al., 2006b; Cristofanilli et al., 2007; Ko et al., 2007). Even though there is no report on obvious visual deficiencies in animals or humans with Cav1.3 mutations, in a previous study (Busquet et al., 2010), a failure to regulate Cav1.3 is found in a mouse model of Usher syndrome, the most common cause of combined deafness and blindness in humans (Petit, 2001; Joiner and Lee, 2015). One Usher protein, USH2D (whirlin), is known to interact with Cav1.3 in the retinal photoreceptors (Kersten et al., 2010). Hence, Cav1.3 may play a role in retinal light responses.
We first used pharmacological blockers to identify the role of Cav1.3 in retinal physiology and function. In previously published reports, the effectiveness of DIL on Cav1.2 vs. Cav1.3 was not compared in the same cell type or preparation (Cai et al., 1997; Hockerman et al., 2000; Schnee and Ricci, 2003; Baumann et al., 2004; Tarabova et al., 2007; Bissig et al., 2013; Berkowitz et al., 2014), so we set forth using HEK cells transfected with Cav1.2 or Cav1.3 and identified that DIL at 10 μM effectively inhibited Cav1.2 but not Cav1.3 (Figure 1). By applying 10 μM DIL or NIT in our ex vivo ERG studies, we found that both Cav1.2 and Cav1.3 contributed to retinal light responses (Figures 2, 3). Unfortunately, we could not completely distinguish the contribution of Cav1.2 from Cav1.3 in ex vivo retinal light responses, even though ex vivo ERG recordings have enhanced signal-to-noise ratios compared to in vivo ERGs and allow easy assessments of pharmacological treatments in the isolated retina (Kolesnikov and Kefalov, 2012; Vinberg et al., 2014). One possible explanation is that DIL and NIT might also affect Cav1.4 in the retina. Thus, we next used a genetic strategy to verify the role of Cav1.3 in retinal function.
We used Cav1.3-null mice (Cav1.3−/−) to further verify the role of Cav1.3 in retinal light responses recorded by ERG. While the ERG a-wave reflects the photoreceptor light responses, the ERG b-wave represents the inner retinal light responses (Pinto et al., 2007), including the light-evoked depolarization of ON bipolar cells (Stockton and Slaughter, 1989) and amacrine cells, especially with the OP components of the b-wave reflecting the amacrine cell responses (Korol et al., 1975; Palmowski-Wolfe et al., 2006). Compared to the WT, the Cav1.3−/− mice had significantly dampened retinal light responses in both ERG a- and b-waves, as well as the OPs (Figures 4, 5 and Tables 1, 2). Interestingly, Cav1.3 is expressed in the lobular appendages of AII amacrine cells (Habermann et al., 2003), and Cav1.3 is responsible for glycine release from the AII amacrine cells (Balakrishnan et al., 2015). Thus, our ERG recordings from Cav1.3 −/− mice with decreased OPs might reflect impaired crossover inhibition from amacrine cells (Menger et al., 1998; Habermann et al., 2003; Balakrishnan et al., 2015).
An alternative explanation is that the decreased OPs and b-wave in Cav1.3−/− mice were caused by impaired neurotransmission from photoreceptors to bipolar cells. Since our immunostaining showed that in Cav1.3−/− mouse retina, there was a significant decrease of Cav1.4 positive ribbon synapses at the OPL. We previously showed that deletion of Cav1.3 decreases the distribution of retinoschisin (RS1) in the retinal OPL (Shi et al., 2017). Retinoschisin is an extracellular adhesion protein mainly secreted from photoreceptors and bipolar cells (Reid et al., 1999, 2003; Reid and Farber, 2005). Mutations in the gene encoding RS1 cause X-linked juvenile retinoschisis that features disorganization of retinal cell layers, disruption of synaptic structures and neurotransmission between photoreceptors and bipolar cells, and progressive photoreceptor degeneration (Weber et al., 2002), since RS1 is critical in stabilizing the synaptic connections during development (Takada et al., 2004; Vijayasarathy et al., 2006, 2008). Retinoschisin interacts with both Cav1.3 and Cav1.4 (Shi et al., 2009, 2017). While LTCCs are critical for RS1 secretion, RS1 augments LTCCs (Ko et al., 2008; Shi et al., 2009, 2017). Thus, the decreased density of synaptic ribbons in the OPL (Figure 6) as well as decreased ERG b-wave in Cav1.3−/− mice might be in part due to the decreased RS1.
In a previous report, with 7-min light pulses, the light peak (LP) of ERGs recorded from Cav1.3−/− is reduced compared to the WT littermates (Wu et al., 2007). The LP of the ERG is caused by a depolarization of the basolateral plasma membrane of the retinal pigment epithelium (RPE). Since Cav1.3 is also expressed in the RPE (Rosenthal et al., 2006), the decreased LP observed in Cav1.3−/− mice further provides evidence that Cav1.3 contributes to retinal light responses. However, contradicting previous reports that Cav1.3−/− mice only have mild decreases in ERG a- and b-waves compared to the WT littermates (Wu et al., 2007; Busquet et al., 2010), we found that the Cav1.3−/− mice had significantly lower ERG a-, b-waves, and OPs compared to the WT littermates and the WT purchased from the vendor. One possible explanation is the recording procedure or instrumentation differences. But in their morphological study, the OPL of the Cav1.3−/− retina has more clusters of puncta or patches when labeled with the synaptic marker Ribeye, differing from the horseshoe-like appearance in the WT retina (Busquet et al., 2010). This observation is similar to our immunostaining with the synaptic ribbon marker Ribeye and Cav1.4 that the ribbon synapse density at the OPL of the Cav1.3−/− mouse retina was decreased compared to the WT (Figure 6, Table 3). Our morphological study showing decreased ribbon synapses in the OPL of Cav1.3−/− retinas echoes the decreased ERG responses recorded from Cav1.3−/− mice. Hence, these results confirm the functional importance of Cav1.3 in retinal physiology.
One major functional role of LTCCs is to govern the tonic neurotransmitter release from the ribbon synapses of photoreceptors and bipolar cells (von Gersdorff et al., 1996; Barnes and Kelly, 2002; Hull et al., 2006b). Both Cav1.3 and Cav1.4 are expressed in the synaptic terminals of photoreceptors. While Cav1.3 is present from the inner segments to synaptic terminals of photoreceptors (Firth et al., 2001; Xu et al., 2002; Morgans et al., 2005; Hull et al., 2006b; Cristofanilli et al., 2007; Ko et al., 2007), Cav1.4 is strongly expressed at the ribbon synapses (Morgans, 2001; Morgans et al., 2005; Liu et al., 2013). Cav1.4 clearly plays a pivotal role in the maintenance of structure and function of the ribbon synapses in the OPL during development, since its deletion causes ribbon synapses to stay in an immature state (Liu et al., 2013). Two major biophysical characteristics of Cav1.4 that differ from other LTCCs are the absence of calcium-dependent inactivation and the slow voltage-dependent inactivation, which make Cav1.4 ideally suited for the tonic calcium influx at the photoreceptor synaptic terminal for neurotransmitter release in the dark (Koschak et al., 2003; McRory et al., 2004). Mutations of cacna1f, the gene encoding Cav1.4, cause CSNB2 (Bech-Hansen et al., 1998; Liu et al., 2013). One would expect a total loss of ERG post-photoreceptor components from CSNB2 patients. However, these patients still have a small residual b-wave with slower kinetics (Bradshaw et al., 2004), indicating that there could be other LTCCs present at the photoreceptor-bipolar cell synapses enabling the inner retina to still respond to light signals. Our results showed the density of photoreceptor ribbon synapses decreased in the OPL of Cav1.3−/− retina, which supports the notion that Cav1.3 also contributes to synaptic transmission in photoreceptors and other inner retinal neurons. In cochlea hair cells, Cav1.3 is required for the maintenance of ribbon synapses, and calcium influx through Cav1.3 fine tunes the size of synaptic ribbons during development (Sheets et al., 2012; Joiner and Lee, 2015). This phenomena has also been observed in pinealocyte synaptic ribbons (Sheets et al., 2012) and might be present in other cell types. Our study sheds light that Cav1.3 may also contribute to the maintenance of photoreceptor ribbon synapses.
Although there is evidence showing the presence of Cav1.4 in bipolar cell synapses (Morgans, 2001), we only detected Cav1.4 in the OPL, not IPL, which is consistent with another study (Lee et al., 2015). Our results suggest that Cav1.3 along with Cav1.2, but not Cav1.4, are the major LTCCs in bipolar cells. Compared to Cav1.2, Cav1.3 activates at a more negative voltage and inactivates more slowly during depolarization. Cav1.3 is less sensitive to dihydropyridine inhibition and calcium-induced inactivation than Cav1.2 (Platzer et al., 2000; Xu and Lipscombe, 2001). These biophysical properties make Cav1.3 more suitable to trigger neurotransmitter release in bipolar cells and sustain their depolarization. Therefore, deletion of Cav1.3 dampens the neuro-signal relay in bipolar cells leading to decreased ERG b-waves.
Another aspect of Cav1.3 function is its role in short-term retina adaptation to external stimulation. Activation of glutamate receptors causes a rapid internalization of Cav1.3 in cultured amacrine and ganglion neurons (Mizuno et al., 2010), suggesting that Cav1.3 is highly responsive to changes in light stimulation, and such plasticity of Cav1.3 may serve as an acute adaptation to protect the inner retinal circuitry against glutamate excitotoxicity (Mizuno et al., 2010). Besides the short-term adaptation that the retina possesses in response to light or dark stimulation, the retina is able to undergo longer term adaptation that can last for hours to days, which includes regulation by the intrinsic retinal circadian oscillators (Green and Besharse, 2004). Interestingly, the retinal light responses measured by ERG are under circadian control (Lu et al., 1995; Manglapus et al., 1998; McGoogan and Cassone, 1999; Cameron et al., 2008; Cameron and Lucas, 2009). While the circadian rhythm of ERG a-waves can be explained by the circadian regulation of cGMP-gated cation channels (Ko et al., 2001, 2003, 2004), the rhythmic changes in ERG b-waves have not yet been clearly defined, in which the circadian rhythm of Cav1.3 (Ko et al., 2007, 2013; Ko M. L. et al., 2009; Huang et al., 2013; Lin et al., 2015) might partially explain the circadian rhythmicity of ERG b-waves. In summary, combining the morphological and physiological data, Cav1.3 contributes to synaptic transmission and inner retinal light responses. The role of Cav1.3 in retinal physiology and function is more prominent than previously reported.
Author Contributions
LS and GK designed the experiment. LS and JC, performed the experiment. LS, JC, FY, and GK analyzed the data. LS, MK, and GK wrote the manuscript. LS, JC, FY, MK, and GK edited the manuscript.
Conflict of Interest Statement
The authors declare that the research was conducted in the absence of any commercial or financial relationships that could be construed as a potential conflict of interest.
Acknowledgments
We thank Dr. Amy Lee (University of Iowa, Iowa City, IA) for generous gifts of pCDNA-Cav1.3 α1 subunit (mouse) and anti-Cav1.4 antibody, and Ms. Jussara Fernandes Hagen in Dr. Amy Lee's laboratory for generating the Cav1.3+/− heterozygous breeding pair. We thank Dr. Terrance P. Snutch (University of British Columbia, Vancouver, Canada) for the calcium channel α2δ1 subunit expression vector. We thank Mr. Andy Kim for technical assistance. We are very grateful for the fruitful comments and insights from Drs. Amy Lee, Jörg Striessnig, and Alexandra Koschak (University of Innsbruck, Innrain, Innsbruck, Austria). This work was supported in part by NIHR21EY023339 to GK.
Supplementary Material
The Supplementary Material for this article can be found online at: https://www.frontiersin.org/articles/10.3389/fnmol.2017.00394/full#supplementary-material
Supplementary Figure 1. Statistical analyses of synaptic structures at OPL (the Table 3 data plotted). Each datum point represents the average from a single mouse retina. N = 5 (mice) for each group. *p < 0.05.
References
Balakrishnan, V., Puthussery, T., Kim, M. H., Taylor, W. R., and Von Gersdorff, H. (2015). Synaptic vesicle exocytosis at the dendritic lobules of an inhibitory interneuron in the mammalian retina. Neuron 87, 563–575. doi: 10.1016/j.neuron.2015.07.016
Barnes, S., and Kelly, M. E. (2002). Calcium channels at the photoreceptor synapse. Adv. Exp. Med. Biol. 514, 465–476. doi: 10.1007/978-1-4615-0121-3_28
Baumann, L., Gerstner, A., Zong, X., Biel, M., and Wahl-Schott, C. (2004). Functional characterization of the L-type Ca2+ channel Cav1.4alpha1 from mouse retina. Invest. Ophthalmol. Vis. Sci. 45, 708–713. doi: 10.1167/iovs.03-0937
Bech-Hansen, N. T., Naylor, M. J., Maybaum, T. A., Pearce, W. G., Koop, B., Fishman, G. A., et al. (1998). Loss-of-function mutations in a calcium-channel alpha1-subunit gene in Xp11.23 cause incomplete X-linked congenital stationary night blindness. Nat. Genet. 19, 264–267. doi: 10.1038/947
Berkowitz, B. A., Grady, E. M., and Roberts, R. (2014). Confirming a prediction of the calcium hypothesis of photoreceptor aging in mice. Neurobiol. Aging 35, 1883–1891. doi: 10.1016/j.neurobiolaging.2014.02.020
Bissig, D., Goebel, D., and Berkowitz, B. A. (2013). Diminished vision in healthy aging is associated with increased retinal L-type voltage gated calcium channel ion influx. PLoS ONE 8:e56340. doi: 10.1371/journal.pone.0056340
Bradshaw, K., Allen, L., Trump, D., Hardcastle, A., George, N., and Moore, A. (2004). A comparison of ERG abnormalities in XLRS and XLCSNB. Doc. Ophthalmol. 108, 135–145. doi: 10.1023/B:DOOP.0000036786.22179.44
Busquet, P., Nguyen, N. K., Schmid, E., Tanimoto, N., Seeliger, M. W., Ben-Yosef, T., et al. (2010). CaV1.3 L-type Ca2+ channels modulate depression-like behaviour in mice independent of deaf phenotype. Int. J. Neuropsychopharmacol. 13, 499–513. doi: 10.1017/S1461145709990368
Cai, D., Mulle, J. G., and Yue, D. T. (1997). Inhibition of recombinant Ca2+ channels by benzothiazepines and phenylalkylamines: class-specific pharmacology and underlying molecular determinants. Mol. Pharmacol. 51, 872–881.
Cameron, M. A., Barnard, A. R., and Lucas, R. J. (2008). The electroretinogram as a method for studying circadian rhythms in the mammalian retina. J. Genet. 87, 459–466. doi: 10.1007/s12041-008-0068-5
Cameron, M. A., and Lucas, R. J. (2009). Influence of the rod photoresponse on light adaptation and circadian rhythmicity in the cone ERG. Mol. Vis. 15, 2209–2216. Available online at: http://www.molvis.org/molvis/v15/a238
Catterall, W. A., Perez-Reyes, E., Snutch, T. P., and Striessnig, J. (2005). International union of pharmacology. XLVIII. nomenclature and structure-function relationships of voltage-gated calcium channels. Pharmacol. Rev. 57, 411–425. doi: 10.1124/pr.57.4.5
Chang, R. C., Shi, L., Huang, C. C., Kim, A. J., Ko, M. L., Zhou, B., et al. (2015). High-fat diet-induced retinal dysfunction. Invest. Ophthalmol. Vis. Sci. 56, 2367–2380. doi: 10.1167/iovs.14-16143
Cooper, C. L., Vandaele, S., Barhanin, J., Fosset, M., Lazdunski, M., and Hosey, M. M. (1987). Purification and characterization of the dihydropyridine-sensitive voltage-dependent calcium channel from cardiac tissue. J. Biol. Chem. 262, 509–512.
Cristofanilli, M., Mizuno, F., and Akopian, A. (2007). Disruption of actin cytoskeleton causes internalization of Ca(v)1.3 (alpha 1D) L-type calcium channels in salamander retinal neurons. Mol. Vis. 13, 1496–1507.
Dolphin, A. C. (2006). A short history of voltage-gated calcium channels. Br. J Pharmacol. 147(Suppl. 1), S56–S62. doi: 10.1038/sj.bjp.0706442
Firth, S. I., Morgan, I. G., Boelen, M. K., and Morgans, C. W. (2001). Localization of voltage-sensitive L-type calcium channels in the chicken retina. Clin. Experiment. Ophthalmol. 29, 183–187. doi: 10.1046/j.1442-9071.2001.00401.x
Green, C. B., and Besharse, J. C. (2004). Retinal circadian clocks and control of retinal physiology. J. Biol. Rhythms 19, 91–102. doi: 10.1177/0748730404263002
Habermann, C. J., O'brien, B. J., Wassle, H., and Protti, D. A. (2003). All amacrine cells express L-type calcium channels at their output synapses. J. Neurosci. 23, 6904–6913.
Hockerman, G. H., Dilmac, N., Scheuer, T., and Catterall, W. A. (2000). Molecular determinants of diltiazem block in domains IIIS6 and IVS6 of L-type Ca2+ channels. Mol. Pharmacol. 58, 1264–1270.
Huang, C. C., Ko, M. L., and Ko, G. Y. (2013). A new functional role for mechanistic/mammalian target of rapamycin complex 1 (mTORC1) in the circadian regulation of L-type voltage-gated calcium channels in avian cone photoreceptors. PLoS ONE 8:e73315. doi: 10.1371/journal.pone.0073315
Hull, C., Li, G. L., and Von Gersdorff, H. (2006a). GABA transporters regulate a standing GABAC receptor-mediated current at a retinal presynaptic terminal. J. Neurosci. 26, 6979–6984. doi: 10.1523/JNEUROSCI.1386-06.2006
Hull, C., Studholme, K., Yazulla, S., and Von Gersdorff, H. (2006b). Diurnal changes in exocytosis and the number of synaptic ribbons at active zones of an ON-type bipolar cell terminal. J. Neurophysiol. 96, 2025–2033. doi: 10.1152/jn.00364.2006
Hull, C., and von Gersdorff, H. (2004). Fast endocytosis is inhibited by GABA-mediated chloride influx at a presynaptic terminal. Neuron 44, 469–482. doi: 10.1016/j.neuron.2004.10.010
Joiner, M. L., and Lee, A. (2015). Voltage-gated Cav1 channels in disorders of vision and hearing. Curr. Mol. Pharmacol. 8, 143–148. doi: 10.2174/1874467208666150507104937
Kersten, F. F., Van Wijk, E., Van Reeuwijk, J., Van Der Zwaag, B., Marker, T., Peters, T. A., et al. (2010). Association of whirlin with Cav1.3 (alpha1D) channels in photoreceptors, defining a novel member of the usher protein network. Invest. Ophthalmol. Vis. Sci. 51, 2338–2346. doi: 10.1167/iovs.09-4650
Ko, G. Y., Ko, M. L., and Dryer, S. E. (2001). Circadian regulation of cGMP-gated cationic channels of chick retinal cones. Erk MAP Kinase and Ca2+/calmodulin-dependent protein kinase II. Neuron 29, 255–266. doi: 10.1016/S0896-6273(01)00195-7
Ko, G. Y., Ko, M. L., and Dryer, S. E. (2003). Circadian phase-dependent modulation of cGMP-gated channels of cone photoreceptors by dopamine and D2 agonist. J. Neurosci. 23, 3145–3153.
Ko, G. Y., Ko, M. L., and Dryer, S. E. (2004). Circadian regulation of cGMP-gated channels of vertebrate cone photoreceptors: role of cAMP and Ras. J. Neurosci. 24, 1296–1304. doi: 10.1523/JNEUROSCI.3560-03.2004
Ko, G. Y., Shi, L., and Ko, M. L. (2009). Circadian regulation of ion channels and their functions. J. Neurochem. 110, 1150–1169. doi: 10.1111/j.1471-4159.2009.06223.x
Ko, M. L., Jian, K., Shi, L., and Ko, G. Y. (2009). Phosphatidylinositol 3 kinase-Akt signaling serves as a circadian output in the retina. J. Neurochem. 108, 1607–1620. doi: 10.1111/j.1471-4159.2009.05931.x
Ko, M. L., Liu, Y., Dryer, S. E., and Ko, G. Y. (2007). The expression of L-type voltage-gated calcium channels in retinal photoreceptors is under circadian control. J. Neurochem. 103, 784–792. doi: 10.1111/j.1471-4159.2007.04816.x
Ko, M. L., Liu, Y., Shi, L., Trump, D., and Ko, G. Y. (2008). Circadian regulation of retinoschisin in the chick retina. Invest. Ophthalmol. Vis. Sci. 49, 1615–1621. doi: 10.1167/iovs.07-1189
Ko, M. L., Shi, L., Huang, C. C., Grushin, K., Park, S. Y., and Ko, G. Y. (2013). Circadian phase-dependent effect of nitric oxide on L-type voltage-gated calcium channels in avian cone photoreceptors. J. Neurochem. 127, 314–328. doi: 10.1111/jnc.12384
Kolesnikov, A. V., and Kefalov, V. J. (2012). Transretinal ERG recordings from mouse retina: rod and cone photoresponses. J. Vis. Exp. e3424. doi: 10.3791/3424
Korol, S., Leuenberger, P. M., Englert, U., and Babel, J. (1975). in vivo effects of glycine on retinal ultrastructure and averaged electroretinogram. Brain Res. 97, 235–251. doi: 10.1016/0006-8993(75)90447-3
Koschak, A., Reimer, D., Walter, D., Hoda, J. C., Heinzle, T., Grabner, M., et al. (2003). Cav1.4alpha1 subunits can form slowly inactivating dihydropyridine-sensitive L-type Ca2+ channels lacking Ca2+-dependent inactivation. J. Neurosci. 23, 6041–6049.
Lee, A., Wang, S., Williams, B., Hagen, J., Scheetz, T. E., and Haeseleer, F. (2015). Characterization of Cav1.4 complexes (alpha11.4, beta2, and alpha2delta4) in HEK293T cells and in the retina. J. Biol. Chem. 290, 1505–1521. doi: 10.1074/jbc.M114.607465
Li, Q., Lau, A., Morris, T. J., Guo, L., Fordyce, C. B., and Stanley, E. F. (2004). A syntaxin 1, Galpha(o), and N-type calcium channel complex at a presynaptic nerve terminal: analysis by quantitative immunocolocalization. J. Neurosci. 24, 4070–4081. doi: 10.1523/JNEUROSCI.0346-04.2004
Lin, X., Xu, X. Y., Chen, Q. S., and Huang, C. (2015). Clinical significance of microRNA-34a in esophageal squamous cell carcinoma. Genet. Mol. Res. 14, 17684–17691. doi: 10.4238/2015.December.21.41
Liu, X., Kerov, V., Haeseleer, F., Majumder, A., Artemyev, N., Baker, S. A., et al. (2013). Dysregulation of Ca(v)1.4 channels disrupts the maturation of photoreceptor synaptic ribbons in congenital stationary night blindness type 2. Channels 7, 514–523. doi: 10.4161/chan.26376
Lu, J., Zoran, M. J., and Cassone, V. M. (1995). Daily and circadian variation in the electroretinogram of the domestic fowl: effects of melatonin. J. Comp. Physiol. A 177, 299–306. doi: 10.1007/BF00192419
Manglapus, M. K., Uchiyama, H., Buelow, N. F., and Barlow, R. B. (1998). Circadian rhythms of rod-cone dominance in the Japanese quail retina. J. Neurosci. 18, 4775–4784.
McGoogan, J. M., and Cassone, V. M. (1999). Circadian regulation of chick electroretinogram: effects of pinealectomy and exogenous melatonin. Am. J. Physiol. 277, R1418–R1427.
McRory, J. E., Hamid, J., Doering, C. J., Garcia, E., Parker, R., Hamming, K., et al. (2004). The CACNA1F gene encodes an L-type calcium channel with unique biophysical properties and tissue distribution. J. Neurosci. 24, 1707–1718. doi: 10.1523/JNEUROSCI.4846-03.2004
Menger, N., Pow, D. V., and Wässle, H. (1998). Glycinergic amacrine cells of the rat retina. J. Comp. Neurol. 401, 34–46. doi: 10.1002/(SICI)1096-9861(19981109)401:1<34::AID-CNE3>3.0.CO;2-P
Miyake, Y., Yagasaki, K., Horiguchi, M., Kawase, Y., and Kanda, T. (1986). Congenital stationary night blindness with negative electroretinogram. A new classification. Arch. Ophthalmol. 104, 1013–1020. doi: 10.1001/archopht.1986.01050190071042
Mizuno, F., Barabas, P., Krizaj, D., and Akopian, A. (2010). Glutamate-induced internalization of Ca(v)1.3 L-type Ca(2+) channels protects retinal neurons against excitotoxicity. J. Physiol. 588, 953–966. doi: 10.1113/jphysiol.2009.181305
Morgans, C. W. (2001). Localization of the alpha(1F) calcium channel subunit in the rat retina. Invest. Ophthalmol. Vis. Sci. 42, 2414–2418.
Morgans, C. W., Bayley, P. R., Oesch, N. W., Ren, G., Akileswaran, L., and Taylor, W. R. (2005). Photoreceptor calcium channels: insight from night blindness. Vis. Neurosci. 22, 561–568. doi: 10.1017/S0952523805225038
Newman, E. A., and Odette, L. L. (1984). Model of electroretinogram b-wave generation: a test of the K+ hypothesis. J. Neurophysiol. 51, 164–182.
Palmer, M. J., Hull, C., Vigh, J., and Von Gersdorff, H. (2003a). Synaptic cleft acidification and modulation of short-term depression by exocytosed protons in retinal bipolar cells. J. Neurosci. 23, 11332–11341.
Palmer, M. J., Taschenberger, H., Hull, C., Tremere, L., and Von Gersdorff, H. (2003b). Synaptic activation of presynaptic glutamate transporter currents in nerve terminals. J. Neurosci. 23, 4831–4841.
Palmowski-Wolfe, A. M., Perez, M. T., Behnke, S., Fuss, G., Martziniak, M., and Ruprecht, K. W. (2006). Influence of dopamine deficiency in early Parkinson's disease on the slow stimulation multifocal-ERG. Doc. Ophthalmol. 112, 209–215. doi: 10.1007/s10633-006-0008-8
Petit, C. (2001). Usher syndrome: from genetics to pathogenesis. Annu. Rev. Genomics Hum. Genet. 2, 271–297. doi: 10.1146/annurev.genom.2.1.271
Pinggera, A., Lieb, A., Benedetti, B., Lampert, M., Monteleone, S., Liedl, K. R., et al. (2015). CACNA1D de novo mutations in autism spectrum disorders activate Cav1.3 L-type calcium channels. Biol. Psychiatry 77, 816–822. doi: 10.1016/j.biopsych.2014.11.020
Pinggera, A., and Striessnig, J. (2016). Ca 1.3 (CACNA1D) L-type Ca channel dysfunction in CNS disorders. J. Physiol. 594, 5839–5849. doi: 10.1113/JP270672.
Pinto, L. H., Invergo, B., Shimomura, K., Takahashi, J. S., and Troy, J. B. (2007). Interpretation of the mouse electroretinogram. Doc. Ophthalmol. 115, 127–136. doi: 10.1007/s10633-007-9064-y
Platzer, J., Engel, J., Schrott-Fischer, A., Stephan, K., Bova, S., Chen, H., et al. (2000). Congenital deafness and sinoatrial node dysfunction in mice lacking class D L-type Ca2+ channels. Cell 102, 89–97. doi: 10.1016/S0092-8674(00)00013-1
Reid, S. N., Akhmedov, N. B., Piriev, N. I., Kozak, C. A., Danciger, M., and Farber, D. B. (1999). The mouse X-linked juvenile retinoschisis cDNA: expression in photoreceptors. Gene 227, 257–266. doi: 10.1016/S0378-1119(98)00578-2
Reid, S. N., and Farber, D. B. (2005). Glial transcytosis of a photoreceptor-secreted signaling protein, retinoschisin. Glia 49, 397–406. doi: 10.1002/glia.20131
Reid, S. N., Yamashita, C., and Farber, D. B. (2003). Retinoschisin, a photoreceptor-secreted protein, and its interaction with bipolar and muller cells. J. Neurosci. 23, 6030–6040.
Rosenthal, R., Bakall, B., Kinnick, T., Peachey, N., Wimmers, S., Wadelius, C., et al. (2006). Expression of bestrophin-1, the product of the VMD2 gene, modulates voltage-dependent Ca2+ channels in retinal pigment epithelial cells. FASEB J. 20, 178–180.
Schindelin, J., Arganda-Carreras, I., Frise, E., Kaynig, V., Longair, M., Pietzsch, T., et al. (2012). Fiji: an open-source platform for biological-image analysis. Nat. Methods 9, 676–682. doi: 10.1038/nmeth.2019
Schnee, M. E., and Ricci, A. J. (2003). Biophysical and pharmacological characterization of voltage-gated calcium currents in turtle auditory hair cells. J. Physiol. 549, 697–717. doi: 10.1113/jphysiol.2002.037481
Seisenberger, C., Specht, V., Welling, A., Platzer, J., Pfeifer, A., Kuhbandner, S., et al. (2000). Functional embryonic cardiomyocytes after disruption of the L-type alpha1C (Cav1.2) calcium channel gene in the mouse. J. Biol. Chem. 275, 39193–39199. doi: 10.1074/jbc.M006467200
Sheets, L., Kindt, K. S., and Nicolson, T. (2012). Presynaptic CaV1.3 channels regulate synaptic ribbon size and are required for synaptic maintenance in sensory hair cells. J. Neurosci. 32, 17273–17286. doi: 10.1523/JNEUROSCI.3005-12.2012
Shi, L., Jian, K., Ko, M. L., Trump, D., and Ko, G. Y. (2009). Retinoschisin, a new binding partner for L-type voltage-gated calcium channels in the retina. J. Biol. Chem. 284, 3966–3975. doi: 10.1074/jbc.M806333200
Shi, L., Ko, M. L., and Ko, G. Y. (2017). Retinoschisin facilitates the function of L-type voltage-gated calcium channels. Front. Cell. Neurosci. 11:232. doi: 10.3389/fncel.2017.00232
Splawski, I., Timothy, K. W., Sharpe, L. M., Decher, N., Kumar, P., Bloise, R., et al. (2004). Ca(V)1.2 calcium channel dysfunction causes a multisystem disorder including arrhythmia and autism. Cell 119, 19–31. doi: 10.1016/j.cell.2004.09.011
Stockton, R. A., and Slaughter, M. M. (1989). B-wave of the electroretinogram. A reflection of ON bipolar cell activity. J. Gen. Physiol. 93, 101–122. doi: 10.1085/jgp.93.1.101
Striessnig, J., Pinggera, A., Kaur, G., Bock, G., and Tuluc, P. (2014). L-type Ca channels in heart and brain. Wiley Interdiscip. Rev. Membr. Transp. Signal. 3, 15–38. doi: 10.1002/wmts.102
Takada, Y., Fariss, R. N., Tanikawa, A., Zeng, Y., Carper, D., Bush, R., et al. (2004). A retinal neuronal developmental wave of retinoschisin expression begins in ganglion cells during layer formation. Invest. Ophthalmol. Vis. Sci. 45, 3302–3312. doi: 10.1167/iovs.04-0156
Tarabova, B., Lacinova, L., and Engel, J. (2007). Effects of phenylalkylamines and benzothiazepines on Ca(v)1.3-mediated Ca2+ currents in neonatal mouse inner hair cells. Eur. J. Pharmacol. 573, 39–48. doi: 10.1016/j.ejphar.2007.06.050
Vigh, J., Li, G. L., Hull, C., and Von Gersdorff, H. (2005). Long-term plasticity mediated by mGluR1 at a retinal reciprocal synapse. Neuron 46, 469–482. doi: 10.1016/j.neuron.2005.03.027
Vijayasarathy, C., Gawinowicz, M. A., Zeng, Y., Takada, Y., Bush, R. A., and Sieving, P. A. (2006). Identification and characterization of two mature isoforms of retinoschisin in murine retina. Biochem. Biophys. Res. Commun. 349, 99–105. doi: 10.1016/j.bbrc.2006.07.202
Vijayasarathy, C., Takada, Y., Zeng, Y., Bush, R. A., and Sieving, P. A. (2008). Organization and molecular interactions of retinoschisin in photoreceptors. Adv. Exp. Med. Biol. 613, 291–297. doi: 10.1007/978-0-387-74904-4_34
Vinberg, F., Kolesnikov, A. V., and Kefalov, V. J. (2014). ex vivo ERG analysis of photoreceptors using an in vivo ERG system. Vision Res. 101, 108–117. doi: 10.1016/j.visres.2014.06.003
von Gersdorff, H., Vardi, E., Matthews, G., and Sterling, P. (1996). Evidence that vesicles on the synaptic ribbon of retinal bipolar neurons can be rapidly released. Neuron 16, 1221–1227. doi: 10.1016/S0896-6273(00)80148-8
Wachtmeister, L. (1998). Oscillatory potentials in the retina: what do they reveal. Prog. Retin. Eye Res. 17, 485–521. doi: 10.1016/S1350-9462(98)00006-8
Wachtmeister, L., and Dowling, J. E. (1978). The oscillatory potentials of the mudpuppy retina. Invest. Ophthalmol. Vis. Sci. 17, 1176–1188.
Weber, B. H., Schrewe, H., Molday, L. L., Gehrig, A., White, K. L., Seeliger, M. W., et al. (2002). Inactivation of the murine X-linked juvenile retinoschisis gene, Rs1h, suggests a role of retinoschisin in retinal cell layer organization and synaptic structure. Proc. Natl. Acad. Sci. U.S.A. 99, 6222–6227. doi: 10.1073/pnas.092528599
Wu, J., Marmorstein, A. D., Striessnig, J., and Peachey, N. S. (2007). Voltage-dependent calcium channel CaV1.3 subunits regulate the light peak of the electroretinogram. J. Neurophysiol. 97, 3731–3735. doi: 10.1152/jn.00146.2007
Xu, H. P., Zhao, J. W., and Yang, X. L. (2002). Expression of voltage-dependent calcium channel subunits in the rat retina. Neurosci. Lett. 329, 297–300. doi: 10.1016/S0304-3940(02)00688-2
Keywords: L-type voltage-gated calcium channel, photoreceptor, ribbon synapses, electroretinogram
Citation: Shi L, Chang JY-A, Yu F, Ko ML and Ko GY-P (2017) The Contribution of L-Type Cav1.3 Channels to Retinal Light Responses. Front. Mol. Neurosci. 10:394. doi: 10.3389/fnmol.2017.00394
Received: 07 July 2017; Accepted: 10 November 2017;
Published: 05 December 2017.
Edited by:
Andrei Surguchov, University of Kansas Medical Center Research Institute, United StatesReviewed by:
Henrique Prado von Gersdorff, Oregon Health and Science University, United StatesKarin Dedek, University of Oldenburg, Germany
Copyright © 2017 Shi, Chang, Yu, Ko and Ko. This is an open-access article distributed under the terms of the Creative Commons Attribution License (CC BY). The use, distribution or reproduction in other forums is permitted, provided the original author(s) or licensor are credited and that the original publication in this journal is cited, in accordance with accepted academic practice. No use, distribution or reproduction is permitted which does not comply with these terms.
*Correspondence: Gladys Y.-P. Ko, gko@cvm.tamu.edu