 Estefania Hernandez-Martin
 Enrique Arguelles2
 Aaron Robison
 Terence D. Sanger
- 1Department of Electrical Engineering and Computer Science, University of California, Irvine, Irvine, CA, United States
- 2Neuroscience Institute, Children's Hospital of Orange County (CHOC), Orange, CA, United States
- 3Department of Neurology, Children's Hospital of Los Angeles (CHLA), Los Angeles, CA, United States
- 4Department of Neurological Surgery, Keck School of Medicine, University of Southern California (USC), Los Angeles, CA, United States
- 5Department of Biomedical Engineering, University of Southern California (USC), Los Angeles, CA, United States
The contribution of different brain regions to movement abnormalities in children with dystonia is unknown. Three awake subjects undergoing depth electrode implantation for assessments of potential deep brain recording targets performed a rhythmic figure-8 drawing task. Two subjects had dystonia, one was undergoing testing for treatment of Tourette Syndrome and had neither dystonia nor abnormal movements during testing. Movement-related signals were evaluated by determining the magnitude of task-related frequency components. Brain signals were recorded in globus pallidus internus (GPi), the ventral oralis anterior/posterior (VoaVop) and the ventral intermediate (Vim) nuclei of the thalamus. In comparison to the subject without dystonia, both children with dystonia showed increased task-related activity in GPi and Vim. This finding is consistent with a role of both basal ganglia and cerebellar outputs in the pathogenesis of dystonia. Our results further suggest that frequency analysis of brain recordings during cyclic movements may be a useful tool for analysis of the presence of movement-related signals in various brain regions.
Introduction
The basal ganglia, cerebellum, and thalamus compose a complex system whose combined roles in human motor control remain unknown. The availability of intracranial electrical recordings during surgery for implantation of Deep Brain Stimulation (DBS) electrodes has provided some ability to observe activity in a variety of different disorders, including Parkinson's Disease, Essential Tremor, and Dystonia. Interpretation of this information has been limited by (1) lack of availability of recordings from healthy subjects for comparison, (2) recording from only one or two sites at a time, and (3) lack of techniques that allow separation of movement-related signals from other ongoing brain activity.
Here we report data from up to 60 simultaneously recorded electrodes in globus pallidus internus (GPi), thalamus ventral oralis anterior/posterior nuclei (VoaVop), and thalamus ventral intermediate nucleus (Vim), along with surface electromyography (sEMG). All signals are compared to the kinematics of movement. We use a rhythmic task so that by analysis of the task-related frequencies we can determine the contribution of movement signals in each deep brain region.
We report data from 3 subjects: one with generalized dystonia, one with hemidystonia, and one with Tourette syndrome (TS). The significance of these subjects is that we recorded from the brain hemisphere contralateral to the less affected side of the patient with hemidystonia. This area is not expected to be healthy (indeed, the patient ultimately benefited from DBS electrode implantation in GPi and thalamus on this side). The features of dystonic symptoms for two patients were hypertonic (1). The patient with Tourette syndrome, while not healthy, does not have any difficulty with routine arm movement when not having tics. In fact, during the testing period (approx. 7 days), the patient did not exhibit any tics at all; upon awakening from electrode implantation (2), the patient was noted to have complete cessation of motor and vocal tics prior to electrical stimulation through the electrodes, and thus movement phenotype is normal. Therefore, while the patient with TS cannot be considered a healthy control, he nevertheless provides an example of healthy behavior. While this is a very limited sample, the three patients represent an important range for comparison: (1) active dystonia (generalized dystonia patient), (2) mild dystonia (less affected side of the hemidystonia patient), (3) no dystonia (TS patient).
The cyclic drawing task allows us to determine the relationship between signals from deep structures and the kinematics and electromyography signals. The task involves continuous and repeated Figure 8 movements on a tablet. The particular value of this task is that the desired movement consists of two frequencies: the movement in the direction of the short axis of the Figure 8 has twice the frequency of the movement in the direction of the long axis. This allows us to differentiate contributors to horizontal and vertical movement by examining the frequency components of brain or muscle signals. It also allows us to determine which components of activity are task-unrelated, because frequency components that are at neither the horizontal nor vertical frequency do not contribute to the desired movement and are either irrelevant or represent errors in movement. We have previously shown the potential of the cyclic drawing task to objectively relate muscle activity measured by surface electromyography (sEMG) to the kinematics of movement (3).
We make use of data obtained during targeting for deep brain stimulation (DBS) in children. At our institution, the targeting procedure includes placement of temporary depth electrodes in potential target regions, and children are subsequently evaluated while awake in a regular hospital bed. This allows unconstrained performance of tasks, including reaching or repetitive arm and finger movements. The targets we evaluate for DBS at our institution include ventral oralis anterior/posterior (VoaVop), ventral intermedius (Vim) and ventral anterior (VA) nuclei of the thalamus (4, 5), as well as globus pallidus internus (GPi) (6) and subthalamic nucleus (STN) (7, 8).
We will analyze data from the basal ganglia output (GPi), thalamic targets of this output (VoaVop), and thalamic targets of cerebellar output (Vim) in order to investigate the relative contributions of basal ganglia and cerebellar outputs to dystonic movement.
Materials and methods
Subjects
Subjects were diagnosed by a pediatric movement disorder specialist (T.D.S.). All patients provided signed informed consent for surgical procedures in accordance with standard hospital practice [Children's Hospital of Orange County (CHOC)]. The patients, or parents of minor patients, also signed an informed consent for the research use of electrophysiological data and Health Insurance Portability and Accountability Act (HIPAA) authorization for the research use of protected health information. Three male patients (Table 1) with movement disorders [hypertonic dystonia; location hemi and generalized (known from here as hemidystonia and generalized dystonia), and Tourette syndrome] executed the motor task while surface electromyography (sEMG) and brain signals were simultaneously recorded. For this study, we analyze data from electrodes in GPi, VoaVop, and Vim. In most cases, electrodes were also placed in other thalamic targets including ventral anterior (VA) or ventral posterolateral (VPL) subnuclei, but those were not shown as part of this study because they were not common targets across the subjects (Supplementary Figure S1).
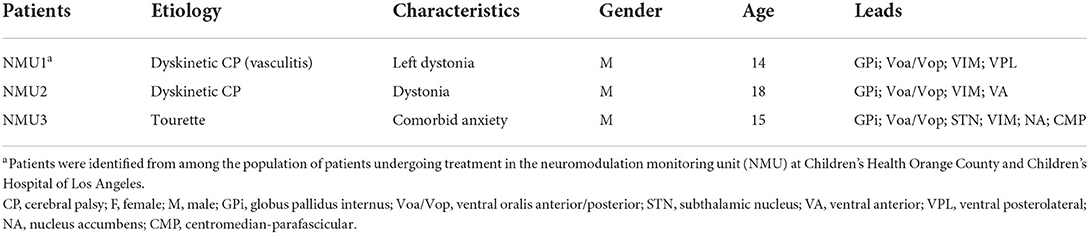
Table 1. Demographic characteristics.
Experimental design
Motor performance was studied during the execution of figure-eight drawing movements. Tablet software was used to record the two-dimensional coordinates of the fingertip on the tablet (iOS 4.3 operating system; Apple®, Cupertino, CA, USA). Each subject was positioned at a distance that allowed them to reach the farthest point on the tablet, which was fixed on the table in portrait orientation. Subjects were asked to follow a 0.3 cm-thick trace on the tablet to draw a figure-eight [15.7 cm (width) × 7.8 cm (height)]. Prior to the start of the experiment, participants were encouraged to be as accurate as possible while tracing the figure-eight at their natural speed. Starting from the upper point of the figure-eight, subjects were requested to move in the mediolateral direction opposite to the arm used to perform the task. The task was performed with their dominant hand. An audible metronome was used to help the subjects maintain approximately consistent speed, and subjects were encouraged to make continuous repeated movements without stopping. The actual speed of movement was subsequently calculated for each cycle based on the fingertip position. The patient with hemidystonia completed five sequences (trials) of 10 figure-eight cycles at average speed of ~18 cycles per minute (cpm). The patient with generalized dystonia completed five trials of 10 cycles at average speed of ~ 8 cpm. The patient with TS completed two trials of 10 cycles at average speed of ~36 cpm.
Electrophysiological recordings
Surgical procedure
Our standard clinical procedure for determining DBS targets includes the implantation of 6–10 temporary AdTech MM16C depth electrodes (Adtech Medical Instrument Corp., Oak Creek, WI, USA) at potential DBS targets (including basal ganglia and thalamic subnuclei), as identified based on clinical criteria in each patient (6). Typical thalamic targets for children include VoaVop, Vim, and basal ganglia such as GPi. The depth electrodes were placed using standard stereotactic procedure for the implantation of DBS electrodes, with the most distal stimulation contact placed at the target location. Electrode location was confirmed by co-registration of preoperative magnetic resonance imaging (MRI) and postoperative computed tomography (CT) scans. Thalamic targeting was confirmed by identification of leads in subnuclei known to have greater or lesser response to median nerve electrical stimulation (9).
Deep brain recordings
Recordings were performed during the first 24 to 48 h after clinical implantation of the temporary depth electrodes. Each MM16C electrode lead has a diameter of 1.2 mm and contains 6 low-impedance (1–2 kΩ) ring electrodes with 2-mm height and 5-mm spacing, as well as 10 high-impedance (70–90 kΩ) microwire electrodes (50-μm diameter). The microwire electrodes are arranged in groups of 2 or 3, spaced evenly around the circumference of the electrode shaft, between pairs of ring electrodes. Results reported here are from the microwire electrodes in GPi, VoaVop, and Vim. Therefore, there are either 30 (unilateral) or 60 (bilateral) contacts recorded simultaneously.
The external proximal ends of electrodes were connected to Adtech Cabrio™ connectors, modified to include a custom unity-gain preamplifier for each microwire electrode to reduce noise and motion artifacts. Microwire electrode signals were amplified with a DC-coupled amplifier, sampled at 22 kHz, and digitized by a Tucker-Davis Technologies PZ5M analog-to-digital amplifier connected to an RZ2 digital signal processor. Data were streamed to an RS4 high-speed data storage unit, controlled by Synapse recording software (System3, Tucker-Davis Technologies Inc., Alachua, FL, USA) (Figure 1).
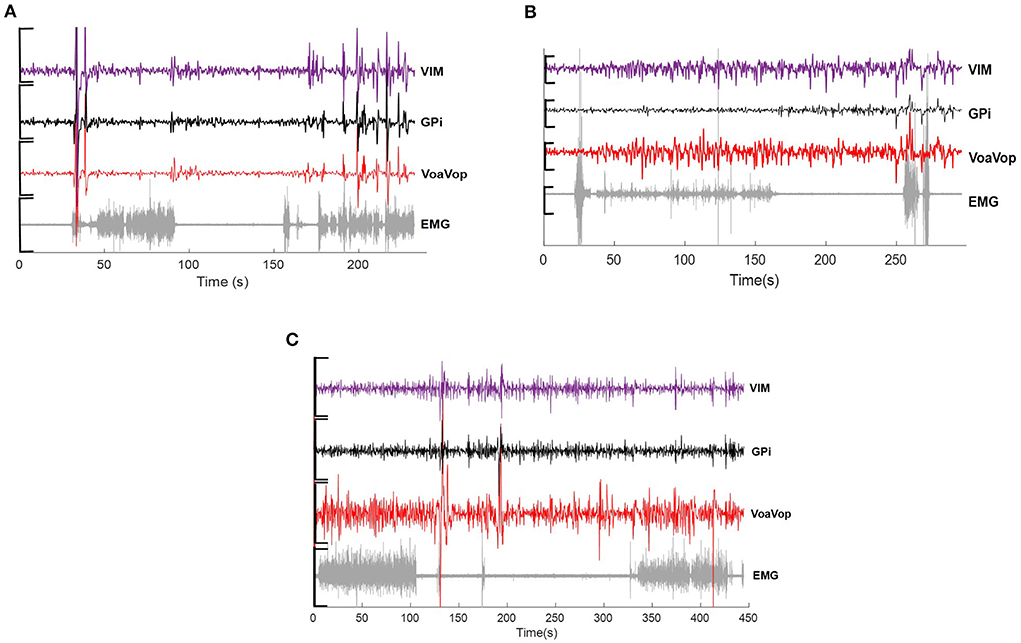
Figure 1. Example of raw data across microwire electrodes placed on Vim (purple), GPi (black), VoaVop (red) and muscle (sEMG, grey), showing changes in activity during drawing task for (A) hemidystonia. (B) generalized dystonia and (C) Tourette patients. Vertical axis: voltage [−5 to 5 uV)]. Horizontal axis: time (s).
Surface EMG recordings
sEMG signals were extracted from six muscles of the upper limb known to contribute to wrist, elbow, and shoulder movements: biceps (Bi), triceps (Tri), anterior deltoid (AntDel), lateral deltoid (LatDel), posterior deltoid (PostDel), and supraspinatus (Supra). Prior to sensor placement, the skin over the muscles and the sensor surface were wiped with isopropyl alcohol pads to reduce electrical impedance at the skin-electrode interface. Six wireless surface sensors (Delsys Trigno, Delsys Inc. Natick, MA, USA) were placed on the patient's muscles and attached with skin adhesive. The sEMG signals were displayed on a monitor to ensure proper placement and signal quality (Figure 1).
Data analysis
Data were analyzed with Matlab® R2021b software (Mathworks®, Natick, MA, USA).
Surface-EMG
A non-linear recursive filter based on Bayesian estimation for sEMG signals was applied. Bayesian filtering produces a smooth output that estimates the driving force underlying the EMG signal with low variability, while allowing for the detection of very rapid changes in output. The non-linear filter removes the high-frequency components of sEMG and allows evaluation of the frequency components of the envelope of sEMG activity, thus relating more closely to force produced by the muscles (10).
Power spectral density analysis
We used orthogonal multilevel wavelet decomposition (MWD) for signal filtering (11) across all microwire electrodes. Information from GPi, VoaVop, and Vim recordings during the figure-eight drawing with the upper limbs was obtained for all patients. Thus, a total of 24 GPi, 21 VoaVop and 24 Vim contacts were analyzed. In order to detect the frequency related with the motor task, power spectral density (PSD) analysis based on the fast Fourier transform (FFT) (12) was performed for both muscle and brain signals. The sequences for the x- and y-axes in the figure-eight were re-sampled to equalize task duration among subjects, with the horizontal fx and vertical fy frequency components sampled at a ratio of 2:1(3):1
Fitting to gaussian model
The speed to complete the figure-eight varied between trials. To address this issue, task frequency components fx and fy, for all repetitions in each subject were fitted to a general gaussian model f(x) of two components:
Where a1 represents peak amplitude; b1 represents peak centroids; c1 and c2 are peak width; x is normalized by the mean and standard deviation. Thus, all brain and muscle signals can be analyzed under the gaussian curves. The goodness of fit for each frequency component were calculated through R2 and sum of square error (SSE) (Figure 2).
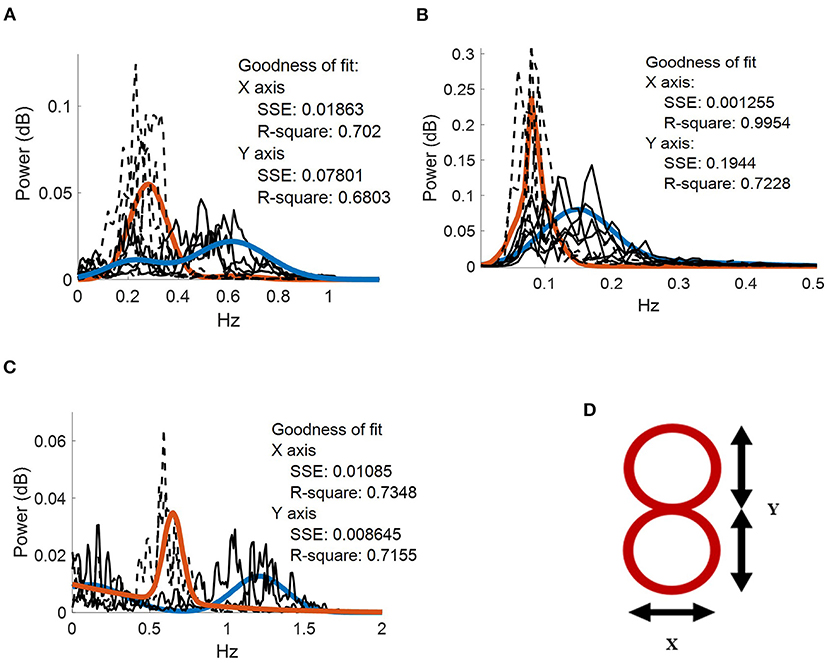
Figure 2. Frequency spectrum of the movement kinematics at the fingertip. Two gaussian fits (blue and orange continuous traces, respectively) applied to fx (dotted black lines) and fy (dotted gray lines) task components for. (A) five repetitions performed by the patient with hemidystonia. (B) five repetitions executed by the patient with generalized dystonia; and (C) two repetitions performed by the patient with TS. Vertical axis: power spectra (dB). Horizontal axis: frequency (Hz). (D) Representation of the figure-eight drawing trace (0.3-cm thickness).
A Spearman correlation analysis (ρ = [0–1], p-value< 0.001) was also calculated between each kinematic component (fx, fy) and brain or muscle signals to quantify the relationship in terms of frequency for both active and rest conditions.
Results
Average of power spectra across repetitions
The patient with hemidystonia executed five sets of 10 cycles of figure-eight drawing repetitions at an average speed of ~18 cpm, clearly represented in the PSD of the movement kinematics with peaks matching the fy components at ~0.3 Hz (Figure 2A). Grand average contralateral muscle activation through all repetitions was strongly associated with the fy component during the figure-eight drawing (active) as shown in Figure 3A and Supplementary Video 1. The grand average of brain signals across repetitions was also associated with task frequency components during the figure-eight drawing (active), for all targeted brain regions (left brain side) compared with the rest condition (Figure 3). For all brain and muscle signals the PSD peaks were most closely associated with the fy component.
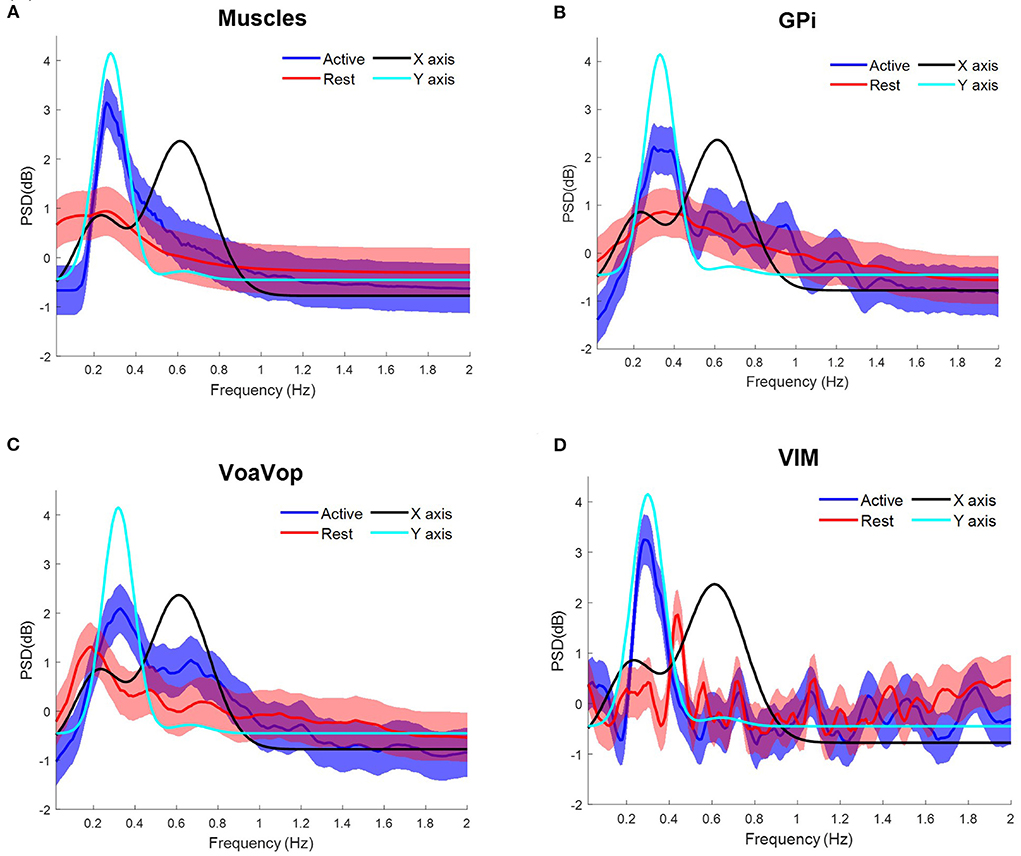
Figure 3. Task frequency components for the patient with hemidystonia. Contralateral muscles and brain signals during the figure-eight drawing task, recorded from multiple surface EMGs and from multiple externalized DBS electrodes. Power spectrum density (PSD) for kinematic data is shown for comparison: fy component (cyan) and fx component (black). Grand average and standard deviation across all muscles and all microwire electrode recordings during all repetitions of the figure-eight drawing (blue) and resting (red) conditions. (A) Grand average across contralateral muscles. Grand average of left-side brain targets. (B) Brain signals from globus pallidus interna (GPi). (C) ventral oralis anterior/posterior (VoaVop), (D) ventral intermediate (Vim). Vertical axis: power spectra (dB). Horizontal axis: frequency (Hz).
The patient with generalized dystonia executed the five sets of 10 cycles of figure-eight repetitions at an average speed of ~8 cpm, clearly represented in the PSD with peaks matching the fx and fycomponents at ~0.12 Hz. Grand average contralateral muscle activation was strongly associated with the kinematic component during the figure-eight drawing (active), (Figure 4A). Similarly, brain signals during the figure-eight drawing (active) showed peaks matching the fx component (Figure 4, Supplementary Video 2).
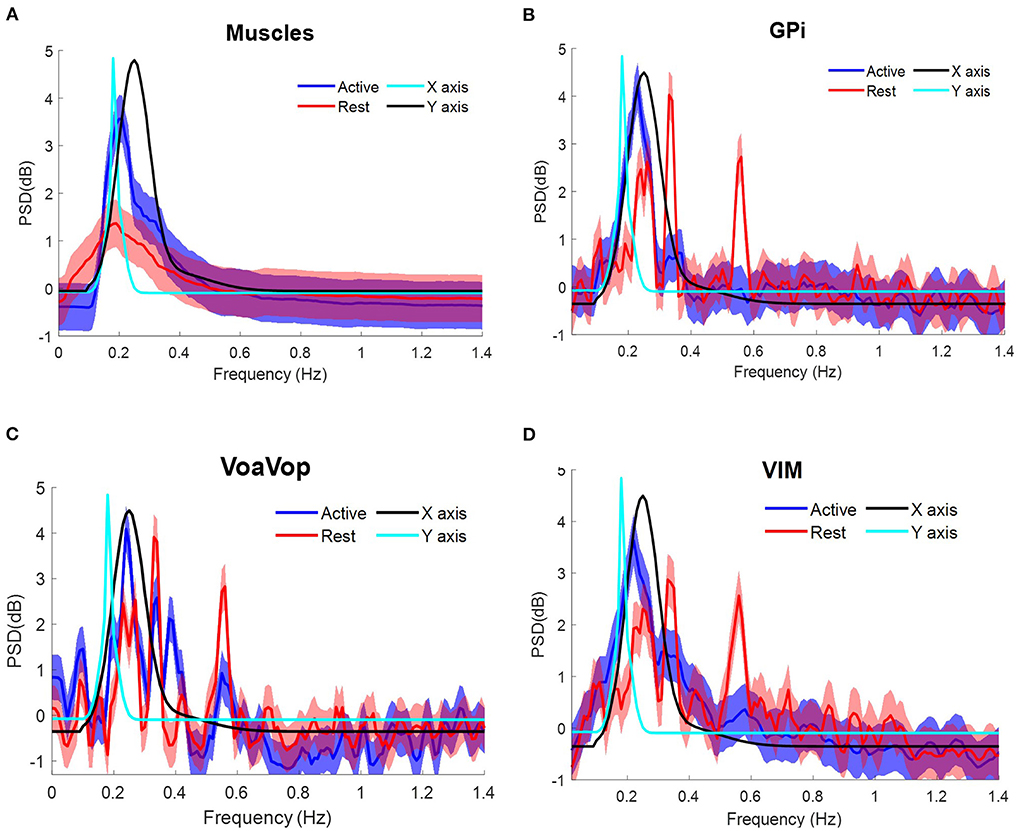
Figure 4. Task frequency components for the patient with generalized dystonia. Contralateral muscles and brain signals during the figure-eight drawing task, recorded from multiple surface EMGs and from multiple externalized DBS electrodes. Power spectrum density (PSD) for kinematic data is shown for comparison: fy component (cyan) and fx component (black). Grand average and standard deviation across all muscles and all microwire electrode recordings during all repetitions of the figure-eight drawing (blue) and resting (red) conditions. (A) Grand average across contralateral muscles. Grand average of left-side brain targets. (B) Brain signals from globus pallidus interna (GPi). (C) ventral oralis anterior/posterior (VoaVop), (D) ventral intermediate (Vim). Vertical axis: power spectra (dB). Horizontal axis: frequency (Hz).
The same frequency analysis was computed for the patient with TS through two sets of 10 cycles at average speed ~36 cpm, matching with the fy component at ~0.6 Hz as represented in the PSD. Following the same data analysis, the grand average for measured muscle activation showed peaks associated with both fx and fy components (Figure 5A). Grand average brain signals for GPi and Vim were associated with the task frequencies (active) more closely in GPi than in Vim. In contrast to Vim and GPi, VoaVop showed a peak matching with the fy component (Figure 5, Supplementary Video 3).
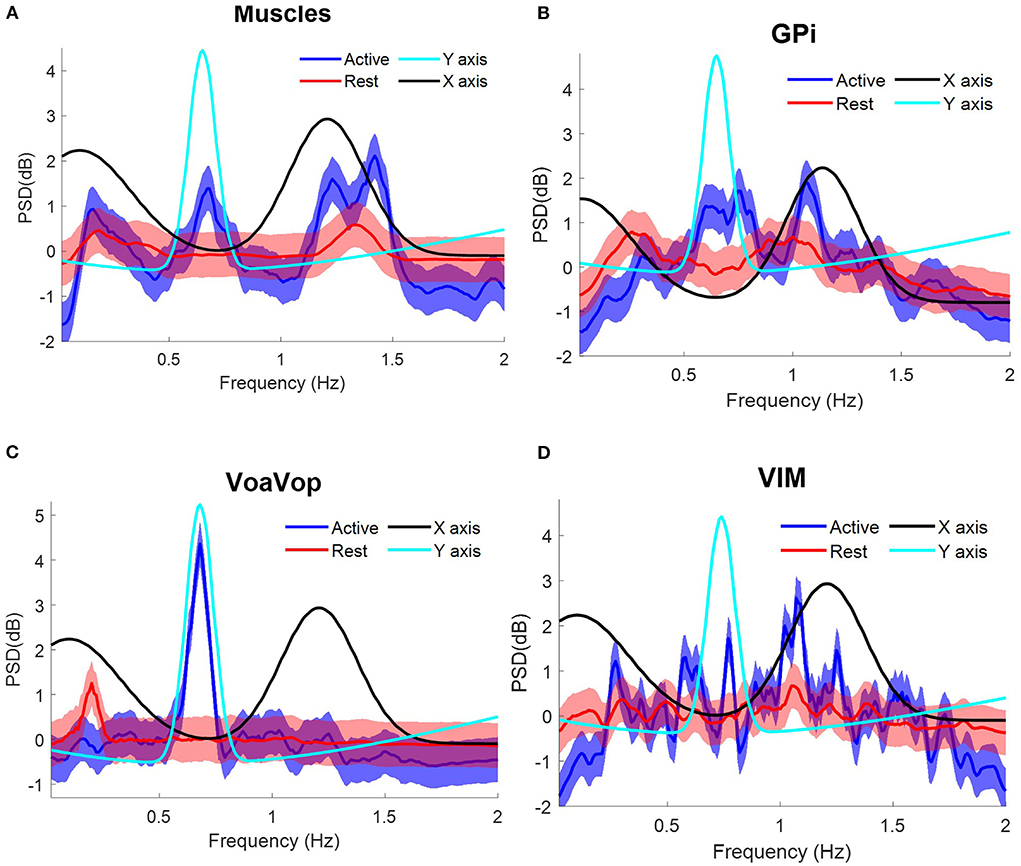
Figure 5. Task frequency components for the patient with Tourette syndrome. Contralateral muscles and brain signals during the figure-eight drawing task, recorded from multiple surface EMGs and from multiple externalized DBS electrodes. Power spectrum density (PSD) for kinematic data is shown for comparison: fy component (cyan) and fx component (black). Grand average and standard deviation across all muscles and all microwire electrode recordings during all repetitions of the figure-eight drawing (blue) and resting (red) conditions. (A) Grand average across contralateral muscles. Grand average of left-side brain targets. (B) Brain signals from globus pallidus interna (GPi). (C) ventral oralis anterior/posterior (VoaVop), (D) ventral intermediate (Vim). Vertical axis: power spectra (dB). Horizontal axis: frequency (Hz).
Relationship between brain and muscle recordings during the cyclic drawing task
To determine the relationship between all muscles and kinematic components during the figure-eight drawing task (active) and rest conditions, Spearman analysis was performed (Figure 6). Spearman' correlations showed significant results (p < 0.001) for the active conditions, in contrast to the rest conditions (p > 0.001), thus the active conditions are only represented in this analysis. All patients showed high correlation indices (ρ > 0.8, p < 0.001) for the muscle signals. The same calculation was used to study the relationship between brain signals and kinematic components. As we predicted, motor thalamic nuclei (VoaVop) showed high correlations with task execution (ρ > 0.7, p < 0.001), while basal ganglia (GPi) showed lower correlations with the task (ρ < 0.7, p < 0.001), across all patients. We also expected to see a strong correlation between the sensory thalamic subnuclei (Vim) and the task components, because Vim is expected to encode proprioceptive sensory signals transmitted through cerebellum. Therefore, a strong correlation (ρ > 0.8, p < 0.001) was observed for the patients with generalized dystonia and hemidystonia, in contrast to the Tourette syndrome patient.
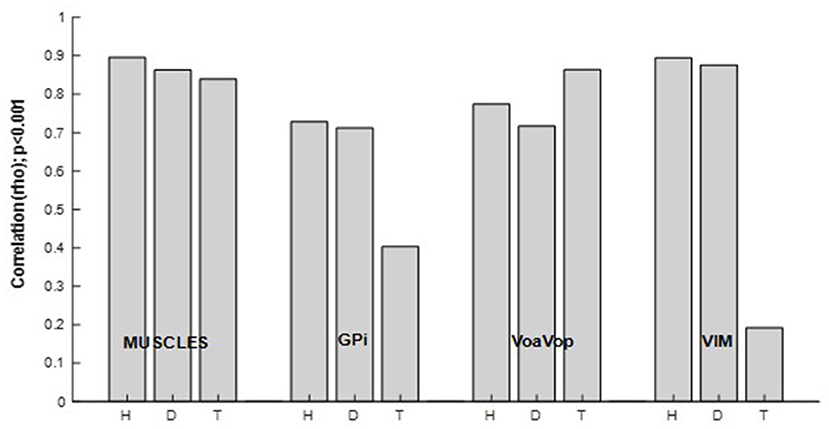
Figure 6. Spearman correlation (ρ [0–1], p < 0.001) between power spectrum of the kinematics of movement, and the muscle and brain signals power spectra. Results are shown separately for the patients with hemidystonia (H), generalized dystonia (D) and Tourette syndrome (T). Spearman correlation for the combined fx and fy components and all involved muscles or brain signals across all repetitions.
Discussion
The most striking feature of our results is the significantly increased task-related activity in GPi and Vim in the patients with dystonia and hemidystonia compared to the patient with Tourette Syndrome (TS) (Figure 6). There was no difference in task-related activity in VoaVop, or in the muscles. While the analysis is limited to the power spectral density and data were obtained from only 1 subject in each category, this result nevertheless suggests that increased task-related activity in both GPi and Vim could be a feature of dystonic movement. This result is consistent with a role of both basal ganglia and cerebellum in the pathogenesis of dystonia. For example, hemidystonia did not show correlation between the task frequency component and VPL (Supplementary Figure S1A). Or the generalized dystonia patient, which did not show any correlation between task frequency component and VA nuclei (Supplementary Figure S1B).
It is also consistent with our observation that both GPi and Vim can be effective targets for amelioration of symptoms in a subset of children (VoaVop is also an effective target in some children, possibly because it is in the output pathway from GPi) (13–15).
Since dystonia is activated by attempts at task performance, this increased task-related activity could reflect increased neural activity responsible for dystonic muscle contractions or overflow. An important caveat is that thalamic nuclei receive strong inputs from motor cortical areas, and thus we cannot be certain whether the increased task-related activity in thalamus arises from basal ganglia and cerebellum or could instead be due to increased task-related inputs from cortex.
GPi has been strongly implicated in the pathophysiology of dystonia, both because of symptoms resulting from injury, and the ability to ameliorate symptoms in a subset of patients using lesions or stimulation in GPi. The cerebellum has been conjectured to be one potential contributor to dystonia (15–17), but it is not known whether this would result in increased signals transmitted through the Vim nucleus of the thalamus (18). Our results suggest that both areas are likely to be involved, although whether they are causal, compensatory, or associated cannot be determined from these data.
Figure 6 shows strong correlations between Vim and task components for hemidystonia and generalized dystonia. This finding may be explained by the role of the cerebellum (16, 17, 19) in the pathophysiology of dystonia. Vim receives input from cerebellum (18) and there could be an alteration of cerebellar input (20) due to abnormal proprioceptive sensory signals arising from the dystonic movement. Further studies will be needed to determine the significance and generalizability of this finding. Nevertheless, our results indicate an alteration in the transfer of information from the peripheral system, providing further evidence for Vim as a possible target for DBS in dystonia (21, 22).
It is interesting to compare the levels of task-related spectral power in the various regions. As expected, muscles have the highest correlation. In the two dystonic subjects, Vim has almost as high a correlation, which could represent either a causative role in the dystonic components of the movement, or increased compensation for abnormal movements, or increased proprioceptive feedback. In all 3 subjects, high levels of VoaVop activation may represent the role of thalamus in the control of both healthy and dystonic movement. In other words, just as motor cortex is involved in both healthy and pathological movement, VoaVop may be an important modulator that both receives input from motor cortex and contributes to activity in motor cortex, whether this activity is related to healthy or to involuntary movement. Slightly decreased activity in VoaVop in the two subjects with dystonia (p < 0.05) is consistent with the slightly increased activity in GPi (p < 0.05) in these two subjects compared to TS, since the projections from GPi to VoaVop are inhibitory (23).
Both subjects with dystonia moved slowly compared to the subject with TS, and therefore we were not able to compare the magnitude of task-unrelated components between subjects. With a larger cohort, relative magnitudes of task-unrelated components could potentially be correlated against the magnitude of task-related and task-unrelated components in the brain signals.
Previous neurophysiological studies are consistent with the theory that during voluntary movement the basal ganglia are responsible for the focused selection of the desired motor pattern and for the inhibition of undesired and competing movements (24, 25). Under this theory, decreased focusing of inhibitory output from GPi would permit disinhibition of involuntary movements in the thalamus and cortex. Our finding of increased GPi activity in the two subjects with dystonia could represent broadening of output predicted by decreased focusing, although it is not clear why the total output would increase. We cannot exclude the alternative possibility that increased GPi activity is compensatory, perhaps an attempt to reduce involuntary movement by increasing the focused or unfocused inhibitory output to thalamus. Because we look only at the magnitude of the PSD and not the phase, we cannot determine whether the timing of the GPi outputs could be incorrect, perhaps inhibiting when disinhibition would be expected, and disinhibiting when inhibition would be expected. Interestingly, our results appear to be inconsistent with the “rate model” of basal ganglia activity, in which dystonia is conjectured to be associated with thalamo-cortical disinhibition due to decreased output from GPi (26).
The results presented above do not allow for definite conclusions regarding the pathophysiology, or whether there might be other mechanisms that can cause the motor disorder. Moreover, our data do not allow us to compare patients with movement disorders to completely healthy subjects. Nevertheless, the patient with TS could be interpreted as a non-dystonic brain since the motor coordination has not been altered and the patient has no symptoms consistent with dystonia.
One limitation of this study is the limited sample size; nonetheless, the number of task repetitions and the number of muscle measurements are sufficient to predict results in the study population. The findings described above may also provide the foundation for future studies that use the cyclic drawing task, in contrast to free voluntary movements, to show how deep brain structures respond to movements in a specific manner, thus providing consistent and reliable frequency patterns for future investigation.
In summary, our results show that task-related signals are present in GPi, VoaVop, and Vim in both dystonic and non-dystonic subjects, but that the GPi and Vim nuclei have higher levels of task-related activity in the two subjects with dystonia. Therapeutic response to deep brain stimulation in these regions supports the hypothesis that this activity is at least in part responsible for abnormal movement. This is consistent with a role of both basal ganglia and cerebellum in the pathogenesis of dystonia. Further studies will be necessary to determine use of the cyclic drawing task as a tool for neurophysiological investigation in subjects with movement disorders.
Data availability statement
The raw data supporting the conclusions of this article will be made available by the authors, without undue reservation.
Ethics statement
The studies involving human participants were reviewed and approved by Health Insurance Portability and Accountability Act (HIPAA). Written informed consent to participate in this study was provided by the participants' legal guardian/next of kin.
Author contributions
TS conceived and supervised the experiment. EA acquired the data. EH-M conducted the experiment and analyzed the data. ML and AR implanted the DBS electrodes. EH-M and TS interpreted the results and wrote the manuscript. All authors contributed to the final manuscript.
Funding
This work was supported by funding from the Cerebral Palsy Alliance Research Foundation Inc., (PG02518). Research reported in this publication is supported by CHOC.
Acknowledgments
We would like to thank our volunteers and their parents for participation in this study. We also thank Aprille Tongol, Jennifer MacLean, and Diana Ferman for their assistance with neurologic examinations.
Conflict of interest
The authors declare that the research was conducted in the absence of any commercial or financial relationships that could be construed as a potential conflict of interest.
Publisher's note
All claims expressed in this article are solely those of the authors and do not necessarily represent those of their affiliated organizations, or those of the publisher, the editors and the reviewers. Any product that may be evaluated in this article, or claim that may be made by its manufacturer, is not guaranteed or endorsed by the publisher.
Supplementary material
The Supplementary Material for this article can be found online at: https://www.frontiersin.org/articles/10.3389/fneur.2022.989340/full#supplementary-material
References
1. Sanger TD, Chen D, Fehlings DL, Hallett M, Lang AE, Mink JW, et al. Definition and classification of hyperkinetic movements in childhood. Mov Disord. (2010) 25:1538–49. doi: 10.1002/mds.23088
2. MacLean DF, Chu JK, Liker MA, Sanger TD. Transient complete resolution of tourette syndrome symptoms following personalized depth electrode placement. Brain Sci. (2021) 11:1559. doi: 10.3390/brainsci11121559
3. Lunardini SM, Casellato C, Bertucco M, Pedrocchi ALG, Sanger T D. Increased task-uncorrelated muscle activity in childhood dystonia. J Neuroeng Rehabil. (2015) 12:52. doi: 10.1186/s12984-015-0045-1
4. Sanger DT, Pascual-Leone A. Abnormalities of spatial and temporal sensory discrimination in writer's cramp. Mov Disord Off J Mov Disord Soc. (2001) 16:94–doi: 10.1002/1531-8257(200101)16:1<94::aid-mds1020>3.0.co;2-o
5. SangerS TD, Kukke N. Abnormalities of tactile sensory function in children with dystonic and diplegic cerebral palsy. J Child Neurol. (2007) 22:289–93. doi: 10.1177/0883073807300530
6. Lin S, Wu Y, Li H, Zhang C, Wang T, Pan Y, et al. Deep brain stimulation of the globus pallidus internus versus the subthalamic nucleus in isolated dystonia. J Neurosurg. (2019) 1:1–12. doi: 10.3171/2018.12.JNS181927
7. Neumann WJ, Huebl J, Brücke C, Ruiz MH, Kupsch A, Schneider GH, et al. Enhanced low-frequency oscillatory activity of the subthalamic nucleus in a patient with dystonia. Mov Disord. (2012) 27:1063–66. doi: 10.1002/mds.25078
8. Sanger TD, Liker M, Arguelles E, Deshpande R, Maskooki A, Ferman D, et al. Pediatric deep brain stimulation using awake recording and stimulation for target selection in an inpatient neuromodulation monitoring unit. Brain Sci. (2018) 8:135. doi: 10.3390/brainsci8070135
9. Hernandez-Martin E, Arguelles E, Deshpande R, Sanger TD. Evoked potentials during peripheral stimulation confirm electrode location in thalamic subnuclei in children with secondary dystonia. J Child Neurol. (2020) 35:799–807. doi: 10.1177/0883073820931970
10. Sanger TD. Bayesian filtering of myoelectric signals. J Neurophysiol. (2007) 97:1839–45. doi: 10.1152/jn.00936.2006
11. Mallat SG. Multiresolution approximations and wavelet orthonormal bases of L∧2 (R). Trans Am Math Soc. (1989) 315:69–87. doi: 10.1090/S0002-9947-1989-1008470-5
12. Frigo M, Johnson SG. FFTW: an adaptive software architecture for the FFT. In: Proceedings of the 1998 IEEE International Conference on Acoustics, Speech and Signal Processing, ICASSP'98 (Cat. No.98CH36181), (1998). p 1381–84.
13. Starr PA, Turner RS, Rau G, Lindsey N, Heath S, Volz M, et al. Microelectrode-guided implantation of deep brain stimulators into the globus pallidus internus for dystonia: techniques, electrode locations, and outcomes. J Neurosurg. (2006) 104:488–501. doi: 10.3171/jns.2006.104.4.488
14. Cheung AMN, Alterman RL, McIntyre CC, Tagliati M. Defining a therapeutic target for pallidal deep brain stimulation for dystonia. Ann Neurol. (2014) 76:22–30. doi: 10.1002/ana.24187
15. Cif L, Gonzalez-Martinez V, Vasques X, Corlobé A, Moura AM, Bonafé A, et al. Staged implantation of multiple electrodes in the internal globus pallidus in the treatment of primary generalized dystonia. J Neurosurg. (2012) 116:1144–52. doi: 10.3171/2012.1.JNS102045
16. Fremont AT, Angueyra C, Khodakhah K. A role for cerebellum in the hereditary dystonia DYT1. Elife. (2017) 6:e22775. doi: 10.7554/eLife.22775
17. Tsuboi T, et al. Comparative connectivity correlates of dystonic and essential tremor deep brain stimulation. Brain. (2021) 144:1774–1786. doi: 10.1093/brain/awab074
18. Hernandez-Martin EA, Zheng Y, Deshpande R, Sanger TD. High-fidelity transmission of high-frequency burst stimuli from peripheral nerve to thalamic nuclei in children with dystonia. Sci Rep. (2021) 11:8498. doi: 10.1038/s41598-021-88114-w
19. Albanese A, Bhatia K, Bressman SB, Delong MR, Fahn S, Fung VS, et al. Phenomenology and classification of dystonia: a consensus update. Mov Disord. (2013) 28:863–873. doi: 10.1002/mds.25475
20. Sanger TD. Arm trajectories in dyskinetic cerebral palsy have increased random variability. J Child Neurol. (2006) 21:551–557. doi: 10.1177/08830738060210070201
21. Horisawa KK, Nonaka T, Mochizuki T, Kawamata T, Taira T. Case report: deep cerebellar stimulation for tremor and dystonia. Front Neurol. (2021) 12:642904. doi: 10.3389/fneur.2021.642904
22. San Luciano M, Robichaux-Viehoever A, Dodenhoff KA, Gittings ML, Viser AC, Racine CA, et al. Thalamic deep brain stimulation for acquired dystonia in children and young adults: a phase 1 clinical trial. J Neurosurg Pediatr. (2020) 27:203–12 1–10. doi: 10.3171/2020.7.PEDS20348
23. Nieuwhof F, Toni I, Dirkx MF, Gallea C, Vidailhet M, Buijink AWG, et al. Cerebello-thalamic activity drives an abnormal motor network into dystonic tremor. NeuroImage Clin. (2022) 33:102919 doi: 10.1016/j.nicl.2021.102919
24. Hallett M, Khoshbin S. A physiological mechanism of bradykinesia. Brain. (1980) 103:301–14. doi: 10.1093/brain/103.2.301
25. Mink JW. The basal ganglia: focused selection and inhibition of competing motor programs. Prog Neurobiol. (1996) 50:381–425. doi: 10.1016/S0301-0082(96)00042-1
Keywords: cyclic drawing task, deep brain signals, muscle signals, movement disorders, deep brain stimulation
Citation: Hernandez-Martin E, Arguelles E, Liker M, Robison A and Sanger TD (2022) Increased movement-related signals in both basal ganglia and cerebellar output pathways in two children with dystonia. Front. Neurol. 13:989340. doi: 10.3389/fneur.2022.989340
Received: 08 July 2022; Accepted: 23 August 2022;
Published: 09 September 2022.
Edited by:
Diego Iacono, Neuroscience—Uniformed Services University of the Health Sciences (USU), United StatesReviewed by:
Ryoma Morigaki, Tokushima University, JapanCarla Piano, Agostino Gemelli University Polyclinic (IRCCS), Italy
Copyright © 2022 Hernandez-Martin, Arguelles, Liker, Robison and Sanger. This is an open-access article distributed under the terms of the Creative Commons Attribution License (CC BY). The use, distribution or reproduction in other forums is permitted, provided the original author(s) and the copyright owner(s) are credited and that the original publication in this journal is cited, in accordance with accepted academic practice. No use, distribution or reproduction is permitted which does not comply with these terms.
*Correspondence: Estefania Hernandez-Martin, estefania@sangerlab.net