 Sheng-Qi Hu
 Jian-Nan Hu
 Ru-Dong Chen1
 Jia-Sheng Yu
- 1Department of Neurosurgery, Tongji Hospital, Tongji Medical College, Huazhong University of Science and Technology, Wuhan, Hubei, China
- 2Department of Respiratory and Critical Care Medicine, Key Laboratory of Pulmonary Diseases of Health Ministry, Tongji Hospital, Tongji Medical College, Huazhong University of Science and Technology, Wuhan, China
Objectives: To identify risk factors for hospital-acquired pneumonia (HAP) in patients with aneurysmal subarachnoid hemorrhage (aSAH) and establish a predictive model to aid evaluation.
Methods: The cohorts of 253 aSAH patients were divided into the HAP group (n = 64) and the non-HAP group (n = 189). Univariate and multivariate logistic regression were performed to identify risk factors. A logistic model (Model-Logit) was established based on the independent risk factors. We used risk factor categories to develop a model (Model-Cat). Receiver operating characteristic curves were generated to determine the cutoff values. Areas under the curves (AUCs) were calculated to assess the accuracy of models and single factors. The Delong test was performed to compare the AUCs.
Results: The multivariate logistic analysis showed that the age [p = 0.012, odds ratio (OR) = 1.059, confidence interval (CI) = 1.013–1.107], blood glucose (BG; >7.22 mmol/L; p = 0.011, OR = 2.781, CI = 1.263–6.119), red blood distribution width standard deviation (RDW-SD; p = 0.024, OR = 1.118, CI = 1.015–1.231), and Glasgow coma scale (GCS; p < 0.001, OR = 0.710, CI = 0.633–0.798) were independent risk factors. The Model-Logit was as follows: Logit(P) = −5.467 + 0.057 * Age + 1.023 * BG (>7.22 mmol/L, yes = 1, no = 0) + 0.111 * RDW-SD−0.342 * GCS. The AUCs values of the Model-Logit, GCS, age, BG (>7.22 mmol/L), and RDW-SD were 0.865, 0.819, 0.634, 0.698, and 0.625, respectively. For clinical use, the Model-Cat was established. In the Model-Cat, the AUCs for GCS, age, BG, and RDW-SD were 0.850, 0.760, 0.700, 0.641, and 0.564, respectively. The AUCs of the Model-Logit were insignificantly higher than the Model-Cat (Delong test, p = 0.157). The total points from −3 to 4 and 5 to 14 were classified as low- and high-risk levels, respectively.
Conclusions: Age, BG (> 7.22 mmol/L), GCS, and RDW-SD were independent risk factors for HAP in aSAH patients. The Model-Cat was convenient for practical evaluation. The aSAH patients with total points from 5 to 14 had a high risk for HAP, suggesting the need for more attention during treatment.
Introduction
Aneurysmal subarachnoid hemorrhage (aSAH) is a neurologic emergency associated with a 32%−67% mortality and many severe complications (1, 2). About one-third of aSAH patients suffer from systemic infections (predominantly pneumonia) that can contribute to excess mortality after SAH (2, 3). Hospital-acquired pneumonia (HAP) is a common complication associated with poor outcomes (4–6). Even though numerous studies focused on stroke-associated pneumonia and acquired clinically predictive scales (7–9), different types of the stroke influenced the occurrence of HAP and reduced the prediction accuracy (10). To further specifically evaluate the HAP factors in aSAH patients and create strategies to prevent HAP and improve outcomes, it is critical to identify and mitigate risk factors in aSAH patients (4, 11).
Studies focusing on HAP in patients with aSAH returned inconsistent results. Chen et al. (11) demonstrated the significance of the neutrophil-to-lymphocyte ratio (NLR) in 711 aSAH patients. Wang et al. found that risk factors for pneumonia in aSAH patients included advanced age, male sex, weekend admission, the World Federal Neurological Society (WFNS) grade, extensive enteral nutrition, endovascular treatment, and specific laboratory parameters (4). Some studies only tested their limited cohorts' accuracy and thresholds of associated risk factors (12, 13). Nevertheless, clinical work requires a valid and convenient model to predict HAP in aSAH patients. Therefore, we explored the risk factors for HAP in patients with aSAH and established a predictive model.
Methods
Patients
The flow chart of patient selection is shown in Figure 1. Our hospital's institutional ethics committee approved this study. We collected data after obtaining the consent of the patients or their close relatives. From January 2020 to January 2022, 308 patients were diagnosed with SAH identified by computed tomography. There were 288 patients with a definitive diagnosis of an intracranial aneurysm according to computerized tomography angiography, digital subtraction angiography, or surgery at our institute (20 patients were excluded for non-aneurysmal hemorrhages). Exclusion criteria were as follows: (1) the interval between the bleeding and admission exceeded 48 h (n = 7); (2) the patient refused surgery, including clipping or coiling (n = 8); (2) the patients were treated without 72 h (n = 15); (4) there was a diagnosis of community-acquired pneumonia (n = 5). A cohort of 253 patients with aSAH was established and divided into a HAP group (n = 64) and a non-HAP group (n = 189). The HAP group's inclusion criteria were as similar to the literature (14), which was as follows: (1) new or progressive and persistent infiltrates; (2) body temperature of >38.3°C or leukocytes counts <4 × 10⁹/L or >12 × 109/L; (3) at least two of the following signs: purulent sputum, cough, dyspnea, declining oxygen saturation, increased oxygen requirement, or need for respiratory assistance.
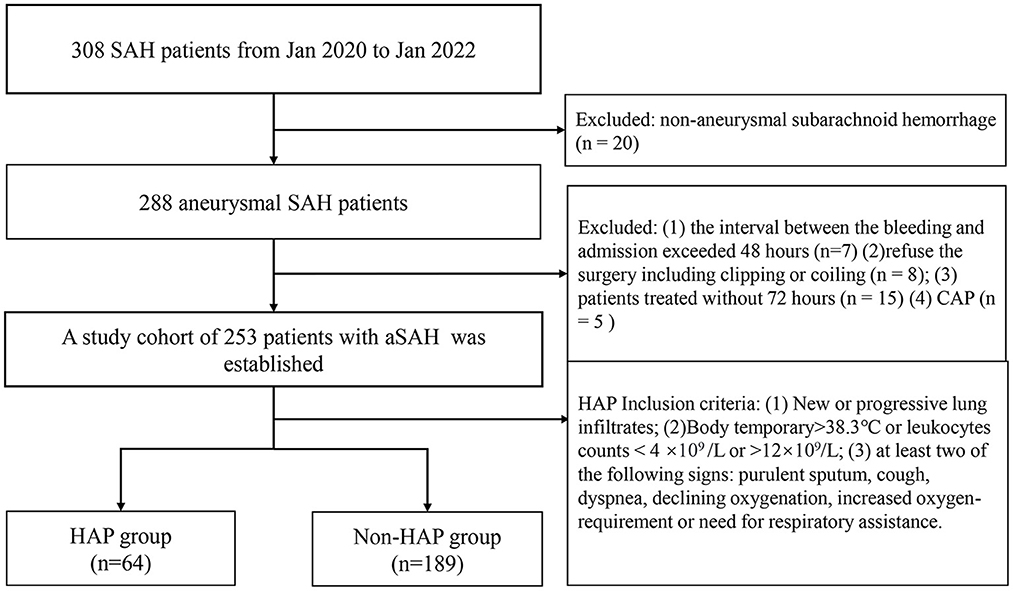
Figure 1. The flow chart of patient selection. SAH, subarachnoid hemorrhage; CAP, community-acquired pneumonia; HAP, hospital-acquired pneumonia.
Data
Clinical characteristics and laboratory tests are displayed in Table 1. The variables were as follows: (1) demographics; (2) comorbidities (i.e., hypertension, diabetes mellitus, hyperlipidemia), and history of smoking and drinking; (3) clinical scores [Glasgow coma scale (GCS), Hunt-Hess score, WFNS; modified Fisher grade]; (4) aneurysm location and occurrence of intracerebral hemorrhage and intraventricular hemorrhage; (5) choice of treatment including coiling or clipping; (6) laboratory tests (peripheral venous blood samples): blood glucose (BG); red blood cell (RBC); hematocrit; hemoglobin, platelets, white blood cell (WBC), neutrophils; monocytes, NLR, platelet to lymphocyte ratio, lymphocyte-to-monocyte ratio; platelet-to-WBC ratio, systemic inflammation response index (SIRI), red blood cell distribution coefficient of variation and red blood cell distribution width-standard deviation (RDW-SD). All clinical characteristics and laboratory tests were collected within 12 h of admission.
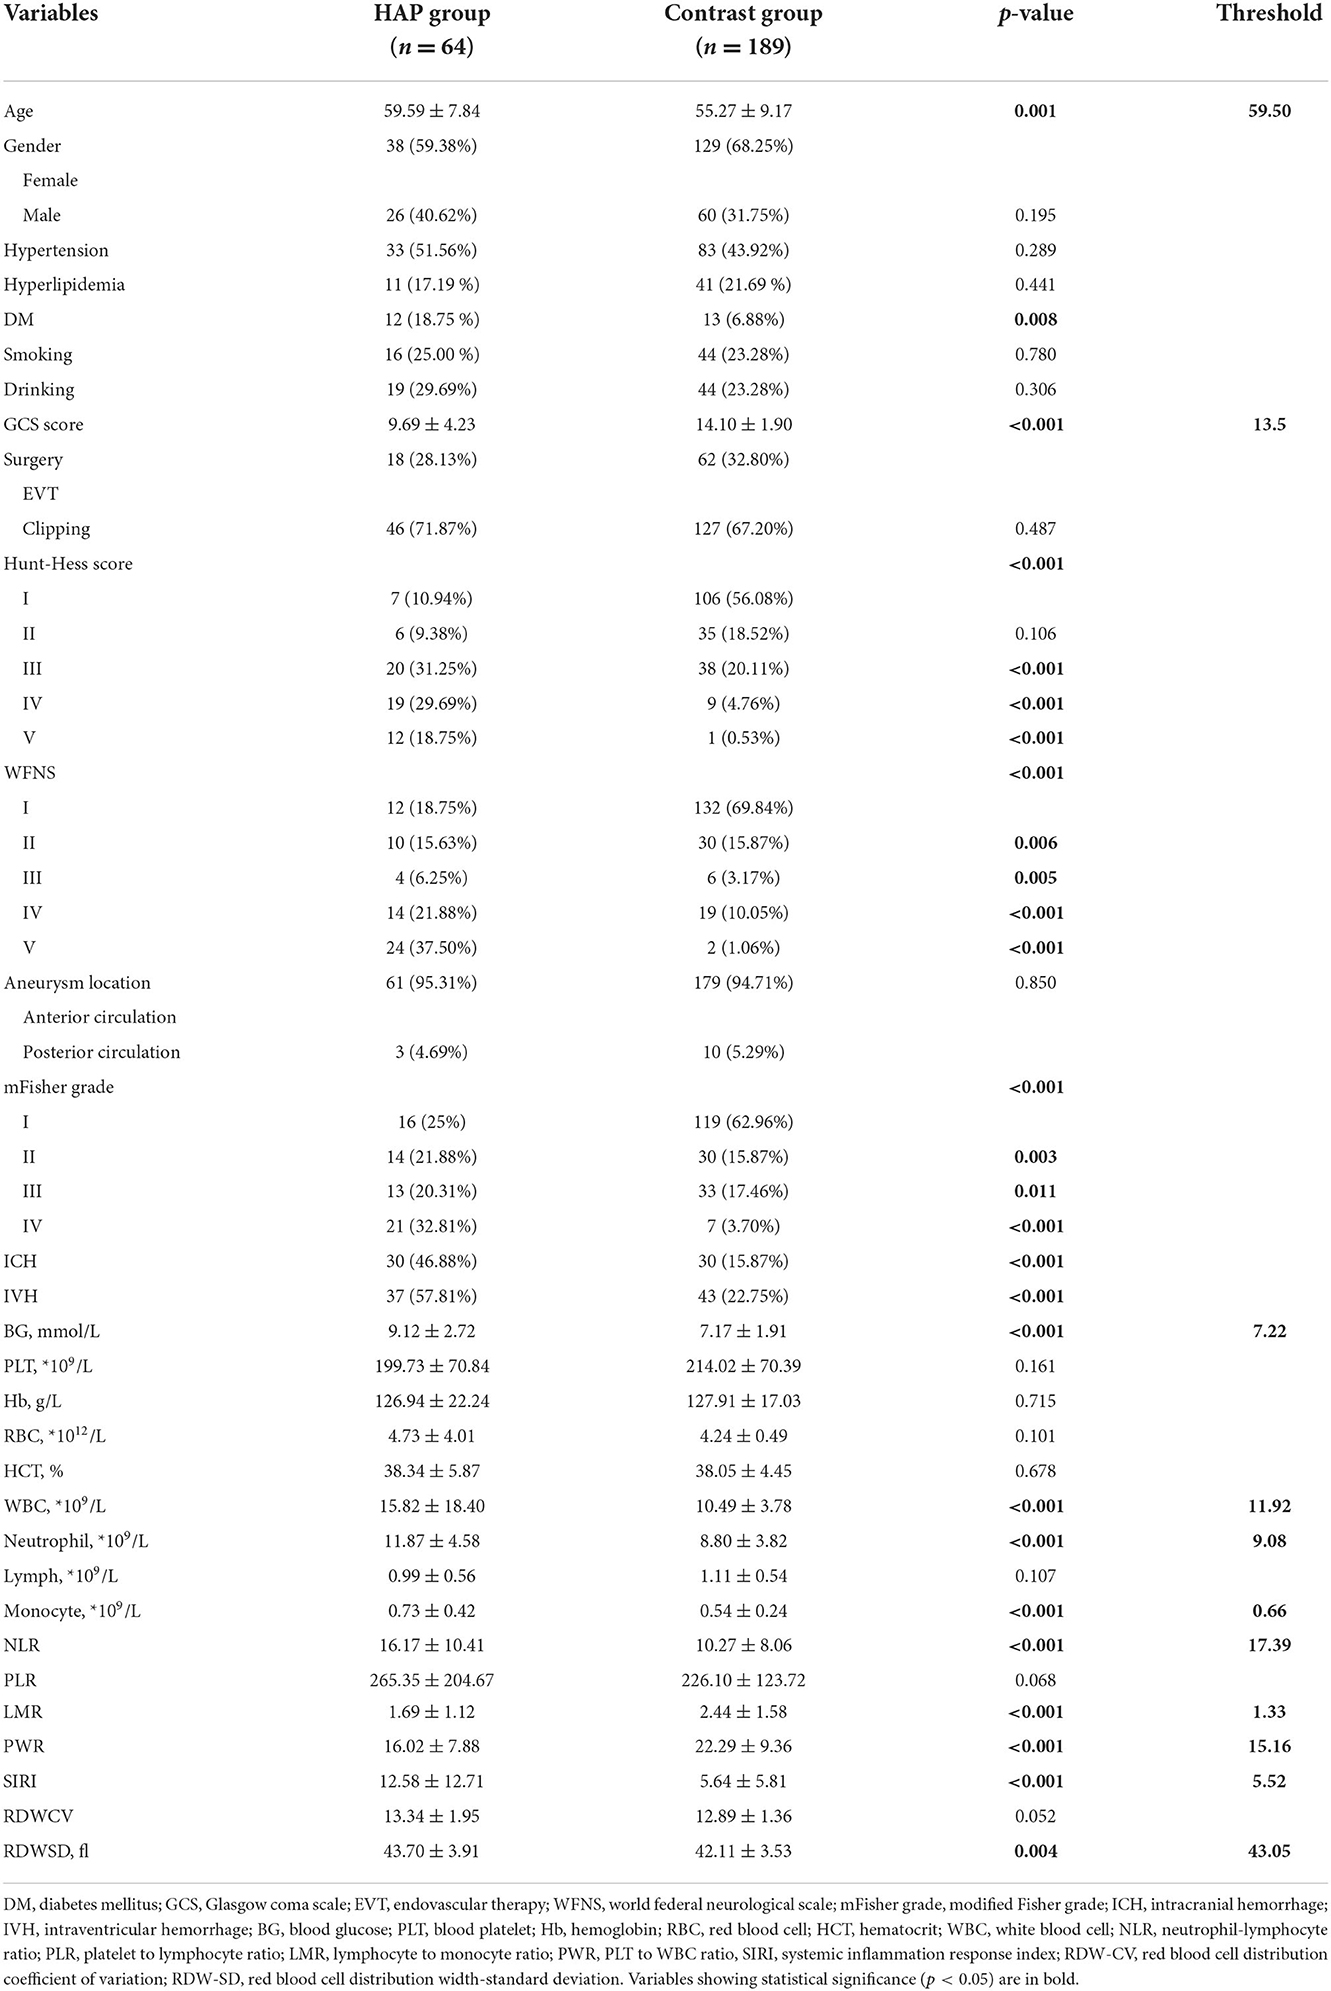
Table 1. Clinical characteristics and univariate analysis of the cohorts.
Statistical analysis
Statistical analysis was performed using SPSS 20.0 (IBM Inc, Chicago, IL). Continuous variables were expressed as mean ± SD. Categorical variables were expressed as frequencies (percentages). The Kolmogorov–Smirnov test was performed to determine whether the parameter dataset was normally distributed. A univariate logistic analysis was used for all variables. Significant parameters were then entered into a multivariate logistic regression using the stepwise forward method to identify the independent risk factors. A logistic model (Model-Logit) was established based on the independent risk factors. We used risk factor categories to develop a new model (Model-Cat). Receiver operating characteristic (ROC) curves were generated to calculate significant variables of areas under the curve (AUCs) and cutoffs. The Delong test was performed to compare the AUCs. Based on the literature (15), predictive scores and corresponding risk estimate were calculated. Differences where p < 0.05 were considered statistically significant.
Results
Patient demographics
We included 253 patients with aSAH. Of these, 64 patients developed HAP, with an incidence of 25.30%. In the HAP group, 64 patients included 38 females (59.38%) and 26 males (40.62%) with a mean age of 59.59 (range 44–76 years). In the non-HAP group, 189 patients included 129 females and 60 males with a mean age of 55.27 (range 28–77 years). Demographics are displayed in Table 1.
Predictive factors for HAP
The results of the calculation and univariate analysis are shown in Table 1. The distribution of the significant variables is shown in Figure 2. The univariate logistic regression showed that, compared to the non-HAP group, the HAP group had significantly greater age (59.59 vs. 55.27, p = 0.001), BG (9.12 vs. 7.17 mmol/L, p < 0.001), WBC (15.82 vs. 10.49, p < 0.001), neutrophils (11.87 vs. 8.80, p < 0.001), monocytes (0.73 vs. 0.54, p < 0.001), NLR (16.17 vs. 10.27, p < 0.001), SIRI (12.58 vs. 5.64, p < 0.001), and RDW-SD (43.70 vs. 42.11, p = 0.004). Diabetes mellitus (p < 0.001), Hunt-Hess score ≥ III (p < 0.001), intracerebral hemorrhage (p < 0.001), and intraventricular hemorrhage (p < 0.001) were significantly associated with HAP. Lower GCS scores (9.69 vs. 14.10, p < 0.001), lymphocyte-to-monocyte ratios (1.69 vs. 2.44, p < 0.001) and platelet-to-WBC ratios (16.02 vs. 22.29, p < 0.001) were found in the HAP group. WFNS ≥ II, Hunt-Hess grade ≥ III, and modified Fisher grade ≥2 were significantly associated with HAP. The thresholds to discriminate the higher risk of HAP with cutoff values of the significant continuous variables with the highest sensitivity and specificity are displayed in Table 1.
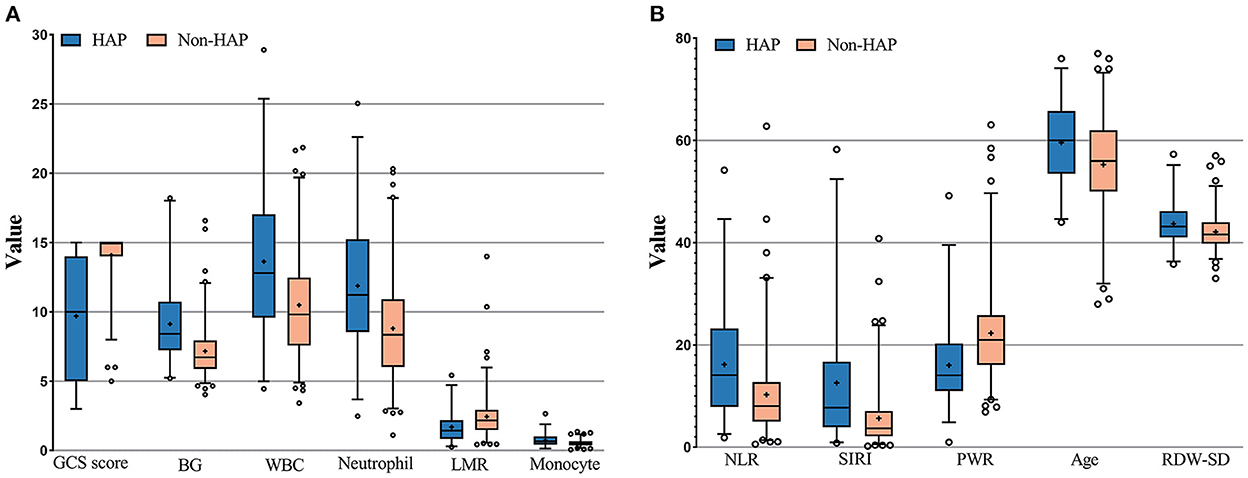
Figure 2. (A,B) Measurement of the significant variables in univariate analysis; GCS score, Glasgow coma scale score; LMR, Leukocyte to monocyte ratio; NLF, neutrophil to lymphocyte ratio; SIRI, systemic inflammation response index; PWR, platelet to white blood cell ratio; RDW-SD, red blood cell distribution width standard deviation.
Using the stepwise forward method, the multivariate logistic regression results are displayed in Table 2. The age [p = 0.012, odds ratio (OR) = 1.059, confidence interval (CI) = 1.013–1.107], BG (>7.22 mmol/L; p = 0.011, OR = 2.781, CI = 1.263–6.119), RDW-SD (p = 0.024, OR = 1.118, CI = 1.015–1.231), and GCS score (p < 0.001, OR = 0.710, CI = 0.633–0.798) were independent risk factors. Based on these independent risk factors, we established the Model-Logit and the Model-Cat (Table 3). Corresponding points and risk estimates are displayed in Table 4.
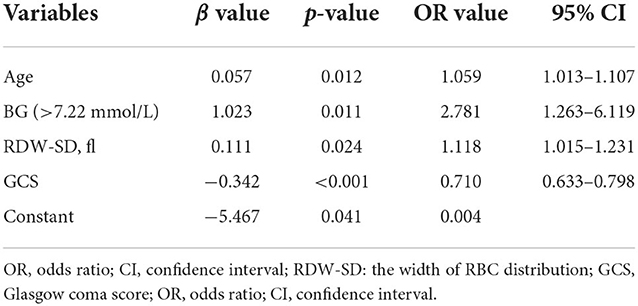
Table 2. Results of multivariate logistic regression.
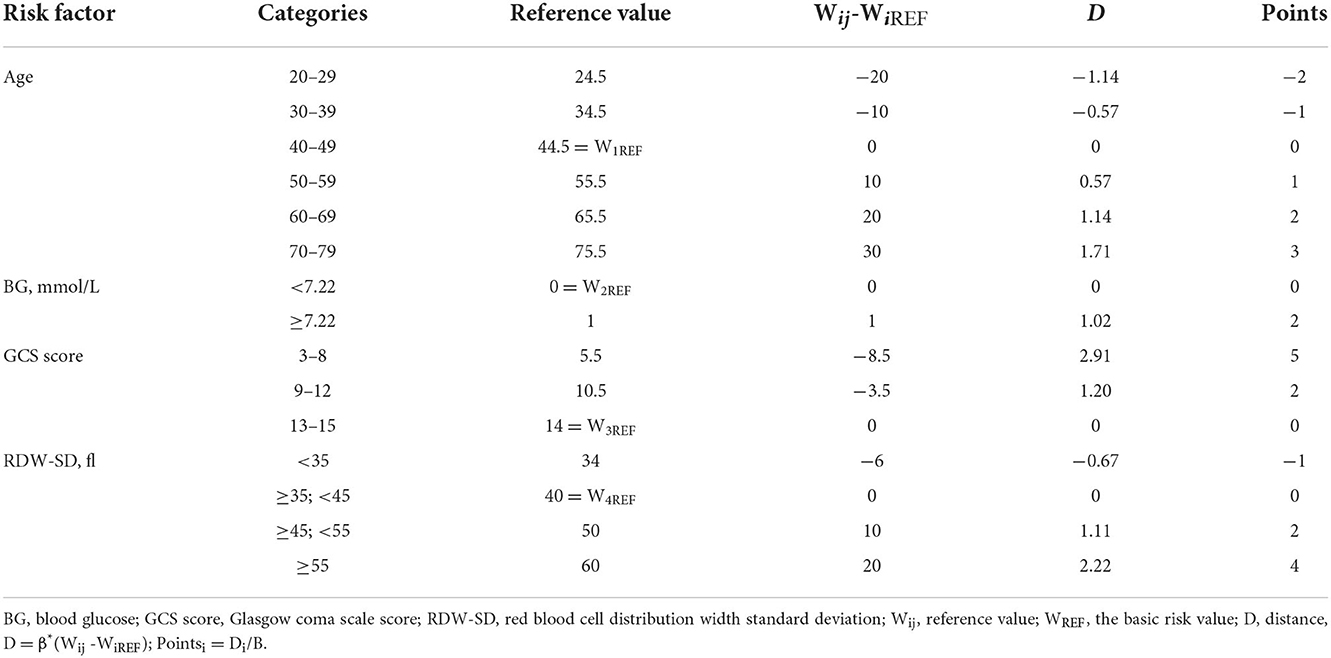
Table 3. Predictive model using risk factor categories.
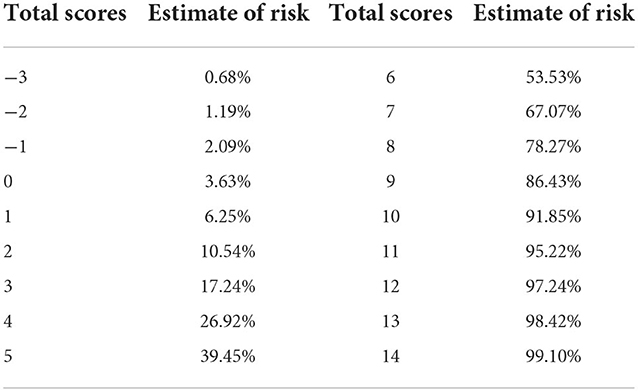
Table 4. Estimate of risk corresponding to total scores.
Model-Logit and Model-Cat
The Model-Logit was as follows: Logit(P) = −5.467 + 0.057 * age + 1.023 * BG (>7.22 mmol/L, yes = 1, no = 0) + 0.111 * RDW-SD−0.342 * GCS. This model was accurate but inconvenient for clinical use. Therefore, we established a Model-Cat (Table 3) whose method is similar to Wilson et al. (15). Based on our samples. The reference values (Wij) are displayed in Table 3. We set the basic risk value (WiREF) of age, BG (>7.22), GCS, and RDW-SD as 44.5, 0, 14, and 40, respectively. When the parameters exceeded the WiREF, the greater points represented higher risks. The distance (D) was calculated based on the equation: . We set the constant (B) change of each risk factor for each point in the model. We regarded every increase of 10 years of the age as one point, as follows: B = 10*βage, Pointsi = Di/B. Finally, the risk estimate (P) corresponding to the total score was based on the following equation:
Total scores ranged from −3 to 14 points. The total points and risk estimates are displayed in Table 4.
To verify the model of risk factor categories, we generated ROC curves in both models. In the Model-Logit, the AUC of the Model-Logit, GCS, age, BG (>7.22 mmol/L), and RDW-SD were 0.865, 0.819, 0.634, 0.698, and 0.625, respectively (Figure 3). The Delong test showed that the AUC of the Model-Logit was significantly higher than the GCS (p = 0.0386), age (p < 0.001), BG (>7.22 mmol/L; p < 0.001), and RDW-SD (p < 0.001). In the Model-Cat, the AUCs for GCS, age, BG, and RDW-SD were 0.850, 0.760, 0.700, 0.641, and 0.564, respectively (Figure 4A). The Delong test was also performed to compare the ROC curves between the models. The difference in areas was 0.015; however, the AUC of the Model-Logit was insignificantly higher than that of the Model-Cat (p = 0.157). This finding suggests that the Model-Cat is convenient, and the accuracy is close to Model-Logit. Cutoff values of the Model-Logit and Model-Cat were −0.849 and 4.5 points, respectively. Therefore, we considered scores of −3 to 4 as the low-risk group and 5–14 as the high-risk group. Low- and high-risk cohorts are represented in Figure 4B.
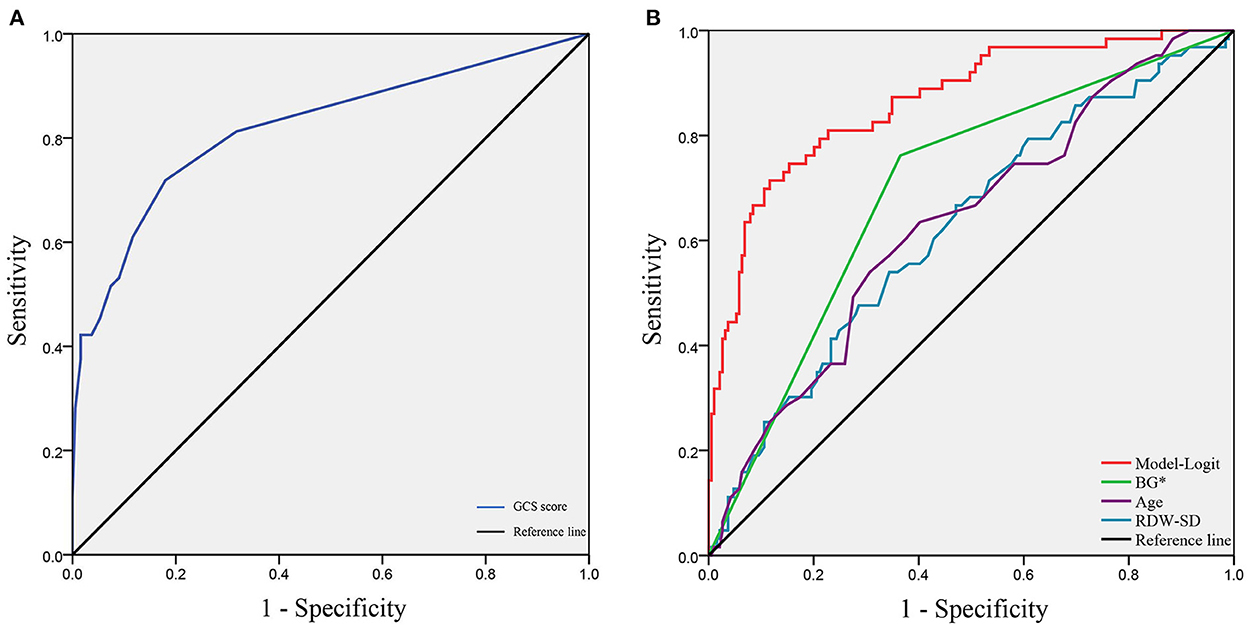
Figure 3. ROC analysis of the Model-Logit and independent risk factors. (A) GCS score as a protective role with the AUC of 0.819; (B) AUCs of the Model-Logit, BG*, age, and RDW-SD are 0.865, 0.698, 0.634, and 0.625, respectively. Model-Logit, logistic model; GCS score, Glasgow coma scale score; BG*, blood glucose (>7.22 mmol/L); RDW-SD, red blood cell width distribution standard deviation.
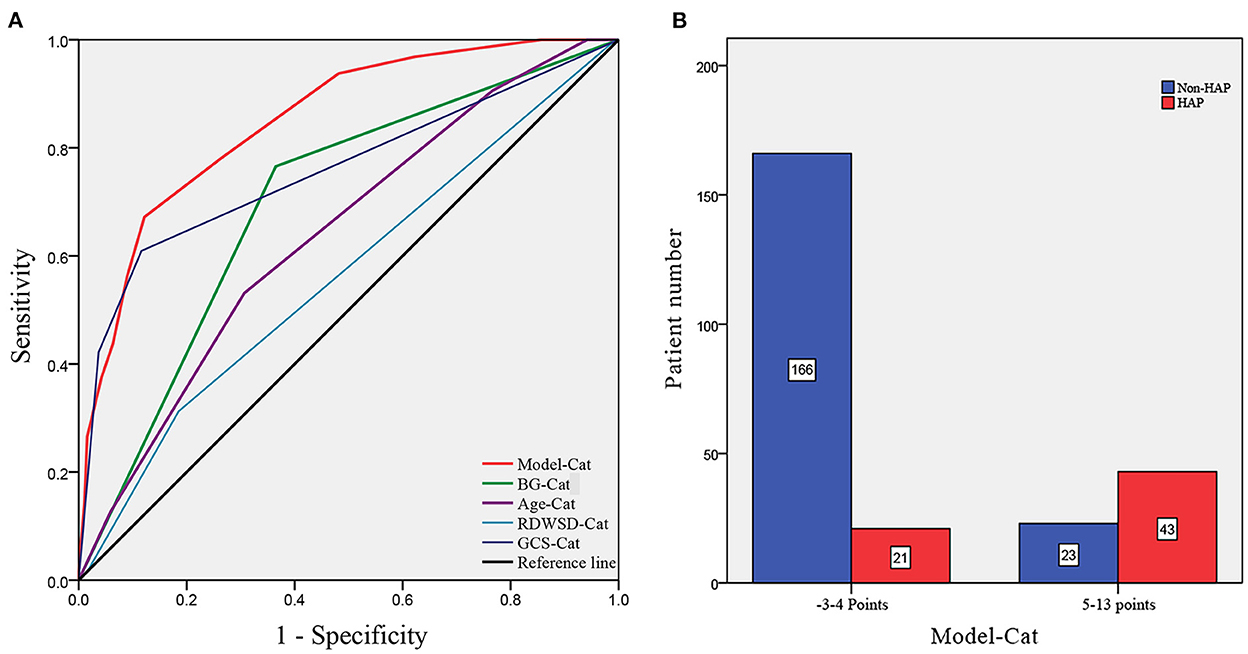
Figure 4. ROC analysis of the Model-Cat and risk level classification. (A) AUCs of the Model-Cat, BG-Cat, Age-Cat, RDWSD-Cat, and GCS-Cat were 0.850, 0.700, 0.641, and 0.564, and 0.760, respectively. (B) Patient numbers are classified as low-risk level (−3 to 4 points) and high-risk level (5–14 points). Model-Cat, predictive model using risk factor category; Glu-Cat, blood glucose (>7.22 mmol/L) category; Age-Cat, age category; RDWSD-Cat, red blood cell distribution standard deviation category; GCS-Cat, Glasgow coma scale score category.
Discussion
Aneurysmal subarachnoid hemorrhage (aSAH) accounts for ~5% of strokes (16). Despite substantial advancements in the care of aSAH, the mortality rates are 32%−67%, and one-third become dependent on care (2). About one-third of patients with SAH suffer from systemic infections (mainly pneumonia), which can lead to additional mortality after SAH (3, 5). Cerebral hypoxia due to disturbed cerebral circulation generates exogenous materials that cause early brain injury (2, 17). For these reasons, preventing hypoxia is critical. Pulmonary complications damage air exchange and worsen hypoxia, aggravating brain injury (1, 2). Therefore, evaluating the possibility of developing pneumonia during hospitalizations in the early stage and subsequently avoiding potential risk factors is desirable to prevent HAP and improve outcomes in aSAH patients (4).
Hospital-acquired pneumonia in aSAH requires attention. Kumar et al. (18) demonstrated that individuals with HAP had worse long-term outcomes. Khanzadeh et al. (19) showed NLR could be recommended as a biomarker for predicting infection, particularly pneumonia, in stroke patients. Some studies returned inconsistent results and identified independent risk factors, including weekend admission, Hunt-Hess grade III, external ventricular drain, male sex, use of mannitol, enteral feeding, WFNS score, and neutrophil count (4, 20). They did not apply a specific value to discriminate against high risk. Age, BG, RDW-SD, and GCS were independent risk factors in our study. A Model-Cat was established, and the AUC was close to that of the Model-Logit (0.850 vs. 0.865, Delong test, p = 0.157), which could aid practical evaluation.
Advanced age is associated with more risk of HAP in aSAH patients. HAP cohorts had a mean age of 59.59 years old, with a threshold of 59.50 years old. Wang et al. and Ding et al. stressed the significance of age, and their mean value was higher than ours (61, 59.79 vs. 59.50). The optimal threshold was age c60, and the patients with aSAH were at high risk. The World Health Organization defines older people as those over 60. Thus, in clinical use, older people (The optimal threshold w60) with aSAH had a higher risk of HAP.
Blood glucose (>7.22 mmol/L) is a two-category variable applied to the risk threshold with a predictive value. High glucose levels are frequently associated with vasospasm, secondary ischemia, and poor outcomes (2, 21, 22). Hyperglycemia might be expected in aSAH patients due to the transient stress reaction and an acute metabolic response (21). Zhang et al. (23) found that the BG of SAH patients with poor outcomes had a mean value of 7.34 mmol/L, which exceeded the threshold of 7.22 in our study. Eagles et al. (13) identified an optimal BG target in aSAH patients (<9.2 mmol/L), which is close to the BG value (9.12 mmol/L) in our HAP cohort. Abulhasan et al. (24) analyzed 419 patients with aSAH and found that BG (>10 mmol/L) increased the risk of pneumonia. In our study, the risk of HAP would increase 2.781-fold when the admission BG exceeded 7.22 mmol/L.
Low GCS is a common predictor of poor outcomes in intracranial hemorrhage; a pulmonary infection might be the explanation. In our study, the mean value of GCS in the HAP group was lower significantly than in the non-HAP group (9.69 vs. 14.10). Consistent with our results, several studies also found that low GCS was associated with a higher risk of developing pneumonia in aSAH patients (11). Wang et al. (4) found that HAP patients had lower GCS scores than the threshold of GCS in our study (12 < 13.5). Dunn et al. (25) reported an independent association between GCS and dysphagia. Dysphagia could increase the risk of aspiration pneumonia and lung infections. The GCS reflects the extent of the brain injury, and the subsequent impaired cardiopulmonary function and systematic inflammation could produce worse outcomes (4). Chaudhry et al. (3) also stressed that immunodepression is probably the most crucial mechanism leading to pneumonia infections after aSAH. The study of Faura et al. (16) highlighted that stroke generated powerful inflammatory cascades and the peripheral immune system immunosuppression, which could enhance the risk of infection.
Red blood cell distribution width-SD refers to the degree of variation in the volume of red blood corpuscle in circulating plasma (12). Several lines of evidence suggested that RDW-SD was significantly associated with systemic inflammatory responses (26, 27). Nakamura et al. (27) reported that substantial destroyed RBCs follow activated inflammatory responses, which promote hematopoiesis and accelerate the production of immature RBCs. Thus, increased RDW-SD could serve as a proxy for an inflammatory state. An aneurysm rupture would cause brain injury and cause a systematic inflammatory response. Peripheral immunosuppression further aggravates the risk of infection (16). Furthermore, there is no specific value to identify the risk of HAP. In our study, higher RDW-SD could increase the risk of HAP in aSAH patients, with a threshold of 43.05.
Even though any single markers presented good performance in predicting HAP, they were only highlighted by their significance and applied thresholds. Numerous factors contributed to the results. Predictive models could aid these evaluations. Model-Logit was established; it is accurate but inconvenient for clinical use. The Model-Cat using the risk factor categories was superior. The AUC of the Model-Cat was insignificantly lower than that of the Model-Logit (0.850 vs. 0.865, Delong test, p = 0.157). Furthermore, the AUCs of models exceeded any single marker. The risk estimate corresponding to the total point could be used in future studies.
Previous studies paid scarce attention to valid predictive models. Wang et al. proposed a model that included simplified scores of WFNS, neutrophils, RBC transfusion, and tracheostomy (4). It performed well with an AUC of 0.808 and a cutoff of 0.2696 to identify high-risk patients. Our Model-Cat presented a higher AUC (0.850 vs. 0.808) and provided risk factor categories to identify individualized risks. The optimal cutoff of the Model-Cat was 4.5, and patients could be divided into low-risk (−3 to 4 points) and high-risk cohorts (5 to 14 points). Effective prevention should be implemented in high-risk HAP patients with aSAH.
There were several limitations in this study. First, we only considered aSAH in a single institute from 2020 to 2022. The limited sample size might have decreased the accuracy of our findings. Second, our study did not consider tracheotomy and mechanical ventilation. We aimed to test the admission state to evaluate the risk of HAP; these factors may cause selection bias. Third, drug usage records were not recorded. Mannitol, crystalloid, nimodipine, anticonvulsant, and proton pump inhibitors might influence the development of HAP. Fourth, some laboratory parameters were not included (e.g., procalcitonin, IL-10, and C-reactive protein). Fifth, we did not involve parameters correlated with the COVID-19, even though the COVID-19 could enhance the possibilities of the aneurysm rupture (28). Finally, some clinical manifestations were not included: dysphagia, dysarthria, and hearing failure (7, 8). In future studies, more cases should be gathered at several centers to identify other independent risk factors and increase the predictive model's accuracy.
Conclusions
In this retrospective study, age, BG (>7.22 mmol/L), GCS, and RDW-SD were independent risk factors for HAP in aSAH patients. The Model-Cat was close to the Model-Logit but more convenient for practical evaluation. The aSAH patients with total points from 5 to 14 had a high-risk HAP level. They require attention during treatment.
Data availability statement
The raw data supporting the conclusions of this article will be made available by the authors, without undue reservation.
Ethics statement
This study was reviewed and approved by institutional ethics committee at Tongji Hospital. Written informed consent was obtained from all participants or their legal guardians/next of kin for their participation in this study.
Author contributions
S-QH and J-NH: conceptualized the study, wrote the manuscript, collected, and analyzed data. R-DC: revised the draft paper. J-SY: supervision. All authors contributed to the article and approved the submitted version.
Conflict of interest
The authors declare that the research was conducted in the absence of any commercial or financial relationships that could be construed as a potential conflict of interest.
Publisher's note
All claims expressed in this article are solely those of the authors and do not necessarily represent those of their affiliated organizations, or those of the publisher, the editors and the reviewers. Any product that may be evaluated in this article, or claim that may be made by its manufacturer, is not guaranteed or endorsed by the publisher.
References
1. Neifert SN, Chapman EK, Martini ML, Shuman WH, Schupper AJ, Oermann EK, et al. Aneurysmal subarachnoid hemorrhage: the last decade. Transl Stroke Res. (2021) 12:428–46. doi: 10.1007/s12975-020-00867-0
2. Sharma D. Perioperative management of aneurysmal subarachnoid hemorrhage. Anesthesiology. (2020) 133:1283–305. doi: 10.1097/ALN.0000000000003558
3. Chaudhry SR, Kahlert UD, Kinfe TM, Lamprecht A, Niemelä M, Hänggi D, et al. Elevated systemic il-10 levels indicate immunodepression leading to nosocomial infections after aneurysmal subarachnoid hemorrhage (Sah) in patients. Int J Mol Sci. (2020) 21:1569. doi: 10.3390/ijms21051569
4. Wang R, Zhang J, He M, Xu J. A novel risk score for predicting hospital acquired pneumonia in aneurysmal subarachnoid hemorrhage patients. Int Immunopharmacol. (2022) 108:108845. doi: 10.1016/j.intimp.2022.108845
5. Mouchtouris N, Lang MJ, Barkley K, Barros G, Turpin J, Sweid A, et al. Predictors of hospital-associated complications prolonging ICU stay in patients with low-grade aneurysmal subarachnoid hemorrhage. J Neurosurg. (2019) 132:1829–35. doi: 10.3171/2019.1.JNS182394
6. Elkind MSV, Boehme AK, Smith CJ, Meisel A, Buckwalter MS. Infection as a stroke risk factor and determinant of outcome after stroke. Stroke. (2020) 51:3156–68. doi: 10.1161/STROKEAHA.120.030429
7. Kumar S, Marchina S, Massaro J, Feng W, Lahoti S, Selim M, et al. Acdd(4) score: a simple tool for assessing risk of pneumonia after stroke. J Neurol Sci. (2017) 372:399–402. doi: 10.1016/j.jns.2016.10.050
8. Kishore AK, Vail A, Bray BD, Chamorro A, Napoli MD, Kalra L, et al. Clinical risk scores for predicting stroke-associated pneumonia: a systematic review. Eur Stroke J. (2016) 1:76–84. doi: 10.1177/2396987316651759
9. Zapata-Arriaza E, Moniche F, Blanca PG, Bustamante A, Escudero-Martínez I, Uclés O, et al. External validation of the Isan, A2ds2, and Ais-Aps scores for predicting stroke-associated pneumonia. J Stroke Cerebrovasc Dis. (2018) 27:673–6. doi: 10.1016/j.jstrokecerebrovasdis.2017.09.059
10. Wang Q, Liu Y, Han L, He F, Cai N, Zhang Q, et al. Risk factors for acute stroke-associated pneumonia and prediction of neutrophil-to-lymphocyte ratios. Am J Emerg Med. (2021) 41:55–9. doi: 10.1016/j.ajem.2020.12.036
11. Chen Y, Lian BQ, Peng L, Ding CY, Lin YX, Yu LH, et al. Neutrophil to lymphocyte ratio is a prognosis factor for post-operative pneumonia in aneurysmal subarachnoid hemorrhage patients. Chin Med J. (2020) 134:682–9. doi: 10.1097/CM9.0000000000001304
12. Yan L, Wang B, Chen S, Zhou H, Li P, Zhou L, et al. The ratio of superoxide dismutase to standard deviation of erythrocyte distribution width as a predictor of systemic lupus erythematosus. J Clin Lab Anal. (2020) 34:e23230. doi: 10.1002/jcla.23230
13. Eagles ME, Newton BD, Rosgen BK, Ayling OGS, Muram S, Tso MK, et al. Optimal glucose target after aneurysmal subarachnoid hemorrhage: a matched cohort study. Neurosurgery. (2022) 90:340–6. doi: 10.1227/NEU.0000000000001823
14. Smith CJ, Kishore AK, Vail A, Chamorro A, Garau J, Hopkins SJ, et al. Diagnosis of stroke-associated pneumonia: recommendations from the pneumonia in stroke consensus group. Stroke. (2015) 46:2335–40. doi: 10.1161/STROKEAHA.115.009617
15. Wilson PW, D'Agostino RB, Levy D, Belanger AM, Silbershatz H, Kannel WB. Prediction of coronary heart disease using risk factor categories. Circulation. (1998) 97:1837–47. doi: 10.1161/01.CIR.97.18.1837
16. Faura J, Bustamante A, Miró-Mur F, Montaner J. Stroke-induced immunosuppression: implications for the prevention and prediction of post-stroke infections. J Neuroinflammation. (2021) 18:127. doi: 10.1186/s12974-021-02177-0
17. Chen Y, Galea I, Macdonald RL, Wong GKC, Zhang JH. Rethinking the original changes in subarachnoid haemorrhage: focusing on real-time metabolism during early brain injury. EBioMedicine. (2022) 83:104223. doi: 10.1016/j.ebiom.2022.104223
18. Kumar RG, Kesinger MR, Juengst SB, Brooks MM, Fabio A, Dams-O'Connor K, et al. Effects of hospital-acquired pneumonia on long-term recovery and hospital resource utilization following moderate to severe traumatic brain injury. J Trauma Acute Care Surg. (2020) 88:491–500. doi: 10.1097/TA.0000000000002562
19. Khanzadeh S, Lucke-Wold B, Eshghyar F, Rezaei K, Clark A. The neutrophil to lymphocyte ratio in poststroke infection: a systematic review and meta-analysis. Dis Markers. (2022) 2022:1983455. doi: 10.1155/2022/1983455
20. Meng N, Ye Z, Liu Y, Qin C, Su Y. Impact of the 'weekend effect' on hospital-acquired pneumonia after aneurysmal subarachnoid hemorrhage. Postgrad Med. (2021) 133:974–8. doi: 10.1080/00325481.2021.1959936
21. Kruyt ND, Biessels GJ, de Haan RJ, Vermeulen M, Rinkel GJ, Coert B, et al. Hyperglycemia and clinical outcome in aneurysmal subarachnoid hemorrhage: a meta-analysis. Stroke. (2009) 40:e424–30. doi: 10.1161/STROKEAHA.108.529974
22. Wang JH, Li H, Yang HK, Chen RD, Yu JS. Relationship between the mean of 24-h venous blood glucose and in-hospital mortality among patients with subarachnoid hemorrhage: a matched cohort study. Front Neurol. (2022) 13:904293. doi: 10.3389/fneur.2022.904293
23. Zhang Z, Zhao Y, Liu Y, Wang X, Xu H, Fang Y, et al. Effect of stress-induced hyperglycemia after non-traumatic non-aneurysmal subarachnoid hemorrhage on clinical complications and functional outcomes. CNS Neurosci Ther. (2022) 28:942–52. doi: 10.1111/cns.13826
24. Abulhasan YB, Alabdulraheem N, Schiller I, Rachel SP, Dendukuri N, Angle MR, et al. health care-associated infections after subarachnoid hemorrhage. World Neurosurg. (2018) 115:e393–403. doi: 10.1016/j.wneu.2018.04.061
25. Dunn K, Rumbach A, Finch E. Dysphagia following non-traumatic subarachnoid haemorrhage: a prospective pilot study. Int J Lang Commun Disord. (2020) 55:702–11. doi: 10.1111/1460-6984.12554
26. Poz D, De Falco E, Pisano C, Madonna R, Ferdinandy P, Balistreri CR. Diagnostic and prognostic relevance of red blood cell distribution width for vascular aging and cardiovascular diseases. Rejuvenation Res. (2019) 22:146–62. doi: 10.1089/rej.2018.2094
27. Nakamura M, Bessho S, Wada S. Analysis of red blood cell deformation under fast shear flow for better estimation of hemolysis. Int J Numer Method Biomed Eng. (2014) 30:42–54. doi: 10.1002/cnm.2587
Keywords: aneurysmal subarachnoid hemorrhage, hospital-acquired pneumonia (HAP), predictive model, risk factor, age, Glasgow coma scale (GCS), blood glucose, red blood cell width distribution standard deviation
Citation: Hu S-Q, Hu J-N, Chen R-D and Yu J-S (2022) A predictive model using risk factor categories for hospital-acquired pneumonia in patients with aneurysmal subarachnoid hemorrhage. Front. Neurol. 13:1034313. doi: 10.3389/fneur.2022.1034313
Received: 01 September 2022; Accepted: 23 November 2022;
Published: 06 December 2022.
Edited by:
Brandon Peter Lucke-Wold, University of Florida, United StatesReviewed by:
Sourabh Lahoti, OSF HealthCare, United StatesM. Kamran Athar, Thomas Jefferson University, United States
Copyright © 2022 Hu, Hu, Chen and Yu. This is an open-access article distributed under the terms of the Creative Commons Attribution License (CC BY). The use, distribution or reproduction in other forums is permitted, provided the original author(s) and the copyright owner(s) are credited and that the original publication in this journal is cited, in accordance with accepted academic practice. No use, distribution or reproduction is permitted which does not comply with these terms.
*Correspondence: Jia-Sheng Yu, yujiasheng2000@tjh.tjmu.edu.cn
†These authors have contributed equally to this work