 Martijn P. van den Heuvel1,2*
 Lianne H. Scholtens1,2
 Hannelore K. van der Burgh3
 Federica Agosta4
 Clara Alloza5,6Celso Arango6
 Bonnie Auyeung7 on behalf of Cambridge Child Development Project†,
  Simon Baron-Cohen7,
  Silvia Basaia4, Manon J. N. L. Benders8,
  Frauke Beyer9, Linda Booij10, Kees P. J. Braun11, Geraldo Busatto Filho12, Wiepke Cahn2,
  Dara M. Cannon13, Tiffany M. Chaim-Avancini12, Sandra S. M. Chan14, Eric Y. H. Chen15,
  Benedicto Crespo-Facorro16,
  Eveline A. Crone17, Udo Dannlowski18, Sonja M. C. de Zwarte2, Bruno Dietsche19,
  Gary Donohoe20,
  Stefan Du Plessis21,
  Sarah Durston2, Covadonga M. Díaz-Caneja6, Ana M. Díaz-Zuluaga22,
  Robin Emsley21,
  Massimo Filippi4, Thomas Frodl23,
  Martin Gorges24,
  Beata Graff25, Dominik Grotegerd18,
  Dariusz Gąsecki26, Julie M. Hall27, Laurena Holleran20, Rosemary Holt7
- 1Connectome Lab, CTG, CNCR, VU Amsterdam, Amsterdam, Netherlands
- 2UMC Utrecht Brain Center, Department of Psychiatry, University Medical Center Utrecht, Utrecht, Netherlands
- 3Department of Neurology, UMC Utrecht Brain Center, University Medical Center Utrecht, Utrecht, Netherlands
- 4Neuroimaging Research Unit, Institute of Experimental Neurology, Division of Neuroscience, IRCCS San Raffaele Scientific Institute, Vita-Salute San Raffaele University, Milan, Italy
- 5Division of Psychiatry, University of Edinburgh, Edinburgh, United Kingdom
- 6Department of Child and Adolescent Psychiatry, IiSGM, CIBERSAM, School of Medicine, Hospital General Universitario Gregorio Marañón, Universidad Complutense, Madrid, Spain
- 7Department of Psychiatry, Autism Research Centre, University of Cambridge, Cambridge, United Kingdom
- 8Department of Neonatology, UMC Utrecht Brain Center, Wilhelmina Children's Hospital, University Medical Center Utrecht, Utrecht, Netherlands
- 9Department of Neurology, CRC “Obesity Mechanisms”, Subproject A1, Max Planck Institute for Human Cognitive and Brain Sciences, University of Leipzig, Leipzig, Germany
- 10Department of Psychology, Concordia University, Montreal, QC, Canada
- 11Department of Child Neurology, UMC Utrecht Brain Center, Wilhelmina Children's Hospital, University Medical Center Utrecht, Utrecht, Netherlands
- 12Laboratory of Psychiatric Neuroimaging (LIM21), Faculdade de Medicina, Instituto de Psiquiatria, Hospital das Clinicas HCFMUSP, Universidade de São Paulo, São Paulo, Brazil
- 13Clinical Neuroimaging Laboratory, Centre for Neuroimaging and Cognitive Genomics (NICOG), NCBES Galway Neuroscience Centre, College of Medicine Nursing and Health Sciences, National University of Ireland Galway, Galway, Ireland
- 14Department of Psychiatry, Faculty of Medicine, Chinese University of Hong Kong, Hong Kong, China
- 15Department of Psychiatry, University of Hong Kong, Hong Kong, China
- 16Psychiatry Unit, Department of Medicine and Psychiatry, Hospital Universitario Marques de Valdecilla, IDIVAL, CIBERSAM, Hosptial Universitario Virgen del Rocío, Universidad de Seville, Seville, Spain
- 17Brain and Development Research Center, Leiden University, Leiden, Netherlands
- 18Department of Psychiatry, University of Münster, Münster, Germany
- 19Department of Psychiatry, University of Marburg, Marburg, Germany
- 20Cognitive Genetics and Cognitive Therapy Group, Neuroimaging and Cognitive Genomics Centre and NCBES Galway Neuroscience Centre, School of Psychology and Discipline of Biochemistry, National University of Ireland, Galway, Ireland
- 21Department of Psychiatry, Stellenbosch University, Cape Town, South Africa
- 22Research Group in Psychiatry GIPSI, Department of Psychiatry, Faculty of Medicine, Universidad de Antioquia, Medellín, Colombia
- 23Department of Psychiatry and Psychotherapy, University Hospital, Otto von Guericke University, Magdeburg, Germany
- 24Department of Neurology, University of Ulm, Ulm, Germany
- 25Department of Hypertension and Diabetology, Medical University of Gdańsk, Gdańsk, Poland
- 26Department of Neurology of Adults, Medical University of Gdańsk, Gdańsk, Poland
- 27Parkinson's Disease Research Clinic, Brain and Mind Centre, University of Sydney, Sydney, NSW, Australia
- 28Department of Medicine and Therapeutics, Chinese University of Hong Kong, Hong Kong, China
- 29Department of Psychiatry and Center for Mind, Brain and Behaviour, University of Marburg, Marburg, Germany
- 30Institute of Psychology, University of Gdańsk, Gdańsk, Poland
- 31Division of Neuropsychology, University of Zurich, Zurich, Switzerland
- 32Department of Endogenous Mental Disorders, Mental Health Research Center, Moscow, Russia
- 33Institute for Neuroscience and Medicine 7, Forschungszentrum Jülich, Jülich, Germany
- 34Clinic of Neurology, School of Medicine, University of Belgrade, Belgrade, Serbia
- 35Division of Psychiatry, University of Edinburgh, Edinburgh, United Kingdom
- 36Laboratory of Neuroimaging and Multimodal Analysis, Mental Health Research Center, Moscow, Russia
- 37Department of Psychiatry and Psychotherapy, Division of Mind and Brain Research, Charité - Universitätsmedizin Berlin, Berlin, Germany
- 38University Research Priority Program “Dynamics of Healthy Aging”, University of Zurich, Zurich, Switzerland
- 39Mood Disorders Program, Research Group in Psychiatry GIPSI, Department of Psychiatry, Faculty of Medicine, Hospital Universitario San Vicente Fundación, Universidad de Antioquia, Medellín, Colombia
- 40Frontlab, Centre National de la Recherche Scientifique, Institut du Cerveau et de la Moelle Épinière, UMR 7225, Paris, France
- 41Department of Psychology, Humboldt Universität zu Berlin, Berlin, Germany
- 42School of Medicine, Life and Health Sciences Research Institute (ICVS), University of Minho, Braga, Portugal
- 43Department of Psychiatry, Bellvitge Biomedical Research Institute-IDIBELL and CIBERSAM, Barcelona, Spain
- 44Department of Molecular Psychology, Institute of Psychology and Education, Ulm University, Ulm, Germany
- 45Psychiatry Unit, Department of Medicine and Psychiatry, IDIVAL, CIBERSAM, Hospital Universitario Marques de Valdecilla, Santander, Spain
- 46Research Group, Instituto de Alta Tecnología Médica, Universidad de Antioquia, Medellín, Colombia
- 47Priority Centre for Brain and Mental Health Research, The University of Newcastle, Newcastle, NSW, Australia
- 48Laboratory of Psychiatric Neuroimaging (LIM21), Faculdade de Medicina, Instituto de Psiquiatria, Hospital das Clinicas HCFMUSP, Universidade de São Paulo, São Paulo, Brazil
- 492nd Department of Radiology, Medical University of Gdańsk, Gdańsk, Poland
- 50Laboratory of Psychiatric Neuroimaging (LIM21), Departamento de Psiquiatria, Faculdade de Medicina, Universidade de São Paulo, São Paulo, Brazil
- 51BarcelonaBeta Brain Research Center, Pasqual Maragall Foundation, Barcelona, Spain
- 52Department of Psychiatry (IDIBELL and CIBERSAM) and Department of Psychobiology and Methodology in Health Sciences (UAB), Bellvitge Biomedical Research Institute-IDIBELL, CIBERSAM and Universitat Autònoma de Barcelona, Barcelona, Spain
- 53Laboratory of Neuroimaging and Multimodal Analysis, Mental Health Research Center, Moscow, Russia
- 54Neuroimaging Unit, Technological Facilities, Valdecilla Biomedical Research Institute IDIVAL, CIBERSAM, Santander, Spain
- 55Institute for Neuroscience and Medicine 7/Institute of Systems Neuroscience, Forschungszentrum Jülich - Heinrich Heine Universitaet Duesseldorf, Jülich, Germany
- 56Clinical Translational Neuroscience Laboratory, Department of Psychiatry and Human Behavior, University of California, Irvine, Irvine, CA, United States
- 57Department of Child and Adolescent Psychiatry/Psychology, Erasmus Medical Center, Rotterdam, Netherlands
- 58Donders Institute for Brain, Cognition, and Behaviour, Radboud University Medical Center, Nijmegen, Netherlands
- 59Departments of Neurology, Cognitive Neurology, Max Planck Institute for Human Cognitive and Brain Sciences, University of Leipzig, Leipzig, Germany
- 60Departments of Psychiatry, Anatomy and Neurosciences, Amsterdam UMC, Amsterdam, Netherlands
- 61Department of Neurology, Epilepsy Centre, University of Munich Hospital, Munich, Germany
- 62Division of Mind and Brain Research, Department of Psychiatry and Psychotherapy CCM, Charité Universitätsmedizin Berlin, Corporate Member of Berlin Institute of Health, Freie Universität Berlin, Humboldt-Universität zu Berlin, Berlin, Germany
- 63Division of Mind and Brain Research, Department of Psychiatry and Psychotherapy CCM, Charité - Universitätsmedizin Berlin, Corporate Member of Berlin Institute of Health, Freie Universität Berlin, Humboldt-Universität zu Berlin, Berlin, Germany
- 64Laboratory of Psychiatric Neuroimaging (LIM21), Faculdade de Medicina, Instituto de Psiquiatria, Hospital das Clinicas HCFMUSP, São Paulo, Brazil
- 65Instituto de Ensino e Pesquisa, Hospital Sírio-Libanês, Universidade de São Paulo, São Paulo, Brazil
- 66Department of Neurology, Max Planck Institute for Human Cognitive and Brain Sciences, Leipzig, Germany
We organized 10Kin1day, a pop-up scientific event with the goal to bring together neuroimaging groups from around the world to jointly analyze 10,000+ existing MRI connectivity datasets during a 3-day workshop. In this report, we describe the motivation and principles of 10Kin1day, together with a public release of 8,000+ MRI connectome maps of the human brain.
Ongoing grand-scale projects like the European Human Brain Project (1), the US Brain Initiative (2), the Human Connectome Project (3), the Chinese Brainnetome (4) and exciting world-wide neuroimaging collaborations such as ENIGMA (5) herald the new era of big neuroscience. In conjunction with these major undertakings, there is an emerging trend for bottom-up initiatives, starting with small-scale projects built upon existing collaborations and infrastructures. As described by Mainen et al. (6), these initiatives are centralized around self-organized groups of researchers working on the same challenges and sharing interests and specialized expertise. These projects could scale and open up to a larger audience and other disciplines over time, eventually lining up and merging their findings with other programs to make the bigger picture.
10Kin1day
One type of event that fits well with this grass-roots collaboration philosophy are short gatherings of scientists around a single theme, bringing together expertise and tools to jointly analyze existing neuroscience data. We organized 10Kin1day, an MRI connectome event, with the goal to bring together an international group of researchers in the field of neuroimaging and consistently analyze MRI connectivity data of the human cerebrum. We organized the event around five founding principles:
• use existing neuroimaging data, available from many research groups around the world; we focused on diffusion MRI data and aimed to bring together 10,000+ datasets
• analyze data from varying cohorts and imaging protocols, using a single, straightforward analysis strategy to encourage across-group collaborations and multisite studies
• perform all processing during a short workshop, with only basic expertise of analysis needed
• provide education on how to analyze resulting connectome data, so participants can continue to work on their projects after the event
• each participant analyzes their own data and is free to decide what to do with their analyzed results
The 10K Workshop
Over 50 participants from 40 different neuroimaging groups gathered in The Netherlands for a 3-day event. Participants brought and worked on their own datasets, varying from MRI data on healthy human brain organization, cross-sectional and longitudinal brain development, aging, cognitive psychology, as well as MRI data of a wide range of neurological and psychiatric brain disorders (including among others: Schizophrenia, Mood Disorders, Alzheimer's Disease, Mild Cognitive Impairment, Amyotrophic Lateral Sclerosis, Frontotemporal Dementia, Epilepsy and Parkinson's Disease). Written informed consent of the included healthy controls and/or patients was obtained by each of the participating researchers at their local institute. 10 TB online storage space and 50,000+ CPU hours was reserved on the Cartesius supercomputer of the collaborative Information and Communication Technology (ICT) organization for Dutch education and research (SURF, https://surfsara.nl/) to analyze the data during the workshop. Workshop participants performed data quality checks on their data 1 week before the event after which they uploaded the MRI data (Diffusion Weighted Images (DWI) and pre-processed T1 data, see Materials and Methods) to their own user account on the supercomputer. During the workshop, participants were brought up to speed on DWI processing, connectome construction (see section Materials and Methods for details on the performed analysis), and running parallel jobs on a supercomputer. Together, a total of 15,947 MRI datasets were processed into anatomical connectome maps, with each output dataset including connectivity matrices with different types of connection weights and multiple parcellation resolutions (Figures 1A,B). Data processing was paralleled by interactive educational talks and workshops on connectome analysis.
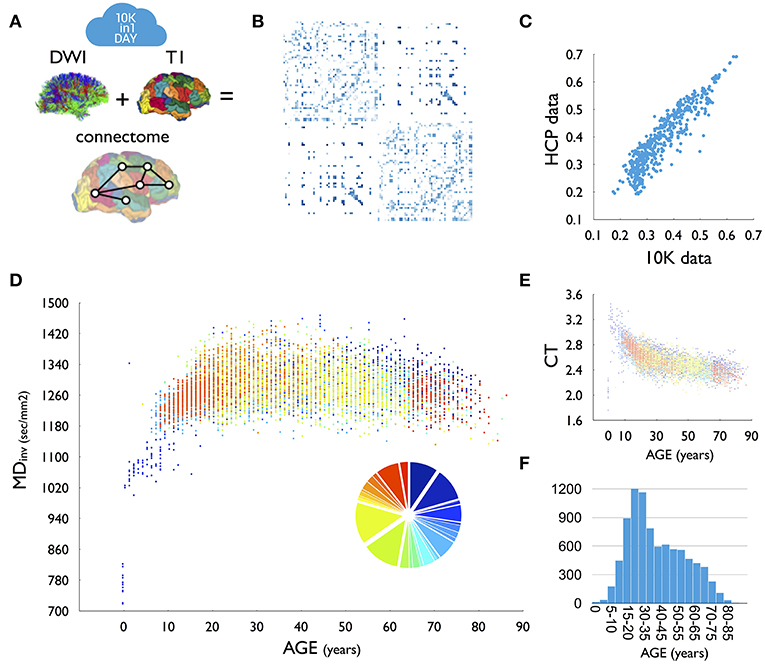
Figure 1. (A) For each dataset, DWI tractography was combined with T1-based parcellation of cerebral brain regions to reconstruct a brain network. (B) Group-averaged (group threshold 33%) FA matrix of the 10K dataset. (C) High overlap (r = 0.93) between group-averaged FA values as derived from high-resolution HCP data and the 10K dataset. (D) Relationship between age and average inverse mean diffusivity (MD, sec/mm2) across the 10K dataset. Colors indicate the different included datasets. Insert shows a pie diagram of the size of included datasets, color coded to set participation. One dataset (set_634413) was excluded from this plot, showing (across the age span) deviating FA (lower) and MD (higher) values than the other datasets (see methods). Due to the high total n, excluding this dataset did not change the relationship with age. (E) Relationship between age and average cortical thickness (CT). (F) Age distribution of the presented data as in (D,E). T1, anatomical MRI; DWI, diffusion weighted imaging; CT, cortical thickness.
Open Data
In line with the collaborative nature of the event, the 10K group discussed making the connectome maps available to the scientific community for non-commercial use, free of restrictions. We include herein the resulting individual connectome maps of 8,000+ connectome datasets across an age range of 0–90 years, with five different edge weights [number of traced streamlines (NOS), streamline density (SD), fiber length, fractional anisotropy (FA), and mean diffusivity (MD)] at three parcellation resolutions (80+ cortical and subcortical regions, 100+ and 200+ cortical regions, see section Materials and Methods for details). Connectome maps are presented anonymously and blinded for participation site, together with basic demographics (age in bins of 5 years, gender, patient/control status, Figure 1). Data is presented under the Non-Commercial Common Creative (CC BY-NC) license, free for all scientists to use in a non-commercial setting. A download request can be made at dutchconnectomelab.org for a download link to the data. Data for download includes connectivity matrices with five connectivity weights (NOS, FA, MD, fiber length, SD) at three atlas resolutions, information on the cortical and subcortical nodes, blinded group site and subject demographics (gender, age in 5 year bins, case/control).
Concluding Words
We performed a few first analyses on the joint dataset, including cross-site consistency, comparison to Human Connectome Project (HCP) data and a first examination of effects of age (see Materials and Methods for more detail). We observed a high average consistency across sites with an average cross-site overlap of 92% (sd:0.0251) and a cross-site correlation of FA weights r = 0.88 (sd:0.0958), as well as a high consistency of the 10K group averaged matrix with data derived from the high-quality HCP, with at least 69% of pathways identified in HCP also observed in the 10K set and with 98% of all non-existing connections in HCP verified in the 10K set (Figure 1C). Furthermore, the distribution of weights across reconstructed connections is highly similar across the two datasets (FA weights, r = 0.93, p < 0.0001, Figure 1C). Age analysis shows clear developmental patterns of cortical morphology (Figure 1E) and white matter microstructure across age. Analysis of inverse MD showed rapid growth of microstructure in early years, with continuing development throughout adolescence, peaking around the beginning of the third decade, followed by a steady pattern of decline throughout aging (Figure 1D).
We acknowledge that there are many shortcomings to the presented MRI connectome dataset. Besides general, inherent limitations of diffusion MRI (7), the presented dataset is a collation of data from a wide variety of groups, acquired with different scanners, different scanning protocols, varying data quality etcetera, and includes data from a mixture of different patient and control populations. While these limitations place constraints on the type of investigations that one can perform with such collated multi-site datasets, we are optimistic that the 10K dataset can be used as a large reference dataset for future studies, enabling many technical and neuroscientific research questions to be addressed (e.g., Figure 1). As such, we hope that the presented data will be of use to the neuroscience community in the examination of the human connectome. Above all, we hope that our report will inspire others to organize exciting 10Kin1day-type of events in the near future, bringing together existing neuroimaging data and further catalyze open neuroimaging research of the healthy and diseased brain.
Materials and Methods
A total of 42 groups (52 participants) participated in the workshop, some working on multiple datasets. Each dataset included a diffusion MRI scan and T1 MRI scan processed using FreeSurfer (8). Datasets across groups included data from 1.5 and 3 Tesla MRI with varying scanner protocols and number of applied DWI gradients. Data included MRI data of healthy participants and patients with a neurological or psychiatric disorder. Twenty-three groups were able to make their data available, making a total of 8,000+ connectome maps publicly available through means of this report. Reconstructed connectome maps are presented anonymously, coded for participation site and disease condition(s). Basic demographics of the datasets are included in the download set.
DWI Preprocessing
DWI datasets were corrected for susceptibility and eddy current distortions using the open tools from the FMRIB Software Library (FSL, http://fsl.fmrib.ox.ac.uk). Depending on their DWI dataset, participants preprocessed their data using the FSL eddy_correct or eddy tool. For those DWI sets that included a subset of scans with an opposite k-space read out, an additional field distortion map was formed and applied to the DWI images (9).
Cortical Parcellation
Before the event, the participants created FreeSurfer files based on their T1 images, with this output being subjected to varying degrees of quality control. The resulting parcellations of the cerebrum were used to select the regions of interest for the connectome reconstruction. The 68 cortical regions of FreeSurfer's standard Desikan-Killiany Atlas (10, 11) as well as 14 subcortical regions were selected as network regions. Additionally, FreeSurfer files were used to further parcellate the cortex into 114 and 219 regions, respectively using the Cammoun atlas (12).
Fiber Reconstruction
After preprocessing of the DWI data, in-house developed scripts were used to fit a diffusion tensor to the diffusion signal in each voxel of the white matter mask (selected based on the white matter segmentation map of the FreeSurfer files) using robust tensor fitting (13). Simple Diffusion Tensor Imaging (DTI) reconstruction was used due to its robustness and relatively low sensitivity to false positive reconstructions compared to more advanced reconstruction methods (14), and thus potentially being the least distorting solution for connectome reconstruction and analysis based on MR imaging data (15). Decomposition of the tensor into eigenvectors and eigenvalues was used to select the main diffusion direction in each voxel, and to compute fractional anisotropy (FA) and mean diffusivity (MD) (16). Deterministic fiber tractography was used to construct large-scale white matter pathways. Eight seeds (evenly distributed across the voxel) started in each white matter voxel, and fiber streamlines were formed by following the main diffusion direction from voxel to voxel using the fiber assignment by continuous tracking (FACT) algorithm (17), until one of the stopping criteria was met. A streamline was stopped when (1) it hit a voxel with an FA < 0.1, (2) went out of the brain mask, or (3) made a turn >45 degrees.
Connectome Reconstruction
A connectome map was made by combining the (sub)cortical parcellation map and the set of reconstructed fibers using commonly described procedures [see (18–21)]. For each of the Cammoun Desikan-Killiany parcellation maps (i.e., 14+68, 14+114, and 14+219 regions, respectively), the total collection of reconstructed fiber streamlines was used to assess the level of connectivity between each pair of (sub)cortical regions, represented as the connectivity matrix CIJ. (Sub)cortical regions were selected as the nodes of the reconstructed network, and for each combination of region i and region j where fiber streamlines touched both regions a connection (i.e., network edge) was included in cell CIJ(i,j) in the connectivity matrix. Five different types of strength of a connection were computed and included as edge strength: (1) the number of reconstructed streamlines (NOS) between region i and j, (2) the average FA of the voxels traversed by the reconstructed streamlines, (3) the average MD of the reconstructed streamlines, (4) the average length of the reconstructed streamlines and (5) streamline density computed as the number of reconstructed streamlines corrected for the average volume of region i and region j (18, 19).
Outliers
A total of 15,947 connectome maps were analyzed across the participating groups. Of the datasets that could be shared, 197 were detected as outliers (and were subsequently removed from the dataset). Outliers were detected automatically by testing per dataset and for each connectome map their average connection strength and their distance to the group average prevalence map. The average connection strength of a connectome map was calculated for each of the five connection weights as the mean of the strengths over all existing (nonzero) connections. To measure the presence of odd connections or absence of common connections in a connectome map, we constructed a group prevalence matrix for each dataset, counting per node pair how many times an edge was observed across the group of subjects in the dataset. For each connectome map the total prevalence of all observed connections and the total prevalence of all non-observed connections was computed. Outliers were identified as connectome maps that displayed on any of the 7 measures (5 weight and 2 prevalence measures) a score below Q1 – 2 × IQR or above Q3 + 2 × IQR, with Q1 and Q3 referring to the first and third quartile, respectively and IQR the interquartile range IQR = Q3 – Q1. This resulted in the detection of 189 outliers in total, which were excluded from the dataset. One complete dataset (set_634413, n = 584) showed across all included individual sets an average lower FA / higher MD as compared to the other datasets and this set was excluded from the age curves shown in Figure 1. Due to the high overall sample size, including or excluding this dataset did not change the shape of the final plot.
Cross-Site Comparison
Datasets across sites were compared by computing for each site a group average connectome map (group threshold 60%) and comparing the group average connectivity matrices across each of the sites. Cross-site overlap was computed as the percentage of overlap of the binary matrices and as the correlation between the non-zero elements of the FA group-average matrices.
Comparison to HCP
To test the validity of the 10K dataset, we compared the group average matrix of the 10K set to the group average matrix of data from the Human Connectome Project (HCP) (3). First, for the 10K dataset, a group average FA matrix was computed, by including those edges that were observed in at least 33% of the group (i.e., a group threshold of 33%, >2700 subjects showing a particular network edge). Average weight values of the included edges were taken as the non-zero mean of those edges across the group of subjects. Second, a similar group average FA matrix was derived from previously analyzed HCP data (22) (n = 487 datasets). In brief, HCP analysis included the following steps [see (22) for more detailed information on the HCP data analysis]. For each of the HCP DWI datasets a connectome was reconstructed based on the minimally pre-processed data of HCP. Given the high quality of the HCP data, analysis here included reconstruction of multiple diffusion directions, allowing for the reconstruction of more complex fiber configurations (e.g., crossing fibers) (22). Similarly as for the 10K data, across the total set of 487 datasets, an average FA group matrix was computed, including those network edges that were observed in at least 33% of the total population (i.e., >160 datasets) and taking the non-zero mean of FA values across the group of subjects. Comparison between the 10K set and the HCP dataset was computed by means of (1) counting the number of existing connections and non-existing connections in the 10K dataset as observed in the HCP dataset and (2) by correlating the FA weights of the set of edges as observed in both datasets.
Ethics Statement
This study was carried out in accordance with the recommendations of the ethical committee boards of each independent institute. The protocol was approved by the ethical committee boards of each independent institute. Informed consent of all participants was acquired by the independent research groups.
Author Contributions
All authors contributed to the acquisition and/or analysis of the MRI data. MvdH wrote the first draft of the manuscript. All authors revised the manuscript and contributed intellectual content.
Funding
The 10Kin1day workshop was generously sponsored by the Neuroscience and Cognition program Utrecht (NCU) of the Utrecht University (https://www.uu.nl/en/research/neuroscience-and-cognition-utrecht), the ENIGMA consortium (http://enigma.ini.usc.edu), and personal grants: MvdH: NWO-VIDI (452-16-015), MQ Fellowship; SB-C: the Wellcome Trust; Medical Research Council UK; NIHR CLAHRC for Cambridgeshire and Peterborough Foundation National Health Services Trust; Autism Research Trust; LB: New Investigator Award, Canadian Institutes of Health Research; Dara Cannon: Health Research Board (HRB), Ireland (grant code HRA-POR-2013-324); SC: Research Grant Council (Hong Kong)-GRF 14101714; Eveline Crone: ERC-2010-StG-263234; UD: DFG, grant FOR2107 DA1151/5-1, DA1151/5-2, SFB-TRR58, Project C09, IZKF, grant Dan3/012/17; SD: MRC-RFA-UFSP-01-2013 (Shared Roots MRC Flagship grant); TF: Marie Curie Programme, International Training Programme, r'Birth; DG: National Science Centre (UMO-2011/02/A/NZ5/00329); BG: National Science Centre (UMO-2011/02/A/NZ5/00329); JH: Western Sydney University Postgraduate Research Award; LH: Science Foundation Ireland, ERC; HH: Research Grant Council (Hong Kong)-GRF 14101714; LJ: Velux Stiftung, grant 369 & UZH University Research Priority Program Dynamics of Healthy Aging; AJ: DFG, grant FOR2107 JA 1890/7-1; KJ: National Science Centre (UMO-2013/09/N/HS6/02634); VK: The Russian Foundation for Basic Research (grant code 15-06-05758 A); TK: DFG, grant FOR2107 KI 588/14-1, DFG, grant FOR2107 KI 588/15-1; AK: DFG, grant FOR2107 KO 4291/4-1, DFG, grant FOR2107 KO 4291/3-1; IL: The Russian Foundation for Basic Research (grant code 15-06-05758 A); EL: Health and Medical Research Fund - 11121271; SiL: NHMRC-ARC Dementia Fellowship 1110414, NHMRC Dementia Research Team Grant 1095127, NHMRC Project Grant 1062319; CL-J: 537-2011, 2014-849; AM: Wellcome Trust Strategic Award (104036/Z/14/Z), MRC Grant MC_PC_17209; CM: Heisenberg-Grant, German Research Foundation, DFG MO 2363/3-2; PM: Foundation for Science and Technology, Portugal - PDE/BDE/113601/2015; KN: National Science Centre (UMO-2011/02/A/NZ5/00329); PN: National Science Centre (UMO-2013/09/N/HS6/02634); JiP: NWO-Veni 451-10-007; PaR: PER and US would like to thank the Schizophrenia Research Institute and the Chief-Investigators of the Australian Schizophrenia Research Bank V. Carr, U. Schall, R. Scott, A. Jablensky, B. Mowry, P. Michie, S. Catts, F. Henskens, and C. Pantelis; AS: National Science Centre (UMO-2011/02/A/NZ5/00329); SS: European Union's Horizon 2020 research and innovation programme under the Marie Skłodowska-Curie grant agreement No 707730; CS-M: Carlos III Health Institute (PI13/01958), Carlos III Health Institute (PI16/00889), Carlos III Health Institute (CPII16/00048); ES: National Science Centre (UMO-2011/02/A/NZ5/00329); AT: The Russian Foundation for Basic Research (grant code 15-06-05758 A); DT-G: PI14/00918, PI14/00639; Leonardo Tozzi: Marie Curie Programme, International Training Programme, r'Birth; SV: IMPRS Neurocom stipend; TvE: National Center for Research Resources at the National Institutes of Health (grant numbers: NIH 1 U24 RR021992 (Function Biomedical Informatics Research Network), NIH 1 U24 RR025736-01 (Biomedical Informatics Research Network Coordinating Center; http://www.birncommunity.org) and the NIH Big Data to Knowledge (BD2K) award (U54 EB020403 to Paul Thompson). NvH: NWO-VIDI (452-11-014); MW: National Science Centre (UMO-2011/02/A/NZ5/00329); Veronica O'Keane: Meath Foundation; AV and AW: CRC Obesity Mechanism (SFB 1052) Project A1 funded by DFG. The funding sources had no role in the study design, data collection, analysis, and interpretation of the data.
Conflict of Interest Statement
The authors declare that the research was conducted in the absence of any commercial or financial relationships that could be construed as a potential conflict of interest.
Acknowledgments
We further like to thank Joanna Goc, Veronica O'Keane, Devon Shook, and Leonardo Tozzi for their participation and/or support of the 10K project. HCP data was provided by the Human Connectome Project, WU-Minn Consortium (Principal Investigators: David Van Essen and Kamil Ugurbil; 1U54MH091657) funded by the 16 NIH Institutes and Centers that support the NIH Blueprint for Neuroscience Research; and by the McDonnell Center for Systems Neuroscience at Washington University.
References
1. Amunts K, Ebell C, Muller J, Telefont M, Knoll A, Lippert T. The Human Brain Project: Creating a European Research Infrastructure to Decode the Human Brain. Neuron. (2016) 92:574–81. doi: 10.1016/j.neuron.2016.10.046
2. Insel TR, Landis SC, Collins FS. Research priorities. NIH BRAIN Init Sci.(2013) 340:687–8. doi: 10.1126/science.1239276
3. Van Essen DC, Smith SM, Barch DM, Behrens TE, Yacoub E, Ugurbil K. The WU-Minn Human Connectome Project: an overview. Neuroimage. (2013) 80:62–79. doi: 10.1016/j.neuroimage.2013.05.041
4. Jiang T. Brainnetome: a new -ome to understand the brain and its disorders. Neuroimage. (2013) 80:263–72. doi: 10.1016/j.neuroimage.2013.04.002
5. Thompson PM, Andreassen OA, Arias-Vasquez A, Bearden CE, Boedhoe PS, Brouwer RM, et al. ENIGMA and the individual: Predicting factors that affect the brain in 35 countries worldwide. Neuroimage. (2017) 145:389–408. doi: 10.1016/j.neuroimage.2015.11.057
6. Mainen ZF, Hausser M, Pouget A. A better way to crack the brain. Nature. (2016) 539:159–61. doi: 10.1038/539159a
7. Mori S, Zhang JY. Principles of diffusion tensor imaging and its applications to basic neuroscience research. Neuron. (2006) 51:527–39. doi: 10.1016/j.neuron.2006.08.012
8. Fischl B, Dale AM. Measuring the thickness of the human cerebral cortex from magnetic resonance images. Proc Natl Acad Sci USA. (2000) 97:11050–5. doi: 10.1073/pnas.200033797
9. Andersson JL, Skare S, Ashburner J. How to correct susceptibility distortions in spin-echo echo-planar images: application to diffusion tensor imaging. Neuroimage. (2003) 20:870–88. doi: 10.1016/S1053-8119(03)00336-7
10. Desikan RS, Ségonne F, Fischl B, Quinn BT, Dickerson BC, Blacker D, et al. An automated labeling system for subdividing the human cerebral cortex on MRI scans into gyral based regions of interest. NeuroImage. (2006) 31:968–80. doi: 10.1016/j.neuroimage.2006.01.021
11. Fischl B, van der Kouwe A, Destrieux C, Halgren E, Ségonne F, Salat DH, et al. Automatically parcellating the human cerebral cortex. Cereb Cortex. (2004) 14:11–22. doi: 10.1093/cercor/bhg087
12. Cammoun L, Gigandet X, Meskaldji D, Thiran JP, Sporns O, Do KQ, et al. Mapping the human connectome at multiple scales with diffusion spectrum MRI. J Neurosci Methods. (2012) 203:386–97. doi: 10.1016/j.jneumeth.2011.09.031
13. Chang LC, Jones DK, Pierpaoli C. RESTORE: robust estimation of tensors by outlier rejection. Magn Reson Med. (2005) 53:1088–95. doi: 10.1002/mrm.20426
14. Maier-Hein KH, Neher PF, Houde J-C, Côté M-A, Garyfallidis E, Zhong J, et al. The challenge of mapping the human connectome based on diffusion tractography. Nat Commun. (2017) 8:1349. doi: 10.1038/s41467-017-01285-x
15. Zalesky A, Fornito A, Cocchi L, Gollo LL, van den Heuvel MP, Breakspear M. Connectome sensitivity or specificity: which is more important? Neuroimage. (2016) 15:407–420. doi: 10.1016/j.neuroimage.2016.06.035
16. Beaulieu C, Allen PS. Determinants of anisotropic water diffusion in nerves. Magn Reson Med. (1994) 31:394–400. doi: 10.1002/mrm.1910310408
17. Mori S, Barker PB. Diffusion magnetic resonance imaging: its principle and applications. Anat Rec. (1999) 257:102–9. doi: 10.1002/(SICI)1097-0185(19990615)257:3<102::AID-AR7>3.0.CO;2-6
18. Hagmann P, Cammoun L, Gigandet X, Meuli R, Honey CJ, Wedeen VJ, et al. Mapping the structural core of human cerebral cortex. PLoS Biol. (2008) 6:e159. doi: 10.1371/journal.pbio.0060159
19. van den Heuvel MP, Kahn RS, Goni J, Sporns O. High-cost, high-capacity backbone for global brain communication. Proc Natl Acad Sci USA. (2012) 109:11372–7. doi: 10.1073/pnas.1203593109
20. van den Heuvel MP, Mandl RC, Stam CJ, Kahn RS, Hulshoff Pol HE. Aberrant frontal and temporal complex network structure in schizophrenia: a graph theoretical analysis. J Neurosci. (2010) 30:15915–26. doi: 10.1523/JNEUROSCI.2874-10.2010
21. van den Heuvel MP, Sporns O. Rich-club organization of the human connectome. J Neurosci. (2011) 31:15775–86. doi: 10.1523/JNEUROSCI.3539-11.2011
Keywords: MRI, connectome analysis, diffusion weighted MRI, brain, network
Citation: van den Heuvel MP, Scholtens LH, van der Burgh HK, Agosta F, Alloza C, Arango C, Auyeung B, Baron-Cohen S, Basaia S, Benders MJNL, Beyer F, Booij L, Braun KPJ, Filho GB, Cahn W, Cannon DM, Chaim-Avancini TM, Chan SSM, Chen EYH, Crespo-Facorro B, Crone EA, Dannlowski U, de Zwarte SMC, Dietsche B, Donohoe G, Du Plessis S, Durston S, Díaz-Caneja CM, Díaz-Zuluaga AM, Emsley R, Filippi M, Frodl T, Gorges M, Graff B, Grotegerd D, Gąsecki D, Hall JM, Holleran L, Holt R, Hopman HJ, Jansen A, Janssen J, Jodzio K, Jäncke L, Kaleda VG, Kassubek J, Kharabian Masouleh S, Kircher T, Koevoets MGJC, Kostic VS, Krug A, Lawrie SM, Lebedeva IS, Lee EHM, Lett TA, Lewis SJG, Liem F, Lombardo MV, Lopez-Jaramillo C, Margulies DS, Markett S, Marques P, Martínez-Zalacaín I, McDonald C, McIntosh AM, McPhilemy G, Meinert SL, Menchón JM, Montag C, Moreira PS, Morgado P, Mothersill DO, Mérillat S, Müller H-P, Nabulsi L, Najt P, Narkiewicz K, Naumczyk P, Oranje B, Ortiz-Garcia de la Foz V, Peper JS, Pineda JA, Rasser PE, Redlich R, Repple J, Reuter M, Rosa PGP, Ruigrok ANV, Sabisz A, Schall U, Seedat S, Serpa MH, Skouras S, Soriano-Mas C, Sousa N, Szurowska E, Tomyshev AS, Tordesillas-Gutierrez D, Valk SL, van den Berg LH, van Erp TGM, van Haren NEM, van Leeuwen JMC, Villringer A, Vinkers CH, Vollmar C, Waller L, Walter H, Whalley HC, Witkowska M, Witte AV, Zanetti MV, Zhang R and de Lange SC (2019) 10Kin1day: A Bottom-Up Neuroimaging Initiative. Front. Neurol. 10:425. doi: 10.3389/fneur.2019.00425
Received: 13 December 2018; Accepted: 08 April 2019;
Published: 09 May 2019.
Edited by:
Christian Gaser, Friedrich Schiller University Jena, GermanyReviewed by:
Olga Tymofiyeva, University of California, San Francisco, United StatesHanbo Chen, Tencent Holdings Limited, China
Copyright © 2019 van den Heuvel, Scholtens, van der Burgh, Agosta, Alloza, Arango, Auyeung, Baron-Cohen, Basaia, Benders, Beyer, Booij, Braun, Filho, Cahn, Cannon, Chaim-Avancini, Chan, Chen, Crespo-Facorro, Crone, Dannlowski, de Zwarte, Dietsche, Donohoe, Du Plessis, Durston, Díaz-Caneja, Díaz-Zuluaga, Emsley, Filippi, Frodl, Gorges, Graff, Grotegerd, Gąsecki, Hall, Holleran, Holt, Hopman, Jansen, Janssen, Jodzio, Jäncke, Kaleda, Kassubek, Kharabian Masouleh, Kircher, Koevoets, Kostic, Krug, Lawrie, Lebedeva, Lee, Lett, Lewis, Liem, Lombardo, Lopez-Jaramillo, Margulies, Markett, Marques, Martínez-Zalacaín, McDonald, McIntosh, McPhilemy, Meinert, Menchón, Montag, Moreira, Morgado, Mothersill, Mérillat, Müller, Nabulsi, Najt, Narkiewicz, Naumczyk, Oranje, Ortiz-Garcia de la Foz, Peper, Pineda, Rasser, Redlich, Repple, Reuter, Rosa, Ruigrok, Sabisz, Schall, Seedat, Serpa, Skouras, Soriano-Mas, Sousa, Szurowska, Tomyshev, Tordesillas-Gutierrez, Valk, van den Berg, van Erp, van Haren, van Leeuwen, Villringer, Vinkers, Vollmar, Waller, Walter, Whalley, Witkowska, Witte, Zanetti, Zhang and de Lange. This is an open-access article distributed under the terms of the Creative Commons Attribution License (CC BY). The use, distribution or reproduction in other forums is permitted, provided the original author(s) and the copyright owner(s) are credited and that the original publication in this journal is cited, in accordance with accepted academic practice. No use, distribution or reproduction is permitted which does not comply with these terms.
*Correspondence: Martijn P. van den Heuvel, martijn.vanden.heuvel@vu.nl
†Bonnie Auyeung, Rosemary Holt and Michael V. Lombardo wrote the paper on behalf of the Cambridge Child Development Project