A Comprehensive Review of Magnetoencephalography (MEG) Studies for Brain Functionality in Healthy Aging and Alzheimer's Disease (AD)
 Pravat K. Mandal
 Anwesha Banerjee
 Manjari Tripathi
 Ankita Sharma
- 1Neuroimaging and Neurospectroscopy Lab, National Brain Research Centre, Gurgaon, India
- 2Department of Neurodegeneration, Florey Institute of Neuroscience and Mental Health, Melbourne, VIC, Australia
- 3Department of Neurology, All Indian Institute of Medical Sciences, New Delhi, India
Neural oscillations were established with their association with neurophysiological activities and the altered rhythmic patterns are believed to be linked directly to the progression of cognitive decline. Magnetoencephalography (MEG) is a non-invasive technique to record such neuronal activity due to excellent temporal and fair amount of spatial resolution. Single channel, connectivity as well as brain network analysis using MEG data in resting state and task-based experiments were analyzed from existing literature. Single channel analysis studies reported a less complex, more regular and predictable oscillations in Alzheimer's disease (AD) primarily in the left parietal, temporal and occipital regions. Investigations on both functional connectivity (FC) and effective (EC) connectivity analysis demonstrated a loss of connectivity in AD compared to healthy control (HC) subjects found in higher frequency bands. It has been reported from multiplex network of MEG study in AD in the affected regions of hippocampus, posterior default mode network (DMN) and occipital areas, however, conclusions cannot be drawn due to limited availability of clinical literature. Potential utilization of high spatial resolution in MEG likely to provide information related to in-depth brain functioning and underlying factors responsible for changes in neuronal waves in AD. This review is a comprehensive report to investigate diagnostic biomarkers for AD may be identified by from MEG data. It is also important to note that MEG data can also be utilized for the same pursuit in combination with other imaging modalities.
Introduction
Magnetoencephalography is a non-invasive technique that measures oscillatory magnetic fields produced in the brain due to neuronal activity with excellent temporal and reasonable amount of spatial resolution (Cohen, 1968). At the cellular level, neurons have electrochemical properties that lead to the flow of electrically charged ions and subsequently generation of electromagnetic fields. The magnetic field generated by an individual neuron is very weak, but multiple neurons combined in a specific area produce a field that is measurable outside the head. This neuromagnetic field is in the range of 10–15 T (femtotesla, fT) for cortical activities. Magnetic field follows Ampere's “right-hand rule,” with the field directed outward on one side and inward on the other side of a tangentially oriented source current, forming a characteristic dipolar pattern in magnetic field sensors near the scalp. Radially oriented (with respect to the skull surface) source currents generate negligible magnetic field outside the head. Therefore, MEG is mainly sensitive to tangentially oriented sources in sulcal walls. Neuromagnetic fields are captured using highly sensitive superconducting sensors, called SQUIDs (Superconducting Quantum Interference Device). Activity from deeper cortical and subcortical areas is difficult to detect as they exist at longer distance from the sensors. SQUID systems are typically composed of two types sensors, called as magnetometer and gradiometer. Magnetometers measure magnetic field directly, and gradiometers as pairs of magnetometers positioned at a small distance form one another, calculate the difference in the magnetic field between their two locations, are used in MEG data acquisition (Cohen, 1972; Hämäläinen et al., 1993). These magnetic fields are produced simultaneously with electrical activity, MEG captures same millisecond resolution as EEG (Electroencephalography), allowing to examine neural activity at its natural temporal resolution. Thus, MEG provides a more direct measure of neuronal activity than functional magnetic resonance imaging (fMRI), which records blood-oxygen-level dependent (BOLD) responses.
Various MEG systems are available commercially such as (a) Elekta/Neuromag: 306 channel, (b) MAGNES: 148 channel, (c) CTF/VSM System: 275 channel (MISL), (d) Tristan Technologies, BabySQUID (for pre- and full-term infants), (e) MEGSCAN: 320 channel, (f) Mecurer, portable MEG system, (g) Yokogawa MEG: 160 channel (originally designed by Kanazawa Institute of Technology). Among all these systems, Eleckta Neuromag (Cichy et al., 2016b; Engels et al., 2016a; López et al., 2017a; López-Sanz et al., 2017), MAGNES Fernández et al., 2002, 2013; Maestú et al., 2003; Bajo et al., 2012; Poza et al., 2014; Gómez et al., 2017; Juan-Cruz et al., 2017, and CTF systems (de Haan et al., 2012c; Ranasinghe et al., 2014; Brookes et al., 2016a; Tewarie et al., 2016; Josef Golubic et al., 2017; Koelewijn et al., 2017) are mostly used. However, for clinical setting Elekta Neuromag and CTF/VSM systems are the popular ones.
Oscillatory brain signals are commonly categorized into five frequency bands: Delta (0.2–3 Hz), Theta (4–7 Hz), Alpha (8–13 Hz), Beta (14–31 Hz), and Gamma (32–100 Hz). Each band is associated with different physiological information involving brain activities. Delta (δ) waves are accompanied with deep levels of relaxation and restorative sleep. It has been found that δ waves are associated with unconscious tasks of the body. Irregular δ waves have been connected to awareness as well as learning difficulties (Gloor et al., 1977). Theta (θ) waves are mostly linked with sleep and it may occur during deep meditation also and it is the associated to memory, intuition, and learning (Klimesch, 1999). Alpha (α) waves are associated with resting state oscillations and awaken brain and it aids overall mental coordination, calmness, alertness, intelligence and cognitive abilities (Klimesch et al., 1998). Beta (β) waves are dominant during attentive cognitive task in normal conscious state. “Fast” activities of β waves are observed in concentration, decision making, anxiety and excitement (Teplan, 2002). Gamma (γ) waves are interrelated to simultaneous processing of information flow from various brain regions. γ frequency is above the neuronal firing range. Presence of γ is associated to cognizance (Tallon-Baudry and Bertrand, 1999). Among these existing band waves certain bands are associated with cognitive decline. MEG plays an important role for detecting early changes in these rhythms and provides prodromal features of AD. Early symptoms of AD includes progressive loss of cognitive functions. One of the major histopathological hallmarks of this disease is the formation of amyloid-beta plaques. Neurological changes in neurogenesis are evident already before plaque deposition and might contribute to well-known early dysfunctions in prodromal AD (Borroni et al., 2002; Ito et al., 2015; Unger et al., 2016).
Millions of people are affected worldwide by AD and this number is increasing every day (Wortmann, 2012). AD affects not only the individual but also it has serious impact the entire family of the patient as well as on society and economy. The actual cause of AD is not known yet, however, both clinical and laboratory research have revealed oxidative stress is related to AD. It is believed from available clinical data that hippocampal as well as frontal cortex regions, the glutathione level depletion is linked to the conversion from a healthy aged subject to MCI (Mandal et al., 2015). There are other associated features with hippocampal and frontal cortex texture, which also change in AD (Drachman, 2006). At present, MCI or AD are detected symptomatically by the clinicians and various neuropsychological tests like Clinical Dementia Rating (CDR) (Morris, 1993), Mini–Mental State Examination (MMSE) (Folstein et al., 1975). Seven minute screen (7MS) that consisted of four individual tests (orientation, memory, clock drawing, verbal fluency) (Solomon and Pendlebury, 1998), functional assessment staging (FAST) (Auer and Reisberg, 1997) and Montreal Cognitive Assessment (MoCA) test (Nasreddine et al., 2005) are used for screening of AD.
This review focuses on the MEG analysis techniques and modulation of neuronal rhythms in AD brain. Motivation of the review is to provide an outline for the application of MEG for connectivity analysis and its application combining other neuroimaging modalities that can help for the identification of early diagnostic biomarker for AD.
The manuscript is divided into seven sections. After introduction, in section The Schematic for MEG Signal Acquisition and Analysis, the comprehensive flow diagram of MEG data acquisition and analysis is presented. Section Resting State and Event-Related Response Studies describes about resting state and evoked studies followed by description of source reconstruction (section Source Reconstruction). The cutting-edge research of MEG analysis for AD involving single channel, connectivity and network analysis is scrutinized from existing literature in section MEG Data Analysis. Section Machine Learning Approach for MEG Based Analysis gives a brief idea about the application of machine learning algorithms on MEG data in AD population. Various methods of statistical analysis performed with MEG data is discussed in section Statistical Analysis of MEG Data. Section Discussion outlines the overall implementation and experimental outcomes of MEG studies. Section Conclusions summarized all the generally applicable procedures and points onto the scope for future research.
The Schematic for MEG Signal Acquisition and Analysis
The complex analysis procedure for MEG signals consists of various stages including co-registration with MRI images, forward and inverse problem as well as applicable steps for data analysis (Figure 1). Subjects participating in MEG study; also undergo MRI for 3D anatomical images.
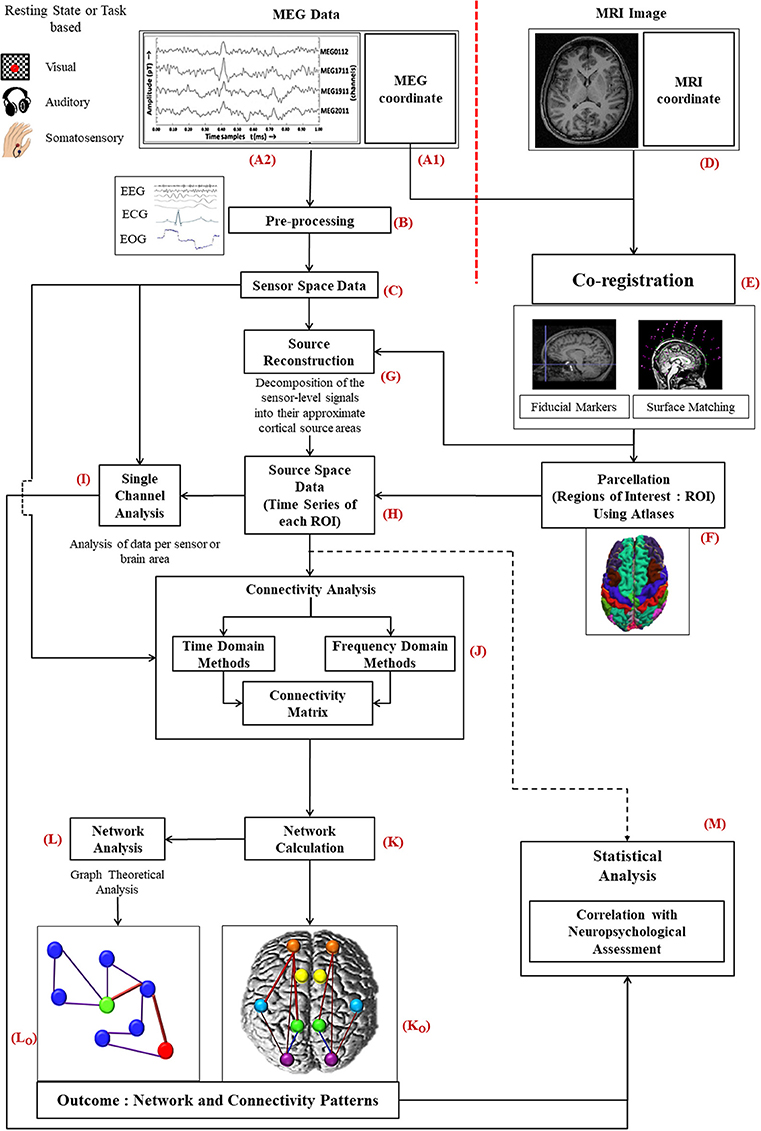
Figure 1. Diagrammatic representation of the work flow for MEG data analysis: MEG data acquired from subjects (A2) is preprocessed (B) to a filter noise from sensor space data (C). Information of MEG co-ordinate (A1) is required with the MRI image (D) of the same subject for co-registration (E). Source reconstruction of MEG data is performed thereafter (G). Then the source space data (H), time series generated for each ROI, is further processed for single channel (I), and connectivity analysis (J). To select ROIs parcellation is conducted using atlases (F). After evaluating the network (K) using the connectivity information, graph theoretical network analysis is performed (L). Statistical analysis is accomplished along with the information of neuropsychological assessment (M).
The information related to MEG coordinate system (Figure 1A1) is registered by following two steps: (i) fiducial marking, where three anatomical landmarks, the nasion, the left preauricular point (LPA) and the right preauricular point (RPA), are indicated on the patient's head, and (ii) surface modeling, where head digitization is performed with a 3D tracker prior to the MEG examination (Hämäläinen et al., 1993). The fiducial points need to be determined accurately to minimize co-registration errors leading to point to point variation within the brain. Incorporation of new techniques can improve the precision and robustness of the co-registration process (Towle et al., 1993).
MEG co-ordinate system is computed before MEG signal acquisition with above explained digitization process. On the other hand, MRI co-ordinate system (Figure 1D) is generated after the MRI image acquisition. Raw MEG data (Figure 1A2) is acquired from the subjects in a magnetically shielded room either in resting condition (no task) or during certain tasks as per the study requirement. Processing scheme of MEG data are the same for resting state as well as with evoked potential conditions, however, only the execution scheme will vary. In resting state category, the subject needs to be fully awake as drowsiness may introduce noise. For event-related studies, the subject is asked to perform certain tasks in reaction to a given stimulus (e.g., visual, auditory, or somatosensory). Simultaneously with the recording of MEG signals, brain's electrical activity, heart's electrical activity and eye movements of the subject are captured by means of electroencephalogram (EEG), electrocardiogram (ECG), and electrooculogram (EOG), respectively.
The acquired MEG signal is visually observed and then processed for head movement correction and compensation is accomplished with built-in software for example Max filter in ELEKTA/Neuromag system, and commercially available other software like Brain Electrical source analysis (BESA), ASA, Curry, EMSE. The environmental interference and constant or periodic artifact correlation is performed by applying Single Space Separation (“SSS”) or temporal Single Source Separation (“t-SSS”). Single Space Separation is a new method for compensation of external interference and sensor artifacts by decomposing the MEG signal into inner source signal and outer noise. Independent Component Analysis (ICA) or template can also be used for rest of the biological artifacts like eye blinks. Pre-processing (Figure 1B) includes the following steps: Identifying nonfunctional (defective) channels followed by correction in head movement followed by Software interference suppression [Signal- space projection (SSP), Signal-space separation (SSS), T-Signal space separation (t-SSS)] and later artifact identification and rejection of environmental interferences and subject interference (cardiac activity, muscular activity; Velmurugan et al., 2014).
Moreover, at this stage of preprocessing of MEG data, filtering may also be applied to segment the MEG data into different band waves (δ, θ, α, β, and γ). Subsequently, the exclusive sensor space time series MEG data (Figure 1C) distributed over all the brain regions, which is processed further for single channel analysis (Figure 1I) and for connectivity estimation (Figure 1J) is generated.
Co-registration of MEG data with anatomical 3D MRI image (Figure 1E) enables source localization of the MEG data (Figure 1G). This source reconstructed MEG data, which is called source space data (Figure 1H), is used for connectivity estimation among the different selected regions of interests (ROI) as well as single channel analysis. Source reconstruction is performed for all the MEG sensors/broadband activity. Afterwards, source space time series is separated into different frequency bands.
Parcellation is implemented to divide the brain in different ROIs (Figure 1F). ROI selection is performed by parcellating the cortex using either source-sensor geometry approach or with native MRIs or utilizing various available atlases (Dickie et al., 2017). In MEG based studies automatic anatomical labeling (AAL) (Brookes et al., 2016; Engels et al., 2016a,b, 2017b; Hillebrand et al., 2016; Tewarie et al., 2016; Koelewijn et al., 2017; López et al., 2017a; Yu et al., 2017), Harvard Oxford (López et al., 2014a; López-Sanz et al., 2017) and Destrieux and Desikan-Killiany atlases have been implemented. Tools such as MarsBar in SPM, Featquery function in FSL, MRIcroN software, and ROInets are developed for ROI based analysis. The analysis for voxel time series within each ROI is achieved in various ways. In some studies, the voxel with maximum power within ROI represents the time series for corresponding ROI (López et al., 2017a). Researches also generate time series by calculating the weighted distance from center of mass of the respective region (Brookes et al., 2016). For specific representation of voxel, the centroid voxel was reported in some studies (Engels et al., 2017b; Yu et al., 2017). Maximum pseudoZ voxel is also used as alternative method to represent time series for specific ROI (Engels et al., 2016a).
Single channel data analysis (Figure 1I) includes various methods (e.g., spectral analysis, signal complexity etc.). For single channel analysis, sensor space data denotes data per sensor but in source space, it represents the analysis of data from a particular brain region. Keeping out anatomical links, brain connectivity can be divided into two classes: functional connectivity (FC) and effective connectivity (EC). For connectivity evaluation, MEG data is analyzed using time domain (nonlinear forecasting, cross mutual information etc.) as well as frequency domain parameters (coherence, phase locking value etc.) (Figure 1J). This analysis provides a correlation or adjacency matrix and the off-diagonal elements of that matrix represent different weights of connectivity between the corresponding ROIs. For source space MEG data, FC is the measure of co-modulation of separate sources (selected by ROIs) but for sensor space connectivity interpretation is difficult as it is not linked with a specific brain location. The data related to connectivity is utilized to build a linked brain network (Figure 1K). The different brain regions associated functionally or causally are visualized as connectivity patterns (Figure 1Ko). Various graph theoretical algorithms (Figure 1L) like clustering coefficient, path length etc. are applied for a global analysis of the brain network (Figure 1Lo).
Moreover, statistical analysis is performed for each method of analysis (single channel, FC, or network) along with the results from neuropsychological battery to evaluate the accuracy, sensitivity and specificity of the final outcome of the study (Figure 1M). The steps and related terminologies are explained later in this manuscript.
Various open source software and toolboxes are available for MEG data analysis. Brainstorm (Tadel et al., 2011), EEGlab (Delorme and Makeig, 2004), FieldTrip (Oostenveld et al., 2011), MNE (Gramfort et al., 2014), NutMEG (Dalal et al., 2004), OpenMEEG (Gramfort et al., 2010), SPM (Friston et al., 1994), EMEGS (electromagnetic encephalography software) (Peyk et al., 2011) etc. are commonly used. Commercial software packages are also available DANA and CURRY (NeuroScan, 2017). Though these tools keep updating on a regular basis but there remain some complications associated with MEG data processing and analysis.
Resting State and Event-Related Response Studies
Resting state is defined as the stage when a subject is awake but not performing any task. MEG has been implemented for resting state network as well as evoked study in AD. Extra care must be taken to make sure that the AD patients are awake and alert as drowsiness affects activities of the resting state brain (Verdoorn et al., 2011).
It has been observed that the parts of brain responsible in the activation differs from resting state to task based conditions (Raichle et al., 2001). Brain regions that correlate in resting state are found to be involved in co-activation during tasks however their roles are likely to get shifted in evoked study (Daianu et al., 2013).
In evoked studies, association of any specific brain region with the task was correlated for probable AD and HC group (Berendse et al., 2000). The instant reduction of the signal amplitude after opening the eyes was found to be diminished in AD, but functional connectivity (FC) remained unaltered for eye opening or closing (Berendse et al., 2000). Multiple regions of brain activity are localized and also their time courses are characterized from somatosensory and visual activity task using multistart analysis of MEG data (Aine et al., 2000).
In memory based task, a relation between hippocampal atrophy and the degree of neurophysiological activity in the left temporal lobe has been demonstrated (Maestú et al., 2003). A reduced MEG response during the retention period of a working memory task was observed in AD and the findings were in line with MRS data (Maestu et al., 2005). Task based evoked potential analysis can also differentiate between AD and HC subjects but the clarification of changes may be difficult depending upon task performance and level of concentration of the subjects during experiment (Dickerson, 2007).
Source Reconstruction
MEG data is useful to get insight for brain functionality and the role of large-scale network is studied by approximation of neuronal interaction at source level. To accomplish this objective, reconstruction is performed for source time series. For source reconstruction, the forward and inverse modeling of MEG sensor data needs to be implemented with the help of MRI data. The forward problem is specified as the calculation of the magnetic field vector which is acquired outside the head. Inverse problem is involved in calculating the current density of the source that produce magnetic field vector. For source reconstruction of MEG data, the most commonly applied techniques found in the literature are: equivalent current dipole (ECD) (Kiebel et al., 2008), beamforming (Sekihara et al., 2001), and minimum norm estimation (MNE) (Hämäläinen and Ilmoniemi, 1994). Minimum current estimation (MCE) is also popularly applied for source estimation and localization of MEG data (Uutela et al., 1999).
Equivalent current dipole (ECD) has been used to analyze the magnetic counterparts of P50 and mismatch negativity for a MEG based study with passive oddball paradigm of AD patients. In comparison to HC subjects, larger cortical activation of standard-evoked M50 was observed in AD (Cheng et al., 2012). ECD has also been implemented for MEG based dipole density estimation of δ and θ band in AD (Fernández et al., 2003).
In studies utilizing beamforming procedure, it has been found that a frontal shift of α event-related synchronization (ERS) elicited by an eyes-open/eyes-closed paradigm indicating early changes in AD (Hincapié et al., 2017). This may represent a physiological state marker of the disease (Ishii et al., 2010). Application of beamformer based source reconstruction has been implemented upon resting state MEG signals from single-domain and multi-domain amnestic MCI (md-aMCI) subjects (Pineda-Pardo et al., 2014). The fiber densities between the regions, using diffusion-weighted MRI, defined the anatomical connectivity. Graphical Lasso (GL) has been used to estimate network architecture. Results of this study indicated that introduction of an anatomical prior knowledge might improve the expressivity of the model and, in most cases, leads to a better classification between groups (Pineda-Pardo et al., 2014).
Minimum norm estimation (MNE) has been used to detect synchronous and distributed neural activity of different cortical areas (Jensen and Vanni, 2002). MNE was applied for cortical origin estimation of δ band activity. Significant difference in δ band activity was reported for AD and HC groups from MEG data analysis (Fernández et al., 2013). MNE has also been applied for source reconstruction of MEG data in dementia and healthy individuals with subjective memory loss (Maestú et al., 2008).
Minimum current estimation (MCE) has been utilized to identify cortical sources of spontaneous brain oscillation from MEG data for MCI and AD. In comparison to HC group, oscillatory abnormalities in the alpha source distribution were clearly visible in AD whereas for MCI significant changes were not observed (Osipova et al., 2006).
MEG Data Analysis
The MEG signal analysis is a complex procedure and is characterized in three categories: single channel analysis, connectivity analysis, network analysis (Engels et al., 2017a).
Single Channel Data Analysis
Single channel analysis is based on per channel local analysis and studies have been performed for the assessment of AD and control subjects from individual time series MEG data.
Single channel analysis studies have been executed to observe a distinction between healthy individuals and AD by time-frequency analysis of MEG data. Parameters reported in literature related to single channel analysis is classified into four groups: (i) spectral analysis, (ii) signal complexity, (iii) signal regularity, and (iv) signal predictability.
In comparison to healthy individuals, increase in absolute as well as relative power was perceived in slow frequency bands of δ and θ in AD, but decrease in these power values was observed in high frequency bands of α, β, and γ for AD. These results are observed in the parietal, temporo-parietal, posterior parietal areas as well as precuneus cortices and hippocampus (Fernández et al., 2002, 2003, 2006b, 2013).
Frequency analysis of MEG data has also been performed in various studies (Escudero et al., 2008, 2009). Peak frequency, mean frequency and median frequency were reported lower for AD compared to HC subjects (van Walsum et al., 2003; Poza et al., 2007b; Montez et al., 2009). It has been found that in AD, lower α band sources are predominant in the temporal regions, whereas in the controls, robust α sources were found near the parieto-occipital sulcus (Osipova et al., 2005). The activation within the parieto-occipital region was significantly weaker, and activation in the right temporal area was significantly enhanced in the AD (Osipova et al., 2005). Studies reported less complexity in AD by evaluating Lempel-Ziv complexity, fractal dimension and also correlation dimension (Gómez et al., 2009a,b; Hornero et al., 2009).
Nonlinear analysis has also been reported in MEG based studies (Abatzoglou et al., 2007; Escudero et al., 2009). Spectral entropy and ratio have also been examined from MEG data (Poza et al., 2007a, 2008b; Bruña et al., 2012). Approximate entropy, sample entropy as well as multiscale entropy values have been found to be lower in AD than HC subjects from MEG data analysis (Hornero et al., 2009). These results are consistent with the findings of MRI studies where reduction in entropy of hippocampus have been reported (Drachman, 2006).
Stationarity and equilibrium of signals from AD were found to be disrupted (Gómez et al., 2009b; Bruña et al., 2012) similar to complexity studies. Abnormal and predictable dynamics was reported in AD by observing low decrease rate of auto mutual information from MEG data (Gomez et al., 2006b; Gómez et al., 2007b; Hornero et al., 2009). Indication of more regular oscillations in AD than controls was found by high spectral crest factor and spectral turbulence and wavelet turbulence (Poza et al., 2008a, 2014). Comparatively high power in the lower frequency bands and low power in the higher frequency bands confirmed this information and relates to the studies involving EEG (Micanovic and Pal, 2014).
The changes observed in single channel analysis of MEG data using different parameters are represented in Figure 2. The increasing and decreasing measures of all the parameters, e.g., absolute power, approximate entropy etc., (listed in the vertical axis) for all the frequency bands (δ, θ, α, β, γ) have been shown in chronological order. Most of the studies have reported results common for all the frequencies in AD whereas some investigations informed significant difference in specific band waves. For example, relative power (RP) was reported increased explicitly in δ band but decreased in β band. Majority of the parameters implemented for single channel analysis of MEG data were reported reduced in AD compared to HC subjects though in few cases, metrics were found increased. The synthesis of single channel analysis of MEG studies, it is inferred that a slowing pattern of oscillations is visible in AD and MCI patients in frontal, parietal, temporal, and occipital brain regions.
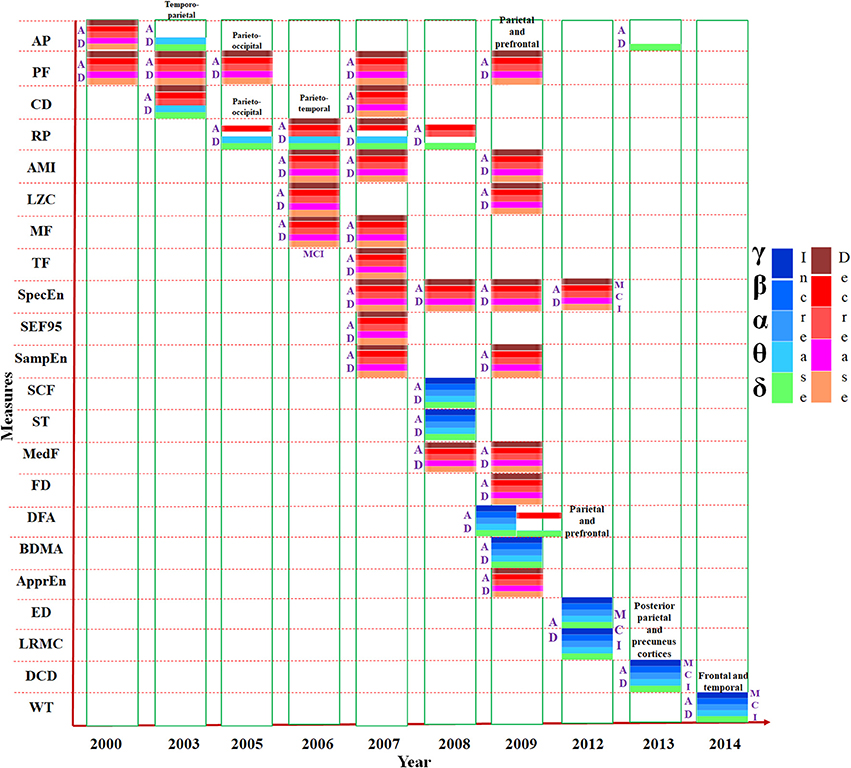
Figure 2. Presentation of various measures (e.g., mean frequency, relative power etc.) used in MEG single channel analysis, mentioned in the vertical axis, in chronological order. The horizontal axis represents the year of study. Changes to the parameters in the frequency bands (δ, θ α, β, and γ) are indicated using different color codes. AP, Absolute Power; PF, Peak Frequency; CD, Correlation Dimension; RP, Relative Power; AMI, Auto Mutual Information. LZC, Lempel-Ziv Complexity; MF, Mean Frequency; TF, Transition Frequency; SpecEn, Spectral Entropy; SEF95, 95% Spectral Edge Frequency; SampEn, Sample Entropy; SCF, Spectral Crest Factor; ST, Spectral Turbulence; MedF, Median Frequency; FD, Fractal Dimension; DFA, Detrended Fluctuation Analysis; BDMA, Backwards Detrended Moving Average; ApprEn, Approximate Entropy; ED, Euclidean Distance; LRMC, Lopez Ruis-Mancini-Calbet; DCD, Delta Current Density; WT, Wavelet Turbulence.
Connectivity Analysis
The functionally connected areas of brain are explained with the help of connectivity analysis. This review discusses two types of connectivity analysis, FC and EC, for MEG data. FC is temporal correlation between remote neurophysiological events, and EC is defined as the influence one neural system exerts over another (Friston, 1994, 2011).
Functional Connectivity Assessment
Functional Connectivity (FC) is estimated in time as well as frequency domain using linear (e.g., correlation) and nonlinear (e.g., mutual information) methods (Sakkalis, 2011). MEG time series data of different brain areas that are functionally connected, are assumed to show a statistical relationship (Bastos and Schoffelen, 2016). MEG data analysis demonstrates the relationship between neural oscillations and functional connectivity of brain (Brookes et al., 2011). Path of information flow within the brain is understandable with the help of direction provided by FC (Blinowska, 2011).
Coherence is one of the widely used for FC estimation. Coherence is the degree of similarity of frequency components of two time series (of simultaneous values or leading and lagging relationships). Mathematically, coherence is the frequency domain equivalent to the time domain cross-correlation function. Its squared value quantifies, as a function of frequency, the amount of variance in one of the signals that can be explained by the other signal, or vice-versa, in analogy to the squared correlation coefficient in the time domain. The coherence coefficient is a normalized quantity bounded between 0 and 1.
where, coherence of two signals x and y at frequency ω represented as cohxy (ω) is computed using Equation (1), where Ax, Ay are amplitude and φx, φy are phase of signals x and y, respectively and n is the total number of data points. High value of coherence indicates strong functional connectivity.
Increase in coherence is reported in the δ band (Alonso et al., 2011; Escudero et al., 2011). On the other hand, loss of connectivity indicated by decreased coherence is found to be restricted in high frequency bands (Franciotti et al., 2006; Alonso et al., 2011). However, some studies reported no significance difference between AD and HC subjects by the evaluation coherence (Stam et al., 2002).
From coherence analysis, decreased neural connectivity of multiple brain regions including the right posterior perisylvian region and left middle frontal cortex correlated with a higher degree of disease severity has been reported (Ranasinghe et al., 2014). Insufficiency in executive control and episodic memory is correlated with reduced FC of the left frontal cortex, whereas visuospatial impairments is correlated with reduced FC of the left inferior parietal cortex (Ranasinghe et al., 2014). These results suggested that reductions in region-specific α-band resting state FC are strongly correlated with specific cognitive deficits in AD spectrum (Ranasinghe et al., 2014).
From the parameter named synchronization likelihood (SL), the strength of synchronization of two time series is evaluated based on state space embedding. Nonlinear forecasting (NF) and cross mutual information functions (CMIF) are measures for the predictability of one time series when a second series is known, have been implemented for FC analysis. Predictability based on similarity (based on the amplitude of two time series) has also been evaluated from MEG data using cross approximate entropy (Cr-appEn).
FC from MEG data was found to be lower in α, β, and γ bands but higher in θ band for AD (Stam et al., 2002, 2006) using SL. Increase in inter-hemispheric connections, decrease in anteroposterior FC was detected in MCI (Bajo et al., 2010). The inter-hemispheric increased synchronization values reflect a compensatory mechanism for the lack of efficiency of the memory networks (Bajo et al., 2010). Hence, these connectivity profiles support the idea of calling MCI as a “disconnection syndrome” partially (Bajo et al., 2010).
MEG study with a memory task has been performed on MCI group to characterize patients who would eventually go on to develop the disease (Bajo et al., 2012). It has been reported that progressive patients showed a differential profile of FC values compared with those patients who remained stable over time (Bajo et al., 2012). Time series was found more predictable for AD by the nonlinear forecasting approach (Gómez et al., 2008). While cross mutual information values were reported increased in AD (Alonso et al., 2011), cross-approximate entropy was observed decreased indicating synchronization better than HC subjects (Gómez et al., 2012). For the analysis of FC, variance information in source space projected Hilbert envelope time series has been extracted that has given important spatial information about functional relevance (Hall et al., 2013).
Another measure of connectivity is phase locking value (PLV). It is calculated using the instantaneous phase difference between a pair of signals. PLV for each data segment is calculated as the norm of the average vector for the pair of signals k and l from Equation (2)
where, φk(t) is the instantaneous phase of signal k at instant t, and T is the number of temporal points per segment.
Another metric used for FC estimation from MEG data is phase lag index (PLI), which evaluates the distribution of phase differences across observations. In terms of PLI, FC was observed lower in AD in α and β band (Stam et al., 2009). FC alterations based on PLV were found in both subjective cognitive decline (SCD) and MCI groups compared to HC subjects (López-Sanz et al., 2016, 2017). A hyper synchronized anterior and posterior network, characterized by a decrease in FC, was spotted in AD (López-Sanz et al., 2016, 2017). This decrease was more pronounced in the MCI group. These results indicate that SCD can be considered as a preclinical stage of AD (López-Sanz et al., 2016, 2017). FC was assessed using the amplitude envelope correlation was significantly lower in all-to-β cross-frequency coupling (CFC) in AD in the left hippocampus and several regions of the DMN (Engels et al., 2016b). Virtual electrodes have been used to correlate functional interactions with the slowing activity of hippocampi and cortical areas (Engels et al., 2016a). A virtual electrode is an estimate of the time-series of neuronal activity at a particular location in the brain. Estimating neuronal activity at the source level requires solving the inverse problem, i.e., the estimation of activity on the basis of the extracranial sensor recordings (Hillebrand and Barnes, 2005). In this study beamforming technique is used to solve this inverse problem. A decreased connectivity in AD, specifically in parieto-temporal areas in the α and β band in whole brain during resting state (Koelewijn et al., 2017).
The interfering factors to be considered in MEG data analysis are field spread (FS) and volume conduction (VC). Because of the topographical representation of magnetic field beyond the source, signal can be picked up at some distance and it is termed as field spread (Silva Pereira et al., 2017). Due to FS, a signal from one underlying source can be present in multiple time series. This creates error in the estimation of statistical dependencies between time series data which in turn hamper the evaluation of FC (Bastos and Schoffelen, 2016).
Posterior-to-anterior information flow over the cortex in higher frequency bands in HC subjects with a reversed pattern in the θ band has been reported (Engels et al., 2017b). The information flow from the precuneus and the visual cortex, toward frontal and subcortical structures, was found to be decreased prominently in AD (Engels et al., 2017b). MEG based multiplex brain network yields to an effective structure for the integration of the frequency specific networks (Yu et al., 2017).
Effective Connectivity Assessment
Recent studies have been performed on MEG data for the analysis of EC in AD and MCI (Gómez et al., 2017). Granger Causality (GC) was implemented for the estimation of EC. According to GC, if a signal P “Granger-causes” (or “G-causes”) a signal Q, then past values of P should contain information that helps to predict Q, above and beyond the information contained in past values of Q alone (Granger, 1969). For all the five conventional frequency bands, connectivity values were lower for MCI in comparison to HC subjects. Interhemispheric GC was found to be decreased between frontal areas (both directions) in θ, α, and β, from left central to right central in θ, between posterior brain regions in α and β, and finally between temporal areas (from right to left in θ, and in both directions in α, β, and γ; Gómez et al., 2017). On the other hand, statistically significant differences in intra-hemispheric couplings were found mainly between frontal, lateral, and posterior areas, but also from these aforementioned areas to central regions, and between posterior and frontal regions (Gómez et al., 2017). In θ, β, and γ bands, decrements in EC patterns was observed, whereas increments in EC was found in the δ band in AD using GC (Juan-Cruz et al., 2017).
After analyzing all the findings reported for MEG based connectivity studies, a decrease in MEG based functional connectivity in the higher frequency bands are observed. Increase in connectivity has mainly been observed in the parietal and temporal regions as well as between the parietal and occipital regions and here FC was not frequency dependent. It is concluded from all these connectivity analyses that parietal areas along with left frontal and occipital areas are associated with the decrease in long term connection and for short term connection involvement of the frontal and parietal regions of right hemisphere was reported.
The pattern changes of connectivity in AD and MCI have been shown year wise from literature as compared to HC subjects in Figure 3. All the parameters (e.g., coherence, SL etc.) are listed in the vertical axis. Most of the studies have accomplished FC analysis of MEG data for AD and reported a decreased connectivity in all bands (δ, θ, α, β, and γ). Mostly the variations were observed in α and β bands. Although majority of the investigations inferred reduced connectivity than HC subjects, but variability of research outcomes are observed in different research groups. EC experiment was implemented only in two studies reported in 2017 which also detected less connectivity for AD and MCI.
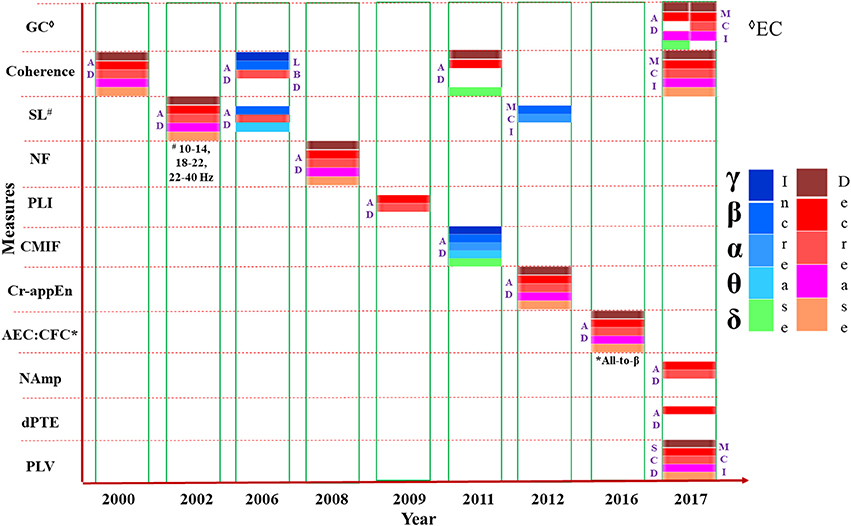
Figure 3. Presentation of various measures (e.g., coherence, SL etc.) used in connectivity analysis from MEG data, mentioned in the vertical axis, in chronological order. The horizontal axis represents the year of study. Changes to the parameters in the frequency bands (δ, θ α, β, and γ) are indicated using different color codes. GC: Granger Causality, Coherence; SL, Synchronization Likelihood; NF, Nonlinear Forecasting; PLI, Phase Lag Index; CMIF, Cross Mutual Information Function; Cr-appEn, Cross-Approximate Entropy; AEC, Amplitude Envelope Correlation; CFC, Cross Frequency Coupling; NAmp, Node based Amplitude; dPTE, Directed Phase Transfer Entropy; PLV, Phase Locking Value.
Network Analysis
Brain networks deal with the modular and hierarchical nature of brain activities with the hub regions of brain (Bassett and Bullmore, 2009; Bullmore and Sporns, 2009). Graph and modern network theory applied on FC values has been used to find out the framework of brain topology. From connectivity matrix, graph theoretical algorithm based brain networks are derived. In order to capture most significant connections within a graph, the application of statistical thresholding scheme and selection of an appropriate filtering for meaningful topologies is a critical step in brain connectivity analysis. Common measures like clustering coefficient, Eigen vector centrality, characteristic path length, intramodular connectivity have been utilized for MEG based network analysis in AD research (Stam et al., 2009; Engels et al., 2017a). MEG based networks contain some organizational properties that is termed as “small-world topology” (Stam, 2004) to include high global efficiency as well as local interconnectedness (Watts and Strogatz, 1998). “Hub” is defined as a network node (brain region) with the specific property of having a high centrality, i.e., it plays an important role within the network. Many studies have been reported for the identification of the hubs in the brain (de Haan et al., 2012c). Highly localized clustering and short characteristics path length has been found in undirected binary and weighted brain networks (Rutter et al., 2013; Bassett and Bullmore, 2017).
MEG research in AD indicated decrease in hub regions in AD patients, specifically in the parietal region in the θ band (de Haan et al., 2012c). Lower FC is a result of weakening of hubs as these hubs are considered as the connectors of groups of highly functional intra-connected brain areas, or modules (De Pasquale et al., 2016). Inter-modular connectivity was found lower in AD compared to controls using MEG study (de Haan et al., 2012c). A relationship between network characteristics and performance on cognitive tests was observed in studies (Ortiz-Alonso et al., 2003). Lower hubness, which was measured with the Eigen vector centrality, has been correlated positively with lower MMSE, and lower between-module strength was related to poorer performance for word recall, word fluency and visual recognition (de Haan et al., 2012b,c). These results validate the concept of disintegration of functional connections and network disorganization in AD.
To avoid any spurious connection in a fully connected graph requires statistical filtering and surrogate networks are applied to address this problem. Surrogate network for normalization as well as comparison with random network has also been used in few studies (Stam et al., 2009; van Wijk et al., 2010; Rutter et al., 2013). Topological filtering (Dimitriadis et al., 2017a,b) is the next step to be followed to derive meaningful network structure consisting of only the essential interactions. Some approaches involving topological filter have been undertaken in network analysis for AD research, like minimum spanning tree (MST) (Çiftçi, 2011; López et al., 2017a), which is better than conventional procedure (Hillebrand et al., 2012). MST is a subset of the edges of a connected, edge-weighted (un) directed graph that connects all the vertices together, without any cycles and with the minimum possible total edge weight (Tewarie et al., 2015). MST is gaining popularity as it is assumption free and unbiased method. This method overcomes the constraints of existing topological filtering techniques by preserving the connectedness of brain network but also it typically ends up with large sparse graph. To address this problem, orthogonal MST (OMST) was introduced by employing different algorithms such as Kruskal (1956) and Prim (1957) to construct the MST for a weighted graph. The OMST method conserves the main advantage of MST and further confirms a denser and potentially more meaningful network. Other than OMST, the additional topological filtering techniques are global cost efficiency (GCE), mean degree, proportional, absolute and data driven based algorithms (Dimitriadis et al., 2017a,b). In MEG based resting state connectivity study for multi group GCE has been implemented (Dimitriadis et al., 2017a). A k-core network which is evaluated by thresholding the network to retain only those nodes with high nodal degree has been implemented for the construction of fully connected graph (Daianu et al., 2013).
In AD, neural complexity was found lower in low frequencies (van Walsum et al., 2003). Low clustering coefficient and short characteristic path length suggested a more random configuration of network in AD than HC subjects (Stam et al., 2009). Decrease in Eigen vector centrality reported the loss of a known temporal hub in AD and also fewer modules with weaker connections (de Haan et al., 2012b,c).
In MCI, an enhancement of the strength of connections, together with an increase in the outreach parameter was observed in the graphs using complex network analysis of MEG data with SL (Buldú et al., 2011). It indicates that memory processing in MCI is associated with higher energy expenditure and a tendency toward random structure, which breaks the balance between integration and segregation (Buldú et al., 2011). These reports suggest that for healthy individual's parietal region acts as a hub region.
Findings of MEG based FC analysis has been reported as small-world network within human brain characterized by dense local clustering for neighbor nodes along with a short path length between any pair of nodes (Stam, 2004; Stam et al., 2009). Source-space weighted functional networks were characterized with graph theoretical measures in event-related network analysis (ERNA) for a MEG based cognitive study. Dense and clustered connectivity between the hubs belonging to different modules is reported as the “network fingerprint” of cognition (Bola and Sabel, 2015). Recently, a new approach for MEG analysis is introduced and named as “multiplex network analysis” (Yu et al., 2017). Diagrammatic representation of the results reported for global brain network analysis performed using MEG data in a successive year-wise manner in Figure 4.
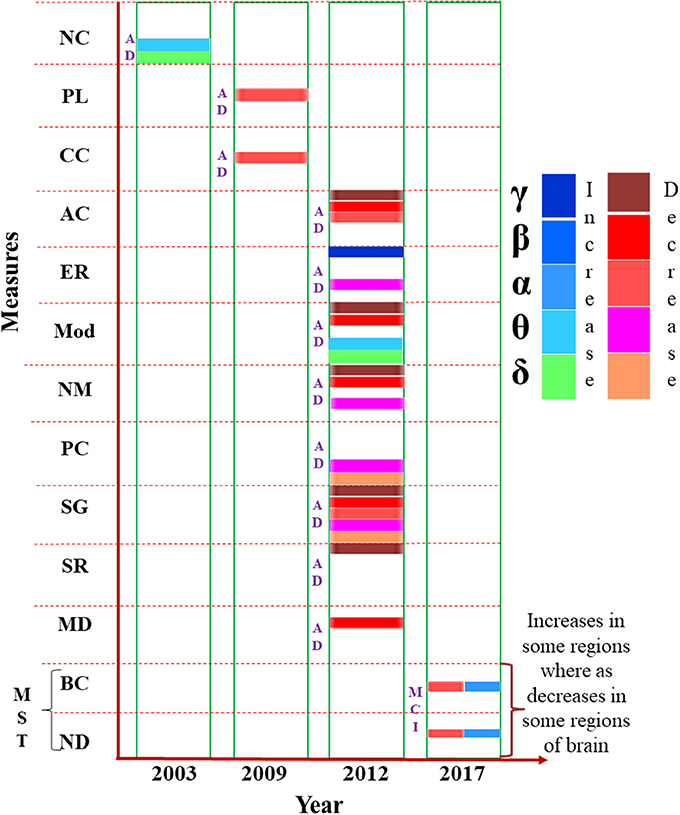
Figure 4. Presentation of various measures (e.g., node modularity, path length etc.) used in brain network analysis from MEG data, mentioned in the vertical axis, in chronological order. The horizontal axis represents the year of study. Changes to the parameters in the frequency bands (δ, θ α, β, and γ) are indicated using different color codes. NC, Neural Complexity; PL, Path Length; CC, Clustering Coefficient; AC, Algebraic Connectivity; ER, Eigen Ratio; Mod, Modularity; NM, Number of Modules; PC, Participation Coefficient; SG, Spectral Gap; SR, Spectral Radius; MD, Within Module Degree; MST, Minimum Spanning Tree; BC, Betweenness Centrality; ND, Node Degree.
Machine Learning Approach for MEG Based Analysis
The developments and availability of various feature extraction and classification techniques based on machine learning have been growing for MEG signal analysis (Deo, 2015). In combination with network analysis studies, implementation of machine learning algorithms like random forest, support vector machine (SVM) could easily distinguish the two clinical groups (Cichy et al., 2016b; Zanin et al., 2016). In a group study consisting subjects of multiple sclerosis, AD, schizophrenia, Sjogren's syndrome, chronic alcoholism, facial pain as well as HCs (Georgopoulos et al., 2007), MEG data was classified using Genetic algorithm-linear discriminant analysis (GA-LDA) with autoregressive integrated moving average (ARIMA) features. They reported results by dividing subjects into three sample groups, (1) 52 subjects, 6 groups, (2) 46 subjects, 5 groups, and (3) 142 subjects, 7 groups. Another study reported to classify AD and control group 70.73 and 78.05% accurately using features of SampEn and LZC, respectively with leave-one-out-cross validation method (Gómez et al., 2009a). However, they were able to achieve 85.37% accuracy by implementing adaptive network based fuzzy inference system classifier for distinguishing AD and control subjects. In a combined MEG and fMRI study, multivariate analysis of MEG data with linear SVM was used to select MEG sensors that contain discriminative information in noisy data without human intervention (Cichy et al., 2016a).
In a recent study (Maestú et al., 2015), a new approach of classification called Clinical Data Partitioning (CliDaPa) algorithm has been incorporated to distinguish MCI from controls. They proposed CliDaPa process that includes Chi Square filtering feature selection and machine learning classifiers. Random Forest (Breiman, 2001), Bayesian Network (Buntine, 1991), C4.5 induction tree (Quinlan, 1993), K-nearest Neighbor (Cover and Hart, 1967), Logistic Regression (Ng and Jordan, 2002), and SVM (Suykens and Vandewalle, 1999) classification algorithms are included in their proposed method. They applied bootstrap validation to measure the robustness and accuracy of proposed pipeline. High accuracy up to 86% was achieved by using 10-fold cross validation based Linear discriminant analysis (LDA) and radial basis function SVM (rbf-SVM) classifier for single domain and multi domain MCI patients. LDA was utilized for the classification of with leave-one-out cross validation (Bruña et al., 2012). Discriminant analysis has also been used for AD and HC classification (Fernández et al., 2003).
Statistical Analysis of MEG Data
Parametric, e.g., students t-test, analysis of variance (ANOVA), Chi-Squared tests (Franciotti et al., 2006; Stam et al., 2006; Gómez et al., 2007b; Poza et al., 2007b, 2008a; Ishii et al., 2010; Engels et al., 2017b; López et al., 2017a; López-Sanz et al., 2017) as well as non-parametric, e.g., Wilcoxon–Mann–Whitney tests (Alonso et al., 2011) statistics has been applied for MEG data analysis (Kiebel et al., 2005). Parametric tests are performed depending upon specific assumptions.
Analysis of variance (ANOVA) and two-tailed t-test were applied to test the group differences. Spearman's bivariate correlation test were used to access the connection between cognitive status and network derived measures (Stam et al., 2009). Use of Systat software for windows has been reported to calculate Huynh-Feldt-corrected P values for MEG data (Stam et al., 2002). They stated application of a two-way repeated measure analysis of variance with AD and HC group as an inter subject factor and 117 MEG channels as intra subject factor. Pearson correlation coefficient has been used to correlate MEG and MRI volumetric variables (relative left and right hippocampal volume) to distinguish AD and HC group (Maestú et al., 2003). The AD vs. HC analysis has also been done using Multivariate analysis of variance (MANOVA) where they choose parameters correlation dimension and neural complexity (van Walsum et al., 2003). A three-way repeated measures ANOVA was used to compare power values between groups. To compare activation within ROIs and peak frequencies also t-test was carried out (Osipova et al., 2005). ANOVA with Greenhouse-Geisser correction has been utilized for the qualitative statistical classification among AD, MCI, and control groups (Escudero et al., 2011).
Non-parametric test, on the other hand, does not make any such assumption and can be performed even without any information regarding population or have a small population. Non-parametric two-tailed Mann–Whitney U-test was carried out using SPSS software for evaluation of statistical significance of classification between AD and normal individuals (Poza et al., 2007a). Mann–Whitney U-test has also been used with leave-out cross-validation to measure the ability of median frequency and spectral entropy to differentiate AD from HCs (Escudero et al., 2008). Kruskal–Wallis test was performed for each channel pair between MCI and HC (Bajo et al., 2010). For evaluation of statistical significance Wilcoxon signed rank test was performed on simulated data (Brookes et al., 2011).
The advantage of non-parametric statistical test is that it gives complete freedom of choosing the experimental conditions for comparison. This independence delivers an up-front approach to explain the Multiple Comparisons Problem (MCP) (Maris and Oostenveld, 2007). MCP is a commonly found problem in statistical analysis of MEG. This problem initiates since MEG-data are multidimensional. The signal is sampled at multiple channels and multiple time points; hence MEG-data becomes multidimensional. Moreover, during MEG data analysis the effect of interest (i.e., a difference between experimental conditions) is evaluated at an extremely large number of (channel, time)-pairs which in turn gives rise to MCP.
For correction of MCP, Bonferroni correlation was used while statistically validating MEG-MRS combined study using ANOVA for AD and HC (Maestu et al., 2005). In a comparative study of progressive MCI, stable MCI and controls using synchronization likelihood parameter Kruskal–Wallis (KW) test was performed. To correct for MCP, they applied non-parametric permutation testing followed by surrogate t-maps (Bajo et al., 2012). One study has done correction for MCP by taking maximum mean PLI values over ROIs (Hillebrand et al., 2012). Distribution for t-test was derived from permutation to avoid family wise error occurring due to MCP in the classification of healthy aged persons from MCI and AD (Fernández et al., 2013) and similarly to distinguish among sd-aMCI, md-aMCI, and HCs (López et al., 2014b). Implementation of false discovery rate (FDR) for multiple comparisons correction was not found significant in a t-test based classification of single domain amnestic MCI and HC group (Pineda-Pardo et al., 2014) whereas in other studies FDR showed robustness in correcting MCP (Ranasinghe et al., 2014; Engels et al., 2016b; Gómez et al., 2017). Mann–Whitney U-tests modified for multiple comparisons by a Bonferroni correction were performed in the statistical analysis of MEG based study of HC, MCI, and AD (Poza et al., 2014). Significant differences in FC between progressive MCI, stable MCI, and HCs was calculated using Mann–Whitney U-test to correct MCP using non-parametric permutation test (López et al., 2014a). Maximum t-value across ROIs of each permutation was utilized to build a distribution of maximum t-values to address MCP problem in a study of AD and HCs using MEG (Engels et al., 2016a). Permutation tests for random-effects inference and MCP correction has been performed with a cluster-level in MEG data analysis (Cichy et al., 2016b). Tukey's Honestly Significant Difference (HSD) MCP correction was implemented for neuropsychological scores in MEG based classification of aged HCs, SCD and MCI group (López-Sanz et al., 2016).
Although, in some studies both parametric as well as non-parametric statistics have implemented for comparison, but they have not applied MCP correction (de Haan et al., 2012c; Josef Golubic et al., 2017; Juan-Cruz et al., 2017).
Discussion
MEG provide means to uncover AD related deviations in brain oscillations. In-depth analysis of MEG application in AD can be useful to identify plausible biomarkers to detect the early stages of this disease. This section entails thorough explanation about the outcomes of single channel, connectivity, network analysis of MEG data in AD and MCI.
The neuropsychological studies involving MMSE and FAST results of AD patients have been related to slowing of brain oscillations and cognitive declined indicated by MEG (Fernández et al., 2006a, 2013). Studies also found that low MMSE score in AD was related to slowing in parietal and central regions of brain (de Haan et al., 2008).
From the analysis of all the research reporting single channel analysis, it is evident that AD patients have less complex, more regular and predictable brain oscillations. It is the indication of the slowing oscillatory activities (Stam, 2005). Word processing in AD has also been examined using MEG data (Walla et al., 2005). Moreover, studies performing evaluation of wavelet turbulence and entropy analysis demonstrated an increase in the average degree of similarity within time series with the progress of AD (Poza et al., 2007b). Basically it indicates that in AD brain signals have a less uniform spectral control (Poza et al., 2007b). Nonlinear findings suggested that the decrease in complexity of brain signals in AD might be simply due to the altered spectrum reported in AD (Stam, 2005). Studies also pointed out that the complexity, regularity and predictability measures of the single channel MEG analysis are not entirely dependent on the spectral component of the data. Presence of nonlinear structures has been found from surrogate data of EEG and MEG in AD and HC subjects (Pereda et al., 2005; Gómez et al., 2009a). The effect of randomization was different in AD compared to controls which is an indication that complexity and regularity measures in AD studies cannot be completely attributed to the slowing of the signal. This aspect was also found in non-overlapping spectral and complexity study of MEG data (van Walsum et al., 2003). The actual reason for the decrease in complexity is not clear yet. However, loss of neurons and synapses and reduction in neurotransmitters might be involved in this process (Gómez et al., 2009a). It has also been reported that FC and brain network changes due to the changes in synaptic levels (de Haan et al., 2012b).
To properly describe the fact that most active regions have been observed with the most abundant changes in AD, an activity dependent degeneration hypothesis has been proposed (de Haan et al., 2012a). In a recent MEG study, changes in the activation of prefrontal brain area has been observed in early stage AD (Song et al., 2014).
Minimum-variance pseudo-unbiased reduced-rank estimation (MV-PURE) framework has been proposed for better reconstruction of source activity from MEG data (Piotrowski et al., 2017). In addition, multilayer network analysis approach has also been applied to integrate multiple frequency bands in a single framework and results reported disruption of hub regions in AD (Brookes et al., 2016).
MEG studies suggest that the parietal and temporal regions of the brain play an important role in brain functioning. A MEG based study of progressive MCI patients predicted that the increase in phase synchronization between the right anterior cingulate and temporo-occipital areas, is useful to understand the conversion from MCI to AD (López et al., 2014a).
Reports suggest that in MCI and AD difference in these regions are observed as compared to healthy subjects. In case of frequency as well as FC analysis, these regions have shown slow brain activity and decreased connectivity, respectively.
In a study administered by López et al. (2014b), oscillatory brain activities of subtypes of amnestic MCI have been compared by the relative power values of their MEG data. Total 105 subjects' data has been recorded in eyes closed resting state condition. Among all the subjects 36 were HC subjects, 33 were single domain amnestic mild cognitive impairment (sd-aMCI) and the rest 36 were multi-domain amnestic mild cognitive impairment (md-aMCI) patients. The average relative power in the frequency range of 1–30 Hz for each group has been calculated. Increase in relative power in lower frequency bands and decrease in power values in higher frequency bands has been observed in both MCI groups in comparison to control group. Prominent difference has been seen between two subtypes of MCI, the md-aMCI group showed a significant power increase within δ and θ ranges and reduced relative power within α and β ranges. In HC subjects a maximum value has been observed at 10 Hz whereas frequency peak for sd-aMCI and md-aMCI patients were found at 9.5 and 8.5 Hz, respectively (as shown in Figure 5). In addition to that different spectral distribution was visible among the groups. Indicating lower variability, a comparatively narrower band was found for HC subjects. A broader spectrum has been found for both the MCI groups. It might be a sign of higher variability and tendency to lower frequency peaks across subjects. These relative power values were correlated with neuropsychological tests scores and hippocampal volumes.
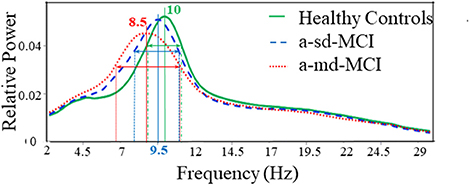
Figure 5. Average relative power spectra for all MEG channels in HC subjects (green line), the amnestic single domain (a-sd) MCI patients (blue dashed line) and the amnestic multi domain (a-md) MCI patients (red dotted line). This Figure is taken from literature (López et al., 2014b) with due permission of the American Aging Association and modified.
Changes in FC have been found in elders with SCD as well as MCI patients compared to healthy individuals in an investigation (López-Sanz et al., 2017). MEG data has been collected in resting state from 39 healthy control elders, 41 elders with SCD, and 51 MCI patients. FC has been evaluated based on source reconstructed MEG data using PLV.
The anterior network presented higher FC in the MCI group compared to HC subjects in three links connecting anterior regions, including left inferior temporal gyrus, left paracingulate, and left anterior cingulate. The posterior network exhibited lower FC in the MCI group, and comprised 14 links between connecting posterior cortical structures such as: temporal medial structures (both hippocampi and right parahippocampus), parietal (left postcentral gyrus, both supramarginal gyri), and occipital areas (left frontal pole, both superior occipital cortices, right inferior occipital cortex, right lingual cortex) (Figure 6).

Figure 6. Links (connection among various brain regions) with significantly different FC values have been shown for comparative analysis. Left: Posterior, superior, left and right views of the brain. Right Circle plot shows a schematic view of the significant links. Comparison between healthy control (HC) subjects and mild cognitive impairment (MCI) group. Red lines indicate an increased FC value in MCI with respect to HC subjects. Blue lines indicate a decreased FC value in MCI with respect to HC subjects. This Figure is taken from literature (López-Sanz et al., 2017) with permission.
SCD subjects showed increased FC values respect to HC subjects in the same regions described in the previous comparison. SCD subjects also showed decreased FC in 11 links. Those links connected both intra and inter-hemispherical areas between posterior regions (as shown in Figure 7). Interestingly, all the links affected in the SCD group, were also disrupted in the MCI group in a similar manner.
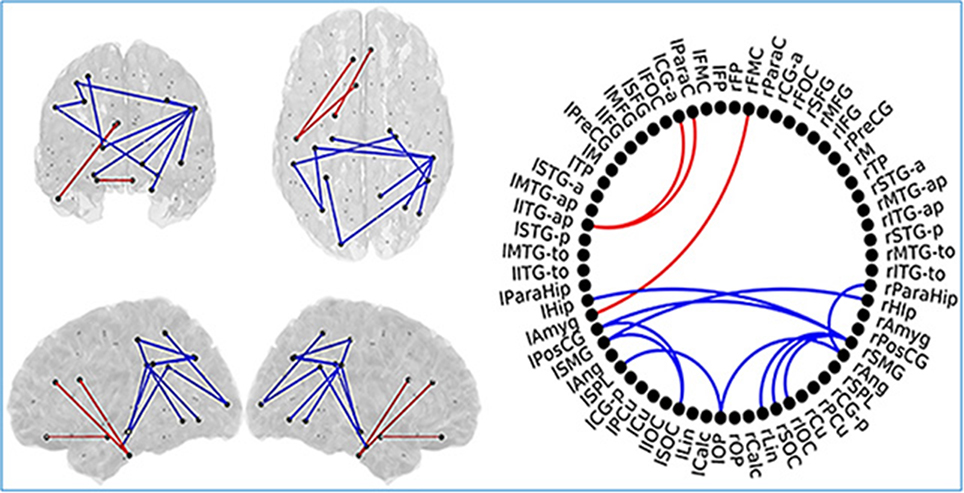
Figure 7. Links (connection among various brain regions) with significantly different FC values have been shown for comparative analysis. Left: Posterior, superior, left and right views of the brain. Right Circle plot shows a schematic view of the significant links. Comparison between healthy control (HC) subjects and subjective cognitive decline (SCD) group. Red lines indicate an increased FC value in SCD respect to HC subjects. Blue lines indicate a decreased FC value in SCD respect to HC subjects. This Figure is taken from literature (López-Sanz et al., 2017) with permission.
MCI patients showed a network comprising four links where FC values were significantly lower compared to SCD FC values. This network with reduced FC connected temporal, parietal and occipital regions of the brain, and comprised both intra and inter-hemispheric links (Figure 8).
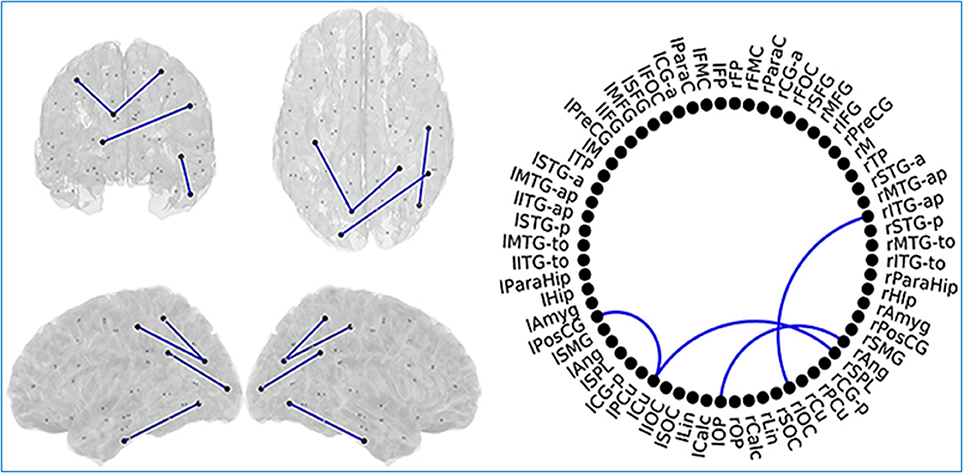
Figure 8. Links (connection among various brain regions) with significantly different FC values have been shown for comparative analysis. Left: Posterior, superior, left and right views of the brain. Right Circle plot shows a schematic view of the significant links. Comparison between subjective cognitive decline (SCD) and mild cognitive impairment (MCI) groups where Blue lines indicate a decreased FC-value in MCI respect to SCD. This Figure is taken from literature (López-Sanz et al., 2017) with permission.
Both SCD and MCI groups exhibited a very similar spatial pattern of altered links: a hyper-synchronized anterior network and a posterior network characterized by a decrease in FC. This decrease was more pronounced in the MCI group. These types of FC alterations may work as a key feature to provide a useful tool to characterize the early stage and predict the course of AD.
In Table 1, we have listed some of the MEG studies, to gather information regarding the efficacy of MEG data analysis methodologies statistically. Accuracy, sensitivity, specificity and area under the region of convergence (ROC) curve (AURC) are briefed in this Table. Different studies have implemented different parameters for MEG data analysis. It is global analysis in most of the cases and not region specific. In addition, frequency bands are also varying in the experiments. AURC values reported in literature within 0.529 and 0.912 range for different studies. From overall observation we noticed that some common parameters like mean frequency (MF), sample entropy (SampEn), and Lempel–Ziv complexity (LZC) have exhibited accuracy ranging between approximately 77–85, 58–70, and 61–83%, respectively. Although high sensitivity and specificity have been accomplished in most of the studies, but it is difficult to draw any exact conclusion from these results due to the heterogeneity and diversity of the metrics. Hence, more region specific, frequency band specific studies are required to be executed to infer more useful information from MEG data analysis.
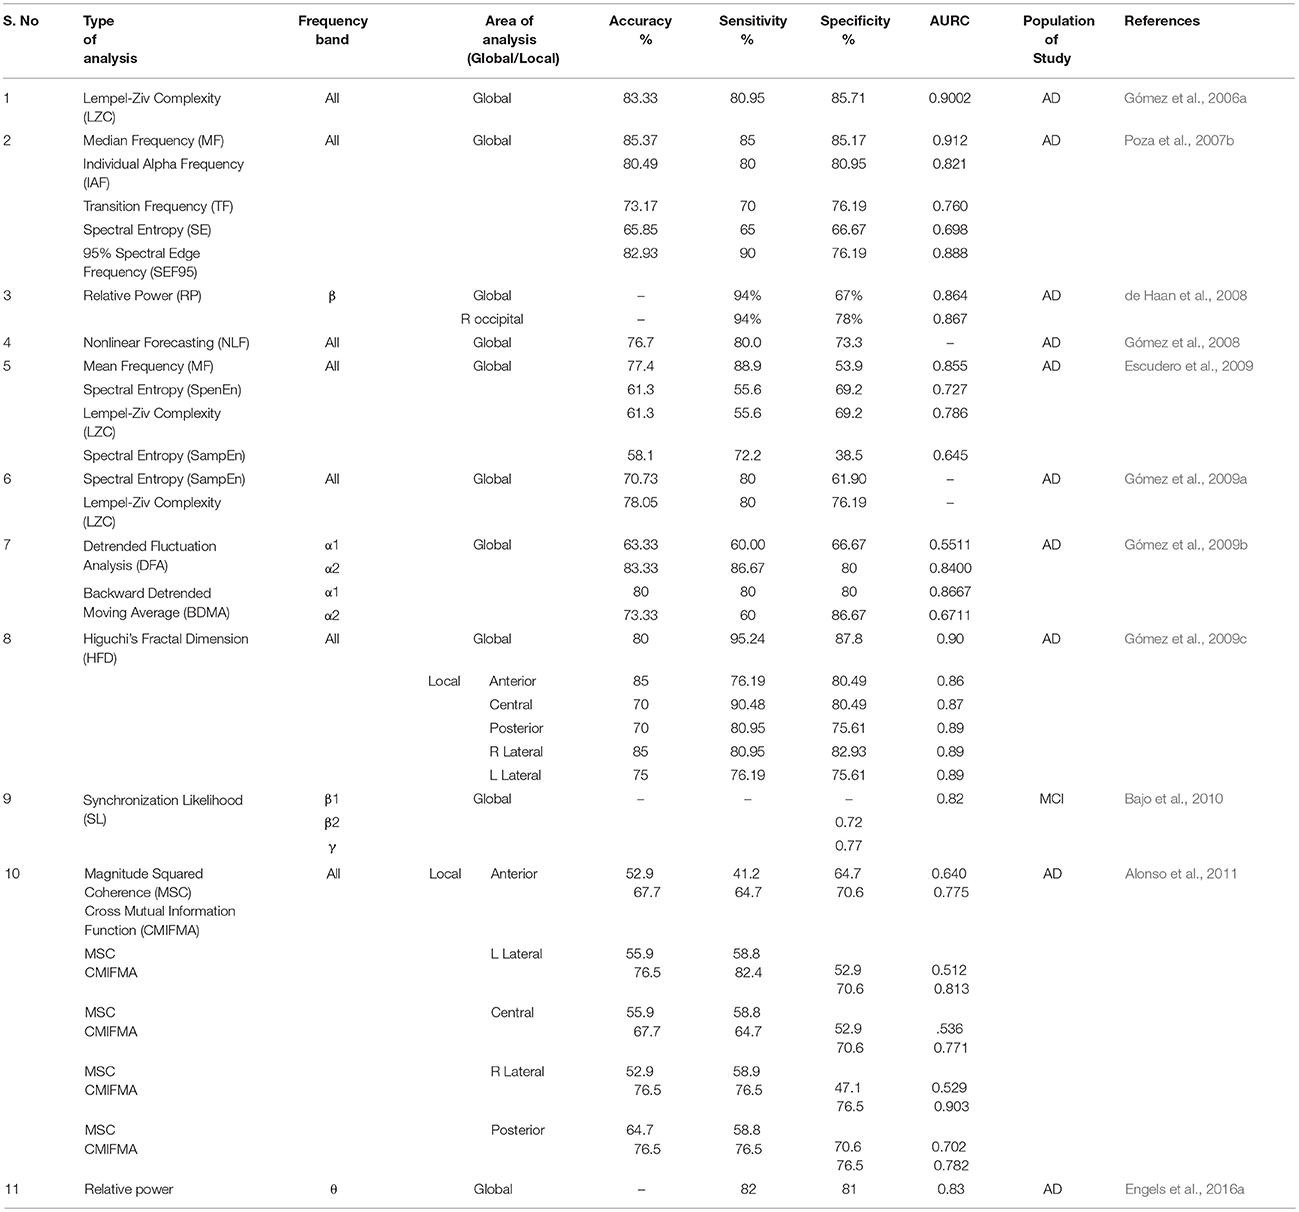
Table 1. Compilation of MEG data analysis using various methods (e.g., sample entropy, cross mutual information function etc.) along with specific frequency bands (δ, θ α, β, and γ), area of analysis (global and local), targeted population and corresponding statistical analysis values (e.g., accuracy, sensitivity etc.) is represented in this table.
As observed from Figure 5, α band frequency in MCI changes, similarly in case of FC we observe the reduction in connectivity pattern for SCD and MCI from HC subjects. Also, from Table 1, it is clear that all these alterations in every parameter take place in AD as well as MCI. Henceforth, further research hit is required to unhide the concrete cause behind these variations. Though MEG studies found slowing down of brain rhythms in AD, but these findings cannot specify AD as majority of brain diseases show similar pattern of brain oscillations. Therefore, from single channel analysis studies it is inferred that a pattern is seen in AD irrespective of applied method. However, uniform distribution of slowing throughout the brain is not seen. These alterations in brain oscillations, the left parietal, occipital and temporal areas were found to be most frequently affected.
Multimodal Approach: MEG in Combination With Other Imaging Modalities
MEG findings reported a lower FC in AD than normal supporting the concept of AD as a ‘disconnection syndrome’ (Delbeuck et al., 2003; Koelewijn et al., 2017). These observations coincide with the results of PET, EEG, or fMRI studies (Leuchter et al., 1992; Besthorn et al., 1994; Desgranges et al., 1998; Adler et al., 2003; Greicius et al., 2007; Wang et al., 2007). Combining different modalities [e.g., EEG, PET, fMRI, magnetic resonance spectroscopy (MRS)] with MEG will be interesting (Langevin and Vachey, 1995; Horwitz and Poeppel, 2002; Rajapakse and Cichocki, 2002; Babiloni et al., 2004; Liu et al., 2006; Hall et al., 2014). It has been reported that integrated approach of EEG and MEG gives more accurate connectivity estimation than individually (Muthuraman et al., 2015).
It is observed that the integrated implementation of the high (millisecond) temporal resolution of MEG and EEG can give better accuracy than fMRI localization in measuring neuronal dynamics within well-defined brain regions and assessing the source localizing ability for identical stimuli (Sharon et al., 2007).
These methods are in fact independent of signal models and it makes them attractive for application in MEG analysis for rapid evaluation of data (Deo, 2015). Such approaches were utilized to joint multimodal processing of MEG and fMRI data. Processing of MEG data with the outputs of a deep neural network obtained from and trained on the same visual categorization task has been performed (Cichy et al., 2016a,b). With the help of these multimodal approaches, new principles of brain function, generalized to functional systems and patient population, are modeled (Cichy et al., 2016a,b).
There are certain neurochemicals (N-acetyl-aspartate (NAA) and myoinositol (mI)) alterations in AD. Concentration of NAA decreases and mI increases with the progression of AD. Integrated study of MEG with MRS has been performed to associate altered brain oscillations with neurochemical changes (Maestu et al., 2005). For a working memory task, the AD group showed a reduced number of activity sources over left temporoparietal areas in MEG analysis. In another MRS study increase in creatine, mI, and in the mI/NAA ratio was observed in bilateral temporoparietal region. These results were correlated with MMSE score and 65% of the variance was found (Maestu et al., 2005).
Modulation of gamma oscillations is a widely established mechanism in a variety of neurobiological processes, but its neurochemical basis is not fully known yet. In addition, research reports suggest that γ oscillation properties depend on GABAergic (gamma-Aminobutyric acid) inhibition (Kujala et al., 2015). The link between GABA concentration and gamma oscillations is a thrust area of research. A direct relationship between the density of GABA receptors and γ oscillations in human primary visual cortex (V1) has been established by an investigation by combining Flumazenil-PET (to measure resting-levels of GABA receptor density) and MEG (to measure visually induced gamma oscillations; Kujala et al., 2015).
Involving various neurotransmitters with altering brain oscillations will open a new research domain for clinical application and it is an important thrust area in our laboratory.
Conclusions
MEG is a powerful technique for the recording of changing activities of brain functions. From single channel analysis, a patterned and consistent slowing of brain oscillations has been observed in AD. FC studies revealed decreased connectivity in AD than controls. EC studies must be implemented further to conclude anything. As a whole, association of parietal and temporal areas has been reported with the advancement of AD in comparison to HC subjects. Involvement of the hippocampus has also been demonstrated but more investigation is required.
The MEG is useful to bridge other electrophysiological measures like EEG, local field potential (LFP), fMRI, PET, and brain stimulation. It opens opportunities for the cross validation of the research findings from various modalities. Moreover, MEG in combination with appropriate modalities can be helpful to understand the nature of changes of the neurotransmitters like gamma-Aminobutyric acid (GABA), glutamate etc. (Muthukumaraswamy, 2014; Kujala et al., 2015). MEG has the capability to open up new avenue for clinical research in AD.
MEG data is usually recorded in altered investigational environments, having a spatiotemporal configuration, sampled at several sensors and multiple time points. Researchers aim to recognize the alteration among the data observed in these conditions. The processing and analysis procedure varies in research studies as can be observed from Figures 3, 4. Some studies work on sensor space data and some on source space which introduce the major alteration in processing pipeline and also the frequency bands considered for the study differs as per requirements and anticipated outcomes. Moreover, in most studies the conditions vary with respect to the configuration of stimulus being presented instantaneously before or during the registration of the signal. In other studies, the conditions change with respect to the type of response given by the experiment subjects. Another aspect in this regard is that AD population is diverse with respect to gender, age, demography, disease progression etc. are difficult to be found similar among studies. Modality Integration also plays an important role in experimental design for AD research. Various modalities such as EEG, fMRI, PET, DTI have been integrated with MEG to gain complementary information. Data availability for AD research is also another major research avenue to investigate for AD research.
Hence, majority of the MEG based brain connectivity studies using same experimental pipeline in AD research cannot directly be compared. It necessitates the demand for open science in MEG research by generalizing a specific pipeline for MEG data acquisition, processing and analysis in clinical setting. Research groups should be interested in making research accessible for all to share their materials and data, others can use and analyze them in new ways, potentially leading to new discoveries. This will reduce the so-called “reproducibility crisis.” MEG data being available will be scientifically beneficial for researchers that can open new avenue in this realm of AD research.
Author Contributions
PKM conceptualize the idea, literature search, and manuscript writing. AB literature search, writing, and figure preparation. MT literature search and writing manuscript. AS literature search and writing.
Funding
Funding is provided by Tata innovation Award (to PKM).
Conflict of Interest Statement
The authors declare that the research was conducted in the absence of any commercial or financial relationships that could be construed as a potential conflict of interest.
Acknowledgments
PKM (Principal Investigator) thanks for financial support from TATA innovation fellowship from Ministry of Science and Technology, Government of India. Sincere thanks to Prof. Partha Raghunathan (NBRC), Dr. Deepika Shukla, (Scientist) for suggestions and comments. Ms. Khushboo Punjabi (R&D engineer) and Saurav Roy (R&D engineer) are appreciated for proof reading.
References
Abatzoglou, I., Anninos, P., Adamopoulos, A., and Koukourakis, M. (2007). Nonlinear analysis of brain magnetoencephalographic activity in Alzheimer disease patients. Acta Neurol. Belg. 107, 34–39.
Adler, G., Brassen, S., and Jajcevic, A. (2003). EEG coherence in Alzheimer's dementia. J. Neural Trans. 110, 1051–1058. doi: 10.1007/s00702-003-0024-8
Aine, C., Huang, M., Stephen, J., and Christner, R. (2000). Multistart algorithms for MEG empirical data analysis reliably characterize locations and time courses of multiple sources. Neuroimage 12, 159–172. doi: 10.1006/nimg.2000.0616
Alonso, J. F., Poza, J., Mañanas, M. A., Romero, S., Fernández, A., and Hornero, R. (2011). MEG connectivity analysis in patients with Alzheimer's disease using cross mutual information and spectral coherence. Ann. Biomed. Eng. 39, 524–536. doi: 10.1007/s10439-010-0155-7
Auer, S., and Reisberg, B. (1997). The GDS/FAST staging system. Int. Psychogeriatr. 9(Suppl. 1), 167–171. doi: 10.1017/S1041610297004869
Babiloni, F., Mattia, D., Babiloni, C., Astolfi, L., Salinari, S., Basilisco, A., et al. (2004). Multimodal integration of EEG, MEG and fMRI data for the solution of the neuroimage puzzle. Magn. Reson. Imaging 22, 1471–1476. doi: 10.1016/j.mri.2004.10.007
Bajo, R., Castellanos, N. P., Cuesta, P., Aurtenetxe, S., Garcia-Prieto, J., Gil-Gregorio, P., et al. (2012). Differential patterns of connectivity in progressive mild cognitive impairment. Brain Connect. 2, 21–24. doi: 10.1089/brain.2011.0069
Bajo, R., Maestú, F., Nevado, A., Sancho, M., Gutiérrez, R., Campo, P., et al. (2010). Functional connectivity in mild cognitive impairment during a memory task: implications for the disconnection hypothesis. J. Alzheimers Dis. 22, 183–193. doi: 10.3233/JAD-2010-100177
Bassett, D. S., and Bullmore, E. T. (2009). Human brain networks in health and disease. Curr. Opin. Neurol. 22, 340–347. doi: 10.1097/WCO.0b013e32832d93dd
Bassett, D. S., and Bullmore, E. T. (2017). Small-world brain networks revisited. Neuroscientist 23, 499–516. doi: 10.1177/1073858416667720
Bastos, A. M., and Schoffelen, J.-M. (2016). A tutorial review of functional connectivity analysis methods and their interpretational pitfalls. Front. Syst. Neurosci. 9:175. doi: 10.3389/fnsys.2015.00175
Berendse, H., Verbunt, J., Scheltens, P., Van Dijk, B., and Jonkman, E. (2000). Magnetoencephalographic analysis of cortical activity in Alzheimer's disease: a pilot study. Clin. Neurophysiol. 111, 604–612. doi: 10.1016/S1388-2457(99)00309-0
Besthorn, C., Förstl, H., Geiger-Kabisch, C., Sattel, H., Gasser, T., and Schreiter-Gasser, U. (1994). EEG coherence in Alzheimer disease. Electroencephalogr. Clin. Neurophysiol. 90, 242–245. doi: 10.1016/0013-4694(94)90095-7
Blinowska, K. J. (2011). Review of the methods of determination of directed connectivity from multichannel data. Med. Biol. Eng. Comput. 49, 521–529. doi: 10.1007/s11517-011-0739-x
Bola, M., and Sabel, B. A. (2015). Dynamic reorganization of brain functional networks during cognition. Neuroimage 114, 398–413. doi: 10.1016/j.neuroimage.2015.03.057
Borroni, B., Colciaghi, F., Corsini, P., Akkawi, N., Rozzini, L., Del Zotto, E., et al. (2002). Early stages of probable Alzheimer disease are associated with changes in platelet amyloid precursor protein forms. Neurol. Sci. 23, 207–210. doi: 10.1007/s100720200042
Brookes, M. J., Hale, J. R., Zumer, J. M., Stevenson, C. M., Francis, S. T., Barnes, G. R., et al. (2011). Measuring functional connectivity using MEG: methodology and comparison with fcMRI. Neuroimage 56, 1082–1104. doi: 10.1016/j.neuroimage.2011.02.054
Brookes, M. J., Tewarie, P. K., Hunt, B. A. E., Robson, S. E., Gascoyne, L. E., Liddle, E. B., et al. (2016). A multi-layer network approach to MEG connectivity analysis. Neuroimage 132, 425–438. doi: 10.1016/j.neuroimage.2016.02.045
Bruña, R., Poza, J., Gómez, C., García, M., Fernández, A., and Hornero, R. (2012). Analysis of spontaneous MEG activity in mild cognitive impairment and Alzheimer's disease using spectral entropies and statistical complexity measures. J. Neural. Eng. 9:036007. doi: 10.1088/1741-2560/9/3/036007
Buldú, J. M., Bajo, R., Maestú, F., Castellanos, N., Leyva, I., Gil, P., et al. (2011). Reorganization of functional networks in mild cognitive impairment. PLoS ONE 6:e19584. doi: 10.1371/journal.pone.0019584
Bullmore, E., and Sporns, O. (2009). Complex brain networks: graph theoretical analysis of structural and functional systems. Nat. Rev. Neurosci. 10, 186–198. doi: 10.1038/nrn2575
Buntine, W. (1991). “Theory refinement on Bayesian networks,” in Uncertainty Proceedings 1991 (Moffet Field, CA: Elsevier), 52–60.
Cheng, C. H., Wang, P. N., Hsu, W. Y., and Lin, Y. Y. (2012). Inadequate inhibition of redundant auditory inputs in Alzheimer's disease: an MEG study. Biol. Psychol. 89, 365–373. doi: 10.1016/j.biopsycho.2011.11.010
Cichy, R. M., Khosla, A., Pantazis, D., Torralba, A., and Oliva, A. (2016a). Comparison of deep neural networks to spatio-temporal cortical dynamics of human visual object recognition reveals hierarchical correspondence. Sci. Rep. 6:27755. doi: 10.1038/srep27755
Cichy, R. M., Pantazis, D., and Oliva, A. (2016b). Similarity-based fusion of MEG and fMRI reveals spatio-temporal dynamics in human cortex during visual object recognition. Cereb. Cortex 26, 3563–3579.
Çiftçi, K. (2011). Minimum spanning tree reflects the alterations of the default mode network during Alzheimer's disease. Ann. Biomed. Eng. 39, 1493–1504. doi: 10.1007/s10439-011-0258-9
Cohen, D. (1968). Magnetoencephalography: evidence of magnetic fields produced by alpha-rhythm currents. Science 161, 784–786.
Cohen, D. (1972). Magnetoencephalography: detection of the brain's electrical activity with a superconducting magnetometer. Science 175, 664–666.
Cover, T., and Hart, P. (1967). Nearest neighbor pattern classification. IEEE Trans. Inf. Theor. 13, 21–27. doi: 10.1109/TIT.1967.1053964
Daianu, M., Jahanshad, N., Nir, T. M., Toga, A. W., Jack, C. R., Weiner, M. W., et al. (2013). Breakdown of brain connectivity between normal aging and Alzheimer's disease: a structural k-Core network analysis. Brain Connect. 3, 407–422. doi: 10.1089/brain.2012.0137
Dalal, S. S., Zumer, J., Agrawal, V., Hild, K., Sekihara, K., and Nagarajan, S. (2004). NUTMEG: a neuromagnetic source reconstruction toolbox. Neurol. Clin. Neurophysiol. 2004:52.
de Haan, W., Mott, K., van Straaten, E. C., Scheltens, P., and Stam, C. J. (2012a). Activity dependent degeneration explains hub vulnerability in Alzheimer's disease. PLoS Comput. Biol. 8:e1002582. doi: 10.1371/journal.pcbi.1002582
de Haan, W., Stam, C. J., Jones, B. F., Zuiderwijk, I. M., van Dijk, B. W., and Scheltens, P. (2008). Resting-state oscillatory brain dynamics in Alzheimer disease. J. Clin. Neurophysiol. 25, 187–193. doi: 10.1097/wnp.0b013e31817da184
de Haan, W., van der Flier, W. M., Koene, T., Smits, L. L., Scheltens, P., and Stam, C. J. (2012b). Disrupted modular brain dynamics reflect cognitive dysfunction in Alzheimer's disease. Neuroimage 59, 3085–3093. doi: 10.1016/j.neuroimage.2011.11.055
de Haan, W., van der Flier, W. M., Wang, H., Van Mieghem, P. F., Scheltens, P., and Stam, C. J. (2012c). Disruption of functional brain networks in Alzheimer's disease: what can we learn from graph spectral analysis of resting-state magnetoencephalography? Brain Connect. 2, 45–55. doi: 10.1089/brain.2011.0043
De Pasquale, F., Della Penna, S., Sporns, O., Romani, G., and Corbetta, M. (2016). A dynamic core network and global efficiency in the resting human brain. Cereb. Cortex 26, 4015–4033. doi: 10.1093/cercor/bhv185
Delbeuck, X., Van der Linden, M., and Collette, F. (2003). Alzheimer'disease as a disconnection syndrome? Neuropsychol. Rev. 13, 79–92. doi: 10.1023/A:1023832305702
Delorme, A., and Makeig, S. (2004). EEGLAB: an open source toolbox for analysis of single-trial EEG dynamics including independent component analysis. J. Neurosci. Methods 134, 9–21. doi: 10.1016/j.jneumeth.2003.10.009
Deo, R. C. (2015). Machine learning in medicine. Circulation 132, 1920–1930. doi: 10.1161/circulationaha.115.001593
Desgranges, B., Baron, J. C., and Eustache, F. (1998). The functional neuroanatomy of episodic memory: the role of the frontal lobes, the hippocampal formation, and other areas. Neuroimage 8, 198–213. doi: 10.1006/nimg.1998.0359
Dickerson, B. C. (2007). Advances in functional magnetic resonance imaging: technology and clinical applications. Neurotherapeutics 4, 360–370. doi: 10.1016/j.nurt.2007.05.007
Dickie, D. A., Shenkin, S. D., Anblagan, D., Lee, J., Blesa Cabez, M., Rodriguez, D., et al. (2017). Whole brain magnetic resonance image atlases: A systematic review of existing atlases and caveats for use in population imaging. Front. Neuroinform. 11:1. doi: 10.3389/fninf.2017.00001
Dimitriadis, S. I., Antonakakis, M., Simos, P., Fletcher, J. M., and Papanicolaou, A. C. (2017a). Data-driven topological filtering based on orthogonal minimal spanning trees: application to multigroup magnetoencephalography resting-state connectivity. Brain Connect. 7, 661–670. doi: 10.1089/brain.2017.0512
Dimitriadis, S. I., Salis, C., Tarnanas, I., and Linden, D. E. (2017b). Topological filtering of dynamic functional brain networks unfolds informative chronnectomics: a novel data-driven thresholding scheme based on Orthogonal Minimal Spanning Trees (OMSTs). Front. Neuroinform. 11:28. doi: 10.3389/fninf.2017.00028
Drachman, D. A. (2006). Aging of the brain, entropy, and Alzheimer disease. Neurology 67, 1340–1352. doi: 10.1212/01.wnl.0000240127.89601.83
Engels, M. M. A., Hillebrand, A., van der Flier, W. M., Stam, C. J., Scheltens, P., and van Straaten, E. C. (2016a). Slowing of hippocampal activity correlates with cognitive decline in early onset alzheimer's disease. an meg study with virtual electrodes. Front. Hum. Neurosci. 10:238. doi: 10.3389/fnhum.2016.00238
Engels, M. M. A., van der Flier, W. M., Stam, C. J., Hillebrand, A., Scheltens, P., and van Straaten, E. C. W. (2017a). Alzheimer's disease: the state of the art in resting-state magnetoencephalography. Clin. Neurophysiol. 128, 1426–1437. doi: 10.1016/j.clinph.2017.05.012
Engels, M. M. A., Yu, M., Arjan, H., Scheltens, P., van der Flier, W. M., van Straaten, E. C. W., et al. (2016b). Meg Cross-Frequency Analysis in Patients with Alzheimer's Disease. Alzheimers Dement. 12, P1087–P1088. doi: 10.1016/j.jalz.2016.06.2271
Engels, M. M. A., Yu, M., Stam, C. J., Gouw, A. A., van der Flier, W. M., Scheltens, P., et al. (2017b). Directional information flow in patients with Alzheimer's disease. a source-space resting-state MEG study. Neuroimage Clin. 15, 673–681. doi: 10.1016/j.nicl.2017.06.025
Escudero, J., Hornero, R., Abásolo, D., and Fernández, A. (2009). Blind source separation to enhance spectral and non-linear features of magnetoencephalogram recordings. Application to Alzheimer's disease. Med. Eng. Phys. 31, 872–879. doi: 10.1016/j.medengphy.2009.04.003
Escudero, J., Hornero, R., Poza, J., Abásolo, D., and Fernández, A. (2008). Assessment of classification improvement in patients with Alzheimer's disease based on magnetoencephalogram blind source separation. Artif. Intell. Med. 43, 75–85. doi: 10.1016/j.artmed.2008.01.001
Escudero, J., Sanei, S., Jarchi, D., Abásolo, D., and Hornero, R. (2011). Regional coherence evaluation in mild cognitive impairment and Alzheimer's disease based on adaptively extracted magnetoencephalogram rhythms. Physiol. Meas. 32, 1163–1180. doi: 10.1088/0967-3334/32/8/011
Fernández, A., Arrazola, J., Maestú, F., Amo, C., Gil-Gregorio, P., Wienbruch, C., et al. (2003). Correlations of hippocampal atrophy and focal low-frequency magnetic activity in Alzheimer disease: volumetric MR imaging-magnetoencephalographic study. Am. J. Neuroradiol. 24, 481–487.
Fernández, A., Hornero, R., Mayo, A., Poza, J., Gil-Gregorio, P., and Ortiz, T. (2006a). MEG spectral profile in Alzheimer's disease and mild cognitive impairment. Clin. Neurophysiol. 117, 306–314. doi: 10.1016/j.clinph.2005.10.017
Fernández, A., Maestú, F., Amo, C., Gil, P., Fehr, T., Wienbruch, C., et al. (2002). Focal temporoparietal slow activity in Alzheimer's disease revealed by magnetoencephalography. Biol. Psychiatry 52, 764–770. doi: 10.1016/S0006-3223(02)01366-5
Fernández, A., Turrero, A., Zuluaga, P., Gil, P., Maestú, F., Campo, P., et al. (2006b). Magnetoencephalographic parietal delta dipole density in mild cognitive impairment: preliminary results of a method to estimate the risk of developing Alzheimer disease. Arch. Neurol. 63, 427–430. doi: 10.1001/archneur.63.3.427
Fernández, A., Turrero, A., Zuluaga, P., Gil-Gregorio, P., del Pozo, F., Maestu, F., et al. (2013). MEG delta mapping along the healthy aging-Alzheimer's disease continuum: diagnostic implications. J. Alzheimers Dis. 35, 495–507. doi: 10.3233/JAD-121912
Folstein, M. F., Folstein, S. E., and McHugh, P. R. (1975). “Mini-mental state”: a practical method for grading the cognitive state of patients for the clinician. J. Psychiatric. Res. 12, 189–198.
Franciotti, R., Iacono, D., Della Penna, S., Pizzella, V., Torquati, K., Onofrj, M., et al. (2006). Cortical rhythms reactivity in AD, LBD and normal subjects: a quantitative MEG study. Neurobiol. Aging 27, 1100–1109. doi: 10.1016/j.neurobiolaging.2005.05.027
Friston, K. J. (1994). Functional and effective connectivity in neuroimaging: a synthesis. Hum. Brain Mapp. 2, 56–78. doi: 10.1002/hbm.460020107
Friston, K. J. (2011). Functional and effective connectivity: a review. Brain Connect. 1, 13–36. doi: 10.1089/brain.2011.0008
Friston, K. J., Holmes, A. P., Worsley, K. J., Poline, J. P., Frith, C. D., and Frackowiak, R. S. (1994). Statistical parametric maps in functional imaging: a general linear approach. Hum. Brain Mapp. 2, 189–210. doi: 10.1002/hbm.460020402
Georgopoulos, A. P., Karageorgiou, E., Leuthold, A. C., Lewis, S. M., Lynch, J. K., Alonso, A. A., et al. (2007). Synchronous neural interactions assessed by magnetoencephalography: a functional biomarker for brain disorders. J. Neural Eng. 4, 349–355. doi: 10.1088/1741-2560/4/4/001
Gloor, P., Ball, G., and Schaul, N. (1977). Brain lesions that produce delta waves in the EEG. Neurology 27, 326–326. doi: 10.1212/WNL.27.4.326
Gómez, C., Hornero, R., Abásolo, D., Fernández, A., and Escudero, J. (2007b). Analysis of the magnetoencephalogram background activity in Alzheimer's disease patients with auto-mutual information. Comput. Methods Programs Biomed. 87, 239–247. doi: 10.1016/j.cmpb.2007.07.001
Gómez, C., Hornero, R., Abásolo, D., Fernández, A., and Escudero, J. (2009a). Analysis of MEG background activity in Alzheimer's disease using nonlinear methods and ANFIS. Ann. Biomed. Eng. 37, 586–594. doi: 10.1007/s10439-008-9633-6
Gómez, C., Hornero, R., Abásolo, D., Fernández, A., and López, M. (2006a). Complexity analysis of the magnetoencephalogram background activity in Alzheimer's disease patients. Med. Eng. Phys. 28, 851–859. doi: 10.1016/j.medengphy.2006.01.003
Gómez, C., Hornero, R., Abásolo, D., Fernandez, A., and Poza, J. (2009b). “Study of the MEG background activity in Alzheimer's disease patients with scaling analysis methods,” in Annual International Conference of the IEEE Engineering in Medicine and Biology Society, EMBC 2009 (Minneapolis, MN).
Gomez, C., Hornero, R., Fernandez, A., Abasolo, D., Escudero, J., and Lopez, M. (2006b). “Magnetoencephalogram background activity analysis in Alzheimer's disease patients using auto mutual information,” in 28th Annual International Conference of the IEEE Engineering in Medicine and Biology Society, EMBS'06. (New York, NY).
Gómez, C., Hornero, R., Mediavilla, Á., Fernández, A., and Abásolo, D. (2008). “Nonlinear forecasting measurement of magnetoencephalogram recordings from Alzheimer's disease patients,” in EMBS 2008, 30th Annual International Conference of the IEEE Engineering in Medicine and Biology Society.
Gómez, C., Juan-Cruz, C., Poza, J., Ruiz-Gómez, S. J., Gomez-Pilar, J., Núñez, P., et al. (2017). Alterations of effective connectivity patterns in mild cognitive impairment: an meg study. J. Alzheimers Dis. doi: 10.3233/JAD-170475. [Epub ahead of print].
Gómez, C., Martínez-Zarzuela, M., Poza, J., Díaz-Pernas, F. J., Fernández, A., and Hornero, R. (2012). “Synchrony analysis of spontaneous MEG activity in Alzheimer's disease patients,” in 2012 Annual International Conference of the IEEE Engineering in Medicine and Biology Society (EMBC) (San Diego, CA).
Gómez, C., Mediavilla, A., Hornero, R., Abásolo, D., and Fernández, A. (2009c). Use of the Higuchi's fractal dimension for the analysis of MEG recordings from Alzheimer's disease patients. Med. Eng. Phys. 31, 306–313. doi: 10.1016/j.medengphy.2008.06.010
Gramfort, A., Luessi, M., Larson, E., Engemann, D. A., Strohmeier, D., Brodbeck, C., et al. (2014). MNE software for processing MEG and EEG data. Neuroimage 86, 446–460. doi: 10.1016/j.neuroimage.2013.10.027
Gramfort, A., Papadopoulo, T., Olivi, E., and Clerc, M. (2010). OpenMEEG: opensource software for quasistatic bioelectromagnetics. Biomed. Eng. Online 9:45. doi: 10.1186/1475-925X-9-45
Granger, C. W. (1969). Investigating causal relations by econometric models and cross-spectral methods. Econometrica 37, 424–438. doi: 10.2307/1912791
Greicius, M. D., Flores, B. H., Menon, V., Glover, G. H., Solvason, H. B., Kenna, H., et al. (2007). Resting-state functional connectivity in major depression: abnormally increased contributions from subgenual cingulate cortex and thalamus. Biol. Psychiatry 62, 429–437. doi: 10.1016/j.biopsych.2006.09.020
Hall, E. L., Robson, S. E., Morris, P. G., and Brookes, M. J. (2014). The relationship between MEG and fMRI. Neuroimage 102, 80–91. doi: 10.1016/j.neuroimage.2013.11.005
Hall, E. L., Woolrich, M. W., Thomaz, C. E., Morris, P. G., and Brookes, M. J. (2013). Using variance information in magnetoencephalography measures of functional connectivity. Neuroimage 67, 203–212. doi: 10.1016/j.neuroimage.2012.11.011
Hämäläinen, M., Hari, R., Ilmoniemi, R. J., Knuutila, J., and Lounasmaa, O. V. (1993). Magnetoencephalography—theory, instrumentation, and applications to noninvasive studies of the working human brain. Rev. Modern Phys. 65:413. doi: 10.1103/RevModPhys.65.413
Hämäläinen, M. S., and Ilmoniemi, R. J. (1994). Interpreting magnetic fields of the brain: minimum norm estimates. Med. Biological. Eng. Comput. 32, 35–42. doi: 10.1007/BF02512476
Hillebrand, A., and Barnes, G. R. (2005). Beamformer analysis of MEG data. Int. Rev. Neurobiol. 68, 149–171. doi: 10.1016/S0074-7742(05)68006-3
Hillebrand, A., Barnes, G. R., Bosboom, J. L., Berendse, H. W., and Stam, C. J. (2012). Frequency-dependent functional connectivity within resting-state networks: an atlas-based MEG beamformer solution. Neuroimage 59, 3909–3921. doi: 10.1016/j.neuroimage.2011.11.005
Hillebrand, A., Tewarie, P., van Dellen, E., Yu, M., Carbo, E. W., Douw, L., et al. (2016). Direction of information flow in large-scale resting-state networks is frequency-dependent. Proc. Natl. Acad. Sci. U.S.A. 113, 3867–3872. doi: 10.1073/pnas.1515657113
Hincapié, A. S., Kujala, J., Mattout, J., Pascarella, A., Daligault, S., Delpuech, C., et al. (2017). The impact of MEG source reconstruction method on source-space connectivity estimation: a comparison between minimum-norm solution and beamforming. Neuroimage 156, 29–42. doi: 10.1016/j.neuroimage.2017.04.038
Hornero, R., Abasolo, D., Escudero, J., and Gomez, C. (2009). Nonlinear analysis of electroencephalogram and magnetoencephalogram recordings in patients with Alzheimer's disease. Philos. Trans. A Math. Phys. Eng. Sci. 367, 317–336. doi: 10.1098/rsta.2008.0197
Horwitz, B., and Poeppel, D. (2002). How can EEG/MEG and fMRI/PET data be combined? Hum. Brain Mapp. 17, 1–3. doi: 10.1002/hbm.10057
Ishii, R., Canuet, L., Kurimoto, R., Ikezawa, K., Aoki, Y., Azechi, M., et al. (2010). Frontal shift of posterior alpha activity is correlated with cognitive impairment in early Alzheimer's disease: a magnetoencephalography-beamformer study. Psychogeriatrics 10, 138–143. doi: 10.1111/j.1479-8301.2010.00326.x
Ito, K., Sasaki, M., Takahashi, J., Uwano, I., Yamashita, F., Higuchi, S., et al. (2015). Detection of early changes in the parahippocampal and posterior cingulum bundles during mild cognitive impairment by using high-resolution multi-parametric diffusion tensor imaging. Psychiatry Res. Neuroimaging 231, 346–352. doi: 10.1016/j.pscychresns.2015.01.020
Jensen, O., and Vanni, S. (2002). A new method to identify multiple sources of oscillatory activity from magnetoencephalographic data. Neuroimage 15, 568–574. doi: 10.1006/nimg.2001.1020
Josef Golubic, S., Aine, C. J., Stephen, J. M., Adair, J. C., Knoefel, J. E., and Supek, S. (2017). MEG biomarker of Alzheimer's disease: absence of a prefrontal generator during auditory sensory gating. Hum. Brain Mapp. 38, 5180–5194. doi: 10.1002/hbm.23724
Juan-Cruz, C., Gómez, C., Poza, J., Fernández, A., and Hornero, R. (2017). “Assessment of effective connectivity in alzheimer's disease using granger causality,” in Converging Clinical and Engineering Research on Neurorehabilitation, Vol. II, eds J. Ibanez, J. Gonzalez-Vargas, J. M. Azorin, M. Akay, and J. Luis Pons (Segovia: Springer), 763–767.
Kiebel, S. J., Daunizeau, J., Phillips, C., and Friston, K. J. (2008). Variational Bayesian inversion of the equivalent current dipole model in EEG/MEG. Neuroimage 39, 728–741. doi: 10.1016/j.neuroimage.2007.09.005
Kiebel, S. J., Tallon-Baudry, C., and Friston, K. J. (2005). Parametric analysis of oscillatory activity as measured with EEG/MEG. Hum. Brain Mapp. 26, 170–177. doi: 10.1002/hbm.20153
Klimesch, W. (1999). EEG alpha and theta oscillations reflect cognitive and memory performance: a review and analysis. Brain Res. Rev. 29, 169–195. doi: 10.1016/S0165-0173(98)00056-3
Klimesch, W., Doppelmayr, M., Russegger, H., Pachinger, T., and Schwaiger, J. (1998). Induced alpha band power changes in the human EEG and attention. Neurosci. Lett. 244, 73–76. doi: 10.1016/S0304-3940(98)00122-0
Koelewijn, L., Bompas, A., Tales, A., Brookes, M. J., Muthukumaraswamy, S. D., Bayer, A., et al. (2017). Alzheimer's disease disrupts alpha and beta-band resting-state oscillatory network connectivity. Clin. Neurophysiol. 128, 2347–2357. doi: 10.1016/j.clinph.2017.04.018
Kruskal, J. B. (1956). On the shortest spanning subtree of a graph and the traveling salesman problem. Proc. Am. Math. Soc. 7, 48–50. doi: 10.1090/S0002-9939-1956-0078686-7
Kujala, J., Jung, J., Bouvard, S., Lecaignard, F., Lothe, A., Bouet, R., et al. (2015). Gamma oscillations in V1 are correlated with GABA(A) receptor density: A multi-modal MEG and Flumazenil-PET study. Sci. Rep. 5:16347. doi: 10.1038/srep16347
Langevin, F., and Vachey, C. (1995). Imaging of cerebral function: new trends in PET, MEG and MRI. J. Radiol. 76, 45–48.
Leuchter, A. F., Newton, T. F., Cook, I. A., Walter, D. O., Rosenberg-Thompson, S., and Lachenbruch, P. A. (1992). Changes in brain functional connectivity in Alzheimer-type and multi-infarct dementia. Brain 115, 1543–1561. doi: 10.1093/brain/115.5.1543
Liu, Z., Ding, L., and He, B. (2006). Integration of EEG/MEG with MRI and fMRI. IEEE Eng. Med. Biol. Mag. 25, 46–53. doi: 10.1109/MEMB.2006.1657787
López, M. E., Bruna, R., Aurtenetxe, S., Pineda-Pardo, J. Á., Marcos, A., Arrazola, J., et al. (2014a). Alpha-band hypersynchronization in progressive mild cognitive impairment: a magnetoencephalography study. J. Neurosci. 34, 14551–14559. doi: 10.1523/JNEUROSCI.0964-14.2014
López, M. E., Cuesta, P., Garcés, P., Castellanos, P. N., Aurtenetxe, S., Bajo, R., et al. (2014b). MEG spectral analysis in subtypes of mild cognitive impairment. Age 36:9624. doi: 10.1007/s11357-014-9624-5
López, M. E., Engels, M. M. A., van Straaten, E. C. W., Bajo, R., Delgado, M. L., Scheltens, P., et al. (2017a). MEG beamformer-based reconstructions of functional networks in mild cognitive impairment. Front. Aging Neurosci. 9:107. doi: 10.3389/fnagi.2017.00107
López-Sanz, D., Bruña, R., Garcés, P., Camara, C., Serrano, N., Rodríguez-Rojo, I., et al. (2016). Alpha band disruption in the AD-continuum starts in the Subjective Cognitive Decline stage: a MEG study. Sci. Rep. 6:37685. doi: 10.1038/srep37685
López-Sanz, D., Bruña, R., Garcés, P., Martín-Buro, M. C., Walter, S., Delgado, M. L., et al. (2017). Functional connectivity disruption in subjective cognitive decline and mild cognitive impairment: a common pattern of alterations. Front. Aging Neurosci. 9:109. doi: 10.3389/fnagi.2017.00109
Maestú, F., Arrazola, J., Fernández, A., Simos, P. G., Amo, C., Gil-Gregorio, P., et al. (2003). Do cognitive patterns of brain magnetic activity correlate with hippocampal atrophy in Alzheimer's disease? J. Neurol. Neurosurg. Psychiatry 74, 208–212. doi: 10.1136/jnnp.74.2.208
Maestú, F., Campo, P., Del Río, D., Moratti, S., Gil-Gregorio, P., Fernández, A., et al. (2008). Increased biomagnetic activity in the ventral pathway in mild cognitive impairment. Clin. Neurophysiol. 119, 1320–1327. doi: 10.1016/j.clinph.2008.01.105
Maestu, F., Garcia-Segura, J., Ortiz, T., Montoya, J., Fernandez, A., Gil-Gregorio, P., et al. (2005). Evidence of biochemical and biomagnetic interactions in Alzheimer's disease: an MEG and MR spectroscopy study. Dement. Geriatr. Cogn. Disord. 20, 145–152. doi: 10.1159/000087062
Maestú, F., Peña, J.-M., Garcés, P., González, S., Bajo, R., Bagic, A., et al. (2015). A multicenter study of the early detection of synaptic dysfunction in Mild Cognitive Impairment using Magnetoencephalography-derived functional connectivity. Neuroimage Clin. 9, 103–109. doi: 10.1016/j.nicl.2015.07.011
Mandal, P. K., Saharan, S., Tripathi, M., and Murari, G. (2015). Brain glutathione levels – a novel biomarker for Mild Cognitive Impairment and Alzheimer's Disease. Biol. Psychiatry 78, 702–710. doi: 10.1016/j.biopsych.2015.04.005
Maris, E., and Oostenveld, R. (2007). Nonparametric statistical testing of EEG- and MEG-data. J. Neurosci. Methods 164, 177–190. doi: 10.1016/j.jneumeth.2007.03.024
Micanovic, C., and Pal, S. (2014). The diagnostic utility of EEG in early-onset dementia: a systematic review of the literature with narrative analysis. J. Neural Trans. 121, 59–69. doi: 10.1007/s00702-013-1070-5
Montez, T., Poil, S. S., Jones, B. F., Manshanden, I., Verbunt, J. P., van Dijk, B. W., et al. (2009). Altered temporal correlations in parietal alpha and prefrontal theta oscillations in early-stage Alzheimer disease. Proc. Natl. Acad. Sci. U.S.A. 106, 1614–1619. doi: 10.1073/pnas.0811699106
Morris, J. C. (1993). The Clinical Dementia Rating (CDR): current version and scoring rules. Neurology 43, 2412–2414. doi: 10.1212/WNL.43.11.2412-a
Muthukumaraswamy, S. D. (2014). The use of magnetoencephalography in the study of psychopharmacology (pharmaco-MEG). J. Psychopharmacol. 28, 815–829. doi: 10.1177/0269881114536790
Muthuraman, M., Moliadze, V., Mideksa, K. G., Anwar, A. R., Stephani, U., Deuschl, G., et al. (2015). EEG-MEG integration enhances the characterization of functional and effective connectivity in the resting state network. PLoS ONE 10:e0140832. doi: 10.1371/journal.pone.0140832
Nasreddine, Z. S., Phillips, N. A., Bédirian, V., Charbonneau, S., Whitehead, V., Collin, I., et al. (2005). The Montreal Cognitive Assessment, MoCA: a brief screening tool for mild cognitive impairment. J. Am. Geriatr. Soc. 53, 695–699. doi: 10.1111/j.1532-5415.2005.53221.x
NeuroScan, C. (2017). Curry 7 – Signal Processing, Basic & Advanced Source Analysis. VIC: Compumedics Limited.
Ng, A. Y., and Jordan, M. I. (2002). “On discriminative vs. generative classifiers: a comparison of logistic regression and naive bayes,” in Advances in Neural Information Processing Systems (Berkeley, CA: University of California) 841–848.
Oostenveld, R., Fries, P., Maris, E., and Schoffelen, J.-M. (2011). FieldTrip: open source software for advanced analysis of MEG, EEG, and invasive electrophysiological data. Comput. Intell. Neurosci. 2011:156869. doi: 10.1155/2011/156869
Ortiz-Alonso, T., Amo, C., Martin-Llorente, C., Maestu, F., and Fernandez-Lucas, A. (2003). Magnetoencephalographic study in patients with cognitive impairment. Rev. Neurol. 36, 307–310.
Osipova, D., Ahveninen, J., Jensen, O., Ylikoski, A., and Pekkonen, E. (2005). Altered generation of spontaneous oscillations in Alzheimer's disease. Neuroimage 27, 835–841. doi: 10.1016/j.neuroimage.2005.05.011
Osipova, D., Rantanen, K., Ahveninen, J., Ylikoski, R., Häppölä, O., Strandberg, T., et al. (2006). Source estimation of spontaneous MEG oscillations in mild cognitive impairment. Neurosci. Lett. 405, 57–61. doi: 10.1016/j.neulet.2006.06.045
Pereda, E., Quiroga, R. Q., and Bhattacharya, J. (2005). Nonlinear multivariate analysis of neurophysiological signals. Prog. Neurobiol. 77, 1–37. doi: 10.1016/j.pneurobio.2005.10.003
Peyk, P., De Cesarei, A., and Junghöfer, M. (2011). ElectroMagnetoEncephalography software: overview and integration with other EEG/MEG toolboxes. Comput. Intell. Neurosci. 2011:861705. doi: 10.1155/2011/861705
Pineda-Pardo, J. A., Bruña, R., Woolrich, M., Marcos, A., Nobre, A. C., Maestú, F., et al. (2014). Guiding functional connectivity estimation by structural connectivity in MEG: an application to discrimination of conditions of mild cognitive impairment. Neuroimage 101, 765–777. doi: 10.1016/j.neuroimage.2014.08.002
Piotrowski, T., Nikadon, J., and Gutierrez, D. (2017). Reconstruction of brain activity from EEG/MEG using MV-PURE framework. arXiv preprint arXiv:1712.02997.
Poza, J., Gómez, C., García, M., Corralejo, R., Fernández, A., and Hornero, R. (2014). Analysis of neural dynamics in mild cognitive impairment and Alzheimer's disease using wavelet turbulence. J. Neural Eng. 11:026010. doi: 10.1088/1741-2560/11/2/026010
Poza, J., Hornero, R., Abásolo, D., Fernandez, A., and Escudero, J. (2007a). “Analysis of spontaneous MEG activity in patients with Alzheimer's disease using spectral entropies,” in 29th Annual International Conference of the, IEEE Engineering in Medicine and Biology Society, EMBS 2007 (Lyon).
Poza, J., Hornero, R., Abásolo, D., Fernández, A., and García, M. (2007b). Extraction of spectral based measures from MEG background oscillations in Alzheimer's disease. Med. Eng. Phys. Valladolid, 29, 1073–1083. doi: 10.1016/j.medengphy.2006.11.006
Poza, J., Hornero, R., Escudero, J., Fernandez, A., and Gomez, C. (2008a). “Analysis of spontaneous MEG activity in Alzheimer's disease using time-frequency parameters,” in 30th Annual International Conference of the IEEE Engineering in Medicine and Biology Society, EMBS 2008 (Vancouver, BC).
Poza, J., Hornero, R., Escudero, J., Fernández, A., and Sánchez, C. I. (2008b). Regional analysis of spontaneous MEG rhythms in patients with Alzheimer's disease using spectral entropies. Ann. Biomed. Eng. 36, 141–152. doi: 10.1007/s10439-007-9402-y
Prim, R. C. (1957). Shortest connection networks and some generalizations. Bell Labs Tech. J. 36, 1389–1401. doi: 10.1002/j.1538-7305.1957.tb01515.x
Quinlan, J. R. (1993). Constructing decision tree. C4 5, 17–26. doi: 10.1016/B978-0-08-050058-4.50007-3
Raichle, M. E., MacLeod, A. M., Snyder, A. Z., Powers, W. J., Gusnard, D. A., and Shulman, G. L. (2001). A default mode of brain function. Proc. Nat. Acad. Sci. 98, 676–682. doi: 10.1073/pnas.98.2.676
Rajapakse, J. C., and Cichocki, A. (2002). “Independent component analysis and beyond in brain imaging: EEG, MEG, fMRI, and PET,” in Neural Information Processing, (2002). ICONIP'02. Proceedings of the 9th International Conference on: IEEE (Singapore).
Ranasinghe, K. G., Hinkley, L. B., Beagle, A. J., Mizuiri, D., Dowling, A. F., Honma, S. M., et al. (2014). Regional functional connectivity predicts distinct cognitive impairments in Alzheimer's disease spectrum. Neuroimage Clin. 5, 385–395. doi: 10.1016/j.nicl.2014.07.006
Rutter, L., Nadar, S. R., Holroyd, T., Carver, F. W., Apud, J., Weinberger, D. R., et al. (2013). Graph theoretical analysis of resting magnetoencephalographic functional connectivity networks. Front. Comput. Neurosci. 7:93. doi: 10.3389/fncom.2013.00093
Sakkalis, V. (2011). Review of advanced techniques for the estimation of brain connectivity measured with EEG/MEG. Comput. Biol. Med. 41, 1110–1117. doi: 10.1016/j.compbiomed.2011.06.020
Sekihara, K., Nagarajan, S. S., Poeppel, D., Marantz, A., and Miyashita, Y. (2001). Reconstructing spatio-temporal activities of neural sources using an MEG vector beamformer technique. IEEE Trans. Biomed. Eng. 48, 760–771. doi: 10.1109/10.930901
Sharon, D., Hämäläinen, M. S., Tootell, R. B., Halgren, E., and Belliveau, J. W. (2007). The advantage of combining MEG and EEG: comparison to fMRI in focally stimulated visual cortex. Neuroimage 36, 1225–1235. doi: 10.1016/j.neuroimage.2007.03.066
Silva Pereira, S., Hindriks, R., Mühlberg, S., Maris, E., van Ede, F., Griffa, A., et al. (2017). Effect of field spread on resting-state magneto encephalography functional network analysis: a computational modeling study. Brain Connect. 7, 541–557. doi: 10.1089/brain.2017.0525
Solomon, P. R., and Pendlebury, W. W. (1998). Recognition of Alzheimer's disease: the 7 Minute Screen. Fam. Med. 30, 265–271.
Song, X., Clarke, M., Bardouille, T., Darvesh, S., Fisk, J., Beyea, S., et al. (2014). Changes in prefrontal activation in early Alzheimer's Disease: a magnetoencephalography (Meg) study. Alzheimer's Dement. 10, P403–P404. doi: 10.1016/j.jalz.2014.05.501
Stam, C. J. (2004). Functional connectivity patterns of human magnetoencephalographic recordings: a ‘small-world’network? Neurosci. Lett. 355, 25–28. doi: 10.1016/j.neulet.2003.10.063
Stam, C. J. (2005). Nonlinear dynamical analysis of EEG and MEG: review of an emerging field. Clin. Neurophysiol. 116, 2266–2301. doi: 10.1016/j.clinph.2005.06.011
Stam, C. J., de Haan, W., Daffertshofer, A., Jones, B. F., Manshanden, I., van Cappellen van Walsum, A. M., et al. (2009). Graph theoretical analysis of magnetoencephalographic functional connectivity in Alzheimer's disease. Brain 132, 213–224. doi: 10.1093/brain/awn262
Stam, C. J., Jones, B. F., Manshanden, I., van Cappellen van Walsum, A. M., Montez, T., Verbunt, J. P., et al. (2006). Magnetoencephalographic evaluation of resting-state functional connectivity in Alzheimer's disease. Neuroimage 32, 1335–1344. doi: 10.1016/j.neuroimage.2006.05.033
Stam, C. J., van Walsum, A. M. C., Pijnenburg, Y. A., Berendse, H. W., de Munck, J. C., Scheltens, P., et al. (2002). Generalized synchronization of MEG recordings in Alzheimer's disease: evidence for involvement of the gamma band. J. Clin. Neurophysiol. 19, 562–574.
Suykens, J. A., and Vandewalle, J. (1999). Least squares support vector machine classifiers. Neural Process. Lett. 9, 293–300. doi: 10.1023/A:1018628609742
Tadel, F., Baillet, S., Mosher, J. C., Pantazis, D., and Leahy, R. M. (2011). Brainstorm: a user-friendly application for MEG/EEG analysis. Comput. Intell. Neurosci. 2011:879716. doi: 10.1155/2011/879716
Tallon-Baudry, C., and Bertrand, O. (1999). Oscillatory gamma activity in humans and its role in object representation. Trends Cogn. Sci. 3, 151–162. doi: 10.1016/S1364-6613(99)01299-1
Tewarie, P., Hillebrand, A., van Dijk, B. W., Stam, C. J., O'Neill, G. C., Van Mieghem, P., et al. (2016). Integrating cross-frequency and within band functional networks in resting-state MEG: a multi-layer network approach. Neuroimage 142, 324–336. doi: 10.1016/j.neuroimage.2016.07.057
Tewarie, P., van Dellen, E., Hillebrand, A., and Stam, C. J. (2015). The minimum spanning tree: an unbiased method for brain network analysis. Neuroimage 104, 177–188. doi: 10.1016/j.neuroimage.2014.10.015
Towle, V. L., Bolaños, J., Suarez, D., Tan, K., Grzeszczuk, R., Levin, D. N., et al. (1993). The spatial location of EEG electrodes: locating the best-fitting sphere relative to cortical anatomy. Electroencephalogr. Clin. Neurophysiol. 86, 1–6. doi: 10.1016/0013-4694(93)90061-Y
Unger, M., Marschallinger, J., Kaindl, J., Höfling, C., Rossner, S., Heneka, M. T., et al. (2016). Early changes in hippocampal neurogenesis in transgenic mouse models for Alzheimer's Disease. Mol. Neurobiol. 53, 5796–5806. doi: 10.1007/s12035-016-0018-9
Uutela, K., Hämäläinen, M., and Somersalo, E. (1999). Visualization of magnetoencephalographic data using minimum current estimates. NeuroImage 10, 173–180. doi: 10.1006/nimg.1999.0454
van Walsum, A.-M. v. C., Pijnenburg, Y., Berendse, H., van Dijk, B., Knol, D., Scheltens, P., et al. (2003). A neural complexity measure applied to MEG data in Alzheimer's disease. Clin. Neurophysiol. 114, 1034–1040. doi: 10.1016/S1388-2457(03)00072-5
van Wijk, B. C. M., Stam, C. J., and Daffertshofer, A. (2010). Comparing brain networks of different size and connectivity density using graph theory. PLOS ONE 5:e13701. doi: 10.1371/journal.pone.0013701
Velmurugan, J., Sinha, S., and Satishchandra, P. (2014). Magnetoencephalography recording and analysis. Ann. Indian Acad. Neurol. 17, S113–119. doi: 10.4103/0972-2327.128678
Verdoorn, T. A., McCarten, J. R., Arciniegas, D. B., Golden, R., Moldauer, L., Georgopoulos, A., et al. (2011). Evaluation and tracking of Alzheimer's disease severity using resting-state magnetoencephalography. J. Alzheimers Dis. 26 Suppl. 3, 239–255. doi: 10.3233/JAD-2011-0056
Walla, P., Püregger, E., Lehrner, J., Mayer, D., Deecke, L., and Dal Bianco, P. (2005). Depth of word processing in Alzheimer patients and normal controls: a magnetoencephalographic (MEG) study. J. Neural Transm. 112, 713–730. doi: 10.1007/s00702-004-0215-y
Wang, K., Liang, M., Wang, L., Tian, L., Zhang, X., Li, K., et al. (2007). Altered functional connectivity in early Alzheimer's disease: a resting-state fMRI study. Hum. Brain Mapp. 28, 967–978. doi: 10.1002/hbm.20324
Watts, D. J., and Strogatz, S. H. (1998). Collective dynamics of ‘small-world’networks. Nature 393, 440–442.
Wortmann, M. (2012). Dementia: a global health priority-highlights from an ADI and World Health Organization report. Alzheimers Res. Ther. 4:40. doi: 10.1186/alzrt143
Yu, M., Engels, M. M. A., Hillebrand, A., van Straaten, E. C. W., Gouw, A. A., Teunissen, C., et al. (2017). Selective impairment of hippocampus and posterior hub areas in Alzheimer's disease: an MEG-based multiplex network study. Brain 140, 1466–1485. doi: 10.1093/brain/awx050
Keywords: magnetoencephalography, mild cognitive impairment, Alzheimer's disease, functional connectivity, effective connectivity, network analysis, machine learning, multimodal imaging
Citation: Mandal PK, Banerjee A, Tripathi M and Sharma A (2018) A Comprehensive Review of Magnetoencephalography (MEG) Studies for Brain Functionality in Healthy Aging and Alzheimer's Disease (AD). Front. Comput. Neurosci. 12:60. doi: 10.3389/fncom.2018.00060
Received: 17 March 2018; Accepted: 09 July 2018;
Published: 23 August 2018.
Edited by:
Anke Meyer-Baese, Florida State University, United StatesReviewed by:
Stavros I. Dimitriadis, Cardiff University, United KingdomSeppo P. Ahlfors, Harvard Medical School, United States
Copyright © 2018 Mandal, Banerjee, Tripathi and Sharma. This is an open-access article distributed under the terms of the Creative Commons Attribution License (CC BY). The use, distribution or reproduction in other forums is permitted, provided the original author(s) and the copyright owner(s) are credited and that the original publication in this journal is cited, in accordance with accepted academic practice. No use, distribution or reproduction is permitted which does not comply with these terms.
*Correspondence: Pravat K. Mandal, pravat.mandal@gmail.com; pravat@nbrc.ac.in; pravat.mandal@florey.edu.au